Article

Molecular Probes to Evaluate the Synthesis and Production Potential of an Odorous Compound (2-methylisoborneol) in Cyanobacteria

1
Human and Eco-Care Center, Department of Environmental Health Science, Konkuk University, Seoul 05029, Korea
2
Department of Environmental Health Science, Konkuk University, Seoul 05029, Korea
3
Hangang River Regional Division, Department of Water Resources Management, K-Water, Gwacheon 13841, Korea
*
Author to whom correspondence should be addressed.
Int. J. Environ. Res. Public Health 2020, 17(6), 1933; https://doi.org/10.3390/ijerph17061933
Submission received: 30 January 2020 / Revised: 9 March 2020 / Accepted: 14 March 2020 / Published: 16 March 2020
(This article belongs to the Special Issue Eutrophication and the Ecological Health Risk)

Abstract

:
The volatile metabolite, 2-Methylisoborneol (2-MIB) produced by cyanobacterial species, causes odor and taste problems in freshwater systems. However, simple identification of cyanobacteria that produce such off-flavors may be insufficient to establish the causal agent of off-flavor-related problems as the production-related genes are often strain-specific. Here, we designed a set of primers for detecting and quantifying 2-MIB-synthesizing cyanobacteria based on mibC gene sequences (encoding 2-MIB synthesis-catalyzing monoterpene cyclase) from various Oscillatoriales and Synechococcales cyanobacterial strains deposited in GenBank. Cyanobacterial cells and environmental DNA and RNA were collected from both the water column and sediment of a eutrophic stream (the Gong-ji Stream, Chuncheon, South Korea), which has a high 2-MIB concentration. Primer sets mibC196 and mibC300 showed universality to mibC in the Synechococcales and Oscillatoriales strains; the mibC132 primer showed high specificity for Pseudanabaena and Planktothricoides mibC. Our mibC primers showed excellent amplification efficiency (100–102%) and high correlation among related variables (2-MIB concentration with water RNA r = 689, p < 0.01; sediment DNA r = 0.794, p < 0.01; and water DNA r = 0.644, p < 0.05; cyanobacteria cell density with water RNA and DNA r = 0.995, p < 0.01). These primers offer an efficient tool for identifying cyanobacterial strains possessing mibC genes (and thus 2-MIB-producing potential) and for evaluating mibC gene expression as an early warning of massive cyanobacterial occurrence.

1. Introduction

Naturally occurring 2-methylisoborneol (2-MIB) and geosmin produced by cyanobacteria and actinomyces are regarded as a worldwide problem in freshwater systems because of their muddy or earthy odorous properties [1,2]. Contamination of drinking water resources is of particular concern, motivating intensive studies to identify new methods for efficiently detecting and removing these compounds [1,3,4].
Cyanobacteria are now recognized as the major producer of the unpleasant odorous 2-MIB; thus, the odor is more severe during cyanobacterial blooms. Prior studies indicated that blooms of cyanobacteria coincided with the occurrence of odor substances in various freshwater systems [5,6], including Huajiang Lake in Mongol, where the maximum concentration of 2-MIB reached 102 ng/L during cyanobacterial blooms [7]. The major cyanobacterial genus in the North Han River in Korea has shifted from Anabaena to Pseudanabaena since 2013, accompanied by an increase in the occurrence and concentration of 2-MIB with the maximum concentration of 74.5 ng/L recorded in 2014 [8,9]. However, a direct causal relationship between the blooms of cyanobacteria as a whole and the generation of odor substances is unclear because the cyanobacterial community in freshwater systems is composed of a wide variety of species related to odor production, making it difficult to specify which species are responsible for the production of the odor-causing compounds [10,11].
There has been increasing research in the development of methods related to 2-MIB detection in recent decades as this odorous compound has become increasingly problematic for drinking water resources [12]. Various research groups have proposed diverse approaches for detecting odorous compounds. In particular, because even rarely occurring species of cyanobacteria in certain freshwater systems can produce odorous substances, it is necessary to apply highly sensitive and specific methods. Molecular biological approaches such as polymerase chain reaction (PCR), are very relevant in this regard [13,14]. The biochemical mechanisms and genes involved in 2-MIB synthesis in various cyanobacteria genera, including Pseudanabaena, Planktothricoides, Lyngbya, and Oscillatoria (Limnothrix), have been revealed; therefore, cyanobacterial strains capable of synthesizing 2-MIB can now be detected by PCR analysis using sequence-specific primers for the mibC gene encoding a monoterpene cyclase, which is the main enzyme involved in 2-MIB synthesis [12,15,16,17,18]. Using a PCR approach, the odor compound-producing potential in an Australian eutrophic reservoir was found to be positively correlated with the concentrations of geosmin compounds but not to the cell density of cyanobacteria known to produce the odor compounds [19].
To facilitate more selective and specific detection of cyanobacteria possessing the mibC gene, in this study, we constructed diverse sets of primers targeting mibC among species of Synechococcales and Oscillatoriales and investigated the 2-MIB production capability in 14 different cyanobacterial strains using these primer sets. To improve the specificity and efficiency of the primers, various annealing temperatures were tested in PCR amplification, and detectability of 2-MIB was assessed through application of the target gene to field samples.

2. Materials and Methods

2.1. Preparation of Cyanobacterial Strains and Field Samples

The cyanobacterial strains used in this study were Pseudanabaena galeata (NIES-512), Anabaena smithii (NIES-824), and Anabaena cylindrica (NIES-19) obtained from the National Institute of Environment Science (NIES, Japan), and Anabaena variabilis (AG10064) obtained from the Korea Collection for Type Cultures (KTCC). The other strains, including Microcystis aeruginosa, Dolichospermum circinale straight type (ST), D. circinale coiled type (CT), Planktothricoides raciborskii strain NO, P. raciborskii strain PO, Pseudanabaena mucicola, Oscillatoria redekei (Limnothrix redekei), Lyngbya murrayi, Phormidium ambiguum, and Leptolyngbya boryana, were isolated from the North Han River and identified based on DNA sequence in previous studies [8,20,21]. All cyanobacterial strains were inoculated in BG-11 medium [22] and cultured in a shaking incubator (VS-3125Qi, Vison, Korea) at 25 °C and a light intensity of 60 μmolE·m−2·s−1 (light:dark = 14:10 h). The cyanobacterial strains were grown for over three months and the medium was replaced every month. During medium changes, the dead cells that settled at the bottom of the flask and paled into yellow-green color were removed along with the medium.
Field samples were obtained from a site with extensive production of 2-MIB by cyanobacteria that coincided with a cyanobacterial bloom between 2015 and February 2016 [8]. The cyanobacterial community in both the water column and sediment was collected downstream of the Gong-ji Stream (Supplementary Figure S1) (N 37°52′33.4″, E 127°42′23.1″) using a Vandorn sampler (Horizontal water sampler, iStech, Korea) and grab sampler (Peterson grab, QT Technology, Korea), respectively, monthly from February 2015 to February 2016. The sampling site constitutes the region where the Gong-ji Stream merges with the Uiam reservoir, a large reservoir located in the mainstream of the North Han River. The surface water sample and the sediment sample were transferred to a 1 L clear PET bottle and 100 mL dark bottle, respectively. The field samples were stored at 4 °C in the dark before pretreatment. Sample pretreatment was performed within 12 h. The water sample was filtered using a polycarbonate filter paper (ø25 mm, pore: 1 μm, Whatman, USA) and placed in a 2-mL microtube before DNA extraction. The sediment sample (0.8 g) was transferred to a silica bead tube. Both the polycarbonate filter-filtered water sample and the sediment sample within the silica bead tube were stored at −80 °C until analysis.

2.2. Genomic DNA and RNA Extraction

For genomic DNA extraction, cyanobacterial strains (P. galeata, P. mucicola, O. redekei [L. redekei], and P. raciborskii NO) attached to the bottom of flasks were collected using a scraper, whereas the other strains (M. aeruginosa, D. circinale ST, D. circinale CT, A. variabilis, A. smithii, A. cylindrica, L. murrayi, P. ambiguum, L. boryana, and P. raciborskii strain PO) were harvested by filtration of 10 mL of culture using a polycarbonate filter (ø25 mm, pore: 1 μm, Whatman, USA). The genomic DNA of the algal strain was extracted using a DNA extraction kit for soil (Macherey-Nagal, Germany) according to the manufacturer’s instructions, after cell lysis via the physical bead beating method [23]. Both water column and sediment samples were extracted DNA using the same method as for algal strain DNA extraction.
The environmental RNA collected from the water column of the Gong-ji Stream was extracted with Trizol using an RNA purification kit (Hybrid-RTM RNA purification kit, Geneall Co., Korea), according to the manufacturer’s instructions, after cell lysis using the Trizol-based Riboex solution.
The concentration of the DNA and RNA was determined using a Nanodrop system (Thermo Fisher Scientific, USA).

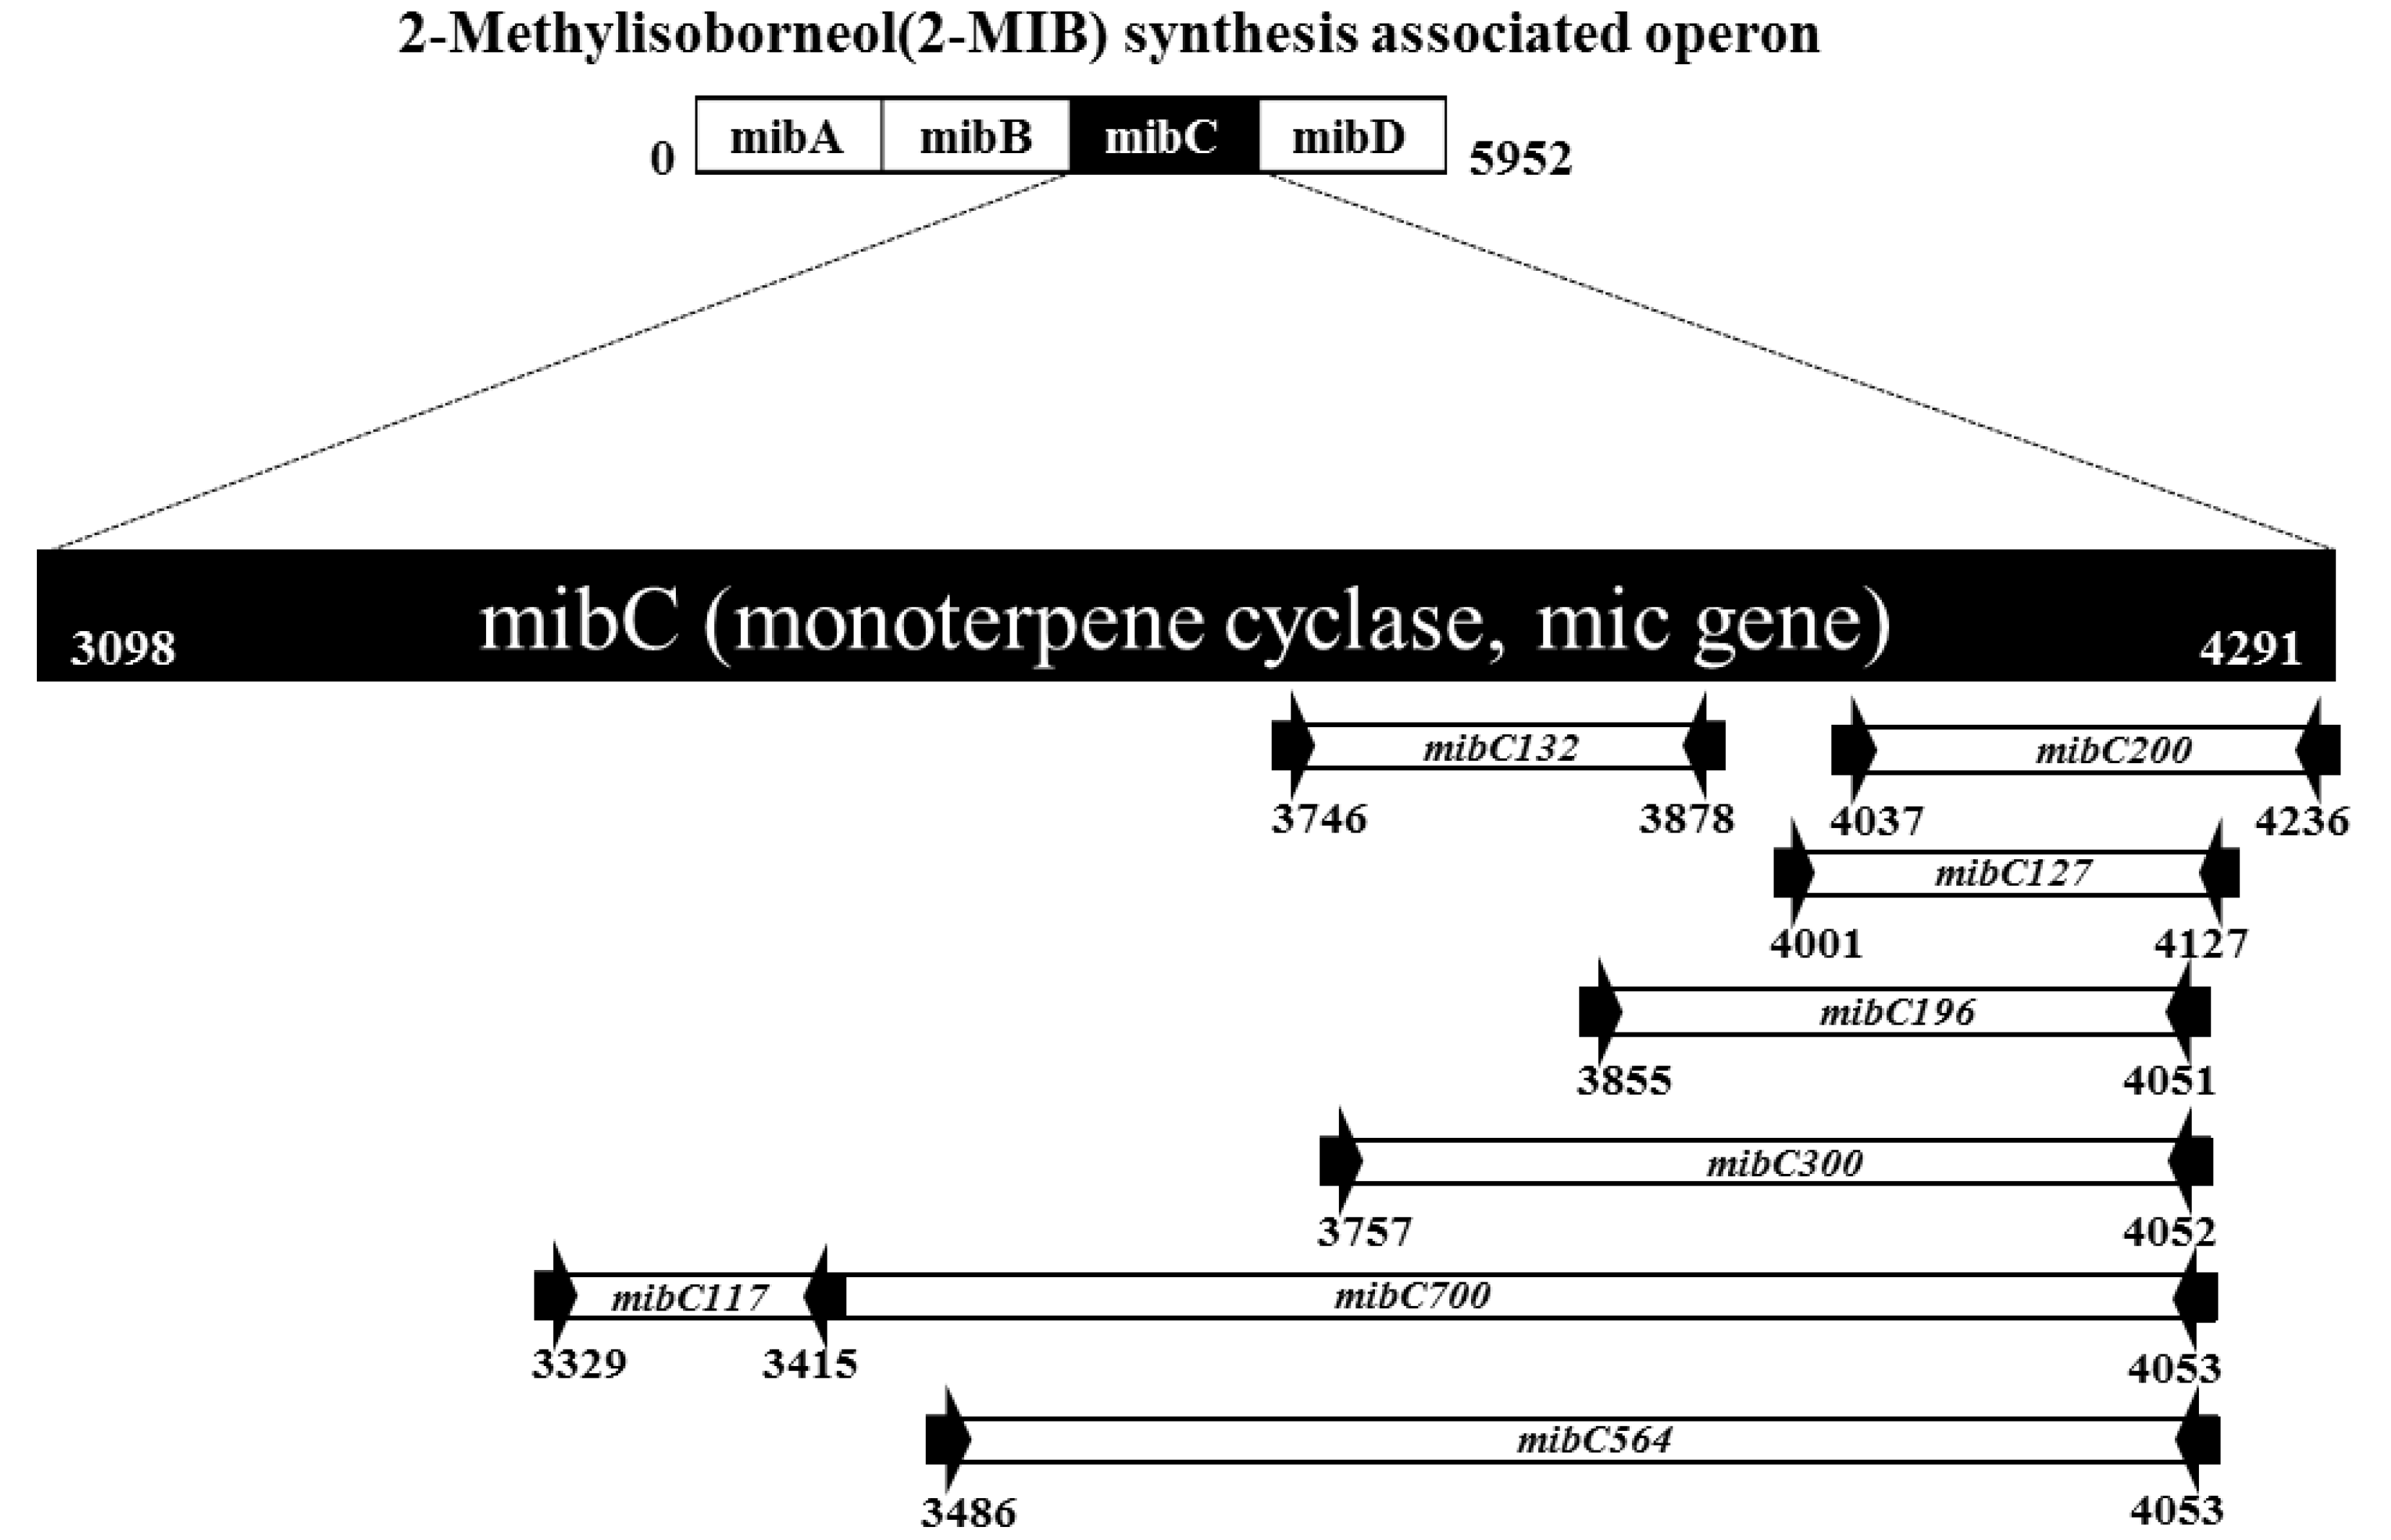
2.3. Sequence Analysis of mibC Genes and Primer Design

The monoterpene cyclase gene mibC was chosen as a target for evaluation of 2-MIB production potential given its essential enzymatic role in 2-MIB synthesis (Figure 1) [18]. To specifically detect mibC in a wide variety of cyanobacterial strains, sequences from diverse bacteria, including Pseudanabaena sp. NIVA-CYA 111 (HQ630887), Pseudanabaena sp. dph 15 (HQ830028), Pseudanabaena galeata (AB826230.1), Pseudanabaena limnetica isolated from Castaic Lake (HQ630883), Oscillatoria sp. 327/2 (KJ658377), Oscillatoria limosa (AB826230.1), Planktothricoides sp. 328.2 (KJ658378), Planktothricoides raciborskii CHAB3331(339892252), Leptolyngbya sp. A2 (KP013063.1), and Leptolyngbya sp. (KM013398.1), were obtained from the National Center for Biotechnology Information (NCBI) GenBank database and analyzed using the Clustal W algorithm of MEGA 6.0 [24,25]. Nucleotide sequences were integrated based on mibC gene sequence alignment using the MEGA program. Differences in nucleotides between mibC sequences were integrated by the mixed base. We excluded mixed bases with three to four nucleotides to avoid obtaining an unintended PCR product. The mibC primer sequence, which was based on the integrated nucleotide sequences, was designed by the PrimerQuest Tool program (IDT Co., USA) [26]. The melting temperature of each primer was calculated by the PrimerQuest Tool program; then, the annealing temperature in PCR amplification was adjusted by ±5 °C with reference to the calculated melting temperature. The conserved regions identified from sequence alignment were selected, and 20–26-mer primer sets were designed to produce 132–719 bp amplicons. The primers were used for qualitative screening and quantitative analysis based on the length of the amplicons. Primers such as mibC117, mibC127, and mibC132 producing PCR products shorter than 150 bp were used for real-time PCR, and the mibC300, mibC564, and mibC719 primers were used for screening. mibC196 and mibC200 primers producing amplicons with a length of 150–200 bp were used for both screening and real-time PCR.

2.4. Detection of mibC and Field Application

To verify the capability of the designed primers for mibC detection, PCR was performed using genomic DNA extracted from 10 cyanobacterial strains as templates. P. galeata NIES-512, which is known to produce 2-MIB [27,28], was used as a positive control strain, and M. aeruginosa, D. circinale ST, D. circinale CT, A. variabilis, A. smithii, A. cylindrica, and P. raciborskii strain NO, which were confirmed not to produce 2-MIB by gas-chromatography analysis [8,21,29,30,31], were used as negative controls. Strains L. redekei, L. murrayi, P. ambiguum, P. mucicola, P. raciborskii strain PO, and L. boryana isolated from the North Han River watershed were the test strains for determining the potential to produce 2-MIB. To achieve the specific detection of mibC, the experimental conditions for PCR were optimized by testing different annealing temperatures for each primer set. In brief, 35 cycles of PCR amplification were performed with 25 s of denaturation at 95 °C, 50 s of annealing at diverse temperatures (58 °C–64 °C), and 50 s of extension at 72 °C. The PCR products were analyzed by agarose electrophoresis and the amplicons were confirmed based on the molecular size of the DNA bands. For the field application, the environmental DNA and RNA of the cyanobacterial community extracted from the water column and sediment of the estuary of Gong-ji Stream were used as the template for PCR and analyzed by agarose gel electrophoresis. The electrophoresis results were photographed (350D, Canon Co., Japan) for analysis. The target band obtained on electrophoresis was used for nucleotide sequence analysis after agarose gel cutting. The bands of the agarose gel were cut by a surgical scalpel after approximating each size (ca. 5 mm × 3 mm) by a ruler. From the middle of agarose gel band, about 2 mm of band edge was removed. The PCR product was extracted from the band cut using a gel & PCR purification system (HiGeneTM, GP104-200, Biofact Co., Korea).
In addition, real-time PCR was performed using the 2× Real-Time PCR Master Mix: including SFCgreen®I in mixture (DQ362-40h, Biofact Co. Korea) in a real-time PCR cycler (Rotorgene, Qiagen Co., Germany) to verify the applicability of the designed primers as mibC gene detection probes for quantifying RNA expression and the DNA copy number distribution. Each template of DNA and RNA was mixed with polymerase mixture for the real-time PCR analysis. The mixture was blended with all necessary materials, including 2× polymerase master mix (SFCgreen-intercalate type) 10 μL, forward primer (10 pmole/μL) 1 μL, reverse primer (10 pmole/μL) 1 μL, template 5 μL, and nuclease free water 3 μL. Real-time PCR was performed at 94 °C for 15 min, followed by 35 cycles of 15 s of denaturation at 95 °C, 25 s of annealing at the respective melting temperature (Table 1), and 30 s of extension at 72 °C. The SFCgreen fluorescence value was obtained in each cycle of the extension step. The copy number of the mibC gene was calculated using Equation (1), which was modified from an equation for calculating the copy number of genes (Ncn) in environmental samples using real-time PCR external standard data [32]:
N c n = C T × A N S A × M W b p × 10 6
where CT is the copy number of the target gene in the DNA sample (copy/μg) estimated using an external standard; AN and MWbp are Avogadro’s number and the average molecular weight of a base pair, respectively [33]; and SA is the genome size (bp) of Pseudanabaena.
Correlative relationships were analyzed among mibC copy number, cyanobacterial cell density, and concentration of 2-MIB using a statistical program (PASW Statics 18, USA). The 2-MIB concentration was measured according to standard methods for drinking water surveillance [34].

2.5. Sequence Analysis of mibC

The single amplicons obtained from PCR were sequenced using an ABI 373 0XL DNA analyzer (Perkin Elmer, USA). A single DNA band was purified using a PCR product purification kit (Bioneer, Korea) and amplified using ABI BigDye Terminator v3.1 Cycle-Sequencing Kit for DNA sequencing. The DNA sequences were further analyzed using the BLAST program provided by the NCBI GenBank database.

2.6. Phylogenetic Analysis

The DNA sequence of the mibC gene amplified from the field samples was aligned with the reported sequences of mibC genes from diverse strains used for sequence alignment with Clustal W, as described above. Phylogenetic analysis of the aligned sequences was performed using the maximum-likelihood method in MEGA 6.0 software [24] to construct a phylogenetic tree. The stability of the phylogenetic tree was evaluated by bootstrap analysis with 1000 replicates [35].

3. Results

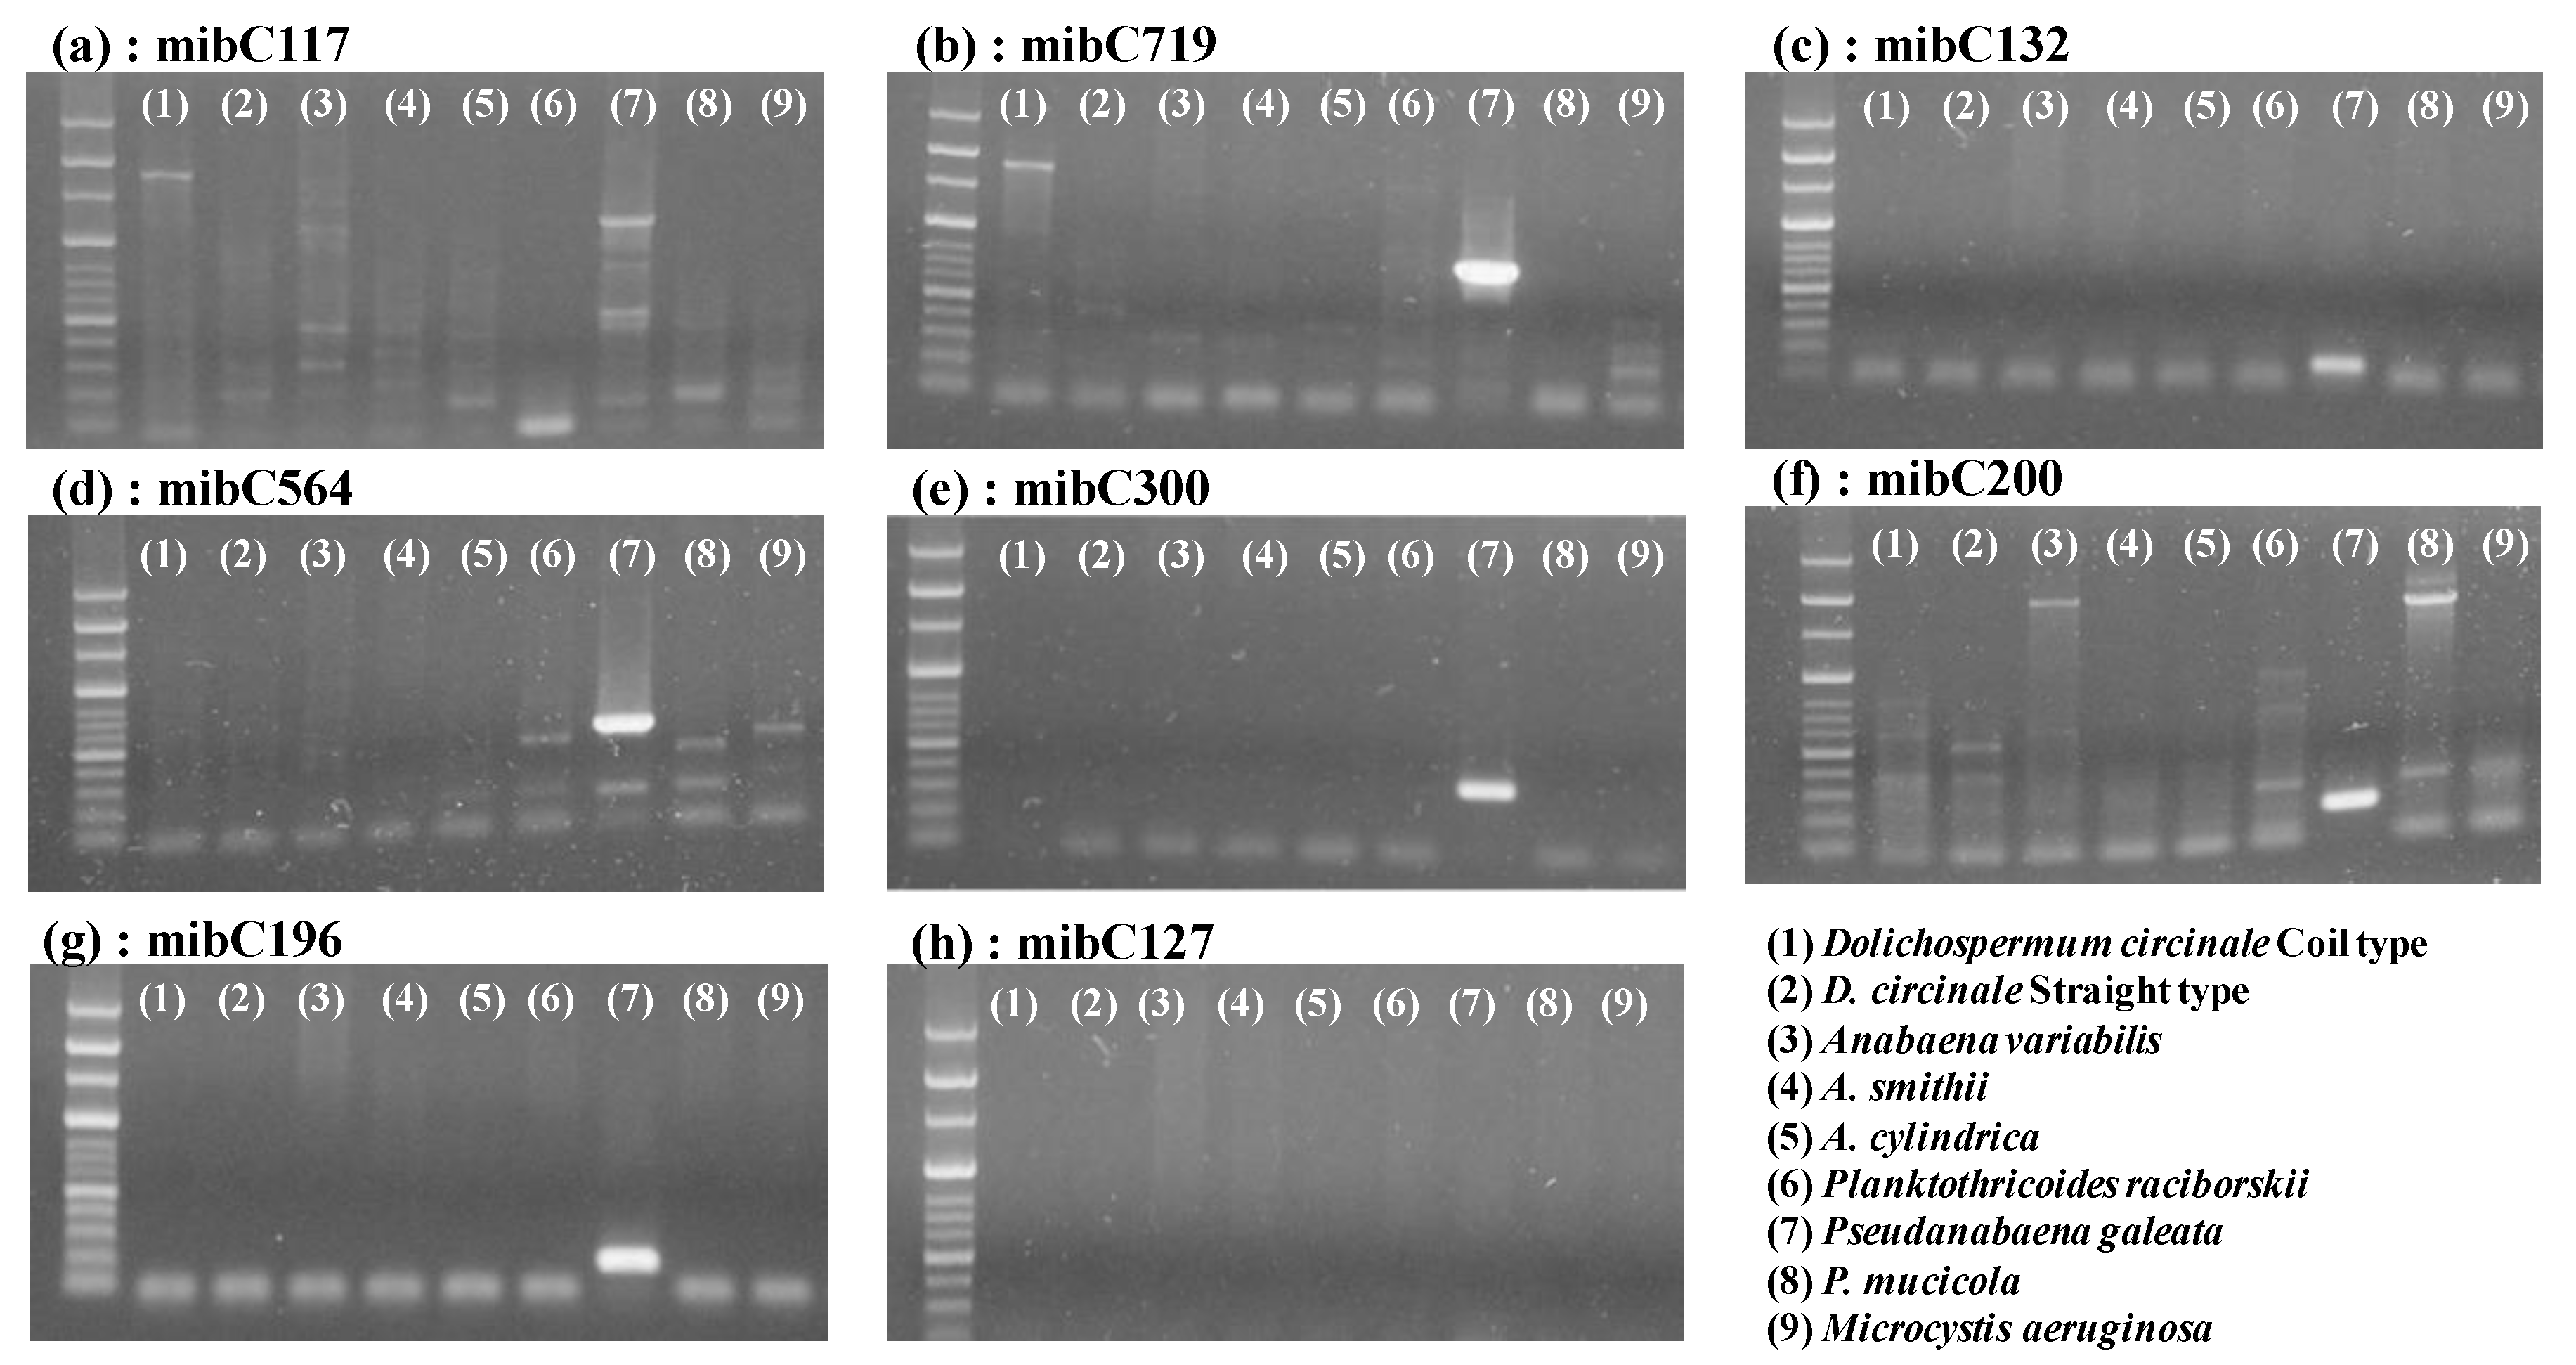
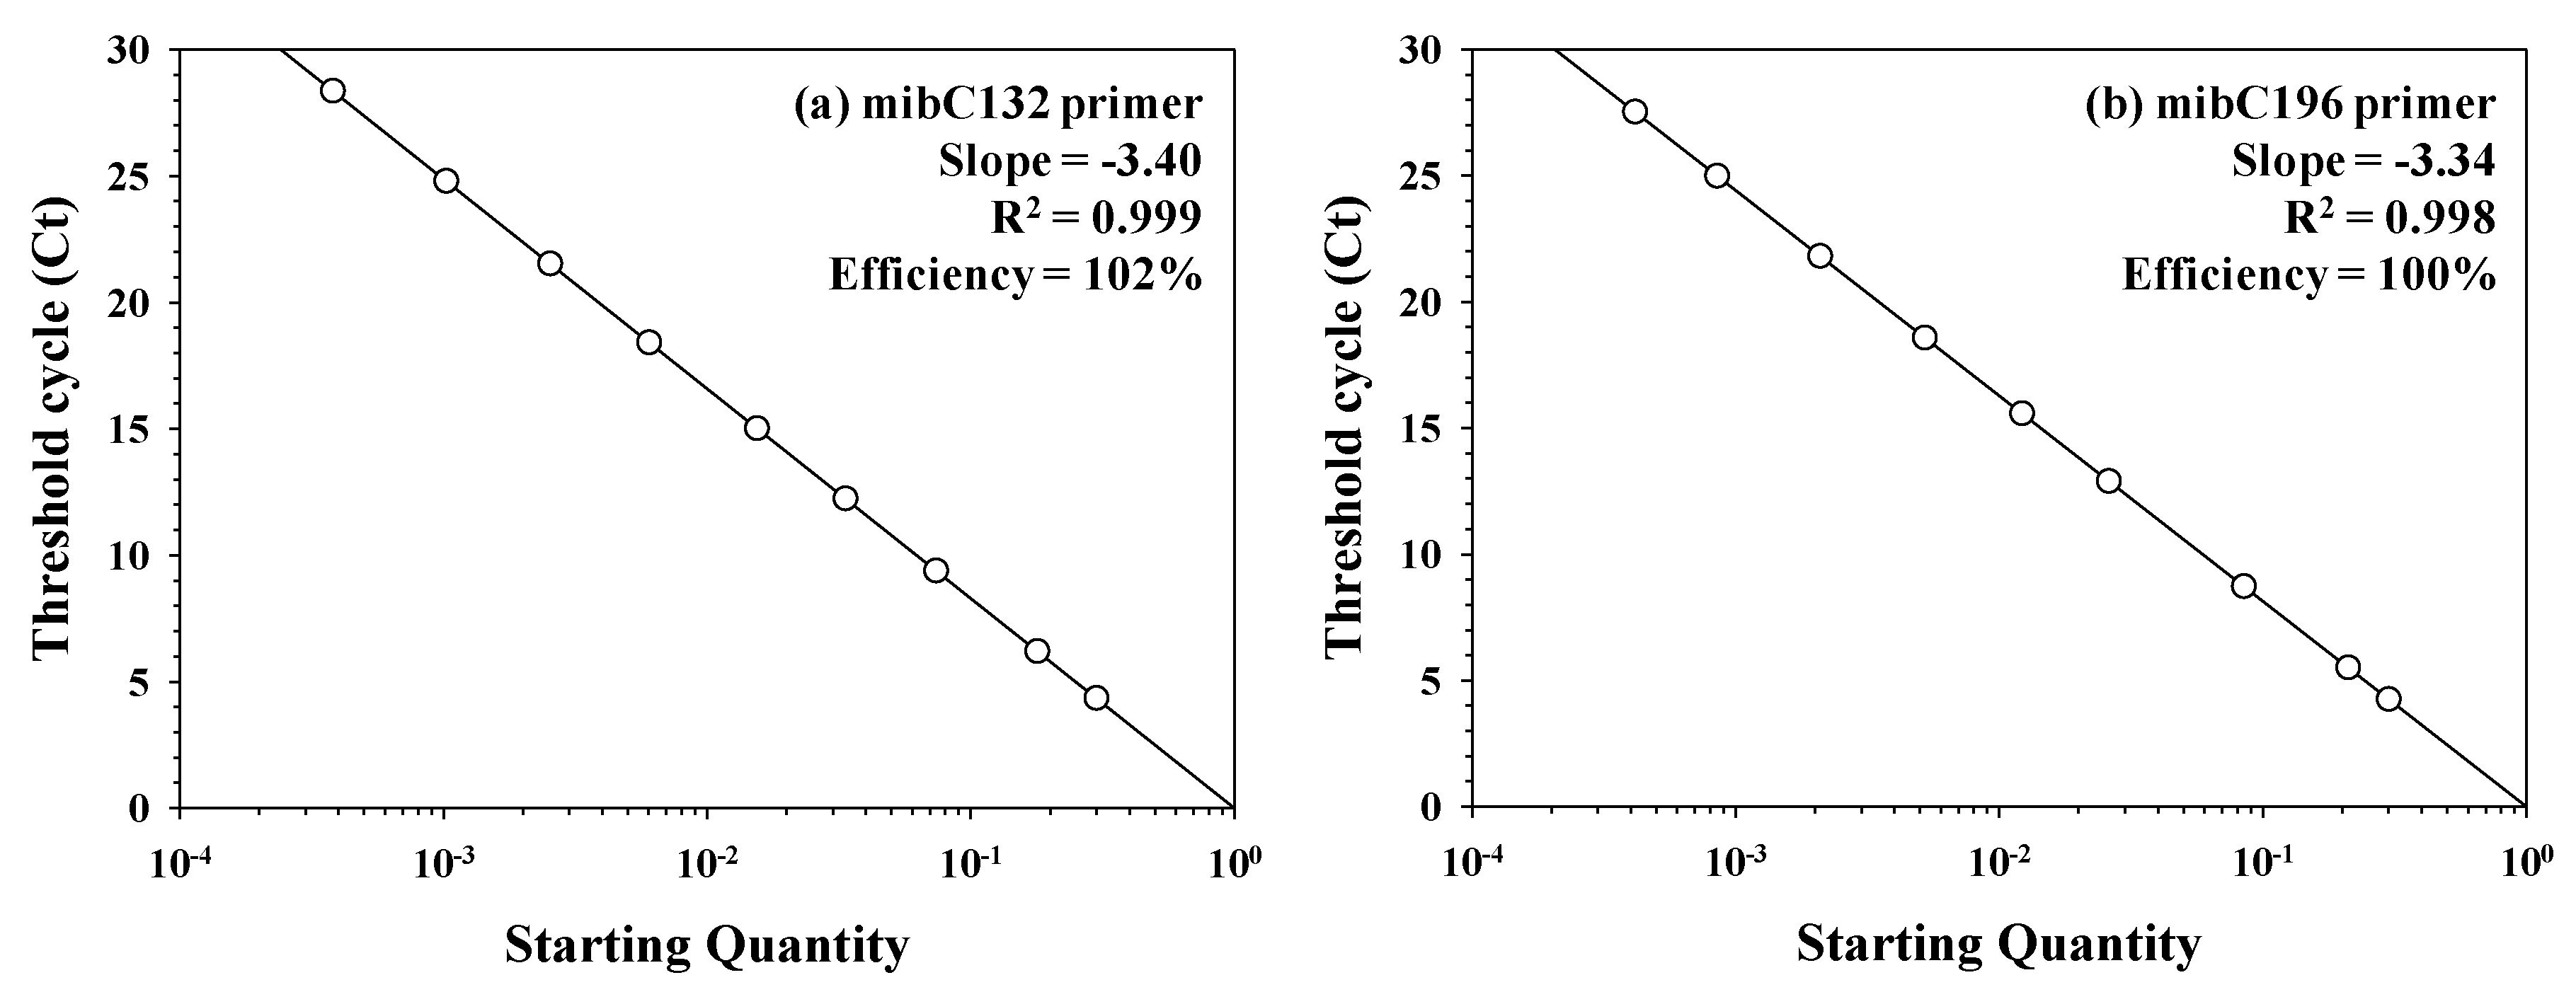
3.1. Applicability of the Designed Primers

To detect the 2-MIB-synthesizing gene mibC in cyanobacteria, eight sets of primers were constructed based on the sequence alignment of mibC genes from diverse cyanobacteria (Table 1). The average guanine-cytosine (G-C) content of each primer was 52%, ranging from 40% to 60%. The melting point of each primer ranged from 60 °C to 64 °C, and the average calculated dissociation temperature of the forward and reverse primers was used as the annealing temperature for PCR. We verified the target amplicons and non-specific amplicons from the general PCR in nine cyanobacteria control strains with the eight sets of primers. As shown in Figure 2, seven sets of primers (i.e., all primers except for mibC127) showed the expected sizes of amplicons for P. galeata NIES-512 genomic DNA. In particular, mibC132, mibC196, and mibC300 showed only the expected target amplicons from the positive control, P. galeata NIES-512, whereas the others showed non-specific amplicons from both the positive and negative controls (Figure 2). These non-specific amplicons were not eliminated with various annealing temperatures of 58 °C‒64 °C. Only three primers, mibC132, mibC196, and mibC300, provided amplicons of the expected size without any additional amplicon when using both the positive and negative controls (Supplementary Figure S2). Based on these results, the mibC132, mibC196, and mibC300 primers were applied to the environmental DNA samples collected from the sediment of the test stream (Gong-ji Stream). The experimental conditions for the PCR were the same as those employed in the previous test, resulting in clear, single, expected amplicons from both winter season (January and February) samples (Supplementary Figure S3). This result confirmed that the primer sets designed in this study are capable of detecting genes related to 2-MIB synthesis without the production of any other non-specific PCR amplicon. In addition, amplicons of the expected size were synthesized using the mibC primers in five cyanobacterial strains isolated from the North Han River watershed without the production of any non-specific amplicon (Figure 3). In P. mucicola, none of the designed mibC primers amplified any amplicon (Figure 3). The mibC196 and mibC300 primers amplified the mibC gene in all five strains classified into Oscillatoriales and Synechococcales. However, the mibC132 primer only amplified the mibC gene from P. raciborskii (Figure 3c).

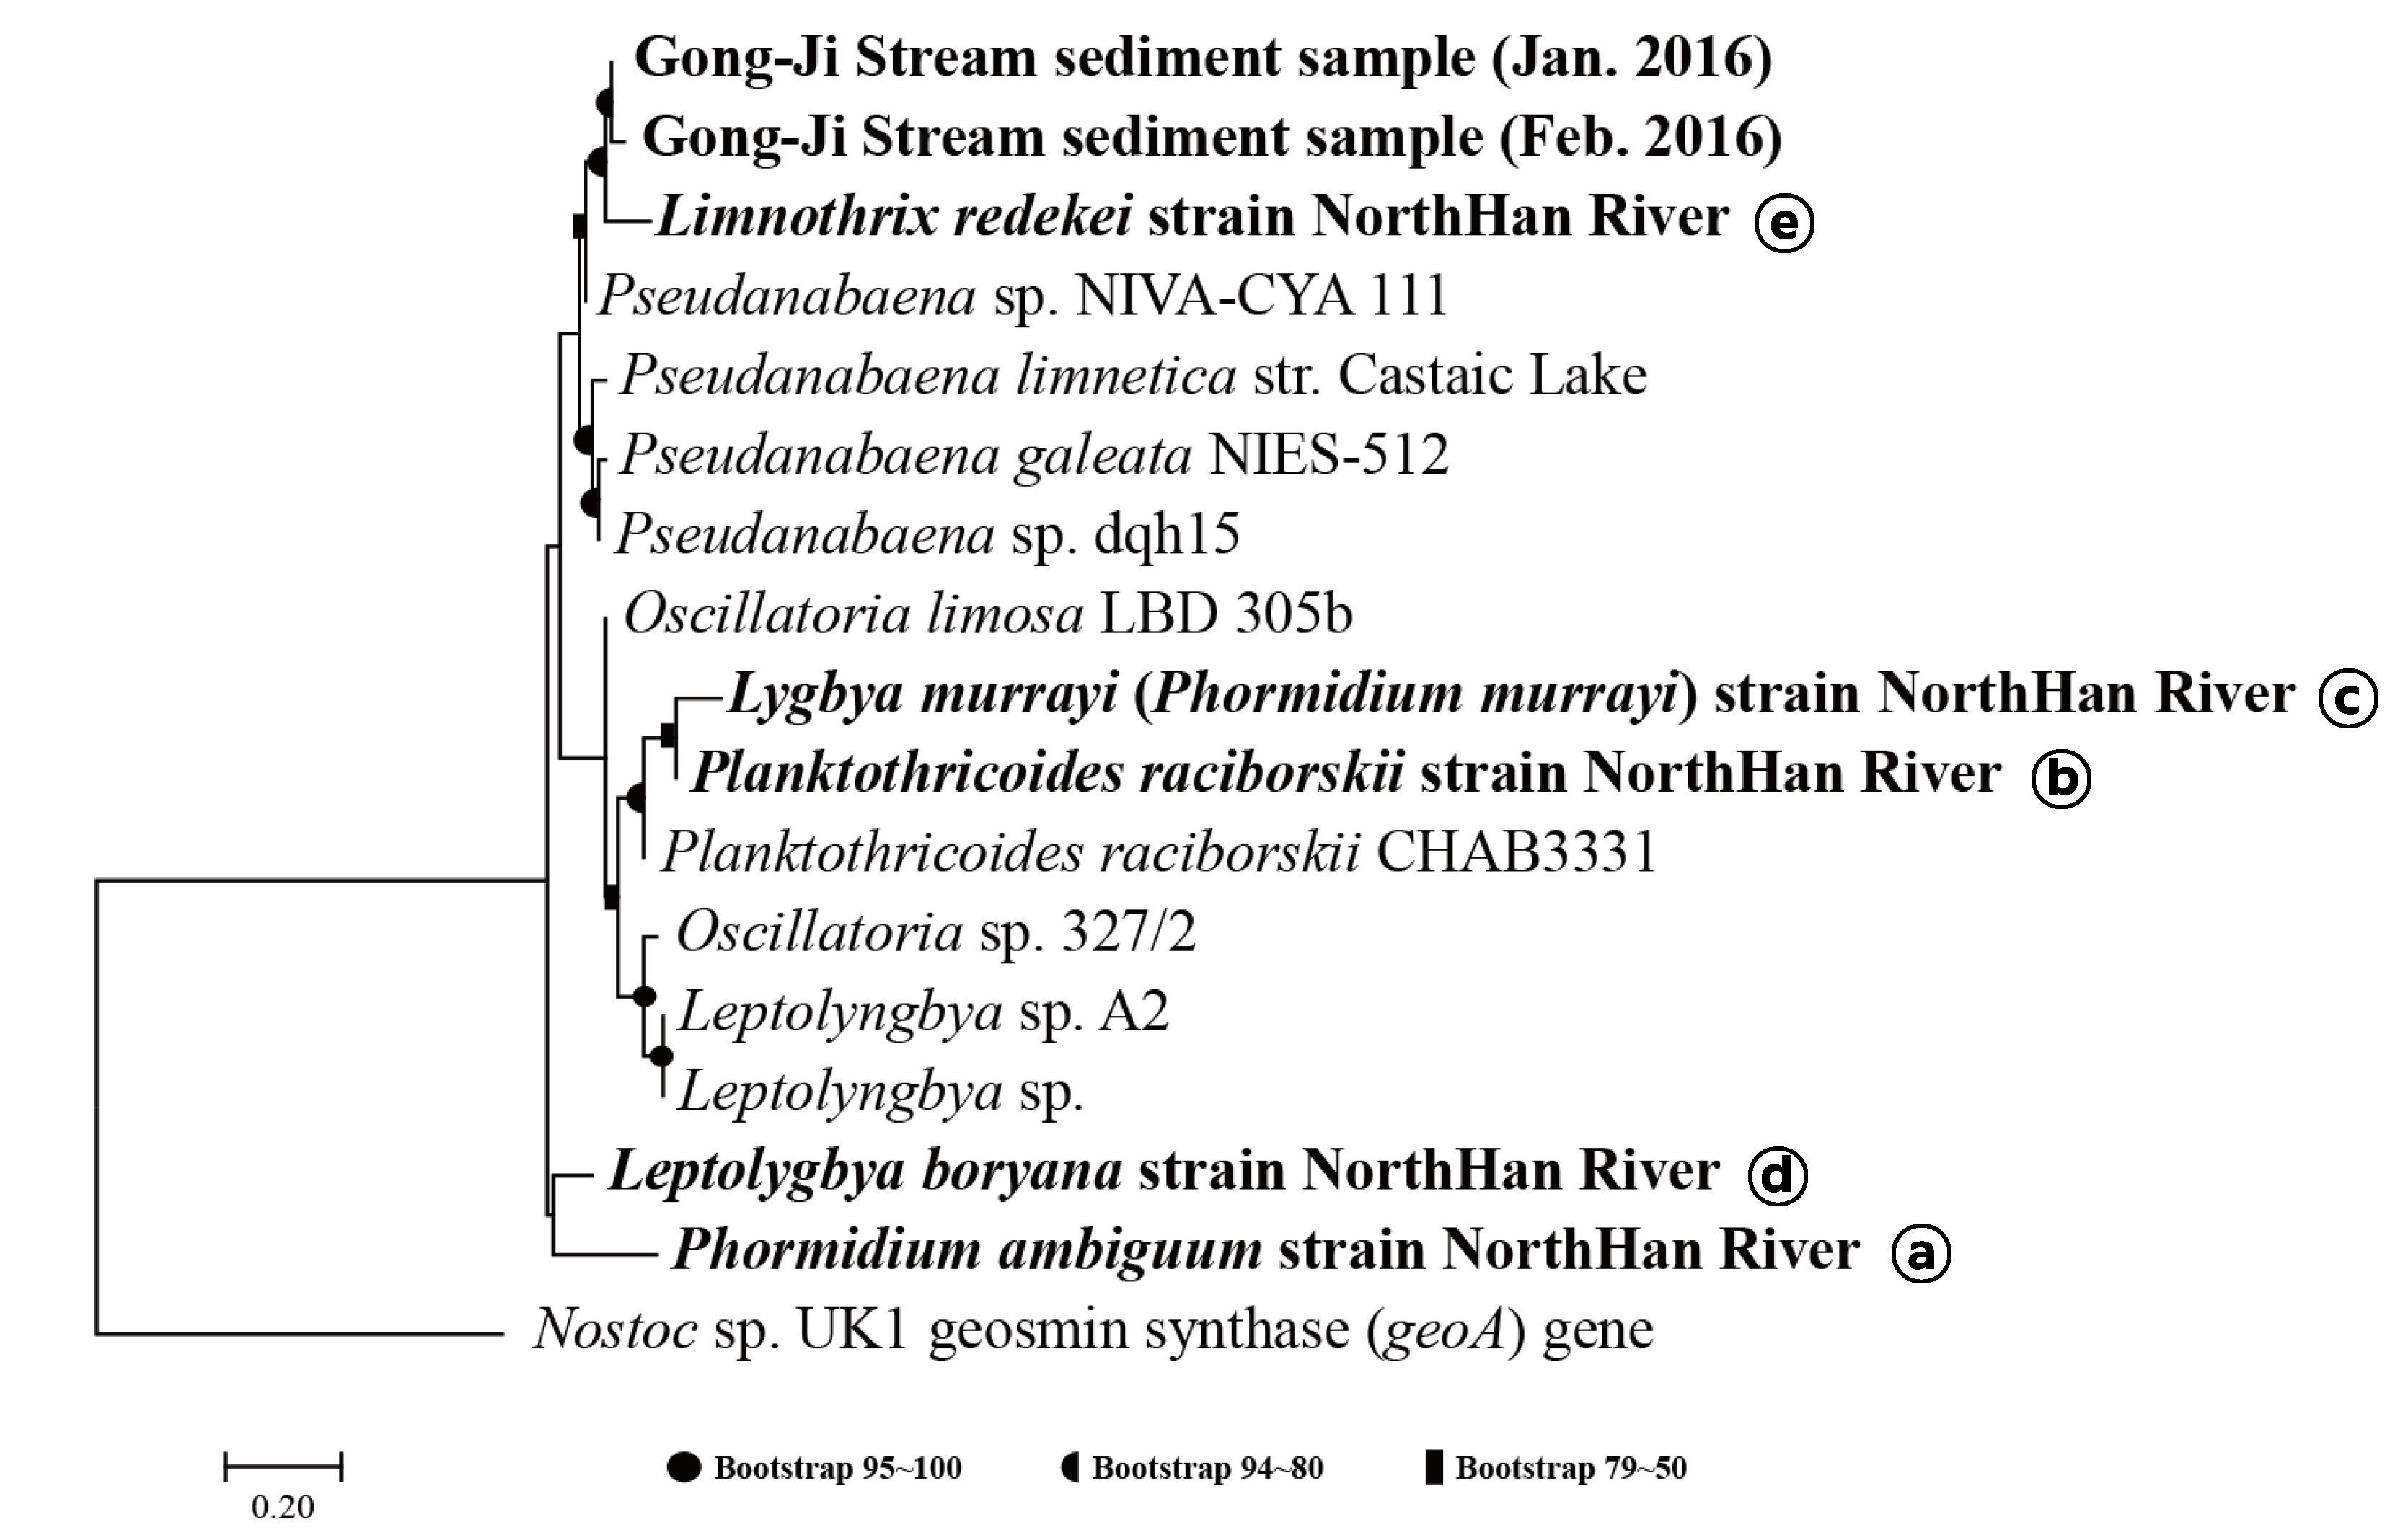
3.2. Phylogenic Analysis of Primer Amplicon Sequences

The selected primer sets, mibC132, mibC196, and mibC300, could detect mibC from both the cyanobacterial strain P. galeata NIES-512 and environmental samples. Thus, these primers could be used to evaluate the 2-MIB production potential and gene expression in environmental systems; however, this information is not sufficient to provide an early warning of 2-MIB occurrence. To achieve this goal, it is necessary to further identify strains that possess mibC in the cyanobacterial community. Accordingly, the sequences of amplicons generated using the mibC132, mibC196, and mibC300 primers were subjected to a phylogenetic analysis. The amplicon sequences were classified as being most closely related to Pseudanabaena, whereas they were phylogenetically separated from the mibC genes in Oscillatoria, Leptolyngbya, and Planktothricoides. As shown in Figure 3a, the sequences of mibC132 amplicons were phylogenetically more similar to those of Pseudanabaena and separate from those of Oscillatoria, Planktothricoides, and Leptolyngbya. However, the sequences amplified by the mibC196 and mibC300 primers were phylogenetically close to not only Pseudanabaena, including Pseudanabaena sp. NIVA-CYA 111 and P. galeata NIES-512, but also to Oscillatoria sp. and Leptolyngbya sp. (Supplementary Figure S4b,c). In addition, there was no difference in the sequences of amplicons from the field samples collected in Gong-ji Stream, demonstrating high phylogenetic similarity (Supplementary Figure S4). All mibC genes amplified from five strains (except for P. mucicola) isolated from the North Han River were classified as the cyanobacterial mibC gene group, and the phylogenic branch was separated from that of the geosmin-synthesizing gene (geoA) of Nostoc (Figure 4). In particular, the mibC sequence of L. redekei, which does not exist in the GenBank database, was phylogenetically the most similar to that of Pseudanabaena, and was separated from those of Planktothricoides, Lyngbya, Leptolyngbya, and Phormidium (Figure 4). The mibC sequence of Lyngbya was the most similar to that of Planktothricoides, whereas the Leptolyngbya A2 strain isolated from China was separated into a different phylogenic branch from that comprising the North Han River strains. The mibC genes of Phormidium and Leptolyngbya showed a >90% identity with sequences of Pseudanabaena in BLAST analysis, although they were classified into different phylogenic branches.
Based on the phylogenetic analysis and electrophoresis of amplicons, the mibC196 and mibC300 primers showed relatively broad specificity toward Oscillatoriales and Synechococcales with 2-MIB production potential. By contrast, the mibC132 primer was more specific for detecting Pseudanabaena and Planktothricoides, which are known to produce the odorous 2-MIB compound [27,28,36].

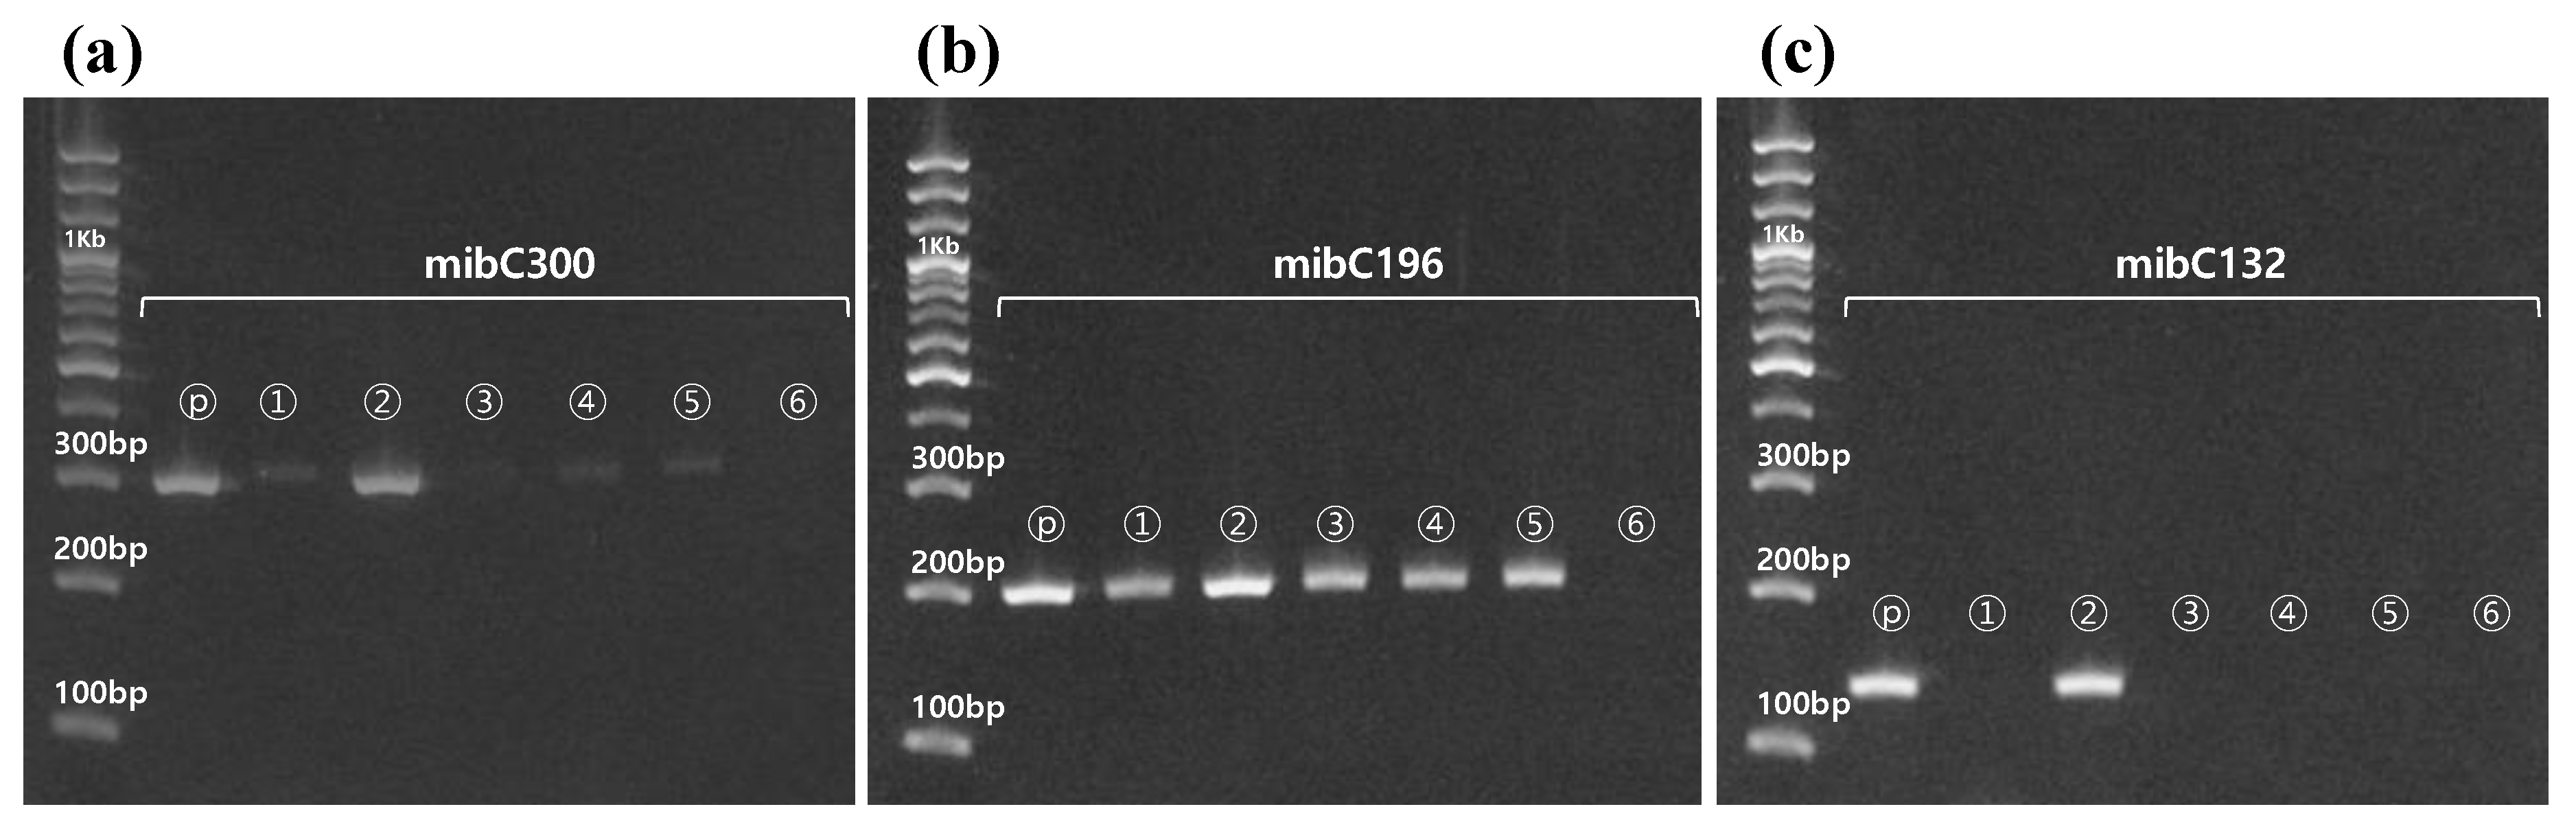
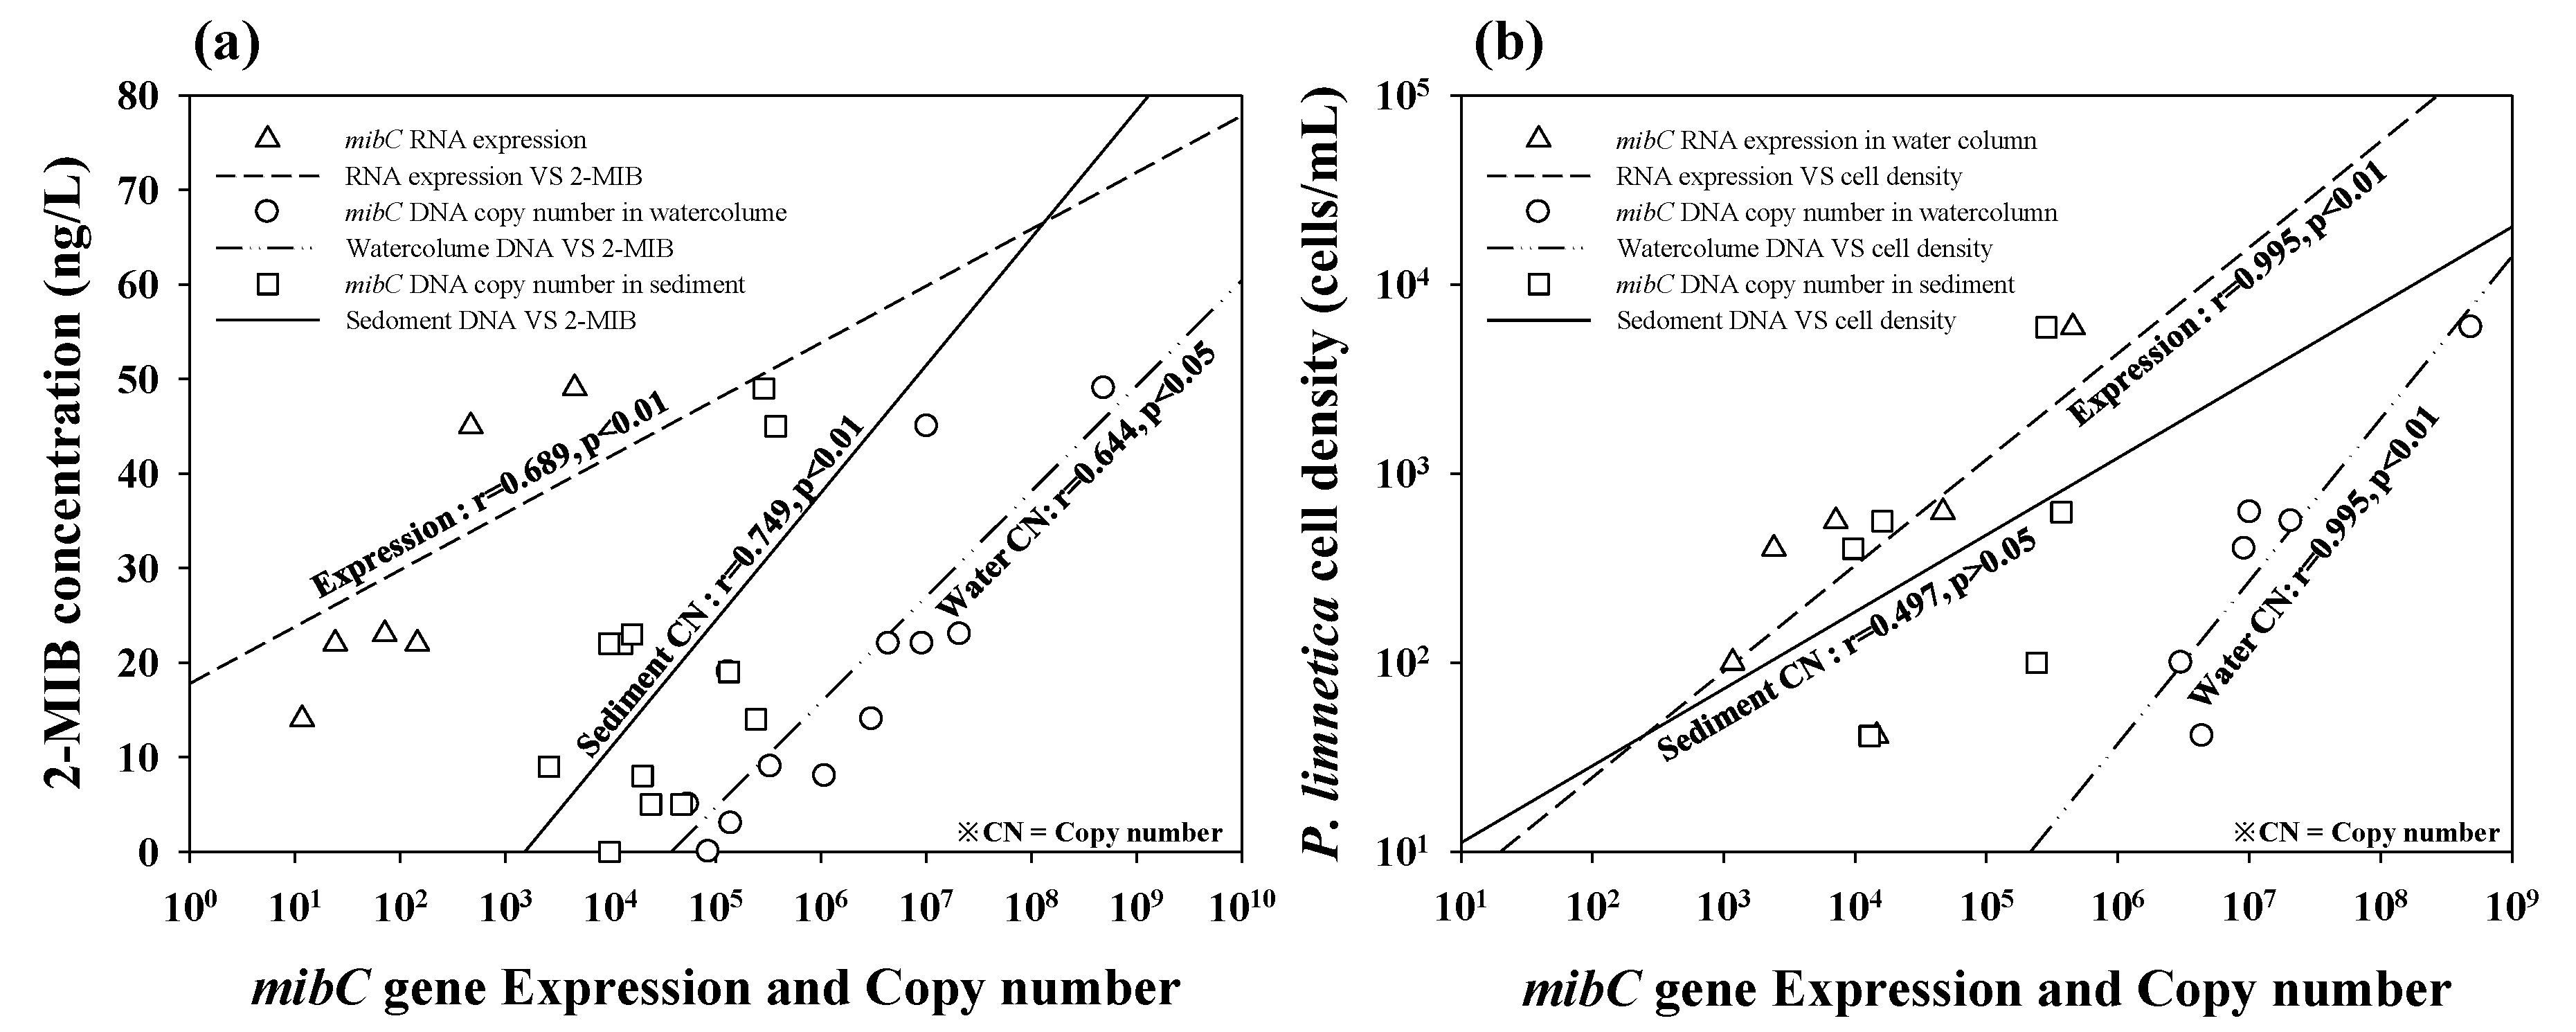
3.3. Quantitative Analysis of In Vivo and In Vitro Samples

To achieve sufficient sensitivity for detecting mibC in the cyanobacterial community, we employed real-time PCR using P. galeata NIES-512 as the positive control strain. The correlation between the threshold cycle values in the real-time PCR analysis for each primer set and the mibC gene copy number, representing the amount of mibC gene, was fit to a linear regression, with R2 values for mibC132 and mibC196 of 0.999 and 0.998, respectively (Figure 5). The slopes of the standard curves of the primers mibC132 and mibC196 were −3.34 and −3.40, respectively, and their amplification efficiencies were 100–102% (Figure 5). Therefore, both primer sets could be applicable for real-time PCR without producing non-specific amplicons owing to primer self-binding (e.g., dimers).
To test the application of the mibC196 and mibC132 primers as useful molecular probes to detect mibC and to evaluate the 2-MIB production potential of cyanobacteria, we employed this primer set for detection with the field samples. The annual average concentration of 2-MIB from the water column of Gong-ji Stream collected between February of 2015 and February of 2016 was 17 ± 15 ng/L (0–49 ng/L), and the highest concentration was detected between August and November (Supplementary Figure S5c). Specifically, the highest 2-MIB concentration in the water column was 49 ng/L in September, followed by November at 45–49 ng/L. The average copy number of mibC from the water column and the sediment of Gong-ji Stream were 4.4 × 10⁷ (±14 × 107) copies/mL and 9.8 × 10⁴ (±12.9 × 10⁴) copies/mL, respectively, and the temporal variation pattern of the copy number was similar to that of the 2-MIB concentration (Supplementary Figure S5a). In addition, the mibC expression pattern in the water column was very similar to the temporal fluctuations in mibC gene copy number and 2-MIB concentration (Supplementary Figure S5b).
The correlations between 2-MIB concentration and both mibC gene copy number and gene expression levels were statistically significant (p < 0.05; Figure 6a). The correlation coefficients between copy number and 2-MIB concentration in the sediment and water column were 0.749 and 0.644, respectively. The expression level of the mibC gene in the water column was also highly correlated with the 2-MIB concentration (r = 0.689). The copy number and expression level of mibC in the water column were significantly correlated (p > 0.01, r = 0.995) with the P. limnetica cell density (Figure 6b, Supplementary Figure S5d). By contrast, the mibC copy number in the sediment showed a low correlation with the cell density of P. limnetica, which was found in only the water column.

4. Discussion

In this work, we developed and applied new molecular probes to detect mibC, which is related to the production of 2-MIB in cyanobacterial communities. Using the mibC132, mibC196, and mibC300 primers developed in this study, we were able to not only successfully detect the presence of the mibC gene from both single cyanobacterial strains and natural cyanobacterial assemblages with high specificity but could also quantify gene expression and environmental RNA with excellent amplification efficiency.
However, the other primers designed in this study (mibC117, mibC127, mibC200, mibC564, and mibC719) amplified non-specific amplicons during PCR. These unexpected non-specific amplicons could have been caused by non-specific binding [37], which could lead to overestimation of the 2-MIB production potential in quantitative analyses. Because the binding of primers to a target gene varies depending on the annealing temperature [37,38], we employed annealing temperatures of 55–64 °C for PCR against the positive control to eliminate noise. Under these conditions, only the mibC132, mibC196, and mibC300 primers provided amplicons of the expected size without any extra bands.
For primer design, it is critical to consider the G-C content, which strongly determines the melting temperature and PCR efficiency [39,40]; the G-C content of primers generally ranges from 40% to 60%, and repeated sequences should be excluded to avoid self-assembly [39]. In the present study, the five primer sets with a high G-C content and repeated sequences were excluded from the PCR tests. Moreover, biosynthesis of 2-MIB compound precursor is closely associated with photosynthetic pigment synthesis [41]. Therefore, the sequence of the target amplicon for mibC could be partially similar to those of genes related to chlorophyll-a synthesis, and it could result in the production of non-specific amplification, regardless of optimization of the annealing temperature.
The amplification efficiency is considered to be optimal when the amplification product size is 100–200 bp and the optimum efficiency (100%) is obtained when the slope of the standard curve is –3.3 in real-time PCR analysis [42,43]. The mibC primer previously reported to be used for quantification was larger than 200 bp, and amplification efficiencies were 97% and 95–102% with SYBR polymerase and TaqMan probe, respectively [14,18]. However, the mibC primers designed in this study produced an amplicon smaller than 200 bp, along with increased amplification efficiency of up to 100–102% using SYBR polymerase and an R2 value very close to one. Thus, we cautiously conclude that the mibC132, mibC196, and mibC300 primer sets are suitable to detect mibC in cyanobacterial communities and to evaluate the 2-MIB production potential and gene expression. As demonstrated in prior studies, 2-MIB is synthesized by a series of proteins encoded by the 2-MIB synthesis-associated operon [18,44], and it was suggested that the 2-MIB production potential could be assessed by detecting and quantifying genes in this operon, including mibC [14].
Our study also offers extension of applicability to estimate the in situ 2-MIB concentration and causative cyanobacterial density based on the relationships among mibC gene copy number, gene expression level, in situ amount of 2-MIB compound, and cyanobacterial density. However, quantitative prediction of these relationships requires further careful studies. In the quantitative analysis of mibC in the water column and sediment of the test site (Gong-ji Stream), the mibC196 primer results (copy number and gene expression level) showed a significant correlation with the actual in situ 2-MIB concentration and cell density of P. limnetica, which was demonstrated to produce 2-MIB in prior studies [27,45,46]. In particular, the gene expression level was highly correlated with the cell density of P. limnetica (r = 0.995, p < 0.01). Based on these results, mibC expression in the water column of Gong-ji Stream was suspected to be derived from P. limnetica. Therefore, the concentration of 2-MIB in the water column might originate from P. limnetica among the members of the diverse cyanobacterial community in the Gong-ji Stream.

5. Conclusions

In this study, we developed the primers for detecting and quantifying 2-MIB-synthesizing cyanobacteria based on mibC gene sequences and investigated the 2-MIB production capability in 14 different cyanobacterial strains using these primer sets. Primer sets mibC196 and mibC300 showed universality to mibC in the Synechococcales and Oscillatoriales strains; the mibC132 primer showed high specificity for Pseudanabaena and Planktothricoides mibC. Our mibC primers also showed high correlations among related variables in the field (2-MIB concentration with water DNA and RNA and sediment DNA; cyanobacteria cell density with water RNA and DNA). We suggest that this approach can be applied to other freshwater systems, including drinking water resources in which off-flavor-related problems are caused by cyanobacterial blooms, and that the primers proposed as molecular probes could be used to provide information on the 2-MIB production potential and gene expression as an early warning monitoring system. This study, therefore, offers new primers with both high specificity for mibC gene detection and amplification efficiency of gene expression and is also the first study to evaluate the 2-MIB production potential and gene expression using a molecular biological method in freshwater systems in Korea. Lastly, we underline that this study provides findings to improve the conventional methods which have a limit to identify the presence of 2-MIB-producing cyanobacteria and to measure 2-MIB content in the sediment of aquatic systems.

Supplementary Materials

The following are available online at https://www.mdpi.com/1660-4601/17/6/1933/s1, Figure S1: location of the sampling site (red circle) in the estuary region of the Gong-ji stream, Figure S2: nonspecific band occurrence for all tested strains according to annealing temperature, Figure S3: detection of mibC genes from the field samples by PCR, Figure S4: phylogenic analysis of 2-MIB-synthesizing gene (mibC) sequences obtained using the designed primers with sequences from the GenBank database, Figure S5: seasonal variation in mibC copy number (a), gene expression (b) in the water column and sediment, 2-MIB concentration (c), and Pseudanabaena limnetica cell density (d) in the water column of the Gong-ji Stream between February 2015 and February 2016.

Author Contributions

All authors contributed to the study. K.K. performed DNA analyses and wrote a draft of the manuscript. Y.Y. and H.C. participated in the experimental design and supervised the DNA analyses. S.-J.H. was responsible for the entire research and was instrumental in reviewing and revising the manuscript. All co-authors participated in discussion and manuscript review. All authors have read and agreed to the published version of the manuscript.

Funding

This study was funded by the Han River Watershed Management Commission under the project of basic investigation of environment in the Han River system 2020 (“Investigation of the outbreak causes and management measures of the taste and odor compound (2-methylisoborneol) in the North Han River water system”).

Acknowledgments

The authors are grateful to three anonymous reviewers for their constructive comments. We would like to thank Editage (www.editage.co.kr) for English language editing.

Conflicts of Interest

The authors declare no conflicts of interest.

References

  1. Jüttner, F.; Watson, S.B. Biochemical and ecological control of geosmin and 2-methylisoborneol in source waters. Appl. Environ. Microbiol. 2007, 73, 4395–4406. [Google Scholar] [CrossRef] [Green Version]
  2. Suffet, I.M.; Khiari, D.; Bruchet, A. The drinking water taste and odor wheel for the millennium: Beyond geosmin and 2-methylisoborneol. Water Sci. Technol. 1999, 40, 1–13. [Google Scholar] [CrossRef]
  3. Srinivasan, R.; Sorial, G.A. Treatment of taste and odor causing compounds 2-methyl isoborneol and geosmin in drinking water: A critical review. J. Environ. Sci. 2011, 23, 1–13. [Google Scholar] [CrossRef]
  4. Worley, J.L.; Dietrich, A.M.; Hoehn, R.C. Dechlorination techniques to improve sensory odor testing of geosmin and 2-MIB. Am. Water Work. Assoc. J. 2003, 95, 109. [Google Scholar] [CrossRef]
  5. Oikawa, T.; Tsunoda, T.; Nakahigashi, H.; Shimoriku, M.; Kanami, T.; Kimura, S. Musty odor producing benthic cyanobacteria in the Tama River (Japan) and identification of species by genetic analysis. J. Water Supply Res. Technol. -Aqua 2015, 64, 839–846. [Google Scholar] [CrossRef]
  6. Su, M.; Yu, J.; Zhang, J.; Chen, H.; An, W.; Vogt, R.D.; Andersen, T.; Jia, D.; Wang, J.; Yang, M. MIB-producing cyanobacteria (Planktothrix sp.) in a drinking water reservoir: Distribution and odor producing potential. Water Res. 2015, 68, 444–453. [Google Scholar] [CrossRef]
  7. Wang, R.; Li, D.; Jin, C.X.; Yang, B.W. Seasonal occurrence and species specificity of fishy and musty odor in Huajiang Reservoir in winter, China. Water Resour. Ind. 2015, 11, 13–26. [Google Scholar] [CrossRef] [Green Version]
  8. HRWEMD. Investigation of Causes of Off-Flavor Material Production by Harmful Algae and Management Strategy; Final Report; HEWEMD: Hanam, Korea, 2016. [Google Scholar]
  9. Choi, B.-G. Effects of Meteoro-Hydrological Fluctuation on Water Quality Change and Occurrence of Cyanobacterial Off-Flavors in Euiam Reservoir; Konkuk University: Seoul, Korea, 2017. [Google Scholar]
  10. Backer, L.; McGillicuddy, D. Harmful algal blooms. Oceanography 2006, 19, 94–106. [Google Scholar] [CrossRef]
  11. Watson, S.B. Cyanobacterial and eukaryotic algal odour compounds: Signals or by-products? A review of their biological activity. Phycologia 2003, 42, 332–350. [Google Scholar] [CrossRef]
  12. Watson, S.B.; Monis, P.; Baker, P.; Giglio, S. Biochemistry and genetics of taste-and odor-producing cyanobacteria. Harmful Algae 2016, 54, 112–127. [Google Scholar] [CrossRef]
  13. Otten, T.G.; Graham, J.L.; Harris, T.D.; Dreher, T.W. Elucidation of Taste-and Odor-Producing Bacteria and Toxigenic Cyanobacteria in a Midwestern Drinking Water Supply Reservoir by Shotgun Metagenomic Analysis. Appl. Environ. Microbiol. 2016, 82, 5410–5420. [Google Scholar] [CrossRef] [Green Version]
  14. Wang, Z.; Song, G.; Shao, J.; Tan, W.; Li, Y.; Li, R. Establishment and field applications of real-time PCR methods for the quantification of potential MIB-producing cyanobacteria in aquatic systems. J. Appl. Phycol. 2016, 28, 325–333. [Google Scholar] [CrossRef]
  15. Jiang, J.; Saint, C.P.; Cane, D.E.; Monis, P.T. Isolation and characterization of the gene associated with geosmin production in cyanobacteria. Environ. Sci. Technol. 2008, 42, 8027–8032. [Google Scholar] [CrossRef] [Green Version]
  16. Gust, B.; Challis, G.L.; Fowler, K.; Kieser, T.; Chater, K.F. PCR-targeted Streptomyces gene replacement identifies a protein domain needed for biosynthesis of the sesquiterpene soil odor geosmin. Proc. Natl. Acad. Sci. USA 2003, 100, 1541–1546. [Google Scholar] [CrossRef] [Green Version]
  17. Zuo, Y.; Li, L.; Wu, Z.; Song, L. Isolation, identification and odour-producing abilities of geosmin/2-MIB in actinomycetes from sediments in Lake Lotus, China. J. Water Supply Res. Technol. -Aqua 2009, 58, 552–561. [Google Scholar] [CrossRef]
  18. Chiu, Y.-T.; Yen, H.-K.; Lin, T.-F. An alternative method to quantify 2-MIB producing cyanobacteria in drinking water reservoirs: Method development and field applications. Environ. Res. 2016, 151, 618–627. [Google Scholar] [CrossRef]
  19. Jørgensen, N.O.; Podduturi, R.; Burford, M.A. Relations between abundance of potential geosmin-and 2-MIB-producing organisms and concentrations of these compounds in water from three Australian reservoirs. J. Water Supply Res. Technol. -Aqua 2016, 65, 504–513. [Google Scholar]
  20. Kim, K.; Lim, B.-J.; You, K.-A.; Park, M.-H.; Park, J.H.; Kim, B.-H.; Hwang, S.-J. Identification and Analysis of Geosmin Production Potential of Anabaena stain Isolated from North Han River using Genetic Methods. Korean J. Ecol. Environ. 2014, 47, 342–349. [Google Scholar] [CrossRef]
  21. HRWEMD. Investigation of the Outbreak Causes and Management Measures of the Taste and Odor Compound (2-Methylisoborneol) in the North Han River Water System; 1st Year Final Report; HEWEMD: Hanam, Korea, 2019. [Google Scholar]
  22. Allen, M.M. Simple conditions for growth of unicellular blue-green algae on plates1, 2. J. Phycol. 1968, 4, 1–4. [Google Scholar] [CrossRef]
  23. Lazarevic, V.; Gaïa, N.; Girard, M.; Francois, P.; Schrenzel, J. Comparison of DNA extraction methods in analysis of salivary bacterial communities. PLoS ONE 2013, 8, e67699. [Google Scholar] [CrossRef]
  24. Tamura, K.; Stecher, G.; Peterson, D.; Filipski, A.; Kumar, S. MEGA6: Molecular evolutionary genetics analysis version 6.0. Mol. Biol. Evol. 2013, 30, 2725–2729. [Google Scholar] [CrossRef] [Green Version]
  25. Kumar, S.; Stecher, G.; Li, M.; Knyaz, C.; Tamura, K. MEGA X: Molecular evolutionary genetics analysis across computing platforms. Mol. Biol. Evol. 2018, 35, 1547–1549. [Google Scholar] [CrossRef]
  26. IDT. IDT’s PrimerQuest Tool, 2.2.3; Integrated DNA Technology: Coralville, IA, USA, 2012. [Google Scholar]
  27. Tuji, A.; Niiyama, Y. The identity and phylogeny of Pseudanabaena strain, NIES-512, producing 2-methylisoborneol (2-MIB). Bull. Natl. Mus. Nat. Sci. 2016, 42, 83–89. [Google Scholar]
  28. Iwase, S.; Abe, T. Identification and change in concentration of musty-odor compounds during growth in blue-green algae. Grad. Sch. Oceanogr. Tokai Univ. Sea-Nat. Cult. 2010, 8, 27–33. [Google Scholar]
  29. Sakai, M.; Hosoda, A.; Kanazawa, S. Isolation and characterization of two cyanobacteria-lytic bacterial strains from the submerged paddy soil. Soil Microorg. 2003, 57, 21–28. [Google Scholar]
  30. Matsushita, T.; Kobayashi, Y.; Nakamura, K.; Matsui, Y.; Ohno, K. Effect of transmembrane pressure on geosmin release from cyanobacterial cell during microfiltration. Water Pract. Technol. 2010, 5, wpt2010049. [Google Scholar] [CrossRef]
  31. Choi, G.G.; Yoon, S.K.; Kim, H.S.; Ahn, C.Y.; Oh, H.M. Morphological and Molecular Analyses of Anabaena variabilis and Trichormus variabilis (Cyanobacteria) from Korea. Korean J. Environ. Biol. 2012, 30, 54–63. [Google Scholar]
  32. Kyung Hee, O. Screening of Conserved DNA Sequences in Microcystin-Producing Cyanobacteria and Application of the Sequences to Monitor Microcystins in Water Reservoirs; Seoul National University of Graduate School: Seoul, Korea, 2009. [Google Scholar]
  33. Vaitomaa, J.; Rantala, A.; Halinen, K.; Rouhiainen, L.; Tallberg, P.; Mokelke, L.; Sivonen, K. Quantitative real-time PCR for determination of microcystin synthetase E copy numbers for Microcystis and Anabaena in lakes. Appl. Environ. Microbiol. 2003, 69, 7289–7297. [Google Scholar] [CrossRef] [Green Version]
  34. Ministry-of-Environment. Standard Methods for the Examination of Drinking Water Surveillance; Ministry-of-Environment: Sejong, Korea, 2016.
  35. Felsenstein, J. Confidence limits on phylogenies: An approach using the bootstrap. Evolution 1985, 39, 783–791. [Google Scholar] [CrossRef]
  36. Suda, S.; Watanabe, M.M.; Otsuka, S.; Mahakahant, A.; Yongmanitchai, W.; Nopartnaraporn, N.; Liu, Y.; Day, J.G. Taxonomic revision of water-bloom-forming species of oscillatorioid cyanobacteria. Int. J. Syst. Evol. Microbiol. 2002, 52, 1577–1595. [Google Scholar]
  37. PrimierBiosoft. PCR Primer Design Guidelines. Available online: http://www.premierbiosoft.com/ (accessed on 29 December 2019).
  38. Rychlik, W.; Spencer, W.; Rhoads, R. Optimization of the annealing temperature for DNA amplification in vitro. Nucleic Acids Res. 1990, 18, 6409–6412. [Google Scholar] [CrossRef] [Green Version]
  39. John, M.W.; Rapley, R. Molecular Biomethods Handbook, 2nd ed.; Humana Press: Totowa, NJ, USA, 2008. [Google Scholar]
  40. Ausubel, F.M.; Brent, R.; Kingston, R.E.; Moore, D.D.; Seidman, J.; Smith, J.A.; Struhl, K. Short Protocols in Molecular Biology; Jordan University of Science and Technology: Amman, Jordan, 1992. [Google Scholar]
  41. Zimba, P.V.; Dionigi, C.P.; Millie, D.F. Evaluating the relationship between photopigment synthesis and 2-methylisoborneol accumulation in cyanobacteria. J. Phycol. 1999, 35, 1422–1429. [Google Scholar] [CrossRef]
  42. Biosystems, A. Real-Time PCR Handbook; Life Thecnologies: Carlsbad, CA, USA, 2015. [Google Scholar]
  43. Debode, F.; Marien, A.; Janssen, É.; Bragard, C.; Berben, G. The influence of amplicon length on real-time PCR results. Base 2017, 21. [Google Scholar] [CrossRef]
  44. Komatsu, M.; Tsuda, M.; Ōmura, S.; Oikawa, H.; Ikeda, H. Identification and functional analysis of genes controlling biosynthesis of 2-methylisoborneol. Proc. Natl. Acad. Sci. USA 2008, 105, 7422–7427. [Google Scholar] [CrossRef] [Green Version]
  45. Giglio, S.; Chou, W.; Ikeda, H.; Cane, D.; Monis, P. Biosynthesis of 2-methylisoborneol in cyanobacteria. Environ. Sci. Technol. 2010, 45, 992–998. [Google Scholar] [CrossRef] [Green Version]
  46. Byun, J.-H.; Hwang, S.-J.; Kim, B.-H.; Park, J.-R.; Lee, J.-K.; Lim, B.-J. Relationship between a Dense Population of Cyanobacteria and Odorous Compounds in the North Han River System in 2014 and 2015. Korean J. Ecol. Environ. 2015, 48, 263–271. [Google Scholar] [CrossRef]
Figure 1. The 2-Methylisoborneol (2-MIB) synthesis-associated operon and positions of the designed primers on mibC (Adapted from Chiu et al., 2016). The sequences of mibC from the GenBank database, including Pseudanabaena sp. dqh15, were aligned, and the homologous region of mibC was selected for primer targeting. The arrows represent the directions of the primers, and the numbers in the primer names indicate the expected sizes (base pairs).
Ijerph 17 01933 g001
Figure 2. Amplification of the 2-MIB-synthesizing gene, mibC, by eight sets of primers using the genomic DNA of cyanobacteria strains cultured in the laboratory as templates. The PCR product generated by each primer set was analyzed by agarose gel electrophoresis. The electrophoresis gel shows the amplicons produced by PCR with (a) mibC117, (b) mibC719, (c) mibC132, (d) mibC564, (e) mibC300, (f) mibC200, (g) mibC196, and (h) mibC127. mibC127 did not produce amplicons.
Ijerph 17 01933 g002
Figure 3. Amplification of the 2-MIB-synthesizing gene mibC by the primers mibC132, mibC196, and mibC300 using the genomic DNA of cyanobacteria strains isolated from the North Han River. The PCR product generated by each primer set was analyzed by agarose gel electrophoresis. The electrophoresis gel shows the amplicons produced by PCR with (a) mibC300 primer, (b) mibC196 primer, and (c) mibC132 primers. P. mucicola did not harbor mibC. Lane numbers in the figure represent Pseudanabaena galeata NIES-512 as a positive control (P), Phormidium ambiguum (1), Planktothricoides raciborskii (2), Lyngbya murrayi (3), Leptolyngbya boryana (4), Limnothrix redekei (5), and Pseudanabaena mucicola (6).
Ijerph 17 01933 g003
Figure 4. Phylogenic analysis of mibC sequences obtained using the mibC196 primer with sequences from cyanobacterial strains isolated from the North Han River and field sediment environmental DNA samples. The database DNA sequence was downloaded from NCBI GenBank, and the target gene sequence was selected by a keyword search (“mibC” or “MIB”). Phylogenic analysis of aligned sequences was performed using the maximum-likelihood method (1000 bootstrap replicates). Nostoc sp. UK1 strain was the root species and P. mucicola did not have the mibC gene.
Ijerph 17 01933 g004
Figure 5. Standard curve for real-time PCR analysis with serial ten-fold-diluted DNA, which was cloned from the mibC gene fragment. Primer sets of (a) mibC132 and (b) mibC196 were used for SYBR type polymerase.
Ijerph 17 01933 g005
Figure 6. Regression lines for the correlation among mibC196 primer-derived amplicon copy number, gene expression, 2-MIB concentration, and Pseudanabaena limnetica cell density in the water column and sediment of Gong-ji Stream in 2015–2016. The 2-MIB compound concentration (a) and P. limnetica cell density (b) showed a linear relationship with the mibC gene amount (copy number and gene expression level). The amount of mibC was significantly correlated with both the 2-MIB concentration and P. limnetica cell density in the water column.
Ijerph 17 01933 g006
Table 1. Sequences of the designed primers targeting mibC to evaluate 2-methylisoborneol (2-MIB) production potential in cyanobacteria.
No.NameDirectionLength (mer)Sequence (5′ → 3′)GC Contents (%)PurposeAmplicon Size (bp)Melting Temp.
1mibC117Forward19CCG AGC GAT TCA ACG AGC C63.2Real-time PCR11760 °C
Reverse22CCT CGT CCT CAT CAA ACC CGC A59.1
2mibC127Forward20CCC CTG TTA CGC CAC CTT CT60.0Real-time PCR12760 °C
Reverse24TCA TGG AGG TGT AGA AGC TGT CGT50.0
3mibC132Forward22CGY ACC TGT TAC GCC ACC TTC T56.8Real-time PCR13260 °C
Reverse24TCA TGG AGG TGT AGA AGC TGT CGT50.0
4mibC196Forward24ACG ACA GCT TCT ACA CCT CCA TGA50.0Real-time PCR
Screening
19664 °C
Reverse26AAT CTG TAG CAC CAT GTT GAC WGG TG46.2
5mibC200Forward24ACA TGG TGC TAC AGA TTG CGG CGG58.3Real-time PCR
Screening
20064 °C
Reverse24GCT GTT ATG CCA TTC AAA TGC GCC50.0
6mibC300Forward23TGT TAC GCC ACC TTC TCT ATG TT43.5Screening30064 °C
Reverse21CAA TCT GTA GCA CCA TGT TGA42.9
7mibC564Forward22TCG GCT GTT GAT YGG KGC CAA G59.1Screening56464 °C
Reverse25AAT CTG TAG CAC CAT GTT GAC WGG T44.0
8mibC719Forward19CCG AGC GAT TCA ACG AGC C63.2Screening71960 °C
Reverse25AAT CTG TAG CAC CAT GTT GAC WGG T44.0

