Lymphocyte-To-Monocyte Ratio as the Best Simple Predictor of Bacterial Infection in Patients with Liver Cirrhosis

 , , and
Abstract
1. Introduction
2. Materials and Methods
3. Results
4. Discussion
5. Conclusions
Author Contributions
Funding
Conflicts of Interest
References
- Piotrowski, D.; Boroń-Kaczmarska, A. Bacterial infections and hepatic encephalopathy in liver cirrhosis—Prophylaxis and treatment. Adv. Med. Sci. 2017, 62, 345–356. [Google Scholar] [CrossRef] [PubMed]
- Jalan, R.; Fernandez, J.; Wiest, R.; Schnabl, B.; Moreau, R.; Angeli, P.; Stadlbauer, V.; Gustot, T.; Bernardi, M.; Canton, R.; et al. Bacterial infections in cirrhosis: A position statement based on the EASL Special Conference 2013. J. Hepatol. 2014, 60, 1310–1324. [Google Scholar] [CrossRef] [PubMed]
- Fernandez, J.; Gustot, T. Management of bacterial infections in cirrhosis. J. Hepatol. 2012, 56, S1–S12. [Google Scholar] [CrossRef]
- Fernández, J.; Acevedo, J.; Castro, M.; Garcia, O.; De Lope, C.R.; Roca, D.; Pavesi, M.; Sola, E.; Moreira, L.; Silva, A.; et al. Prevalence and risk factors of infections by multiresistant bacteria in cirrhosis: A prospective study. Hepatology 2012, 55, 1551–1561. [Google Scholar]
- Cai, Y.J.; Dong, J.J.; Dong, J.Z.; Yang, N.B.; Song, M.; Wang, Y.Q.; Chen, Y.P.; Lin, Z.; Shi, K.Q. Neutrophil-lymphocyte ratio predicts hospital-acquired bacterial infections in decompensated cirrhosis. Clin. Chim. Acta 2017, 469, 201–207. [Google Scholar] [CrossRef]
- Elalfy, H.; Besheer, T.; El-Maksoud, M.A.; Farid, K.; Elegezy, M.; El Nakib, A.M.; El-Aziz, M.A.; El-Khalek, A.A.; El-Morsy, A.; Elmokadem, A.; et al. Monocyte/granulocyte to lymphocyte ratio and the MELD score as predictors for early recurrence of hepatocellular carcinoma after trans-arterial chemoembolization. Br. J. Biomed. Sci. 2018, 75, 187–191. [Google Scholar] [CrossRef]
- Zeng, T.; Yu, J.; Tan, L.; Wu, Y.; Tian, Y.; Wu, Q.; Duan, X.; Yu, L. Noninvasive indices for monitoring disease course in Chinese patients with autoimmune hepatitis. Clin. Chim. Acta 2018, 486, 135–141. [Google Scholar] [CrossRef]
- Zahorec, R. Ratio of neutrophil to lymphocyte counts-rapid and simple parameter of systemic inflammation and stress in critically ill. Bratisl. Lek. Listy 2001, 102, 5–14. [Google Scholar]
- Merekoulias, G.; Alexopoulos, E.C.; Belezos, T.; Panagiotopoulou, E.; Jelastopulu, D.M. Lymphocyte to monocyte ratio as a screening tool for influenza. PLoS Curr. 2010, 2, RRN1154. [Google Scholar] [CrossRef]
- Turkmen, K.; Erdur, F.H.; Ozcicek, F.; Ozcicek, A.; Akbas, E.M.; Ozbicer, A.; Demirtas, L.; Turk, S.; Tonbul, H.Z. Platelet-to-lymphocyte ratio better predicts inflammation than neutrophil-to-lymphocyte ratio in end-stage renal disease patients. Hemodial. Int. 2013, 17, 391–396. [Google Scholar] [CrossRef]
- Cihan, Y.B.; Arslan, A.; Ergul, M.A. Subtypes of white blood cells in patients with prostate cancer or benign prostatic hyperplasia and healthy individuals. Asian Pac. J. Cancer Prev. 2013, 14, 4779–4783. [Google Scholar] [CrossRef] [PubMed]
- Pugh, R.N.; Murray-Lyon, I.M.; Dawson, J.L.; Pietroni, M.C.; Williams, R. Transection of the oesophagus for bleeding oesophageal varices. Br. J. Surg. 1973, 60, 646–649. [Google Scholar] [CrossRef] [PubMed]
- Bambha, K.; Kim, W.R.; Kremers, K.; Therneau, T.M.; Kamath, P.S.; Wiesner, R.; Rosen, C.B.; Thostenson, J.; Benson, J.T.; Dickson, E.R. Predicting survival among patients listed for liver transplantation: An assessment of serial MELD measurements. Am. J. Transplant. 2004, 4, 1798–1804. [Google Scholar] [CrossRef] [PubMed]
- Williams, A.L.; Hoofnagle, J.H. Ratio of serum aspartate to alanine aminotransferase in chronic hepatitis. Relationship to cirrhosis. Gastroenterology 1988, 95, 734–739. [Google Scholar] [CrossRef]
- Fix, O.K.; Horsburgh, C.R.; Heeren, T.C.; Reinus, J.F.; Garcia, E.; Mishkin, D.S.; Graham, C.S.; Koziel, M.J.; Nunes, D.P. The performance of APRI for the diagnosis of significant hepatic fibrosis is improved by a simple modification. In Proceedings of the Conference Report—AASLD, San Francisco, CA, USA, 11–15 November 2005. [Google Scholar]
- Sterling, R.K.; Lissen, E.; Clumeck, N.; Sola, R.; Correa, M.C.; Montaner, J.; Sulkowski, M.S.; Torriani, F.J.; Dieterich, D.T.; Thomas, D.L.; et al. Development of a simple noninvasive index to predict significant fibrosis in patients with HIV/HCV coinfection. Hepatology 2006, 43, 1317–1325. [Google Scholar] [CrossRef] [PubMed]
- Dang, Y.; Lou, J.; Yan, Y.; Yu, Y.; Chen, M.; Sun, G.; Li, N. The role of the neutrophil Fcg receptor I (CD64) index in diagnosing spontaneous bacterial peritonitis in cirrhotic patients. Int. J. Infect. Dis. 2016, 49, 154–160. [Google Scholar] [CrossRef][Green Version]
- Bal, C.K.; Daman, R.; Bhatia, V. Predictors of fifty days in-hospital mortality in decompensated cirrhosis patients with spontaneous bacterial peritonitis. World J. Hepatol. 2016, 8, 566–572. [Google Scholar] [CrossRef]
- Guidelines on Urological Infections. European Association of Urology. Available online: http://uroweb.org/wp-content/uploads/19-Urological-infections_2017_web.pdf (accessed on 15 June 2018).
- Mandell, L.A.; Wunderink, R.G.; Anzueto, A.; Bartlett, J.G.; Campbell, G.D.; Dean, N.C.; Dowell, S.F.; File, T.M., Jr.; Musher, D.M.; Niederman, M.S.; et al. Infectious Diseases Society of America/American Thoracic Society Consensus Guidelines on the Management of Community-Acquired Pneumonia in Adults. Clin. Infect. Dis. 2007, 44, S27–S72. [Google Scholar] [CrossRef]
- Wunderink, R.G.; Waterer, G.W. Clinical practice. Community-acquired pneumonia. N. Engl. J. Med. 2014, 370, 543–551. [Google Scholar] [CrossRef]
- Merli, M.; Lucidi, C.; Giannelli, V.; Giusto, M.; Riggio, O.; Falcone, M.; Ridola, L.; Attili, A.F.; Venditti, M. Cirrhotic Patients Are at Risk for Health Care-Associated Bacterial Infections. Clin. Gastroenterol. Hepatol. 2010, 8, 979–985. [Google Scholar] [CrossRef]
- Peleg, A.Y.; Hooper, D.C. Hospital-acquired infections due to gram-negative bacteria. N. Engl. J. Med. 2010, 362, 1804–1813. [Google Scholar] [CrossRef] [PubMed]
- StatSoft, Inc. STATISTICA (Data Analysis Software System), Version 12; StatSoft, Inc.: Tulsa, OK, USA, 2014. [Google Scholar]
- R Development Core Team. R: A Language and Environment for Statistical Computing; R Foundation for Statistical Computing: Vienna, Austria, 2015; Available online: http://www.r-project.org (accessed on 1 June 2018).
- Warnes, G.R.; Bolker, B.; Lumley, T.; Johnson, R.C. Gmodels: Various R Programming Tools for Model Fitting. 2015. Available online: https://cran.r-project.org/web/packages/gmodels/index.html (accessed on 3 June 2018).
- Lopez-Raton, M.; Rodriguez-Alvarez, M.X. OptimalCutpoints: Computing Optimal Cutpoints in Diagnostic Tests. 2015. Available online: https://cran.rproject.org/web/packages/OptimalCutpoints/index.html (accessed on 4 June 2018).
- NCAR—Research Applications Laboratory. Verification: Weather Forecast Verification Utilities. 2015. Available online: https://cran.r-project.org/web/packages/verification/index.html (accessed on 6 June 2018).
- Pijls, K.E.; Koek, G.H.; Elamin, E.E.; de Vries, H.; Masclee, A.A.M.; Jonkers, D.M.A.E. Large intestine permeability is increased in patients with compensated liver cirrhosis. Am. J. Physiol. Gastrointest. Liver Physiol. 2014, 306, 147–153. [Google Scholar] [CrossRef] [PubMed]
- Yan, K.; Garcio-Tsao, G. Novel prevention strategies for bacterial infections in cirrhosis. Expert Opin. Pharmacother. 2016, 17, 689–701. [Google Scholar] [CrossRef] [PubMed]
- Dirchwolf, M.; Podhorzer, A.; Marino, M.; Shulman, C.; Cartier, M.; Zunino, M.; Paz, S.; Muñoz, A.; Bocassi, A.; Gimenez, J.; et al. Immune dysfunction in cirrhosis: Distinct cytokines phenotypes according to cirrhosis severity. Cytokine 2016, 77, 14–25. [Google Scholar] [CrossRef] [PubMed]
- Wasmuth, H.E.; Kunz, D.; Yagmur, E.; Timmer-Stranghöner, A.; Vidacek, D.; Siewert, E.; Bach, J.; Geier, A.; Purucker, E.A.; Gressner, A.M.; et al. Patients with acute on chronic liver failure display ‘sepsis-like’ immune paralysis. J. Hepatol. 2005, 42, 195–201. [Google Scholar] [CrossRef] [PubMed]
- Gomes, C.L.; Silva, R.V.; Carrola, P.; Presa, J. Bacterial Infections in Patients with Liver Cirrhosis in an Internal Medicine Department. GE Port. J. Gastroenterol. 2019, 26, 324–332. [Google Scholar] [CrossRef]
- Tamhane, U.U.; Aneja, S.; Montgomery, D.; Rogers, E.K.; Eagle, K.A.; Gurm, H.S. Association between admission neutrophil to lymphocyte ratio and outcomes in patients with acute coronary syndrome. Am. J. Cardiol. 2008, 102, 653–657. [Google Scholar] [CrossRef]
- Nunez, J.; Nunez, E.; Bodi, V.; Sanchis, J.; Miñana, G.; Mainar, L.; Santas, E.; Merlos, P.; Rumiz, E.; Darmofal, H.; et al. Usefulness of the neutrophil to lymphocyte ratio in predicting long-term mortality in ST segment elevation myocardial infarction. Am. J. Cardiol. 2008, 101, 747–752. [Google Scholar] [CrossRef]
- Walsh, S.R.; Cook, E.J.; Goulder, F.; Justin, T.A.; Keeling, N.J. Neutrophil-lymphocyte ratio as a prognostic factor in colorectal cancer. J. Surg. Oncol. 2005, 91, 181–184. [Google Scholar] [CrossRef]
- Kartal, O.; Kartal, A.T. Value of neutrophil to lymphocyte and platelet to lymphocyte ratios in pneumonia. Bratisl. Med. J. 2017, 118, 513–516. [Google Scholar] [CrossRef]
- Uslu, A.U.; Küçük, A.; Şahin, A.; Ugan, Y.; Yilmaz, R.; Güngör, T.; Bağcacı, S.; Küçükşen, S. Two new inflammatory markers associated with Disease Activity Score-28 in patients with rheumatoid arthritis: Neutrophil-lymphocyte ratio and platelet-lymphocyte ratio. Int. J. Rheum. Dis. 2015, 18, 731–735. [Google Scholar] [CrossRef]
- Sen, B.B.; Rifaioglu, E.N.; Ekiz, O.; Inan, M.U.; Sen, T.; Sen, N. Neutrophil to lymphocyte ratio as a measure of systemic inflammation in psoriasis. Cutan. Ocul. Toxicol. 2014, 33, 223–227. [Google Scholar] [CrossRef]
- Makay, B.; Gücenmez, Ö.A.; Duman, M.; Ünsal, E. The relationship of neutrophil-to-lymphocyte ratio with gastrointestinal bleeding in Henoch–Schonlein purpura. Rheumatol. Int. 2014, 34, 1323–1327. [Google Scholar] [CrossRef]
- Akboga, M.K.; Canpolat, U.; Yayla, C.; Ozcan, F.; Ozeke, O.; Topaloglu, S.; Aras, D. Association of Platelet to Lymphocyte Ratio With Inflammation and Severity of Coronary Atherosclerosis in Patients With Stable Coronary Artery Disease. Angiology 2016, 67, 89–95. [Google Scholar] [CrossRef]
- Yang, Y.T.; Jiang, J.H.; Yang, H.J.; Wu, Z.J.; Xiao, Z.M.; Xiang, B.D. The lymphocyte-to-monocyte ratio is a superior predictor of overall survival compared to established biomarkers in HCC patients undergoing liver resection. Sci. Rep. 2018, 8, 2535. [Google Scholar] [CrossRef]
- Qi, X. Peripheral Blood Lymphocyte-to-Monocyte Ratio Predicts Mortality in Patients with HBV-Related Decompensated Cirrhosis. Clin. Lab. 2019, 65. [Google Scholar] [CrossRef]
- Jamil, Z.; Durrani, A.A. Assessing the outcome of patients with liver cirrhosis during hospital stay: A comparison of lymphocyte/monocyte ratio with MELD and Child-Pugh scores. Turk. J. Gastroenterol. 2018, 29, 308–315. [Google Scholar] [CrossRef]
- Cai, Y.J.; Dong, J.J.; Dong, J.Z.; Chen, Y.; Lin, Z.; Song, M.; Wang, Y.Q.; Chen, Y.P.; Shi, K.Q.; Zhou, M.T. A nomogram for predicting prognostic value of inflammatory response biomarkers in decompensated cirrhotic patients without acute-on-chronic liver failure. Aliment. Pharmacol. Ther. 2017, 45, 1413–1426. [Google Scholar] [CrossRef]
- Kraja, B.; Sina, M.; Mone, I.; Pupuleku, F.; Babameto, A.; Prifti, S.; Burazeri, G. Predictive Value of the Model of End-Stage Liver Disease in Cirrhotic Patients with and without Spontaneous Bacterial Peritonitis. Gastroenterol. Res. Pract. 2012, 2012, 539059. [Google Scholar] [CrossRef]
- Cheng, X.P.; Zhao, J.; Chen, Y.; Meng, F.K.; Xu, B.; Yu, H.W.; Meng, Q.H.; Liu, Y.M.; Zhang, S.B.; Meng, S.; et al. Comparison of the ability of the PDD-ICG clearance test, CTP, MELD, and MELD-Na to predict short-term and medium-term mortality in patients with decompensated hepatitis B cirrhosis. Eur. J. Gastroenterol. Hepatol. 2016, 28, 444–448. [Google Scholar] [CrossRef][Green Version]


| Calculated Indices | First Publication | Required Parameters | Formula |
|---|---|---|---|
| AAR | Williams, Hoofnagle (1988) [14] | AST, ALT | |
| Modified APRI | Fix et al. (2005) [15] | albumin, AST, PLT, age | |
| FIB-4 | Sterling et al. (2006) [16] | ALT, AST, PLT, age | |
| NLR | Zahorec R (2001) [8] | neutrophil, lymphocyte | |
| LMR | Merekoulias G et al. (2010) [9] | lymphocyte, monocyte | |
| PLR | Turkmen K et al. (2013) [10] | PLT, lymphocyte | |
| NMR | Cihan YB et al. (2013) [11] | neutrophil, monocyte | |
| CTP | Pugh et al. (1973) [12] | bilirubin, albumin, prothrombin time, ascites, encephalopathy | a |
| MELD | Bambha K et al. (2004) [13] | creatinine, bilirubin, INR | b |
| Infection Type | Infectious Agent | Number of Cases (% of All Infections) |
|---|---|---|
| UTI | Escherichia coli Klebsiella pneumoniae Enterococcus faecalis | 32 (53.3%) 16 (26.7%) 4 (6.7%) |
| Pneumonia | Mycobacterium tuberculosis Citrobacter freundi Candida albicans | 1 (1.7%) 1 (1.7%) 1 (1.7%) |
| Sepsis | Staphylococcus aureus Coagulase-negative staphylococci Escherichia coli Streptococcus group B | 3 (5.0%) 2 (3.3%) 1 (1.7%) 1 (1.7%) |
| SBP | Escherichia coli Enterobacter faecalis | 1 (1.7%) 1 (1.7%) |
| Infected post-operative wound | Staphylococcus epidermidis | 1 (1.7%) |
| Abscess of subcutaneous tissue | Escherichia coli | 2 (3.3%) |
| Parameter | Presence of Infection (n = 60) | Lack of Infection (n = 149) | p |
|---|---|---|---|
| NLR | 2.45 (1.45–6.00) | 1.85 (1.30–3.01) | 0.024 a |
| LMR | 1.43 (1.06–2.01) | 2.59 (1.73–3.84) | <0.001 c |
| PLR | 91.5 (58.8–118.6) | 73.2 (50.8–99.6) | 0.047 a |
| NMR | 5.00 (3.64–7.52) | 4.87 (3.72–7.33) | 0.988 |
| Monocytes [G/L] | 0.70 (0.42–1.02) | 0.54 (0.36–0.75) | 0.011 a |
| AAR | 1.88 (1.41–2.49) | 1.57 (0.98–2.01) | 0.014 a |
| Modified APRI | 15.86 (7.82–30.85) | 12.18 (6.58–31.76) | 0.755 |
| FIB-4 | 6.25 (2.99–10.72) | 6.37 (3.30–12.03) | 0.960 |
| CRP [mg/L] | 30.7 (9.2–40.6) | 6.5 (2.1–29.6) | 0.020 a |
| CTP | 10 (8–11) | 8 (6–9) | <0.001 c |
| MELD | 15 (12–22) | 13 (10–17) | 0.006 b |
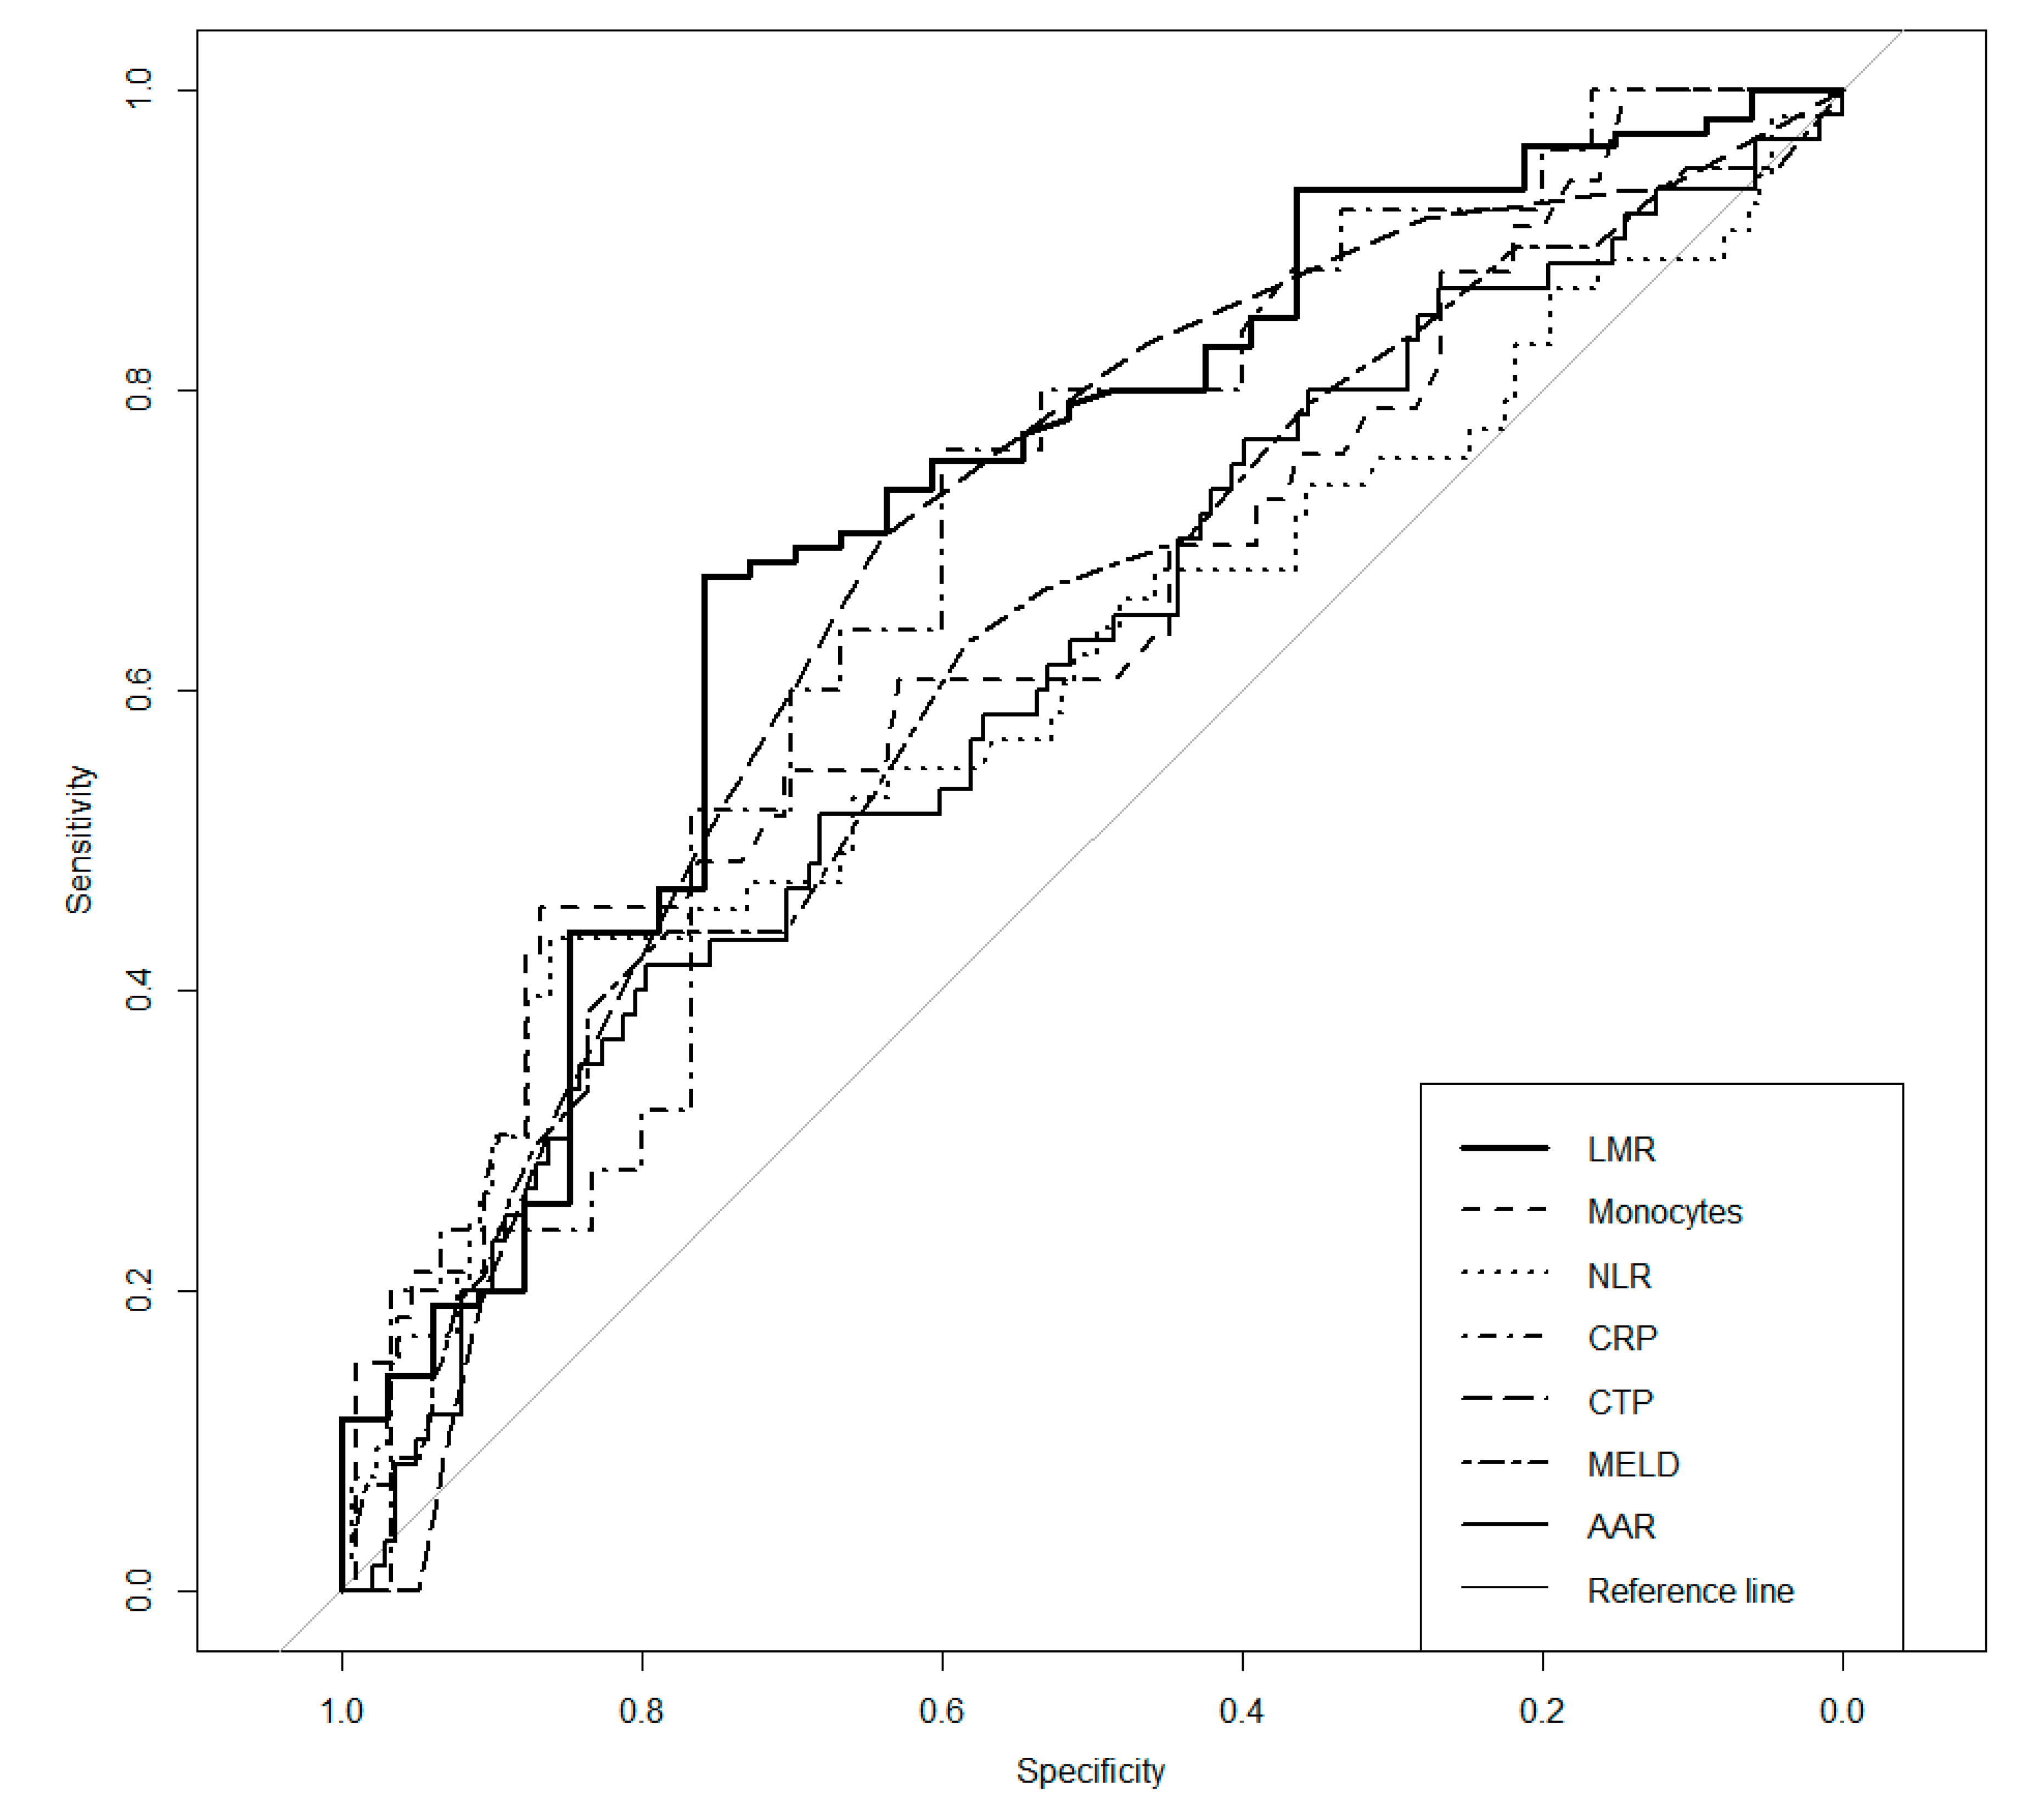
| Parameter | AUC | p | Cut-Off | Se | Sp | PPV | NPV |
|---|---|---|---|---|---|---|---|
| NLR | 0.606 | 0.033 a | 3.96 | 0.434 | 0.860 | 0.561 | 0.787 |
| LMR | 0.715 | <0.001 c | 2.06 | 0.676 | 0.758 | 0.899 | 0.424 |
| Monocytes | 0.648 | 0.010 a | 0.91 | 0.455 | 0.867 | 0.517 | 0.835 |
| AAR | 0.610 | 0.013 a | 2.11 | 0.417 | 0.797 | 0.472 | 0.759 |
| CRP | 0.685 | 0.010 a | 9.2 | 0.760 | 0.600 | 0.613 | 0.750 |
| CTP | 0.687 | <0.001 c | 9.0 | 0.702 | 0.639 | 0.485 | 0.816 |
| MELD | 0.629 | 0.005 b | 18 | 0.439 | 0.783 | 0.500 | 0.738 |
| Univariate | Multivariate | |||||||
|---|---|---|---|---|---|---|---|---|
| Predictor | Odds Ratio | CI | p | Nagelkerke’s R2 | Odds Ratio | CI | p | Nagelkerke’s R2 |
| LMR | 0.15 | 0.06–0.37 | <0.001 c | 0.199 | 0.22 | 0.08–0.64 | 0.005 b | 0.251 |
| MONO | 5.42 | 2.23–13.15 | <0.001 c | 0.144 | ||||
| NLR | 4.38 | 2.09–9.17 | <0.001 c | 0.116 | ||||
| CRP | 3.86 | 1.24–12.04 | 0.020 a | 0.133 | ||||
| CTP | 3.17 | 1.52–6.62 | 0.002 b | 0.090 | 2.77 | 1.01–7.60 | 0.048 a | |
| MELD | 3.18 | 1.54–6.56 | 0.002 b | 0.077 | ||||
| AAR | 2.68 | 1.39–5.18 | 0.003 b | 0.060 | ||||
© 2020 by the authors. Licensee MDPI, Basel, Switzerland. This article is an open access article distributed under the terms and conditions of the Creative Commons Attribution (CC BY) license (http://creativecommons.org/licenses/by/4.0/).
Share and Cite
Piotrowski, D.; Sączewska-Piotrowska, A.; Jaroszewicz, J.; Boroń-Kaczmarska, A. Lymphocyte-To-Monocyte Ratio as the Best Simple Predictor of Bacterial Infection in Patients with Liver Cirrhosis. Int. J. Environ. Res. Public Health 2020, 17, 1727. https://doi.org/10.3390/ijerph17051727
Piotrowski D, Sączewska-Piotrowska A, Jaroszewicz J, Boroń-Kaczmarska A. Lymphocyte-To-Monocyte Ratio as the Best Simple Predictor of Bacterial Infection in Patients with Liver Cirrhosis. International Journal of Environmental Research and Public Health. 2020; 17(5):1727. https://doi.org/10.3390/ijerph17051727
Chicago/Turabian StylePiotrowski, Damian, Anna Sączewska-Piotrowska, Jerzy Jaroszewicz, and Anna Boroń-Kaczmarska. 2020. "Lymphocyte-To-Monocyte Ratio as the Best Simple Predictor of Bacterial Infection in Patients with Liver Cirrhosis" International Journal of Environmental Research and Public Health 17, no. 5: 1727. https://doi.org/10.3390/ijerph17051727
APA StylePiotrowski, D., Sączewska-Piotrowska, A., Jaroszewicz, J., & Boroń-Kaczmarska, A. (2020). Lymphocyte-To-Monocyte Ratio as the Best Simple Predictor of Bacterial Infection in Patients with Liver Cirrhosis. International Journal of Environmental Research and Public Health, 17(5), 1727. https://doi.org/10.3390/ijerph17051727