Article

A Hybrid PSO–SVM Model Based on Safety Risk Prediction for the Design Process in Metro Station Construction

1
School of Civil Engineering, Lanzhou University of Technology, Lanzhou 730050, China
2
School of Management Science and Real Estate, Chongqing University, Chongqing 400045, China
3
Institute of Engineering Management, Hohai University, Nanjing 211100, China
*
Author to whom correspondence should be addressed.
Int. J. Environ. Res. Public Health 2020, 17(5), 1714; https://doi.org/10.3390/ijerph17051714
Submission received: 18 January 2020 / Revised: 1 March 2020 / Accepted: 2 March 2020 / Published: 5 March 2020
(This article belongs to the Special Issue Occupational Safety and Risks in Construction)

Abstract

:
Incorporating safety risk into the design process is one of the most effective design sciences to enhance the safety of metro station construction. In such a case, the concept of Design for Safety (DFS) has attracted much attention. However, most of the current research overlooks the risk-prediction process in the application of DFS. Therefore, this paper proposes a hybrid risk-prediction framework to enhance the effectiveness of DFS in practice. Firstly, 12 influencing factors related to the safety risk of metro construction are identified by adopting the literature review method and code of construction safety management analysis. Then, a structured interview is used to collect safety risk cases of metro construction projects. Next, a developed support vector machine (SVM) model based on particle swarm optimization (PSO) is presented to predict the safety risk in metro construction, in which the multi-class SVM prediction model with an improved binary tree is designed. The results show that the average accuracy of the test sets is 85.26%, and the PSO–SVM model has a high predictive accuracy for non-linear relationship and small samples. The results show that the average accuracy of the test sets is 85.26%, and the PSO–SVM model has a high predictive accuracy for non-linear relationship and small samples. Finally, the proposed framework is applied to a case study of metro station construction. The prediction results show the PSO–SVM model is applicable and reasonable for safety risk prediction. This research also identifies the most important influencing factors to reduce the safety risk of metro station construction, which provides a guideline for the safety risk prediction of metro construction for design process.

1. Introduction

Urban rail transit construction is very significant in promoting urban economic development. Urban metros are developing rapidly around the world since they are a fast, efficient, safe and comfortable transportation mode [1]. At the end of 2018, 35 cities in mainland China had constructed 185 urban rail operation lines with a total length of 5761.4 km according to the Annual Urban Rail Transit Statistical and Analysis Report [2]. The scale of lines planned and under construction has been growing steadily. In addition, the annual completed construction investment has reached a new record. However, with the rapid development of the metro, construction safety accidents occur frequently, which cause a large number of casualties and economic losses [3]. According to statistics, during the period from 2002 to 2016 (statistics to March 2016), 246 accidents occurred in metro station construction in China, of which metro station projects accounted for 57% [4].
Natural science is concerned with explicating and understanding natural phenomena, while design science attempts to create things that serve human purposes [5]. Design science is accomplished through knowledge-based pattern recognition and problem-solving search processes [6]. Meanwhile, building and evaluating are design science research activities aimed at improving performance [7]. Such pattern recognition activities are an important part of human cognition and are fairly central to scientific reasoning as well [8]. The roots of the design science paradigm are in engineering and the sciences of the artificial [7]. As mentioned above, design science is essentially a problem-solving process and a key activity in fields of architecture, engineering and urban planning [9]. In the field of engineering, the International Labor Organization pointed out that about 60% of engineering accidents were related to design [10]. Gambatese [10] analyzed the causes of 100 construction accidents and found that in 47% of cases, the probability of accidents can be reduced by improving the design scheme. In line with this view, the National Institute for Occupational Safety and Health put forward Prevention through Design [11], which considered the needs of occupational health and safety in the design process. Moreover, Design for Safety (DFS) is one of the most effective ways to consider safety risks in the design process [12], which is also considered as an important way to achieve social sustainable development. This is because it can not only reduce the safety risk and improve the level of safety management, but also can reduce the risk of construction-period extension and costs caused by safety accidents [12]. Thus, it is beneficial to utilize the DFS to enhance the safety of metro station construction.
DFS has different definitions and expressions in the existing literatures, such as Design for Safety [13], Safety through Design [14], Prevention through Design [11], Design for Construction Safety [15] and Construction Hazard Prevention through Design [16]. In summary, DFS is defined as eliminating or avoiding dangerous sources through standardized design and improved design to achieve the purpose of reducing safety accidents, which considers the safety and health of construction, operation and maintenance personnel, and project end-users in the early design and planning process of a project. Many researchers have found that design work has contributed to safety construction. By a comparison of the causes of construction accidents with other factors, Suraji et al. [17] found that planning and design work are the proximal factor resulting in improper site conditions and construction operations. Haslam et al. [18] put forward the hierarchy of causal effects of construction accidents, and found that design work is the critical factor causing accidents. Furthermore, designers can alleviate safety accidents by choosing alternative technologies and improving project resilience [19]. Yuan et al. realized that integrating the DFS knowledge base and Building Information Modelling (BIM) can evaluate safety risks during the design phase [20]. In addition, Szymberski [21] proposed the time-safety impact curve, and found that the ability to affect life cycle safety will reduce as the project proceeds. Meanwhile, improving designers’ hazard identification skills were thought to be an urgent need [22].
The existing research into DFS mainly focuses on three aspects: (1) research on the basic theory of DFS, which includes the analysis of safety risk sources caused by design [23], the analysis of the correlation between design and safety accidents [24] and the promotion of sustainable improvement by DFS [25]; (2) the analysis of the obstacles and driving factors of the development of DFS, for which the main obstacles include the lack of safety design-related tools and standards [26,27], insufficient knowledge reserve of designers [28], increased design costs caused by DFS [27,29]; and (3) research on the practical application of DFS; for instance, Gambatese et al. [30] built the first “design for construction safety toolbox” based on the safety recommendation database in 1997. The toolbox links the design and construction process to help designers identify the safety risks of specific project construction. Subsequently, the safety design tool based on the matching relationship between safety risk and design scheme was developed. Gambatese and Hinze [26] added safety manuals and safety guides to the toolbox. Hadikusumo and Rowlinson [31] built similar safety design process tools. Seo and Choi [32,33,34,35,36,37,38,39,40,41,42,43] evaluated and selected the design schemes of specific metro engineering projects by establishing the matching relationship between design suggestions and safety risks.
The risk prediction of metro station construction can provide a guideline for the implementation of DFS. On one hand, the identification of safety risk influencing factors is one of the most significant procedures in the risk-prediction process [44]. In such a case, the identification of safety risk influencing factors for the metro construction process has attracted much attention. For example, Yu et al. [45] analyzed the influencing factors of safety management in metro construction, and pointed out that safety attitude, construction site safety, government supervision, market restrictions and the unpredictability of tasks were the most important factors. Zhang et al. [46] classified the causes of construction accidents in the Beijing metro and found that inadequate management was the biggest cause of accidents, but the most serious accidents were caused by leaks or fractures in pipes and poor geological conditions. Ghosh and Jintanapakanont [47] separated and evaluated the key risk factors in the Thailand metro project, obtaining nine key factors and 35 sub-key factors by using the key factor analysis method. On the other hand, the construction of a prediction model is another key procedure in the risk-prediction process. Thus, many scholars have focused on the construction of prediction model. For instance, Wu et al. [48] presented a systemic Bayesian network method for the dynamic risk analysis of adjacent buildings in tunneling environments. Li et al. [49] proposed the safety risk identification system and early warning system for China’s metro construction based on BIM. Zheng et al. [50] used the fuzzy analytic hierarchy process (AHP) and the comprehensive evaluation method to assess the metro construction risk of Changchun No.1 in China.
However, as mentioned above, there are some limitations in the existing literature: (1) few studies have focused on the leading role of design in metro construction, and few researchers have incorporated risk prediction into the DFS to enhance the safety of metro station construction. The design result is the most important work basis for the field operator. If there are construction safety risks in the preliminary design documents and these are not effectively dealt with, these defects will lead to an unsafe state of objects (including the environment) and the unsafe behavior of field operators in the construction process [51]; (2) some traditional risk-prediction methods, such as the neural network method, fuzzy comprehensive evaluation method, Bayesian network, and so on, have some shortcomings, such as low accuracy and low prediction efficiency [52]. In recent years, the support vector machine (SVM) model based on particle swarm optimization (PSO–SVM) has been widely used in many fields, which can overcome these problems [53,54]. For example, Zhou et al. [55] built the prediction model of PSO–SVM to predict the landslide displacement, and demonstrated that the proposed PSO–SVM model can better represent the response relationship between the factors and the periodic displacement. Chen et al. [56] used the evaluation model of short-term atmospheric pollutant concentration forecasting based on PSO-SVM, which demonstrated the superior performance of the proposed hybrid model. However, little attention has been paid to developing a hybrid risk-prediction framework for metro station construction by using the PSO–SVM model.
Design science is considered as practical knowledge used to support design activities, which seeks various approaches to a real-world problem of interest to practice [57,58]. Improving the ability of identifying safety risks is an available method to promote the implementation of DFS at the design phase of engineering project [59]. Therefore, this paper aims to construct a safety risk-prediction model to improve the performance of DFS in practice based on PSO–SVM. The PSO–SVM intelligent prediction model is used to predict the safety risks of a specific metro station construction project. The remainder of this paper is presented as follows. Section 2 introduces the basic principle and analysis method of PSO–SVM. Section 3 constructs the framework for the safety risk prediction of metro station construction. Section 4 applies the hybrid model to predict the safety risk of a case study of metro station construction. Finally, conclusions are presented in Section 5.

2. Methodology

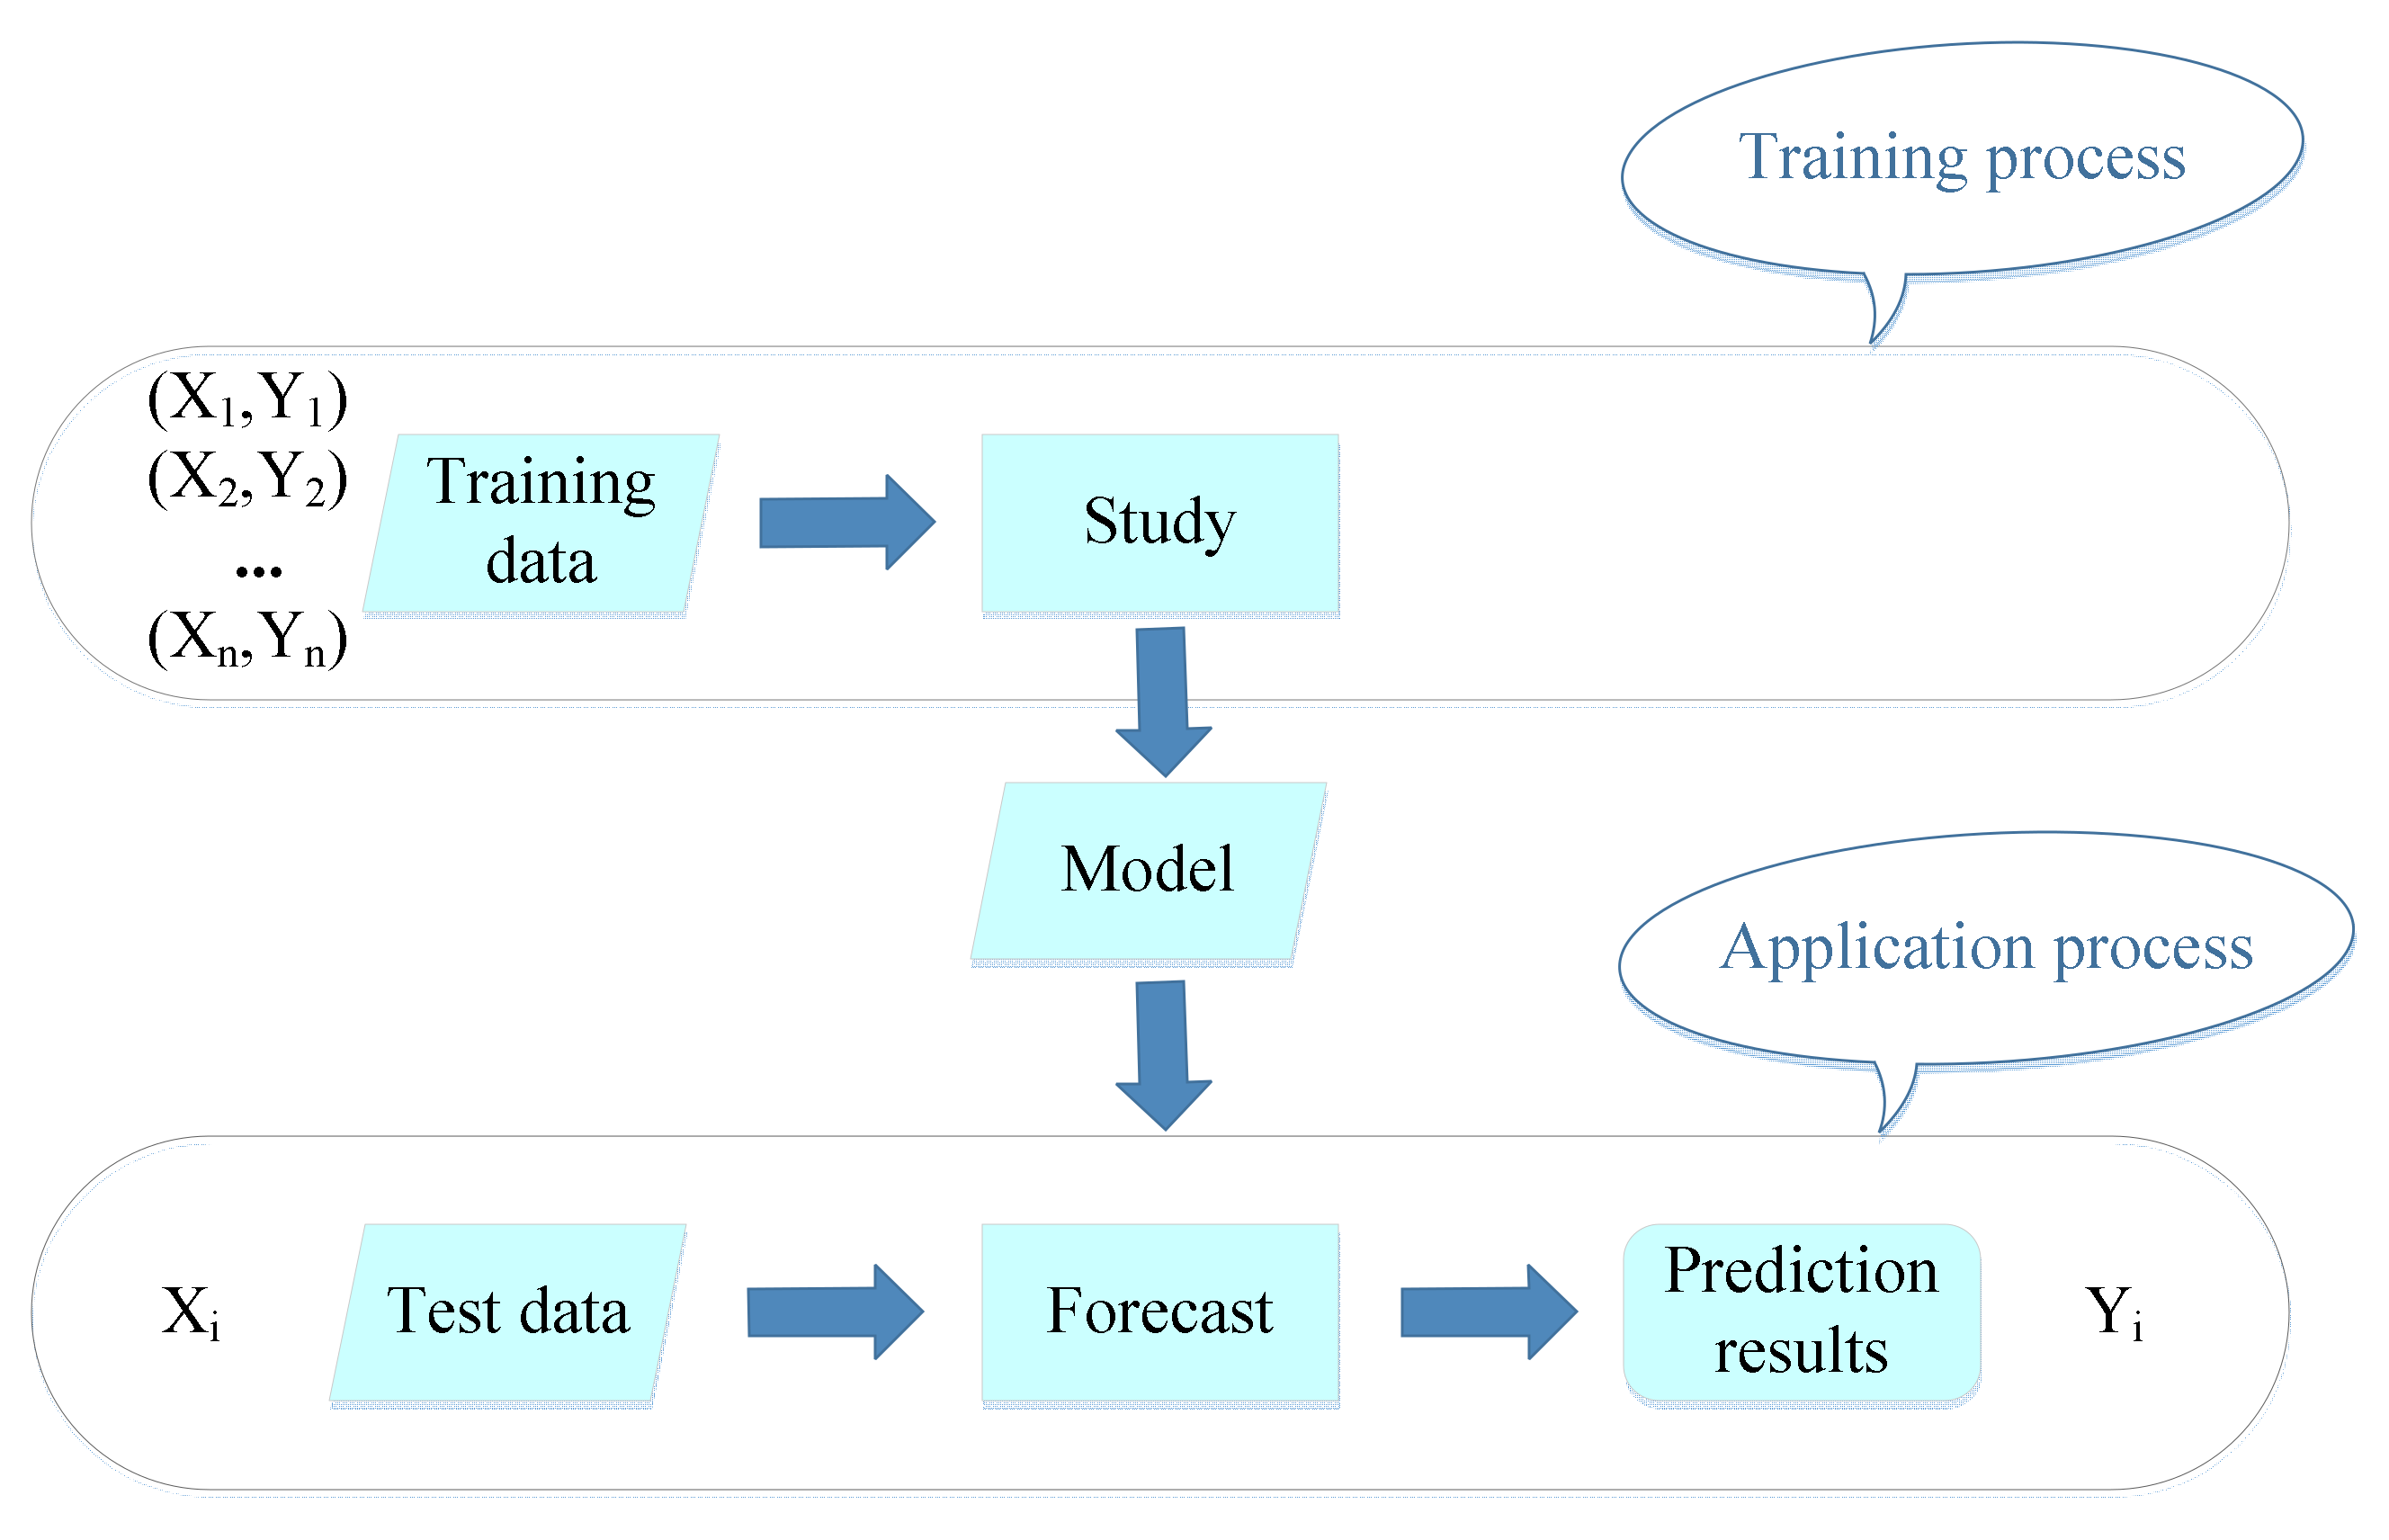
2.1. Support Vector Machine

The SVM [60] is a machine learning method based on the extended development of statistical learning theory [61,62]. The basic idea of the theory is to use non-linear mapping to project data points from a low-dimensional space into a high-dimensional space and linearly regress them in the high-dimensional feature space [53].
Machine learning is mainly divided into supervised learning and unsupervised learning [63]. Supervised learning usually requires a fully annotated training set to train a model which can be generalized to other unseen data. Unsupervised learning applies to datasets which only have input features but are missing annotations. In this research, feature attributes and annotations are both provided, and a machine learning model of metro construction safety risk is trained by analyzing the relationship between influencing factors and safety risks. Therefore, this paper addresses the problem of prediction of safety risk of metro construction engineering from a novel machine-learning perspective. Scholars have proposed some machine-learning methods, including neural network, artificial neural network (ANN), back propagation (BP), decision tree and SVM, etc. Traditional neural networks (NN) face some problems related to convergence and local optimization [56]. Moreover, the defects of faulty theory foundation, local minimum and over fitting weakened the ability of prediction [64]. Meanwhile, ANN shows a promising performance in fitting non-linear variables, but the complex relationships amongst some variables can affect its performance [65]. Back propagation (BP) is widely used in neural network models, which are trained by the error back propagation algorithm. The convergence speed of the back propagation neural network is slow, and it cannot guarantee the convergence to the global optimum. To address these problems, SVM is used for machine learning given its excellent performance in dealing with the statistical learning theory for small sample and in addressing global optimization and the principle of structural risk minimization [56].
A successful supervising learning algorithm usually contains two stages: one is the training stage, and the other is the practical application stage. The purpose of supervised learning training is to analyze the dependency x i y i between the input and target according to the given training sample x 1 , y 1 , x 2 , y 2 , , x n , y n . Assuming the evaluation function is f : x f x , y = f x , the output y is the target classification based on the evaluation function, as shown in Figure 1.
Supposing there are N samples in the dataset space, ( x i , y i ) 1 i N as training samples. The input variables are mapped into a high-dimensional linear feature space through a non-linear transformation. Then the optimal decision function is constructed. The dot product operation in the higher dimensional feature space is replaced by the kernel function in original space, and the global optimal solution is obtained by the training of the finite sample. Equation (1) represents the classification hyperplane.
y i ( ω x i + b ) 1
where, ω is the weight vector; b is bias; “·” is the inner product; x i is a D-dimensional real input vector; y i represents the corresponding annotation of x i , y i = ± 1 which is represented as precipitation occurrence or not here [66].
In order to maximize the interval, one only needs to calculate 1 2 ω T ω . The basic type of SVM is as shown in Equation (2):
min ω , b 1 2 ω T ω s u b j e c t   t o   y i ω T x i + b 1 0
where i = 1 , 2 , , N . The basic type of the above problem is a constrained convex quadratic programming problem. In order to solve dual problems, the Lagrange function is used to fuse the constraint into the objective function. It can be defined as Equation (4):
max a i = 1 N α i 1 2 i = 1 N j = 1 N y i y j α i α j x i x j
subject to:
i = 1 N α i y i = 0 0 α i C ,   i = 1 , 2 , , N
where α i is a Lagrange multiplier for each training sample, the sample is the support vector for which α i = 0 , lying on one of the two hyper-planes: ω x + + b = + 1 ; ω x + b = 1 .
According to the Karush–Kuhn–Tucker condition, the optimization problem must satisfy the last one in Equation (4) [67]. When dealing with the non-linear SVM problem, SVM introduces a kernel function to map relationship of the training samples from the original space to the high-dimensional space:
max α i = 1 N α i 1 2 i = 1 N j = 1 N y i y j α i α j K x i , x j
The K x i , x j is the kernel function of SVM that represents the inner product of two vectors [68]. It is defined as K x i , x j = φ x i φ x j . The radial basis function (RBF) is one of the most popular kernel functions, and the RBF kernel function is accounted for in the non-linear problems in this paper:
K x i , x j = exp g x j x i 2
where g is the kernel parameter to measure the width of kernel function in RBF.
Therefore, there are two important parameters affecting the learning performance of SVM that are the penalty parameter c and the kernel function parameter g , which can affect the classification accuracy of the SVM. It is necessary to utilize optimization algorithm to optimize the parameters of SVM.

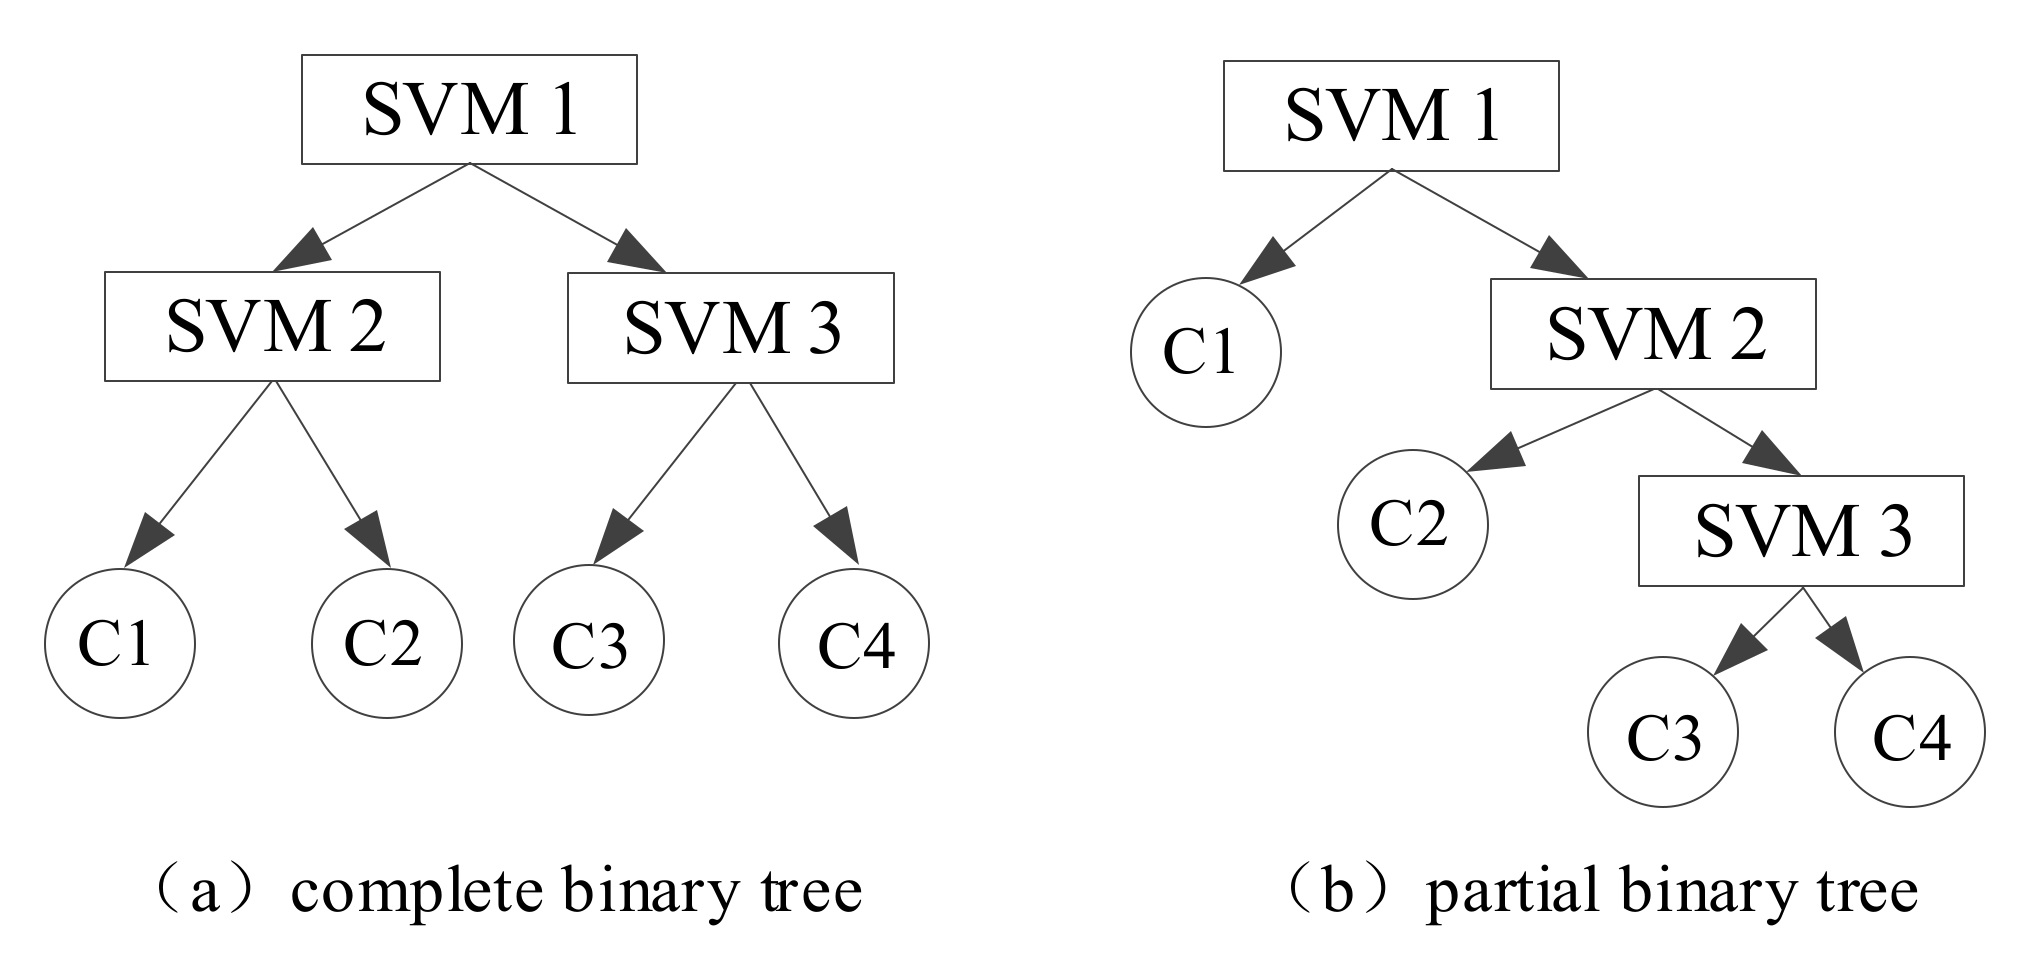
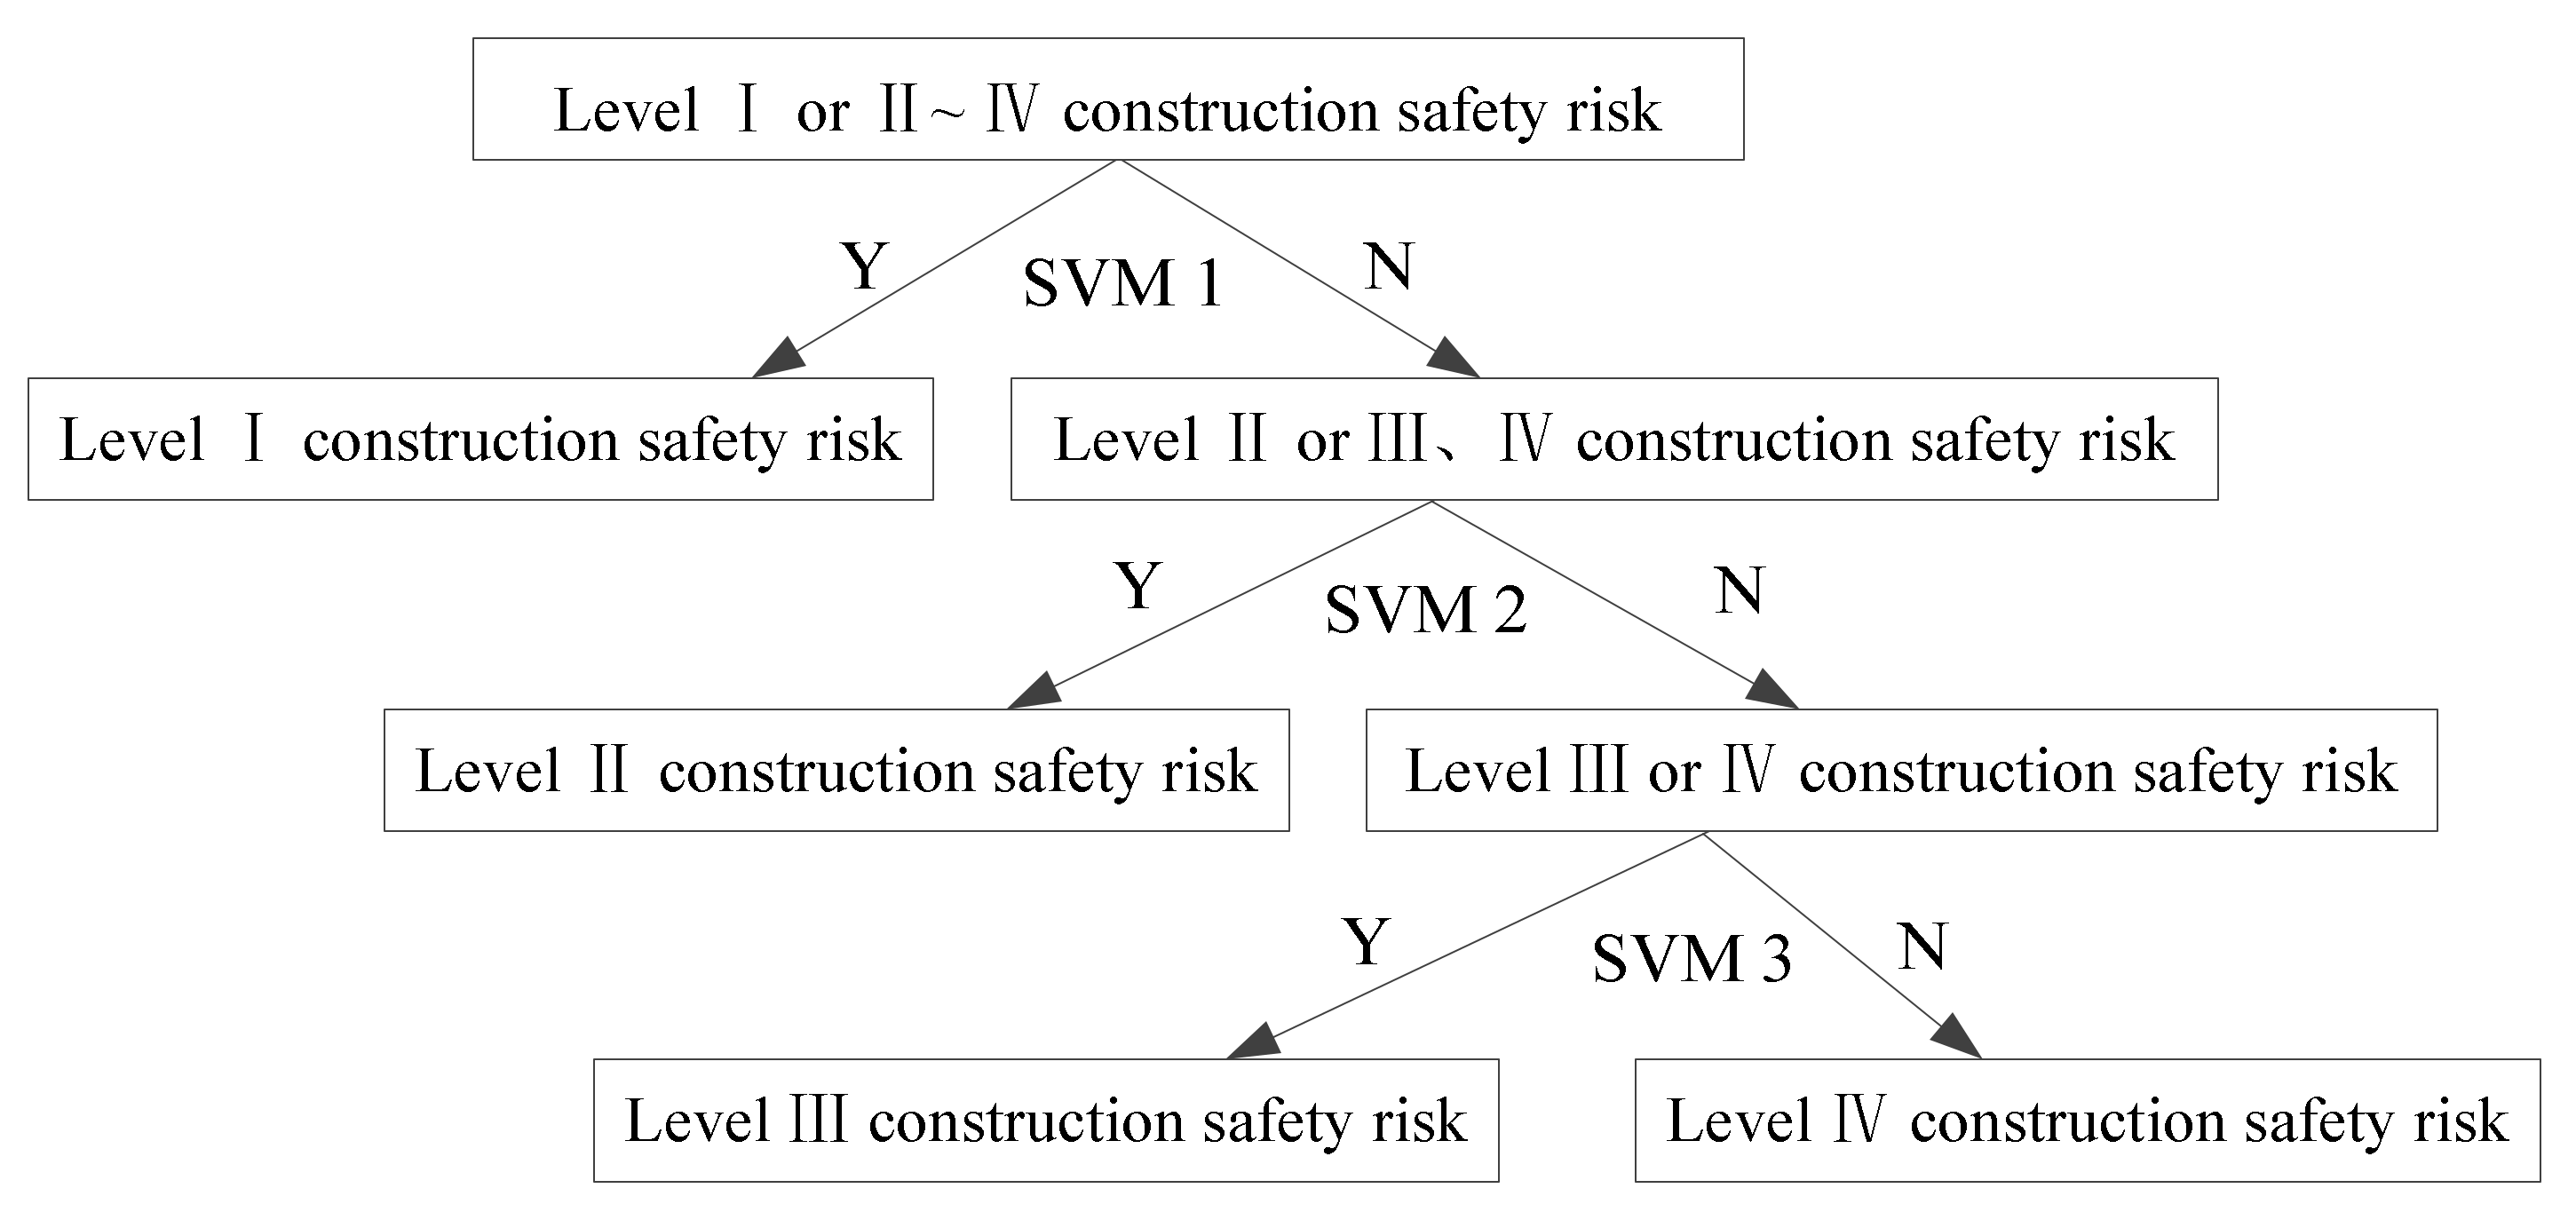
2.2. The Multi-Classification Support Vector Machine (SVM) Prediction Model Based on Binary Tree

The classic SVM is mainly designed for binary classification problems and cannot be directly used for multiclass classification problems. However, there are several levels of safety risk prediction for metro construction, and the binary classifier cannot meet the requirements of prediction. Therefore, this study uses the binary tree to solve multiclass classification problem. The principle is to divide all categories into two sub-classes by constructing a binary tree and using a single SVM to do binary classification each time; then a sub-class is divided into two sub-sub classes, which continues until all nodes contain only a single category. For N class classification problems, the method needs N 1 binary classifiers to distinguish from the SVM of the root node in turn. According to the specific classification problem, binary tree algorithms can be divided into complete binary trees and partial binary trees [69], as shown in Figure 2. In Figure 2b, the sorting order of the classifier in the partial binary tree is 1, 2, 3, and 4; since there are 4 categories, corresponding to 4 structures respectively.
In the partial binary tree structure, we assume that the correct rate of each layer is p 1 , p 2 , , p k . If the correct rate of class division is 1, the classification accuracy of all categories is:
S V M 1 = p 1 S V M 2 = p 2 S V M k 1 = S V M k = p 1 × p 2 × × p k
From Equation (7):
S V M 1 > S V M 2 > > S V M k 1 = S V M k
It can be found from Equation (8) that the deeper the binary tree classifier is, the lower the recognition accuracy. Only by making the shallow SVM recognize correctly can improve the performance of the deep SVM. Therefore, in the binary tree structure, the classification nodes usually play a more important role. According to this fact, a safety risk classification and prediction model based on a binary tree SVM is designed, as shown in Figure 3.
It can be found from Figure 3 that the safety risk level of metro construction is high and is in the upper node. The structural design of this binary tree classifier is mainly based on two aspects: (1) the higher the safety risk level of the metro construction, the greater the loss caused by an accident. However, the recognition accuracy of the binary tree classifier decreases with the increase of depth; therefore, it is a priority to identify the level I safety risk, which is the most critical and has the largest loss, to ensure the accuracy of identification.
The prediction model of SVM metro construction for the safety risk classification of the binary tree includes three binary classifiers of SVM, and each SVM classifier determines a category: (1) training the predictive model—firstly, the collected construction safety risk samples of Class I are taken as the positive class of the first sub-classifier, which are identified as 1. Then, the remaining three types of sample sets are combined as the negative class of the first sub-classifier, which are identified as –1, and the training classifier is SVM 1; (2) the second-level construction safety risk sample from the remaining three types of samples is selected as the positive class of the second sub-classifier, whose category is identified as 1, and the remaining class II and class III samples are combined as the negative class of the second sub-classifier, which are identified as –1, and the training classifier is SVM 2; (3) the third sub-classifier SVM 3 is established to complete the construction of the binary tree SVM.

2.3. Parameter Optimization of SVM Model Based on Particle Swarm Optimization (PSO)

The SVM model has a good ability to solve small-sample, high-dimensional and non-linear problems. However, the choice of kernel function parameter g and the penalty parameters c of the SVM model have important influences on the accuracy of the SVM model. The different types of kernel functions determine the different properties of the SVM model. In the present work, kernel functions, such as linear kernel, polynomial kernel, sigmoid function and RBF are commonly used for SVM modeling [70]. With the wide convergence domain, the RBF has the advantage of being able to approximate an arbitrary non-linear and high-dimensional computation function, so it is the most widely used kernel function. Besides, RBF is a prior selection, since it effectively reduces complexity for inputs by only adjusting c and g [71].
In the SVM–RBF model, the appropriate model parameter setting has a heavy impact on the classification accuracy of the SVM model [72]. The penalty parameter c represents a “degree of punishment” that controls the sampling error. If the value of c is large, model may suffer from overfitting problem, that is model can fit training data well but perform poorly on other unseen data. If the value of c is small, the complexity of the model is reduced, and the model’s generalization ability may be improved but may also suffer from underfitting problems. The parameter g of the kernel function represents the width of the RBF kernel function, and the larger value of g , the higher correlation between the support vectors. Therefore, c and g affect the performance of SVM together. Only by constantly adjusting the model parameters to achieve the best combination of model parameters can the SVM machine-learning ability and regression prediction effect be improved. Therefore, the penalty parameters c and kernel parameters g should be optimized.
The traditional methods of SVM parameter selection are generally the cross validation method and grid search method. These two methods have some limitations of low efficiency, low precision, and the search parameters cannot be optimized. PSO has the advantages of a simple algorithm structure, such as high precision, fast convergence speed and strong global search ability. PSO is an algorithm developed in recent years, and it was inspired from the feeding behavior characteristic of a bird flock, which is used for solving optimization problem. PSO was first proposed by Kennedy and Eberhart [73]. In PSO, each particle represents a potential solution to the problem. The common feature of the particle is represented by position, speed and fitness value. Each particle updates the position and speed in the next iteration by tracking the fitness extreme value. The fitness extreme value mainly includes the individual extreme value P b e s t and the global extreme value g b e s t . The position of the particle’s previous best performance in a vector called P b e s t , and the g b e s t value is tracked by the particle swarm optimizer. The fitness value can be calculated through the fitness function, which can estimate the merit of the particles. After discovering P b e s t and g b e s t , PSO identifies the speed and distance of each particle [56].
PSO has the advantages of a simple algorithm structure, such as high precision, fast convergence speed and a strong global search ability. It is widely used in data optimization and data mining. This research adopts the PSO to search and optimize the kernel parameters and penalty factors of the SVM model instead of the traditional parameter optimization method [74]. By constructing the PSO–SVM prediction model, the learning ability and prediction effect of the safety risk-prediction model of metro construction are improved.
In the D–dimensional space, the space vector X i = X i 1 , X i 2 , , X i D T is represented as the i t h particle, where i = 1 , 2 , , n , X i is the position of the i th particle and a possible solution.
The velocity and position of the particles are iterated to obtain the equation as follows [75]:
V i d k + 1 = ω V i d k + c 1 r 1 P i d k X i d k + c 2 r 2 P g d k X i d k X i d k + 1 = X i d k + V i d k + 1
where: k is the k t h iteration; V i = V i 1 , V i 2 , , V i D is the velocity of the i t h particle, and P i = P i 1 , P i 2 , , P i D is the optimal position of this particle. The optimal swarm position is P g = P g 1 , P g 2 , , P g D . Under the condition of the i t h particle at the k t h iteration, X i d k + 1 and V i d k + 1 are the d t h location and speed component. Parameters c 1 , c 1 , r 1 , and r 2 are the random number, the range is 0 to 1, and ω is the inertial weight of the PSO algorithm.
The process of using PSO parameters for optimization is as follows:
(i) The population is initialized. The population size, the maximum number of iterations of the population, the penalty factor c and the optimization range of the kernel parameter g are set. The learning factors c 1 and c 2 are adopted by the linear learning strategy. The inertia weight ω is adopted by the linear decreasing strategy.
(ii) The position x i 0 and velocity v i 0 of the initial particles within the allowed range are generated randomly.
(iii) Fitness calculation: the fitness value is the mean squared error (MSE) when cross-checking the training set.
(iv) The fitness value f i of the current position of each particle in the population with the individual extreme value P b e s t is compared; if f i < P b e s t , then P b e s t = f i , otherwise f i remains unchanged.
(v) The individual optimal value P b e s t of each particle in the population with the population global extremum is compared; if P b e s t < g b e s t , then g b e s t = P b e s t , otherwise g b e s t remains unchanged.
(vi) If the termination condition is satisfied, the iteration is stopped and the positional parameters of the optimal particle are output, that is, the optimal penalty coefficient c of the SVM and the kernel function parameter g are output, otherwise steps iii–vi are repeated.

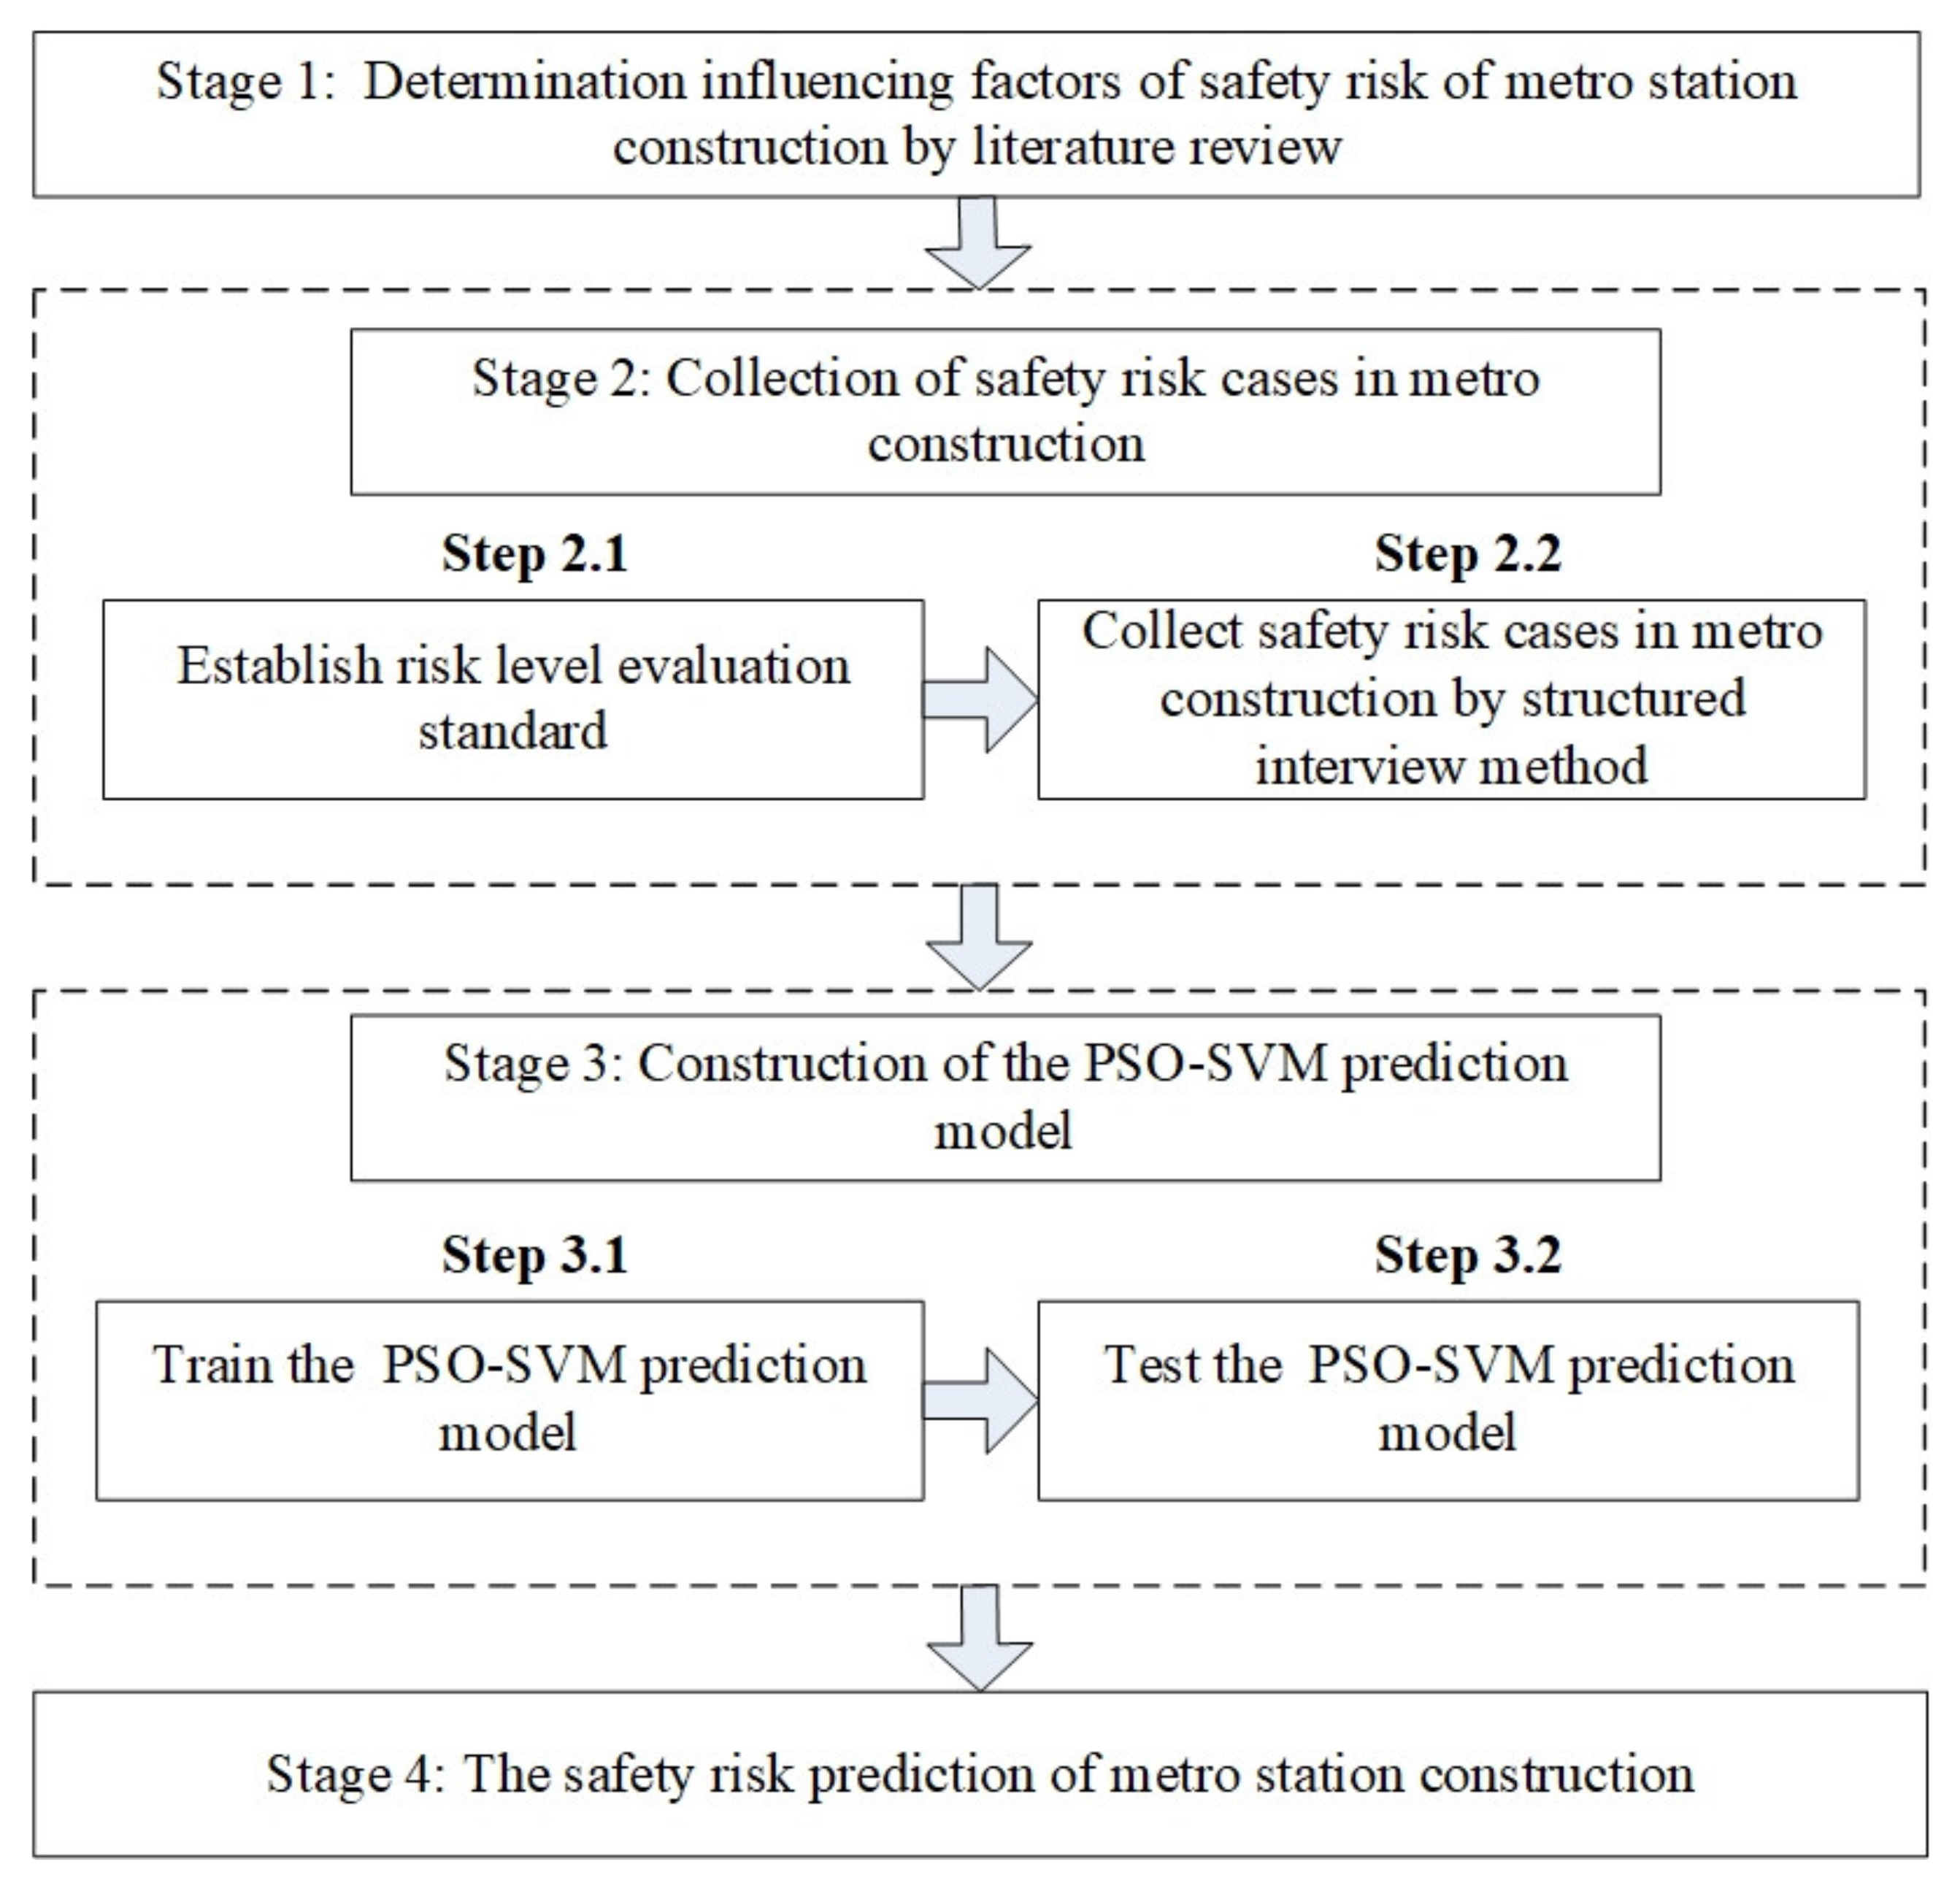
3. Framework for Safety Risk Prediction of Metro Station Construction

In this section, a hybrid risk-prediction framework for metro station construction is presented by using the PSO-SVM prediction model. The flowchart of this framework is presented in Figure 4. First, the literature review and code of construction safety management analysis methods are used to identify the influencing factors of safety risk in metro station construction. Second, a structured interview is used to collect safety risk cases of metro construction projects. Then, the PSO–SVM model is constructed to predict the safety risk. Finally, the proposed framework is applied to a case study of metro station construction.

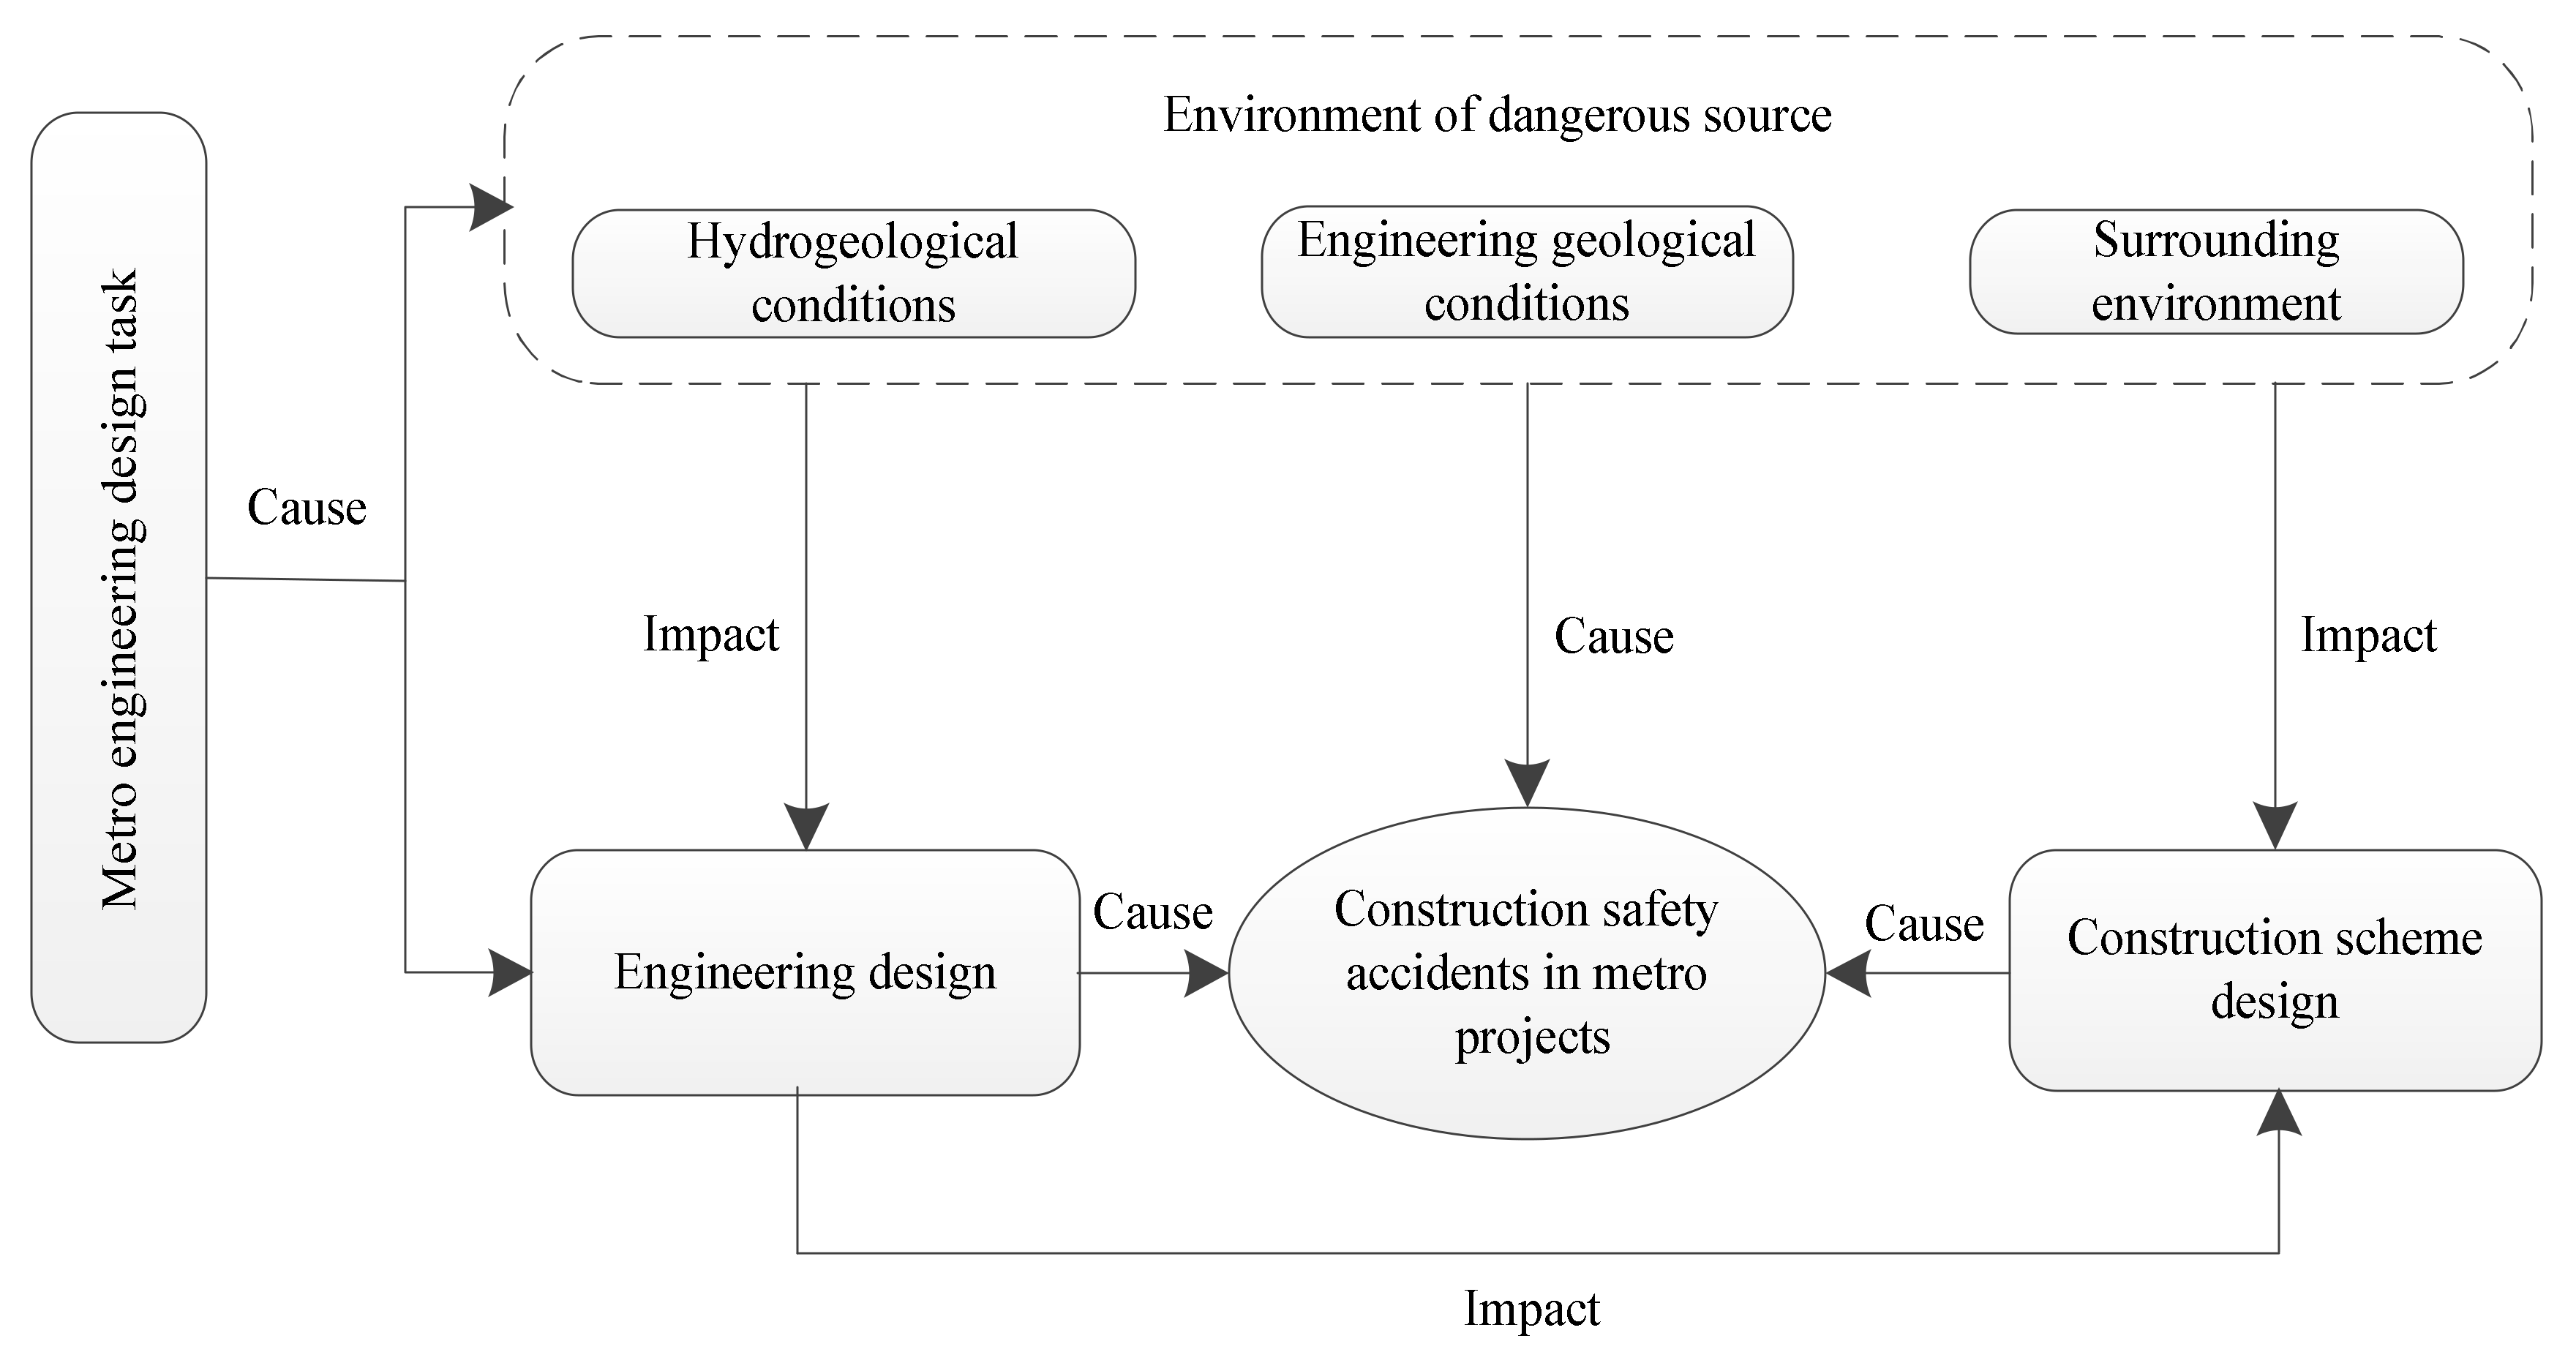
3.1. Stage 1: Identify the Influencing Factors of Safety Risk in Metro Construction

In order to obtain the influencing factors of metro construction safety risk more comprehensively, the relevant core influencing factors are selected from the existing construction safety management standards, specifications and literature analysis.

3.2. Stage 2: Collection of Safety Risk Cases in Metro Construction

Due to the complexity of the metro construction process, the related safety risk influencing factors frequently cannot be measured directly; the research data can only be obtained indirectly. Therefore, an expert interview method is adopted to collect construction safety risk cases. The expert interview is mainly divided into structured interviews and semi-structured interviews. The difference mainly lies in the degree of the researcher’s control over the interview process. Structured interviews usually use questionnaires which are uniformly designed and structured, while semi-structured interviews can be adjusted in time according to the actual situation of the interview, and there is no strict interview outline. The main purpose of the investigation is to sort out the evaluation of risk events by experts in the process of metro station construction to form expert experience samples, to analyze the relationship between risk events and identified influencing factors, and to provide case samples for safety risk prediction of metro construction. Therefore, the structured interview method of experts filling in the questionnaire is adopted in this research to carry out the investigation. In order to ensure the reliability of the collection of safety risk cases in metro construction, experts (project employers, contractors, and supervisors) who were engaged in long-term safety management works in metro construction were invited to fill out the questionnaire. All of experts had over 10 years of working experience and participated in more than five metro station construction projects. The above research provides sample data for subsequent construction safety risk-prediction research.

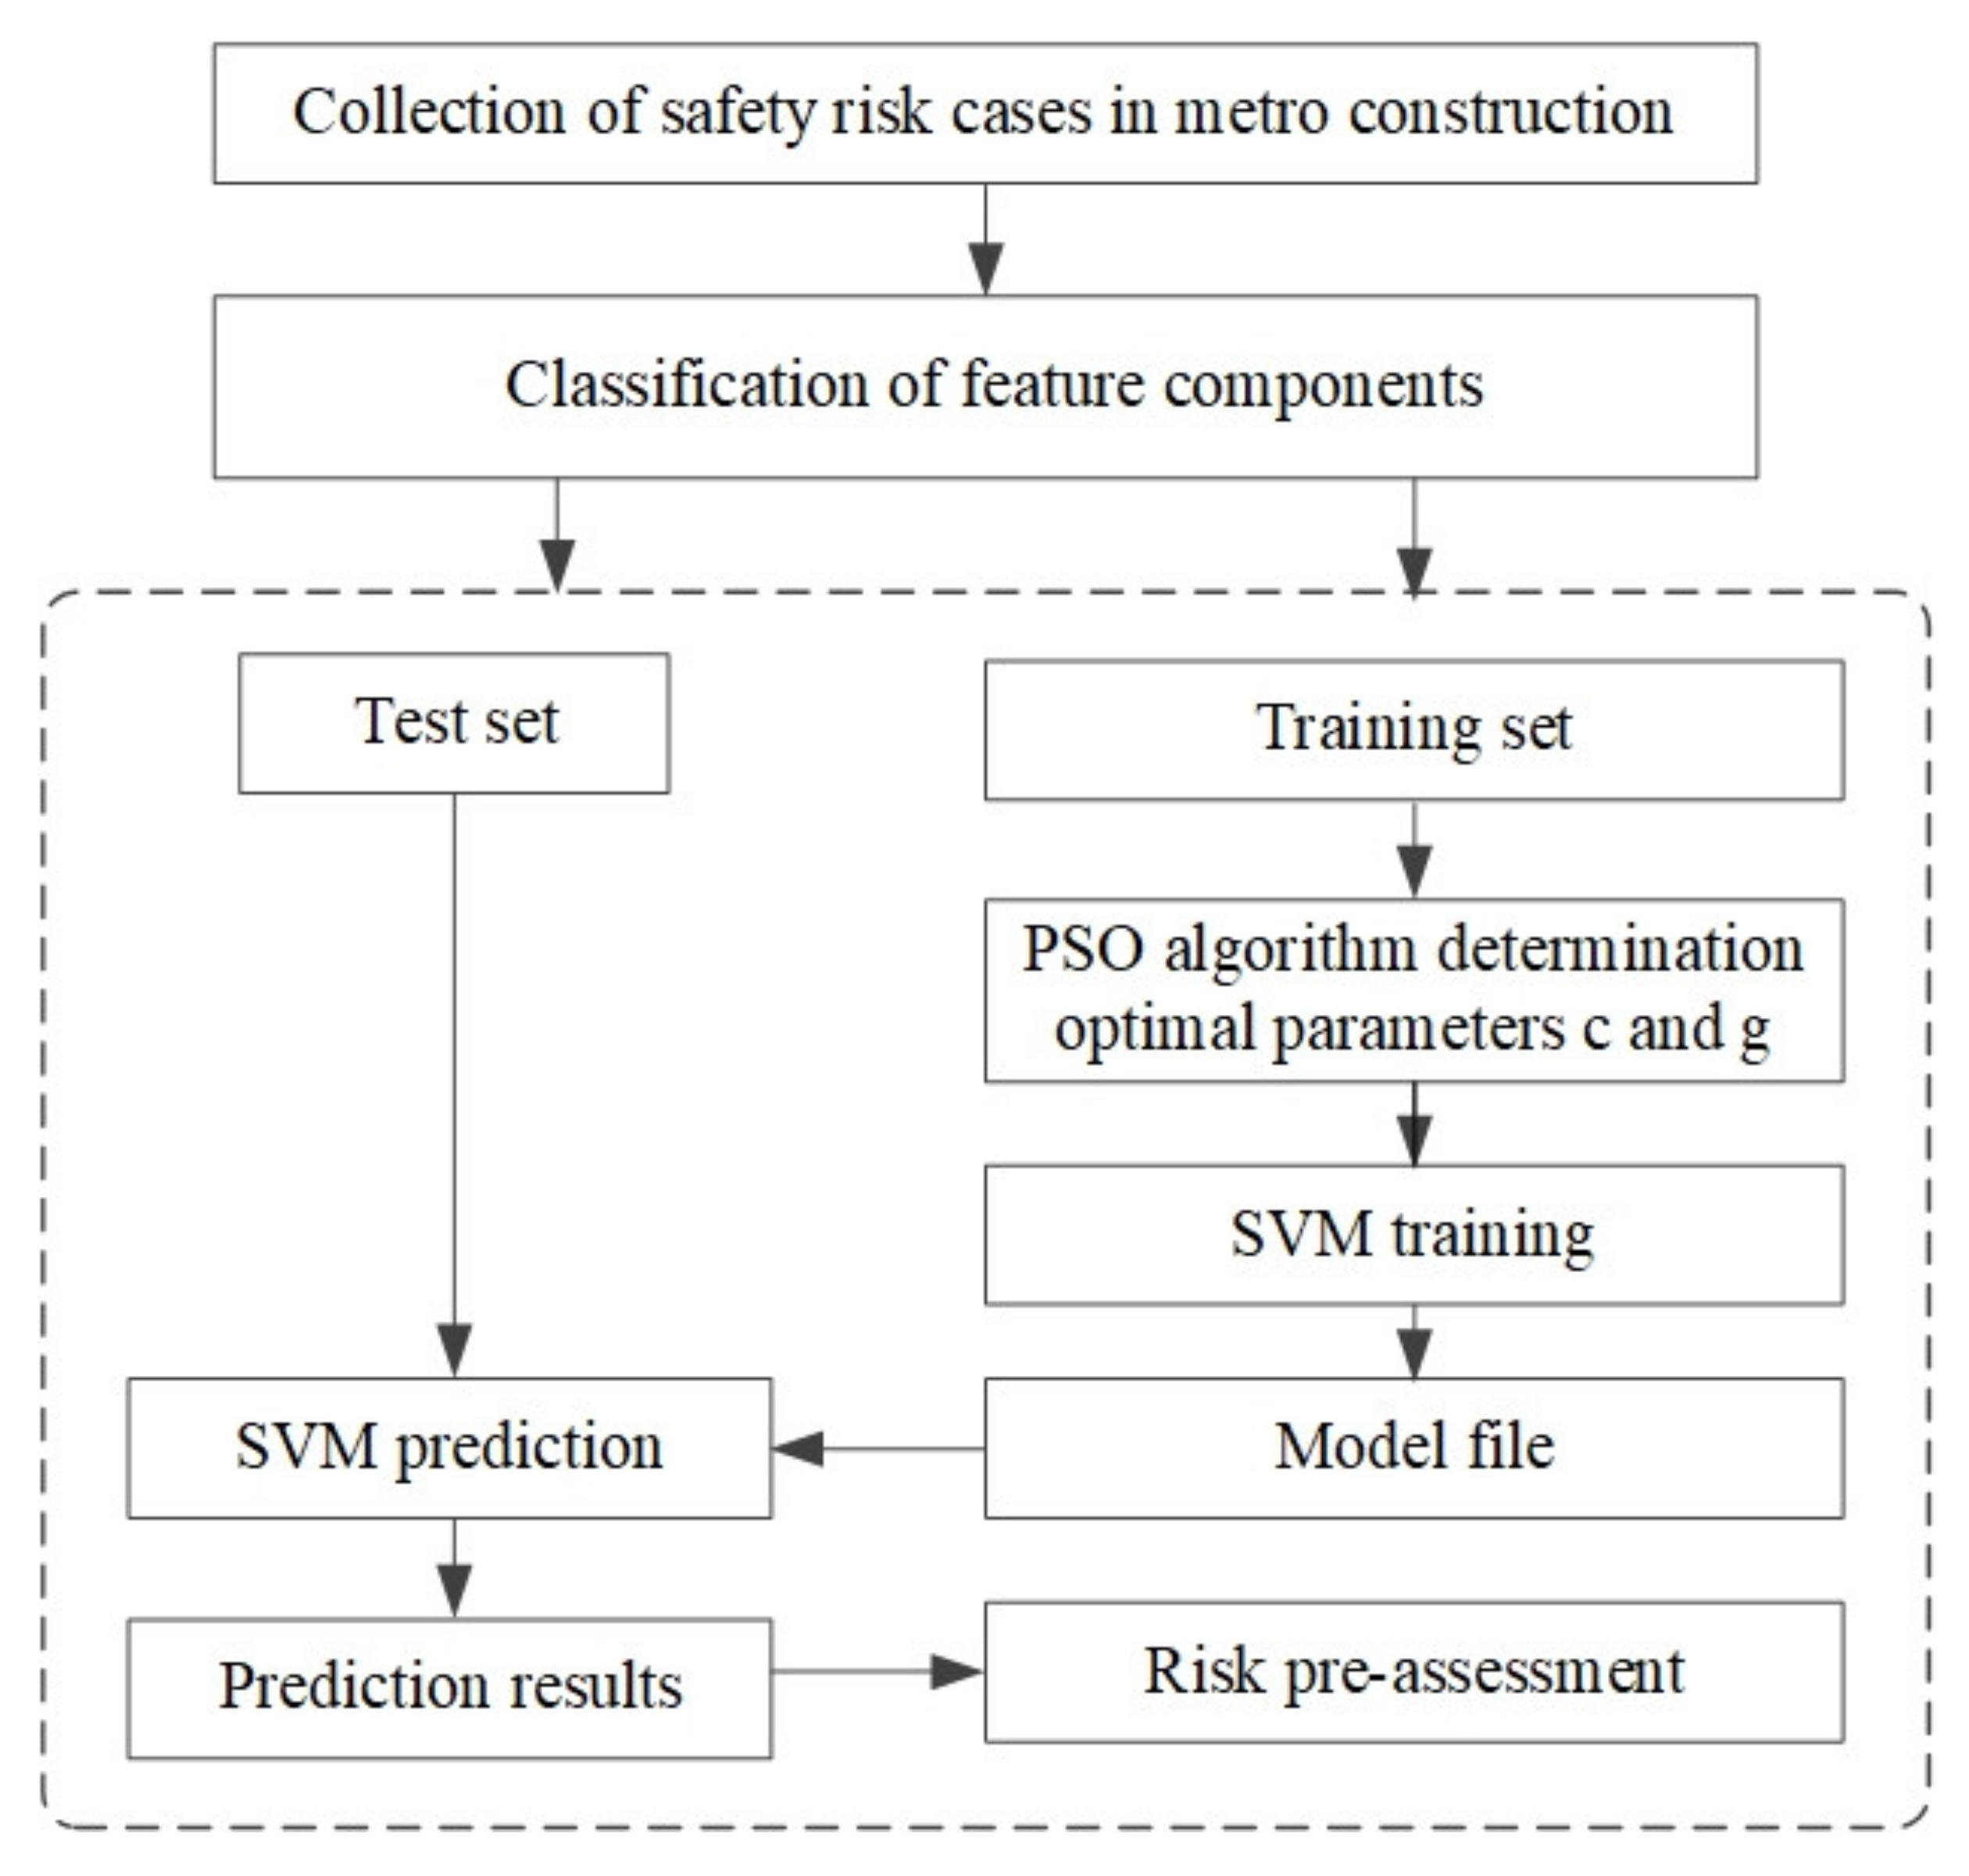
3.3. Stage 3: Construction of the PSO–SVM Prediction Model

The establishment of the safety risk-prediction model of metro construction mainly includes training and testing. Firstly, safety risk cases are collected as sample data; then, the processed data samples are selected randomly as training sets, and the remaining samples are used as test sets. Secondly, the PSO algorithm is used to optimize the model parameters, which can be derived according to Equation (9), and the training set is used to learn the SVM model. Finally, the accuracy of the prediction ability of the model is tested by comparing the test results with the original data. The flow chart of the safety risk intelligent prediction model of metro construction is shown in Figure 5.

3.4. Stage 4: The Safety Risk Prediction of Metro Station Construction

If the training sample classification accuracy of the constructed PSO–SVM prediction model is relatively high, it shows that the PSO–SVM model has a relatively high accuracy for the training set and the testing set model. The PSO–SVM model can make a more scientific prediction for the safety risk of metro construction. According to the sample classification accuracy of Stage 3, it is determined whether to use the PSO–SVM prediction model constructed in this paper to predict the safety risk of the specific metro station construction project.

4. Case Study

4.1. Determination of Influencing Factors of Safety Risk in Metro Station Construction

The code of construction safety management is a summary of construction safety management after years’ experience. Therefore, code reading and review is an effective way to acquire factors (see Table 1). The main code of construction safety management issued by mainland China were mainly used in this research, and the scope was appropriately expanded; meanwhile, the relevant laws and regulations of Hong Kong, Singapore, Japan, and other regions or countries were referenced as shown in Table 1. Then, based on the in-depth analysis of the relevant literature on the influencing factors of safety risk in construction (especially metro engineering), the influencing factors that were generally considered to be more important in most studies were extracted, as shown in Table 2.
Hydrogeology, engineering geology and surrounding environment are important basic data in the process of metro construction. The uncertain factors such as complex surrounding environment, hydrogeological conditions, and engineering geological conditions constitute the dangerous source environment of the construction safety risk, which is the original factor impact of the safety risk of metro construction [76]. Because the dangerous source environment provides technical parameters for design scheme, the uncertainty of environment of dangerous sources will have an impact on the engineering design and the construction scheme design. In addition, if the dangerous source environment is handled improperly in the construction process, it will directly cause safety accidents. The main basis of the metro construction process is the design scheme. It can be said that the safety hazard is also designed [77]. Therefore, engineering design defects or errors will directly cause safety risks. According to the process of engineering design → construction scheme design → implementation scheme, engineering design is the basis of construction scheme design. Therefore, the engineering design will have an impact on construction scheme design. The relationship between the factors is shown in Figure 6. Accordingly, influencing factors were identified from the dangerous source environment, project design scheme and construction scheme design in this research. According to these three dimensions, the influencing factors of safety risk were identified. Therefore, the influencing factors of metro construction safety risks are shown in Table 2.

4.2. Collection of Safety Risk Cases in Metro Construction

During the interview process, in order to ensure that the experts can make more accurate judgments on the content of the interviews, the content of the options were depicted and described in the questionnaire, and an expert judgment reference was designed. For example, the respondent can make a judgment on the construction safety risk level according to the risk-level standard in the “Guidelines for Risk Management of Urban Rail Transit Underground Engineering Construction” (GB50652-2011), as shown in Table 3.
A Likert five-point system was used to measure safety risk influencing factors, and a corresponding judgment basis was designed. The corresponding judgment basis for the influencing factors that can be quantitatively measured was referenced. According to the rules on the relationship between the safety level of the foundation pit and the thickness of the soft soil layer [91,92], the measurement basis of influencing factors on the soft soil layer thickness is shown in Table 4.
For qualitative influencing factor indicators, the judgment basis can be formulated according to the meaning of the indicators. For example, if the design scheme of monitoring and measurement fully meets the monitoring layout, monitoring accuracy and design requirements, a score of 5 will be given; otherwise, a score of 1 will be given, as shown in Table 5.
Because the interviewees directly affect the reliability, comprehensiveness and effectiveness of safety risk cases obtained for the metro construction, only interviewees who have at least 10 years of safety management experience in metro construction projects were included when selecting interviewees. The interview questionnaire was divided into three parts: the first part was the basic information of the interviewees, including the work unit, present assignment, professional title, educational background, years engaged in metro construction and project location, etc.; the second part was that interviewees who had participated or interviewees who were participating made a judgment on safety risk events of the metro station construction, such as risk type and risk level; and the third part was that interviewees made a judgment on the related safety factors aimed at construction safety risk events—for example, whether the hydrogeological condition and the selection of a support scheme were reasonable.
After the structured questionnaires of 70 experts were sorted, it was determined that there were two questionnaires in which experts believed that the safety risk events had nothing to do with the influencing factors identified. Excluding the two questionnaires, a total of 68 case samples were obtained. The safety risk categories and grades in metro station construction are shown in Table 6.

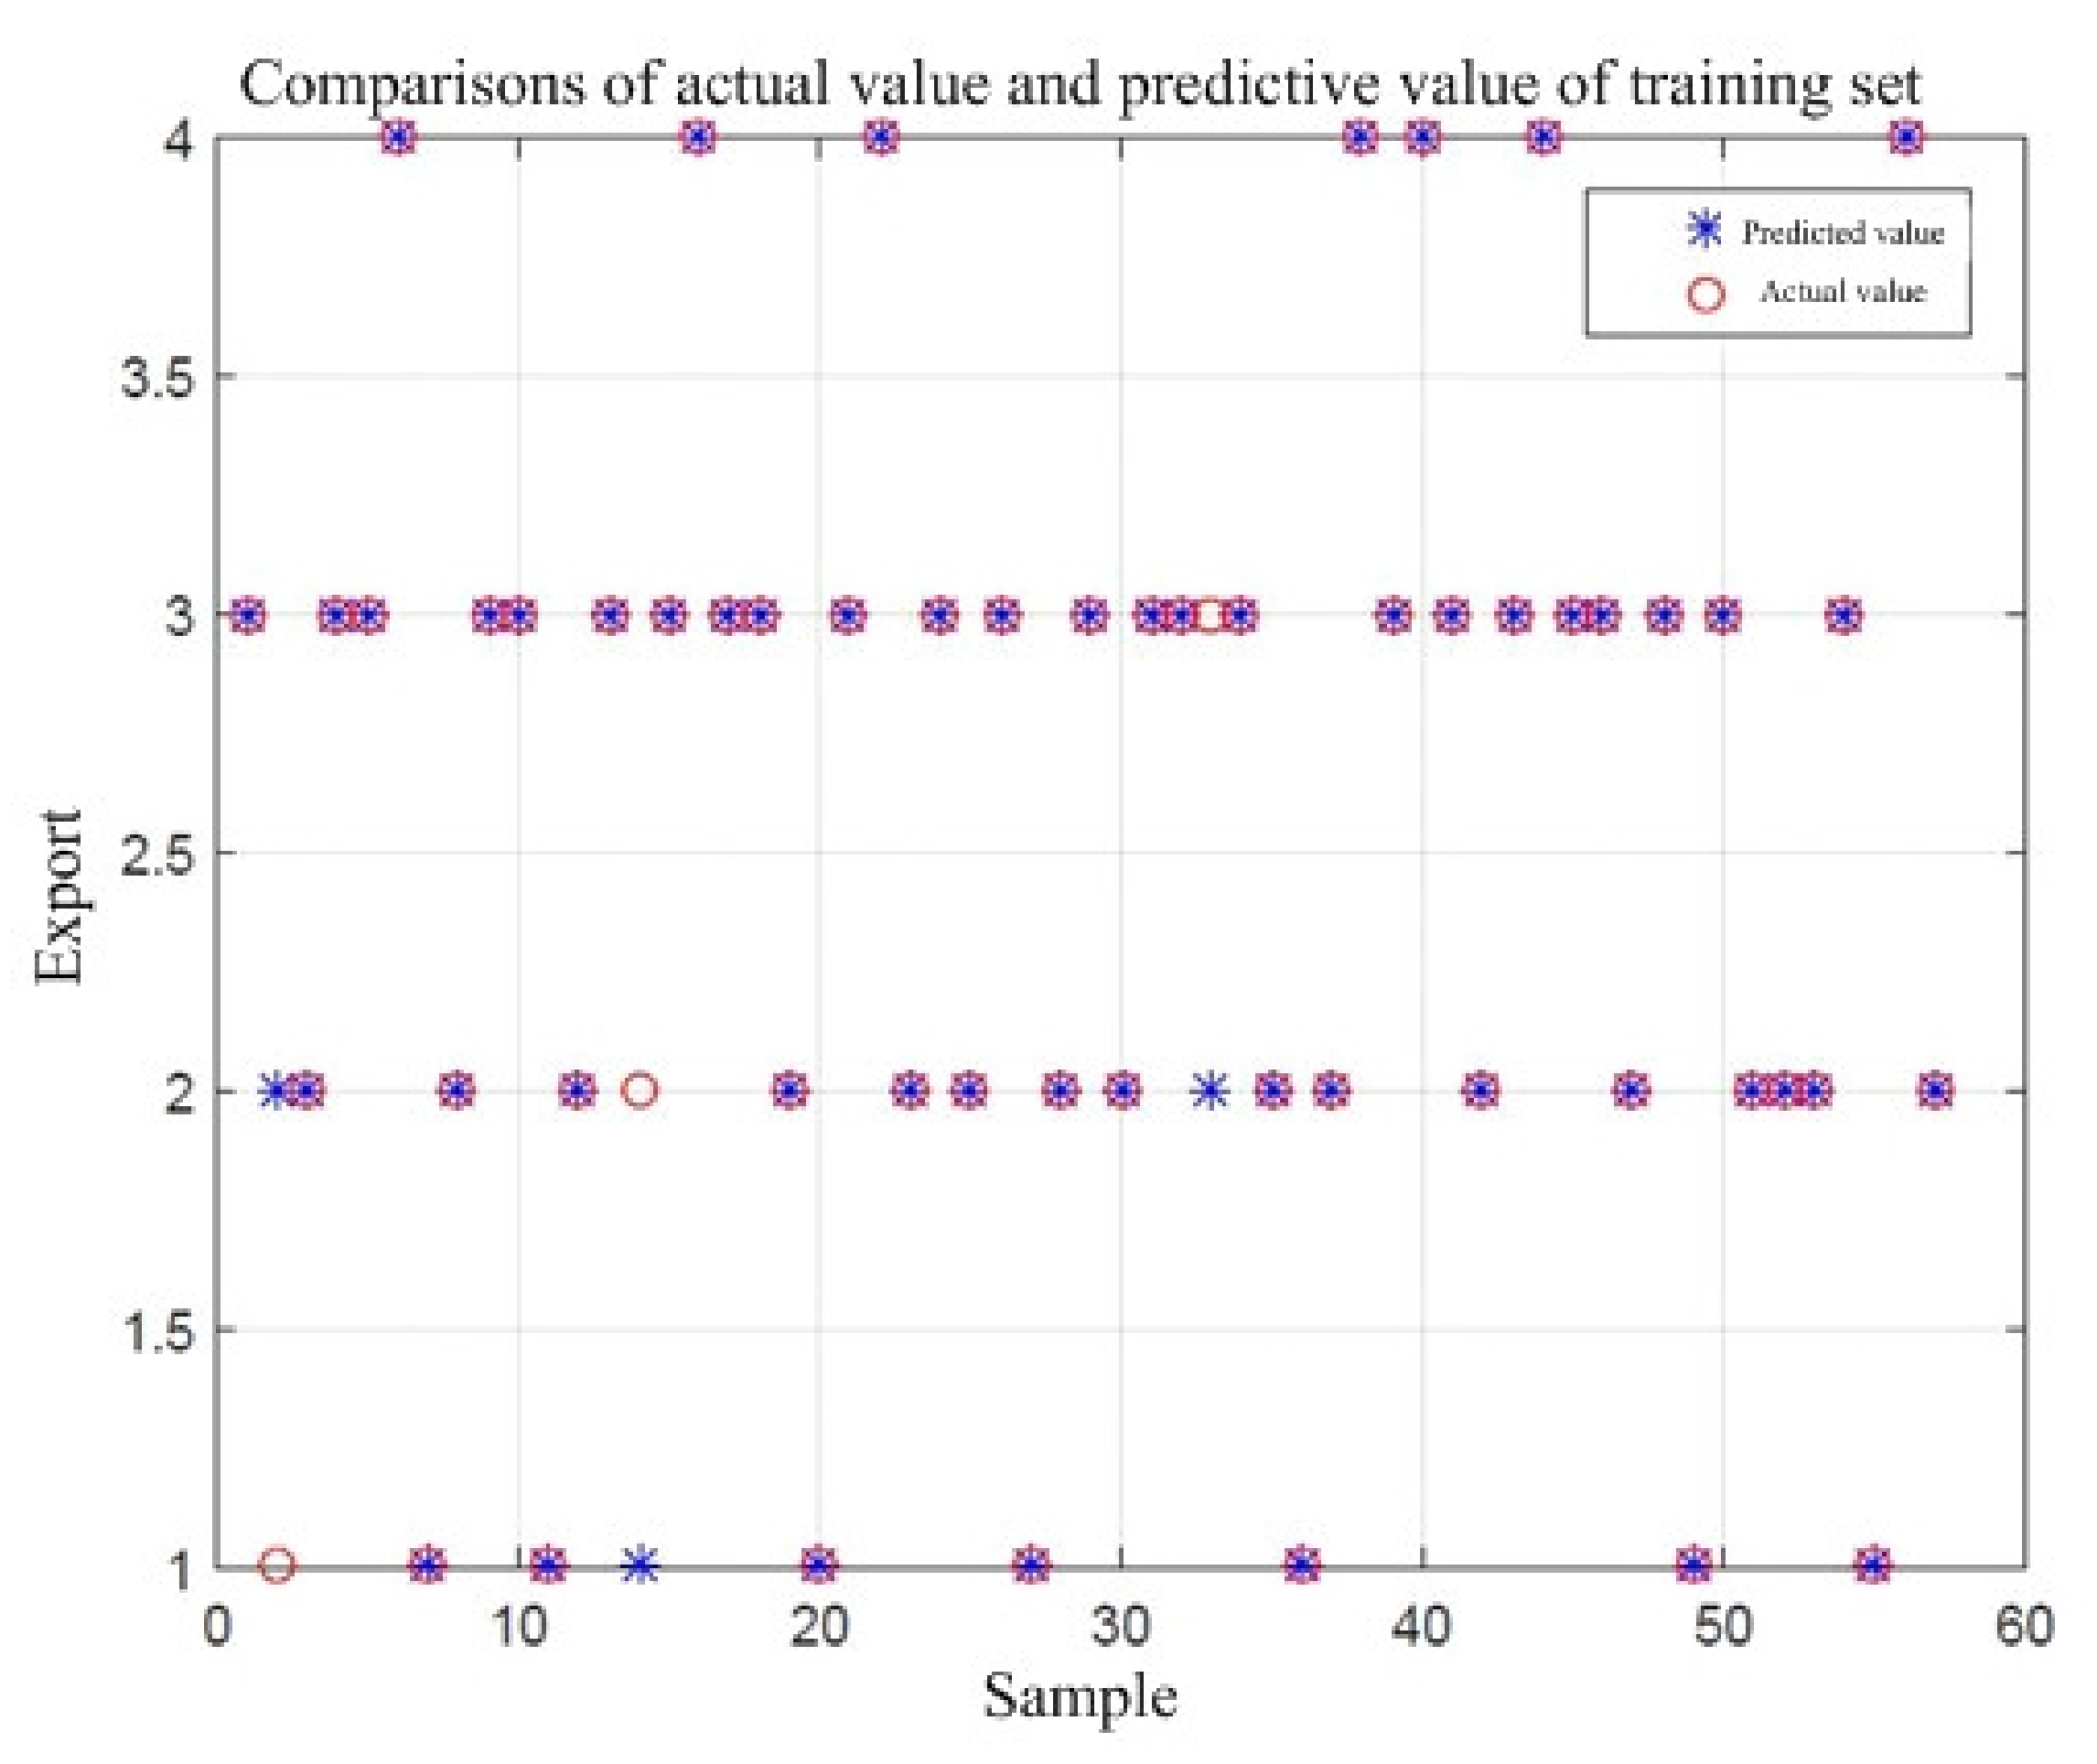
4.3. Construction of the PSO–SVM Model

As mentioned above, a total of 68 case samples were collected in the construction of the safety risk-prediction model of the foundation pit instability damage of metro station engineering. In this case study, 57 group samples were selected randomly as training samples and 11 group samples were used as testing samples to train and test the PSO–SVM model. The sample data are shown in Table 7.
According to the sample data of the base pit instability and safety risk-prediction model in Table 8, the MATLAB (2014b) (MathWorks, Natick, USA) and LIBSVM (Version 3.22) toolbox were used to implement the SVM model according to the construction process. When the PSO–SVM algorithm program was written, the initial parameters of the model were set. The 2011 Standard PSO with 20 particles and 50 iterations was used [93]. In this paper, the feasible range of value was extended, and the value of particles was set as 20 and the maximum iteration number was k max = 100 . Because of a lack of references of optimal g and c , the value range should be enlarged [94]. So the value range of g was g 2 8 , 2 8 and c was [ 0.1 , 100 ] . In PSO, the learning factor was a random number between 0 and 2. In this paper, the learning factors were c 1 = 1.5 , c 2 = 1.7 [95]. In addition, the criterion for parameter evaluation was the minimum root mean square error (MSE). The machine environment was a i5-2430M central processing unit (CPU) 2.40 GHz, with 4.0 GHz memory and running on the Windows 7 operating system. After initialization, the calculation program was processed to read the sample data of the training set. The penalty parameter c = 26.70 and kernel parameter g = 0.039 of SVM were obtained.
The sample data of the foundation pit instability failure category were put into the LIBSVM toolbox in the MATLAB program; then, the optimal ( c , g ) parameter combination was searched by the PSO, and 57 randomly selected sample data were trained to obtain a training model. The comparison between the actual and predicted values in the training set is shown in Figure 7. In Figure 7, x-axis represents the sample size of training set, and y-axis is the class value of safety risk level. Then, the regression prediction was made for the test data of 11 groups of randomly selected test samples. The comparison between the actual value and the predicted value is shown in Figure 8.
From the results of the operation in Figure 7, it can be found that, among the 57 training samples, three predicted values of samples do not overlap with the actual value. Therefore, the classification accuracy of the training samples of the SVM prediction model after parameter optimization is 94.74% (54/57). From the results of the operation in Figure 8, it can be found that in the 11 test samples, the predicted value and the actual value of sample 8 do not overlap. Therefore, the classification accuracy of the test sample is 90.91% (10/11). This shows that both the training set and the test set model have high accuracy. The PSO–SVM model can make a scientific prediction on the safety risk level of the foundation pit instability damage. On the other hand, the influencing factors in the model are all from the statistical analysis of expert knowledge, which also verifies the rationality of the integration of expert knowledge in the SVM prediction model.

4.4. Safety Risk Prediction of the Metro Station Construction

Station D was the transfer station of lines 1 and 2 of urban rail transit in a Chinese city. The main length of the station was 683.1 m, the width of the standard section was 41.30 m, the maximum width was 52 m, the buried depth of the structural floor was about 17.02 m, and the thickness of the roof was about 3.0 m. It was a two-story double island station on the ground floor. The total construction area of the station was 58,150 m2.
This study predicted the safety risk of the project in the construction preparation process of station D. Five safety managers, including the project leader and the safety supervisor of the construction unit, the chief project manager, the safety supervisor of construction enterprise and the safety director of supervision enterprise, referred to the quantitative standard of the influencing factors to quantify the two influencing factors of the metro station (the stability of the foundation pit and the safety risk of the construction). According to the comprehensive expert opinions, the quantitative results of safety risk influencing factors are shown in Table 8.
From the comparison of Figure 7 and Figure 8, it can be found that the prediction accuracy of the PSO–SVM model is high. In order to overcome the influence of SVM model random samples in this research, the original case samples were repeated under random samplings. Then different random training samples were constructed, and the SVM model was used to observe the difference of test accuracy. In this paper, 57 case samples were selected randomly as training data, the remaining 11 case samples were selected as verification data. The accuracy of test sets based on 10 random samplings are shown in Table 9. It can be found that the accuracy of the training and test sets of the PSO–SVM model has a high predictive accuracy for non-linear relationship and small samples. Meanwhile, the relevant safety risk influencing factors (Table 8) were loaded into the prediction model, and the calculation results are shown in Table 9. From Table 9, it can be found that the prediction of instability and damage of the foundation pit of station D is predicted to be a class II of safety risk, which is relatively high.

4.5. Results and Discussion

4.5.1. Single-Factor Dynamic Adjustment Analysis

From the results of influencing factors of instability and failure safety of the engineering foundation pit, it can be found that the quantitative results of poor geological distribution (C2) and construction precipitation design (C10) are 2, and the quantitative result of the excavation depth of the foundation pit (C6) is 1, which are relatively low. Under the condition that the results of other influencing factors remain unchanged, the three factors with lower adjustment values were adjusted continuously. Then, the PSO–SVM prediction model was used to calculate the change of safety risk-prediction level. The complex coupling relationship between influencing factors and construction safety risk was uncovered and the most important influence on construction safety risk factors was identified, as shown in Table 10.
From Table 10, it can be found that under the condition that the quantitative results of other influencing factors remain unchanged, the safety risk of instability and failure of the foundation pit of the station project does not change after the quantitative results of poor geological distribution (C2) are adjusted from the original value 2 to 3. After the quantitative results are adjusted from the original value of 2 to 4, the level is reduced from level II to level III. The quantitative result of the excavation depth of the foundation pit (C6) is adjusted from the original value of 2 to 3 and 4, which does not affect the safety risk of foundation pit instability and failure. The quantitative result of the construction precipitation design (C10) is adjusted from 2 to 3, and the safety risk level of foundation pit instability and failure is reduced from II to III.

4.5.2. Multi-Factor Dynamic Adjustment Analysis

In this study, the three influence factors of poor geological distribution (C2), excavation depth of foundation pit (C6) and construction precipitation design (C10) are used to study the change of construction safety risk-prediction level under different combinations. The calculation results are shown in Table 11.
It can be seen from Table 11 that, in the C2 + C6 combination, adjusting the C2 quantification result from the original value 2 to 3 and adjusting the C6 quantification result from the original value 1 to 2, the foundation pit instability and failure safety risk of the station project do not change. If we adjust the quantitative results to 4 and 2, respectively, the safety risk level of foundation pit instability and failure is reduced from level II to level III. In the combination of C2 + C10, adjusting C2 and C10 from the original value of 2 to 3, the safety risk level of foundation pit instability and failure is reduced from the original level II to level III. In the C6 + C10 combination, adjusting the C6 quantification result from the original value 1 to 2 and adjusting the C10 quantification result from the original value 2 to 3, the safety risk level of foundation pit instability and failure is reduced from level II to level III. If we adjust the quantitative results to 3 and 4, the safety risk level of foundation pit instability and failure is reduced from the original level II to level III. Therefore, the combination of poor geological distribution (C2) and construction precipitation design (C10) is most favorable to reduce the construction safety risk level of the station, while the combination of poor geological distribution (C2) and excavation depth of foundation pit (C6) is most unfavorable to reduce the construction safety risk. The most effective way to reduce the construction safety risk is to design a reasonable construction precipitation scheme.

5. Conclusions

Design of Safety (DFS) is one of the most effective ways to consider safety risks in the design process, which is regarded as a risk-prevention technique for metro station construction. In order to improve the effectiveness of the application of DFS in metro station construction, it is useful to incorporate the risk-prediction procedure into the DFS. Therefore, a comprehensive framework is proposed by using the PSO–SVM model to predict the safety risk of metro station construction in this study, which provides a valuable guideline for safety risk prediction in metro station construction and provides a useful reference for engineers and managers in the design process. Firstly, 12 influencing factors related to the safety risk of metro construction are identified by using the literature review and code of construction safety management analysis. Then, the structural interview method is used to collect the safety risk cases of metro construction. Next, the PSO–SVM model is presented to predict safety risk in metro construction, in which the multi-class SVM prediction model with an improved binary tree is designed. Finally, an illustrative example is used to demonstrate the efficiency of the proposed PSO–SVM approach.
In this study, the classification accuracy of the training samples constructed by the PSO-SVM prediction model is 94.74% (54/57), and the classification accuracy of the test samples is 90.91% (10/11), which show that the training set and the test set models all had high accuracy. In order to overcome the influence of SVM model random samples, the original case samples were repeated under random samplings. Then different random training samples were constructed, and the SVM model was used to observe the difference of test accuracy. The result of test sets based on 10 random samplings was respectively: 81.82%, 90.91%, 71.73%, 90.91%, 100.00%, 81.82%, 90.91%, 71.73%, 81.82%, 90.91%. It can be found that the accuracy of the test sets of the PSO–SVM model has a high predictive accuracy for a non-linear relationship and small samples. In addition, the relevant safety risk-influencing factors were loaded into the PSO–SVM model. The result shows that the foundation pit of station D is predicted to be a class II safety risk, which is relatively high. Meanwhile, after the computation of single and multiple factor analyses, the complex coupling relationship between influencing factors and construction safety risk was uncovered. According to the prediction results, the most important influencing factors to reduce the safety risk of metro station construction were identified, which provides a guideline for the safety risk prediction of metro construction for design process.
Further study will be focused on the following directions: (1) the safety risks of metro construction were mainly focused on the instability of foundation pits in metro station projects in this study, which cannot cover all possible accident types in the process of metro construction. Other types of safety accidents should be investigated and analyzed in future research. (2) The intelligent safety risk prediction of the metro construction in the design process is a relatively new area of research. It is necessary to perform a more in-depth analysis of the influencing factors; for example, the technical parameters in the design process.

Author Contributions

P.L. performed the research framework and wrote the manuscript; J.B. designed the research framework; M.X. and H.L. contributed the methodology; L.S. was responsible for the SVM model section. All authors have read and agreed to the published version of the manuscript.

Funding

This research was funded by the Ministry of education of Humanities and Social Science project (grant number: 18YJCZH148, 18YJCZH166) and the National Natural Science Foundation of China (grant number: 71801082, 71802071).

Acknowledgments

This work has been supported by the Ministry of education of Humanities and Social Science project (grant number: 18YJCZH148, 18YJCZH166) and the National Natural Science Foundation of China (grant number: 71801082, 71802071).

Conflicts of Interest

The authors declare no conflict of interest.

References

  1. Zhong, M.; Zhang, X.; Liu, T.; Wei, X.; Fan, W. Safety evaluation of engineering and construction projects in China. J. Loss Prev. Process Ind. 2003, 16, 201–207. [Google Scholar] [CrossRef]
  2. China. Annual statistical and analysis report of urban rail transit 2018. Urban Rail Transit 2019, 4, 16–34. [Google Scholar]
  3. Qian, Q.; Lin, P. Safety risk management of underground engineering in china: Progress, challenges and strategies. J. Rock Mech. Geotech. Eng. 2016, 8, 423–442. [Google Scholar] [CrossRef] [Green Version]
  4. Li, H.R.; Li, Q.M.; Lu, Y. Statistical analysis on regularity of subway construction accidents from 2002 to 2016 in china. Urban Rapid Rail Transit 2017, 30, 12–19. [Google Scholar]
  5. Simon, H.A. The Sciences of the Artificial; MIT Press: Cambridge, MA, USA, 1969. [Google Scholar]
  6. Cagan, J.; Kotovsky, K.; Simon, H.A. Scientific discovery and inventive engineering design: Cognitive and computational similarities. In Formal Engineering Design Synthesis; Cambridge University Press: Cambridge, MA, USA, 2001; pp. 442–465. [Google Scholar]
  7. Simon, H.A. The Sciences of the Artificial, 3rd ed.; The MIT Press: Cambridge, MA, USA, 1996. [Google Scholar]
  8. Simon, H.A.; Kotovsky, K. Human acquisition of concepts for sequential patterns. Psychol. Rev. 1963, 70, 534–546. [Google Scholar] [CrossRef]
  9. March, S.T.; Smith, G.F. Design and natural science research on information technology. Decis. Support Syst. 1995, 15, 251–266. [Google Scholar] [CrossRef]
  10. Gambatese, J.A. Liability in designing for construction worker safety. J. Arch. Eng. 1998, 4, 107–112. [Google Scholar] [CrossRef]
  11. Manuele, F.A. Prevention through Design (PtD): History and Future. J. Saf. Res. 2008, 39, 127–130. [Google Scholar] [CrossRef]
  12. Xiahou, X.; Yue, Y.; Lu, Y.; Yuan, J.; Qiming, L. Design For Safety: A literature Review. J. Eng. Manag. 2016, 30, 7–12. [Google Scholar]
  13. Storey, N. Design for Safety; Springer: London, UK, 1999. [Google Scholar]
  14. Zemliak, A. Analog system design problem formulation on the basis of control theory. In Proceedings of the 8th IEEE International Conference on Electronics, Circuits and Systems, Malta, 2–5 September 2001. [Google Scholar]
  15. Mao, Y. Design for Construction Safety: A Literature Review. Criocm2009 Int. Symp. Adv. Constr. Manag. Real Estate 2009, 1–6, 1408–1415. [Google Scholar]
  16. Michael, T.; John, G. The Trajectories of Prevention through Design in Construction. J. Saf. Res. 2008, 39, 225–230. [Google Scholar]
  17. Suraji, A.; Duff, A.R.; Peckitt Stephen, J. Development of Causal Model of Construction Accident Causation. J. Constr. Eng. Manag. 2001, 127, 337–344. [Google Scholar] [CrossRef]
  18. Haslam, R.A.; Hide, S.A.; Gibb, A.G.F.; Gyi, D.E.; Pavitt, T.; Atkinson, S.; Duff, A.R. Contributing factors in construction accidents. Appl. Erg. 2005, 36, 401–415. [Google Scholar] [CrossRef] [PubMed] [Green Version]
  19. Hollnagel, E. Risk+barriers=safety? Saf. Sci. 2008, 46, 221–229. [Google Scholar] [CrossRef]
  20. Yuan, J.; Li, X.; Xiahou, X.; Tymvios, N.; Zhou, Z.; Li, Q. Accident prevention through design (PtD): Integration of building information modeling and PtD knowledge base. Autom. Constr. 2019, 102, 86–104. [Google Scholar] [CrossRef]
  21. Aksorn, T.; Hadikusumo, B.H.W. Critical success factors influencing safety program performance in Thai construction projects. Saf. Sci. 2008, 46, 709–727. [Google Scholar] [CrossRef]
  22. Hansen, D.C. Measuring and Improving Designer Hazard Recognition Skill. Master’s Thesis, University of Colorado, Washington, DC, USA, 2011. [Google Scholar]
  23. Weinstein, M.; Gambatese, J.; Hecker, S. Can Design Improve Construction Safety?: Assessing the Impact of a Collaborative Safety-in-Design Process. J. Constr. Eng. Manag. 2005, 131, 1125–1134. [Google Scholar] [CrossRef] [Green Version]
  24. Michael, B. Linking construction fatalities to the design for construction safety concept. Saf. Sci. 2005, 43, 589–611. [Google Scholar]
  25. Katie, S.D.; Matthew, H. Prevention through design and construction safety management strategies for high performance sustainable building construction. Constr. Manag. Econ. 2012, 30, 165–177. [Google Scholar]
  26. Gambatese, J.; Hinze, J. Addressing construction worker safety in the design phase. Autom. Constr. 1999, 8, 643–649. [Google Scholar] [CrossRef]
  27. Gambatese, J.A.; Hinze, J.W.; Behm, M. Viability of Designing for Construction Worker Safety. J. Constr. Eng. Manag. 2005, 131, 1029–1036. [Google Scholar] [CrossRef] [Green Version]
  28. Matthew, R.H.; Daniel, H. Measuring and improving designer hazard recognition skill: Critical competency to enable prevention through design. Saf. Sci. 2016, 82. [Google Scholar]
  29. Toole, T.M. Increasing engineers’ role in construction safety: Opportunities and barriers. J. Prof. Issues Eng. Educ. Pr. 2005, 131, 199–207. [Google Scholar] [CrossRef]
  30. Gambatese, J.A.; Hinze, J.W.; Haas, C.T. Tool to design for construction worker safety. J. Arch. Eng. 1997, 3, 32–41. [Google Scholar] [CrossRef]
  31. Hadikusumo, B.H.W.; Rowlinson, S. Capturing safety knowledge using design-for-safety-process tool. J. Constr. Eng. Manag. 2004, 130. [Google Scholar] [CrossRef]
  32. Seo, J.W.; Choi, H.H. Risk-based safety impact assessment methodology for underground construction projects in korea. J. Constr. Eng. Manag. 2008, 134. [Google Scholar] [CrossRef]
  33. Hossai, M.A.; Abbott, E.L.S.; Chua, D.K.H.; Qui, N.T.; Goh, Y.M. Design-for-Safety knowledge library for BIM-integrated safety risk reviews. Autom. Constr. 2018, 94, 290–302. [Google Scholar] [CrossRef]
  34. Fang, Q.; Li, H.; Luo, X.C.; Ding, L.Y.; Luo, H.B.; Li, C.Q. Computer vision aided inspection on falling prevention measures for steeplejacks in an aerial environment. Autom. Constr. 2018, 93, 148–164. [Google Scholar] [CrossRef]
  35. Zhang, S.J.; Boukamp, F.; Teizer, J. Ontology-based semantic modeling of construction safety knowledge: Towards automated safety planning for job hazard analysis (JHA). Autom. Constr. 2015, 52, 29–41. [Google Scholar] [CrossRef]
  36. Wang, J.; Zhang, S.J.; Teizer, J. Geotechnical and safety protective equipment planning using range point cloud data and rule checking in building information modeling. Autom. Constr. 2015, 49, 250–261. [Google Scholar] [CrossRef]
  37. Zhang, S.J.; Sulankivi, K.; Kiviniemi, M.; Romo, I.; Eastman, C.M.; Teizere, J. BIM-based fall hazard identification and prevention in construction safety planning. Saf. Sci. 2015, 72, 31–45. [Google Scholar] [CrossRef]
  38. Kim, K.; Cho, Y.; Zhang, S.J. Integrating work sequences and temporary structures into safety planning: Automated scaffolding-related safety hazard identification and prevention in BIM. Autom. Constr. 2016, 70, 128–142. [Google Scholar] [CrossRef]
  39. Kim, J.; Moon, I. Automatic verification of control logics in safety instrumented system design for chemical process industry. J. Loss Prev. Process Ind. 2009, 22, 975–980. [Google Scholar] [CrossRef]
  40. Yang, J.M.; Ko, B.S.; Park, C.; Yoo, B.; Shin, D.; Ko, J.W. Design and implementation of an integrated safety management system for compressed natural gas stations using ubiquitous sensor network. Korean J. Chem. Eng. 2014, 31, 393–401. [Google Scholar] [CrossRef]
  41. Hassnawi, L.A.; Ahmad, R.B.; Yahya, A.; Aljunid, S.A.; Ali, Z.G.; Ibraheem, Z.T. A New Design for a Motorway Surveillance System Using a Wireless Ad-Hoc Camera Network to Improve Safety. Arab. J. Sci. Eng. 2014, 39, 2783–2797. [Google Scholar] [CrossRef]
  42. Chang, K.C.; Wang, K.H. Design and Implementation of Traffic Safety Guardian System for Android based on OpenCV. In Proceedings of the 2012 International conference on connected vehicles and expo: ICCVE 2012, Beijing, China, 12–16 December 2012; pp. 288–289. [Google Scholar]
  43. Petrov, Z.; Zaykov, P.G.; Cardoso, J.P.; Coutinho, J.G.F. An aspect-oriented approach for designing safety-critical systems. In Proceedings of the 2013 IEEE Aerospace Conference. [v.1], Big Sky, MT, USA, 2–9 March 2013; pp. 1–10. [Google Scholar]
  44. Hegde, J.; Rokseth, B. Applications of machine learning methods for engineering risk assessment—A review. Saf. Sci. 2020, 122, 104492. [Google Scholar] [CrossRef]
  45. Yu, Q.Z.; Ding, L.Y.; Zhou, C.; Luo, H.B. Analysis of factors influencing safety management for metro construction in China. Accid. Anal. Prev. 2014, 68, 131–1338. [Google Scholar] [CrossRef]
  46. Zhang, C.P.; Li, L.M.; Zhang, D.L.; Zhang, S.L. Types and characteristics of safety accidents induced by metro construction. Inf. Manag. Innov. Manag. Ind. Eng. 2009 Int. Conf. 2009, 3, 185–188. [Google Scholar]
  47. Ghosh, S.; Jintanapakanont, J. Identifying and assessing the critical risk factors in an underground rail project in Thailand: A factor analysis approach. Int. J. Proj. Manag. 2004, 22, 633–643. [Google Scholar] [CrossRef]
  48. Wu, X.; Jiang, Z.; Zhang, L.; Skibniewski, M.J.; Zhong, J. Dynamic risk analysis for adjacent buildings in tunneling environments: A Bayesian network based approach. Stoch.Environ. Res. Risk Assess. 2015, 29, 1447–1461. [Google Scholar] [CrossRef]
  49. Li, M.; Yu, H.; Jin, H.; Liu, P. Methodologies of safety risk control for China’s metro construction based on BIM. Saf. Sci. 2018, 110, 418–426. [Google Scholar] [CrossRef]
  50. Zheng, X.; Ma, F.H. Materials, Metro Construction Safety Risk Assessment Based on the Fuzzy AHP and the Comprehensive Evaluation Method. Appl. Mech. Mater. 2014, 580–583, 1243–1248. [Google Scholar] [CrossRef]
  51. Guo, H.L.; Yu, Y.T.; Zhang, W.S.; Li, Y. BIM and safety rules based automated identification of unsafe design factors in construction. Procedia Eng. 2016, 164, 467–472. [Google Scholar]
  52. He, Y.; Li, H.; Wang, X. A Study on Risk Prediction Model of Coal Enterprise Safety Management—Based on RS-SVM. East China Econ. Manag. 2014, 28, 159–163. [Google Scholar]
  53. Chen, Z.; Zhao, F.; Zhou, J.; Huang, P.; Zhang, X. Fault Diagnosis of Loader Gearbox Based on an ICA and SVM Algorithm. Int. J.Environ. Res. Public 2019, 16, 4868. [Google Scholar] [CrossRef] [Green Version]
  54. Fan, J.; Li, M.; Guo, F.; Yan, Z.; Zheng, X.; Zhang, Y.; Xu, Z.; Wu, F. Priorization of River Restoration by Coupling Soil and Water Assessment Tool (SWAT) and Support Vector Machine (SVM) Models in the Taizi River Basin, Northern China. Int. J.Environ. Res. Public Health 2018, 15, 2090. [Google Scholar] [CrossRef] [Green Version]
  55. Zhou, C.; Yin, K.; Cao, Y.; Ahmed, B. Application of time series analysis and PSO–SVM model in predicting the Bazimen landslide in the Three Gorges Reservoir, China. Eng. Geol. 2016, 204, 108–120. [Google Scholar] [CrossRef]
  56. Chen, S.; Wang, J.-q.; Zhang, H.-y. A hybrid PSO-SVM model based on clustering algorithm for short-term atmospheric pollutant concentration forecasting. Technol. Soc. Chang. 2019, 146, 41–54. [Google Scholar] [CrossRef]
  57. Goldkuhl, G. Design theories in information systems-a need for multi-grounding. J. Inf. Technol. Theory Appl. 2004, 6, 59–72. [Google Scholar]
  58. Hevner, A.R.; March, S.T.; Park, J.; Ram, S. Design Science in Information Systems Research. Mis Q. 2004, 28, 75–105. [Google Scholar] [CrossRef] [Green Version]
  59. Behm, M. Safe Design Suggestions for Vegetated Roofs. J. Constr. Eng. Manag. 2012, 138, 999–1003. [Google Scholar]
  60. Cristianini, N.; Taylo, J.S. An Introduction to Support Vector Machines and Other Kernel-Based Learning Methods; Cambridge University Press: Oxford, UK, 2000. [Google Scholar]
  61. Vapnik, V.N. The Nature of Statistical Learning Theory; Springer-Verlag: New York, NY, USA, 1995. [Google Scholar]
  62. Vapnik, V.N. Statistical Learning Theory; Wiley-Interscience: New York, NY, USA, 1998. [Google Scholar]
  63. Wang, S.; Li, Z.; Wang, Y.; Zhang, Q. Machine Learning Methods to Predict Social Media Disaster Rumor Refuters. Int. J.Environ. Res. Public Health 2019, 16, 1452. [Google Scholar] [CrossRef] [PubMed] [Green Version]
  64. Hwang, S.; Jeong, M.K.; Yum, B. Robust Relevance Vector Machine With Variational Inference for Improving Virtual Metrology Accuracy. Ieee Trans. Semicond. Manuf. 2014, 27, 83–94. [Google Scholar] [CrossRef]
  65. Bai, L.; Wang, J.; Ma, X.; Lu, H. Air Pollution Forecasts: An Overview. Int. J.Environ. Res. Public Health 2018, 15, 780. [Google Scholar] [CrossRef] [Green Version]
  66. Du, J.; Liu, Y.; Yu, Y.; Yan, W. A Prediction of Precipitation Data Based on Support Vector Machine and Particle Swarm Optimization (PSO-SVM) Algorithms. Algorithms 2017, 10, 57. [Google Scholar] [CrossRef]
  67. Kuhn, H.T. A in Proceedings of the 2nd Berkeley Symposium on Mathematical Statistics and Probability; University of California Press: Berkeley, CA, USA, 1950. [Google Scholar]
  68. Ballanti, L.; Blesius, L.; Hines, E.; Kruse, B. Tree Species Classification Using Hyperspectral Imagery: A Comparison of Two Classifiers. Remote Sens. 2016, 8, 445. [Google Scholar] [CrossRef] [Green Version]
  69. Cheong, S.; Oh, S.H.; Lee, S.Y. Supportvectormachineswith binary tree architecture formulti-class classification. Neural Inf. Process. Lett. Rev. 2004, 2, 47–51. [Google Scholar]
  70. Elbisy, M.S. Sea Wave Parameters Prediction by Support Vector Machine Using a Genetic Algorithm. J. Coast. Res. 2013, 31, 892–899. [Google Scholar] [CrossRef]
  71. Chen, J.-H.; Lin, J.-Z. Developing an SVM based risk hedging prediction model for construction material suppliers. Autom. Constr. 2010, 19, 702–708. [Google Scholar] [CrossRef]
  72. Zeng, D.; Wang, S.; Shen, Y.; Shi, C. A GA-based feature selection and parameter optimization for support tucker machine. Procedia Comput. Sci. 2017, 111, 17–23. [Google Scholar] [CrossRef]
  73. Kennedy, J.; Eberhart, R. Particle swarm optimization. In Proceedings of the ICNN’95—International Conference on Neural Networks, Perth, WA, Australia, 27 November–1 December 1995; pp. 1942–1948. [Google Scholar]
  74. Zhang, Z.X.; Guo, H.Y. Research on Fault Diagnosis of Diesel Engine Based on PSO-SVM. In Proceedings of the 2014 International Conference on Industrial Engineering and Information Technology, Tianjin, China, 16–18 May 2014. [Google Scholar]
  75. Kennedy, J. Particle Swarm Optimization. In Encyclopedia of Machine Learning; Sammut, C., Webb, G.I., Eds.; Springer US: Boston, MA, USA, 2010; pp. 760–766. [Google Scholar]
  76. Liu, P.; Li, Q.; Bian, J.; Song, L.; Xiahou, X. Using Interpretative Structural Modeling to Identify Critical Success Factors for Safety Management in Subway Construction: A China Study. Int. J.Environ. Res. Public Health 2018, 15, 1359. [Google Scholar] [CrossRef] [PubMed] [Green Version]
  77. Xiahou, X.; Yuan, J.; Li, Q.; Skibniewski, M.J. Validating DFS concept in lifecycle subway projects in China based on incident case analysis and network analysis. J. Civ. Eng. Manag. 2018, 24, 53–66. [Google Scholar] [CrossRef] [Green Version]
  78. Liu, W.; Zhao, T.S.; Zhou, W.; Tang, J.J. Safety risk factors of metro tunnel construction in China: An integrated study with EFA and SEM. Saf. Sci. 2018, 105, 98–113. [Google Scholar] [CrossRef]
  79. Duan, S.X.; Sun, R. Study on the Influencing Factors of Urban Subway Engineering Construction Safety. Iop Conf. Ser. Mater. Sci. Eng. 2018, 371, 012061. [Google Scholar] [CrossRef]
  80. Wu, Y.Q.; Wang, K.; Zhang, L.-Z.; Peng, S.-H. Sand-layer collapse treatment: An engineering example from Qingdao Metro subway tunnel. J. Clean. Prod. 2018, 197, 19–24. [Google Scholar] [CrossRef]
  81. Ma, X.-F.; Feng, N.-N.; Wang, G.-B.; Fang, X. Study on Vibration Reduction Method for a Subway Station in Soft Ground. J. Shock Vib. 2017, 2017, 9. [Google Scholar] [CrossRef] [Green Version]
  82. Xiong, F.; Wu, J.; Xing, H. Effects of Pit Excavation on an Existing Subway Station and Preventive Measures. J. Perform. Constr. Facil. 2016, 30. [Google Scholar] [CrossRef]
  83. China. Guideline of Risk Management for Construction of Subway and Underground Works; China Architecture & Building Press: Beijing, China, 2007. [Google Scholar]
  84. Gu, S.-n.; Zhu, G.-q.; Zan, W.-x. Numerical Study on Transverse Temperature Distribution of Fire Zone in Metro Tunnel Fire. Procedia Eng. 2016, 135, 376–383. [Google Scholar] [CrossRef] [Green Version]
  85. Gambatese, J.A.; Behm, M.; Rajendran, S. Design’s role in construction accident causality and prevention: Perspectives from an expert panel. Saf. Sci. 2008, 46, 675–691. [Google Scholar] [CrossRef]
  86. China. Standard for Construction Safety Assessment of Metro Engineering; China Planning Press: Beijing, China, 2012. [Google Scholar]
  87. Ding, L.Y.; Yu, H.L.; Li, H.; Zhou, C.; Wu, X.G.; Yu, M.H. Safety risk identification system for metro construction on the basis of construction drawings. Autom. Constr. 2012, 27, 120–137. [Google Scholar] [CrossRef]
  88. Moon, H.; Dawood, N.; Kang, L. Development of workspace conflict visualization system using 4D object of work schedule. Adv. Eng. Inf. 2014, 28, 50–65. [Google Scholar] [CrossRef]
  89. Cong, C. Numerical analysis of influence of deep excavations on metro tunnel. In Proceedings of the 2016 International Conference on Civil, Transportation and Environment, Houston, TX, USA, 30–31 January 2016; Atlantis Press: Guangzhou, China, 2016. [Google Scholar]
  90. China. Code for Risk Management of Underground Works in Urban Rail Transit; Architecture & Building Press: Beijing, China, 2011. [Google Scholar]
  91. Huang, C.L.; Wang, C.J. A GA-based feature selection and parameters optimizationfor support vector machines. Expert Syst. Appl. 2006, 31, 231–240. [Google Scholar] [CrossRef]
  92. Mao, X. Research on the Collapse Risk Predication of Deep Excavation of Subway Station Based on SVM; Central South University: Changsha, China, 2013. [Google Scholar]
  93. García Nieto, P.J.; García-Gonzalo, E.; Sánchez Lasheras, F.; de Cos Juez, F.J. Hybrid PSO–SVM-based method for forecasting of the remaining useful life for aircraft engines and evaluation of its reliability. Reliab. Eng. Syst. Saf. 2015, 138, 219–231. [Google Scholar] [CrossRef]
  94. Zhou, Z.; Xiao, T.; Chen, X.; Wang, C. A carbon risk prediction model for Chinese heavy-polluting industrial enterprises based on support vector machine. Chaos Solitons Fractals 2016, 89, 304–315. [Google Scholar] [CrossRef]
  95. Li, R.; Shiliang, S.; Qifeng, N.; Hongping, Z.; Chuangqu, Z. Research on Pattern Recognition of Gas Explosion Disaster Risk in Coal Mines Based on PSO-SVM. China Saf. Sci. J. 2013, 23, 38–43. [Google Scholar]
Figure 1. The process of supervised learning algorithms.
Ijerph 17 01714 g001
Figure 2. Complete (a) and partial (b) support vector machines (SVMs).
Ijerph 17 01714 g002
Figure 3. The prediction model of the SVM metro construction safety risk classification binary tree.
Ijerph 17 01714 g003
Figure 4. The overall framework in this study.
Ijerph 17 01714 g004
Figure 5. The PSO–SVM prediction model flow of safety risk for metro construction.
Ijerph 17 01714 g005
Figure 6. Association graph of research content of Design for Safety (DFS).
Ijerph 17 01714 g006
Figure 7. Comparisons of actual values and predicted values of the training set.
Ijerph 17 01714 g007
Figure 8. Comparisons of actual values and predicted values of the test set.
Ijerph 17 01714 g008
Table 1. Codes of construction safety management in different countries or regions.
Country/RegionCodeAbbreviation
Mainland ChinaStandard for Construction Safety Assessment of Metro Engineering
(GB50715-2011)
GB 50715
Code for Risk Management of Underground Works in Urban Rail Transit (GB50652-2011)GB 50652
Code for Construction Company Safety Management Criterion (GB50656-2011)GB 50656
Standard for Construction Safety Inspection (JGJ59-2011)
Administrative Regulations on Safety in Construction Project
(Regulation No.393 of the State Council)
JGJ59
No.393
Hong Kong, ChinaFactories and Industrial Undertakings Ordinance (FIUO-Cap.59)FIUO
Occupational Safety and Health Ordinance (OSHO-Cap.509)OSHO
JapanConstruction Occupational Health and Safety Management System (COHSMS)COHSMS
Guidelines and COHSMS External System Evaluation
SingaporeThe Factories (Building Operations and Work of Engineering Construction) RegulationsBOWES
Code of Practice for Safety Management System for Construction Worksites (Singapore standard CP79:1999)CP79
Table 2. Influencing factors of safety risk in metro station construction.
DimensionsFactorsDescriptionsSources
Dangerous source environmentC1
Distribution and water enrichment of aquifers
The uncertainty of aquifer distribution and water yield analysis brings hidden danger to the safe construction of a metro station.GB 50652
GB 50715
[49,78,79]
C2
Poor geological distribution
During the metro construction, special soil and poor geological conditions may be encountered, which will have a great impact on the safety of construction.GB 50652,
GB 50715
[46,79]
C3
Soft soil thickness
The soft soil thickness is the internal cause of deep foundation pit accidents, which will cause the large deformation and displacement of the deep foundation pit.GB 50652
GB 50656
FIUO
[78,80,81,82]
Project design schemeC4
Engineering design defects or errors
The quality of the designer determines the rationality of the design scheme and thus determines the size of the safety risk in the design results.GB 50652
OSHO
[83,84,85]
C5
Selection of construction method
Different station types have different construction methods. Improper selection of construction methods will cause construction safety risks.GB 50652
GB 50715
CP79
[83,86,87,88]
C6
Excavation depth of foundation pit
With the continuous increase of the excavation depth of the foundation pit, the environment, geology and hydrological conditions will become increasingly complicated.GB 50652
GB 50715
OSHO
[83,87]
C7
Enclosure structure design
The design of the envelope structure is the temporary or permanent structure to resist the unfavorable external environment in the process developing underground space.GB 50652
GB 50656
[83,89]
C8
Support system design
The support system is the temporary structure which resists the internal or external deformation of the enclosure during the excavation of the foundation pit, which is one of the main causes of safety accidents.GB 50652
JGJ59
[86,89,90]
C9
Safety design handover
To allow the parties to learn the engineering design for the main idea, the design basis and the construction difficulties, the designer should submit the design documents.GB 50652
GB 50656
[76,86,90]
Construction scheme designC10
Construction precipitation design
Groundwater is the most prominent influencing factor of engineering risk. Water-free operation of underground engineering is an important guarantee of construction safety.JGJ59
No.393
Regulations
GB50656
GB 50715
[83,86,90]
C11
Excavation scheme design
The construction safety risks caused by different excavation methods vary greatly.GB 50656,
GB 50715
COHSMS
[83,86]
C12
Monitoring and measuring scheme
Monitoring and measurement are performed to observe and analyze the change of rock and soil characters, the deformation of the supporting structure and the surrounding environment in excavation and underground construction.GB 50656,
GB 50715
BOWES
[86,89,90]
Table 3. Risk-level standard of metro construction project.
Probability ClassLoss Level
Disastrous
(A)
Very Serious
(B)
Serious
(C)
Considerable
(D)
Ignorable
(E)
>0.1FrequentIIIIIIII
0.01–0.1PossibleIIIIIIIIII
0.001–0.01Unmeant IIIIIIIIIIV
0.0001–0.001InfrequentIIIIIIIIIVIV
<0.0001Impossible IIIIIIIVIVIV
Table 4. The measurement criteria of soft soil layer’s thickness.
Measurement Score12345
Soft soil thickness > 5 m 4 m < h 5 m 3 m < h 4 m 2 m < h 3 m h 2 m
Table 5. The measurement criteria for monitoring programs.
Measurement ScoreMonitoring and Measuring Design Scheme
1No monitoring and measurement design or serious non-compliance
2Inconformity
3Basically consistent
4More consistent
5Fully consistent
Table 6. Classifications and grade statistics of safety risks in metro station construction.
Risk CategoryRisk Level
IIIIIIIV
Instability and failure of foundation pit1021298
Table 7. The sample data for the instability failure of the foundation pit.
SampleInfluence FactorRisk Level
C1C2C3C4C5C6C7C8C9C10C11C12
1435344533444III
2212241332333II
3544454554555IV
4433344533445III
5331442433342II
6112442342233I
7313342334252II
8435454444454III
9222441422142I
10211432334253II
11424453444454III
12455454554554IV
13411233342133II
14434345434455III
15344452343353III
16311231233131I
17221442353343II
18212342323233II
19121332331231I
20232431443234III
21112431332232I
22323331443234II
23544553545455IV
24334553434554III
25221342443343II
26211443433343II
27243454554455III
28344454345345III
29312331443254II
30343553343454III
31212241343233I
32313331444134II
33555454554554IV
34235552435544III
35535542545445III
36334542444454III
37331442433342II
38235453445544III
39444454554555IV
40221342443343II
41334442544355III
42221443433242II
43235453535544III
44212441342232I
45322431443234II
46455454555544IV
47212441342242I
48455454554555IV
49311442342143II
50112331543232II
51334344534455III
52223342433243I
53411331344233II
54434344533445III
55525544555445III
56444454555555IV
57334553434554III
58122431443234II
59334442344344III
60434353433544III
61443343533545III
62212331242333I
63231442433342III
64333552353454III
65222331443233II
66235553435544III
67545454555544IV
68434543445455III
Table 8. The quantitative results of influencing factors on the safety risk of station D.
FactorC1C2C3C4C5C6C7C8C9C10C11C12
Quantitative results324441344243
Table 9. Results of accuracy and predicted risk level.
Random Number (RN)RN 1RN 2RN 3RN 4RN 5RN 6RN 7RN 8RN 9RN 10
Training sets92.98%89.47%94.74%85.97%89.47%91.22%94.74%91.22%89.47%94.74%
Test sets81.82%90.91%71.73%90.91%100.00%81.82%90.91%71.73%81.82%90.91%
Risk levelIIIIIIIIIIIIIIIIIIIII
Table 10. Level changes of safety risk prediction by single factors.
Influence FactorQuantitative Result AdjustmentThe Risk Level of Foundation Pit Instability and Failure
C23 (+1)II
4 (+2)III
C62 (+1)II
3 (+2)II
C103 (+1)III
Table 11. Level changes of safety risk prediction with multiple factors.
Influence FactorQuantitative Result AdjustmentFoundation Pit Instability and Failure Risk Level
C2 + C6C2 (+1) = 3 + C6 (+1) = 2II
C2 (+2) = 4 + C6 (+1) = 3III
C2 + C10C2 (+1) = 3 + C10 (+1) = 3III
C2 (+2) = 4 + C10 (+2) = 4III
C6 + C10C6 (+1) = 2 + C10 (+1) = 3III
C6 (+2) = 3 + C10 (+2) = 4III

