The Influence of Road Geometry on Vehicle Rollover and Skidding


Abstract
1. Introduction
2. Human-Vehicle-Road Closed Loop Simulation Model
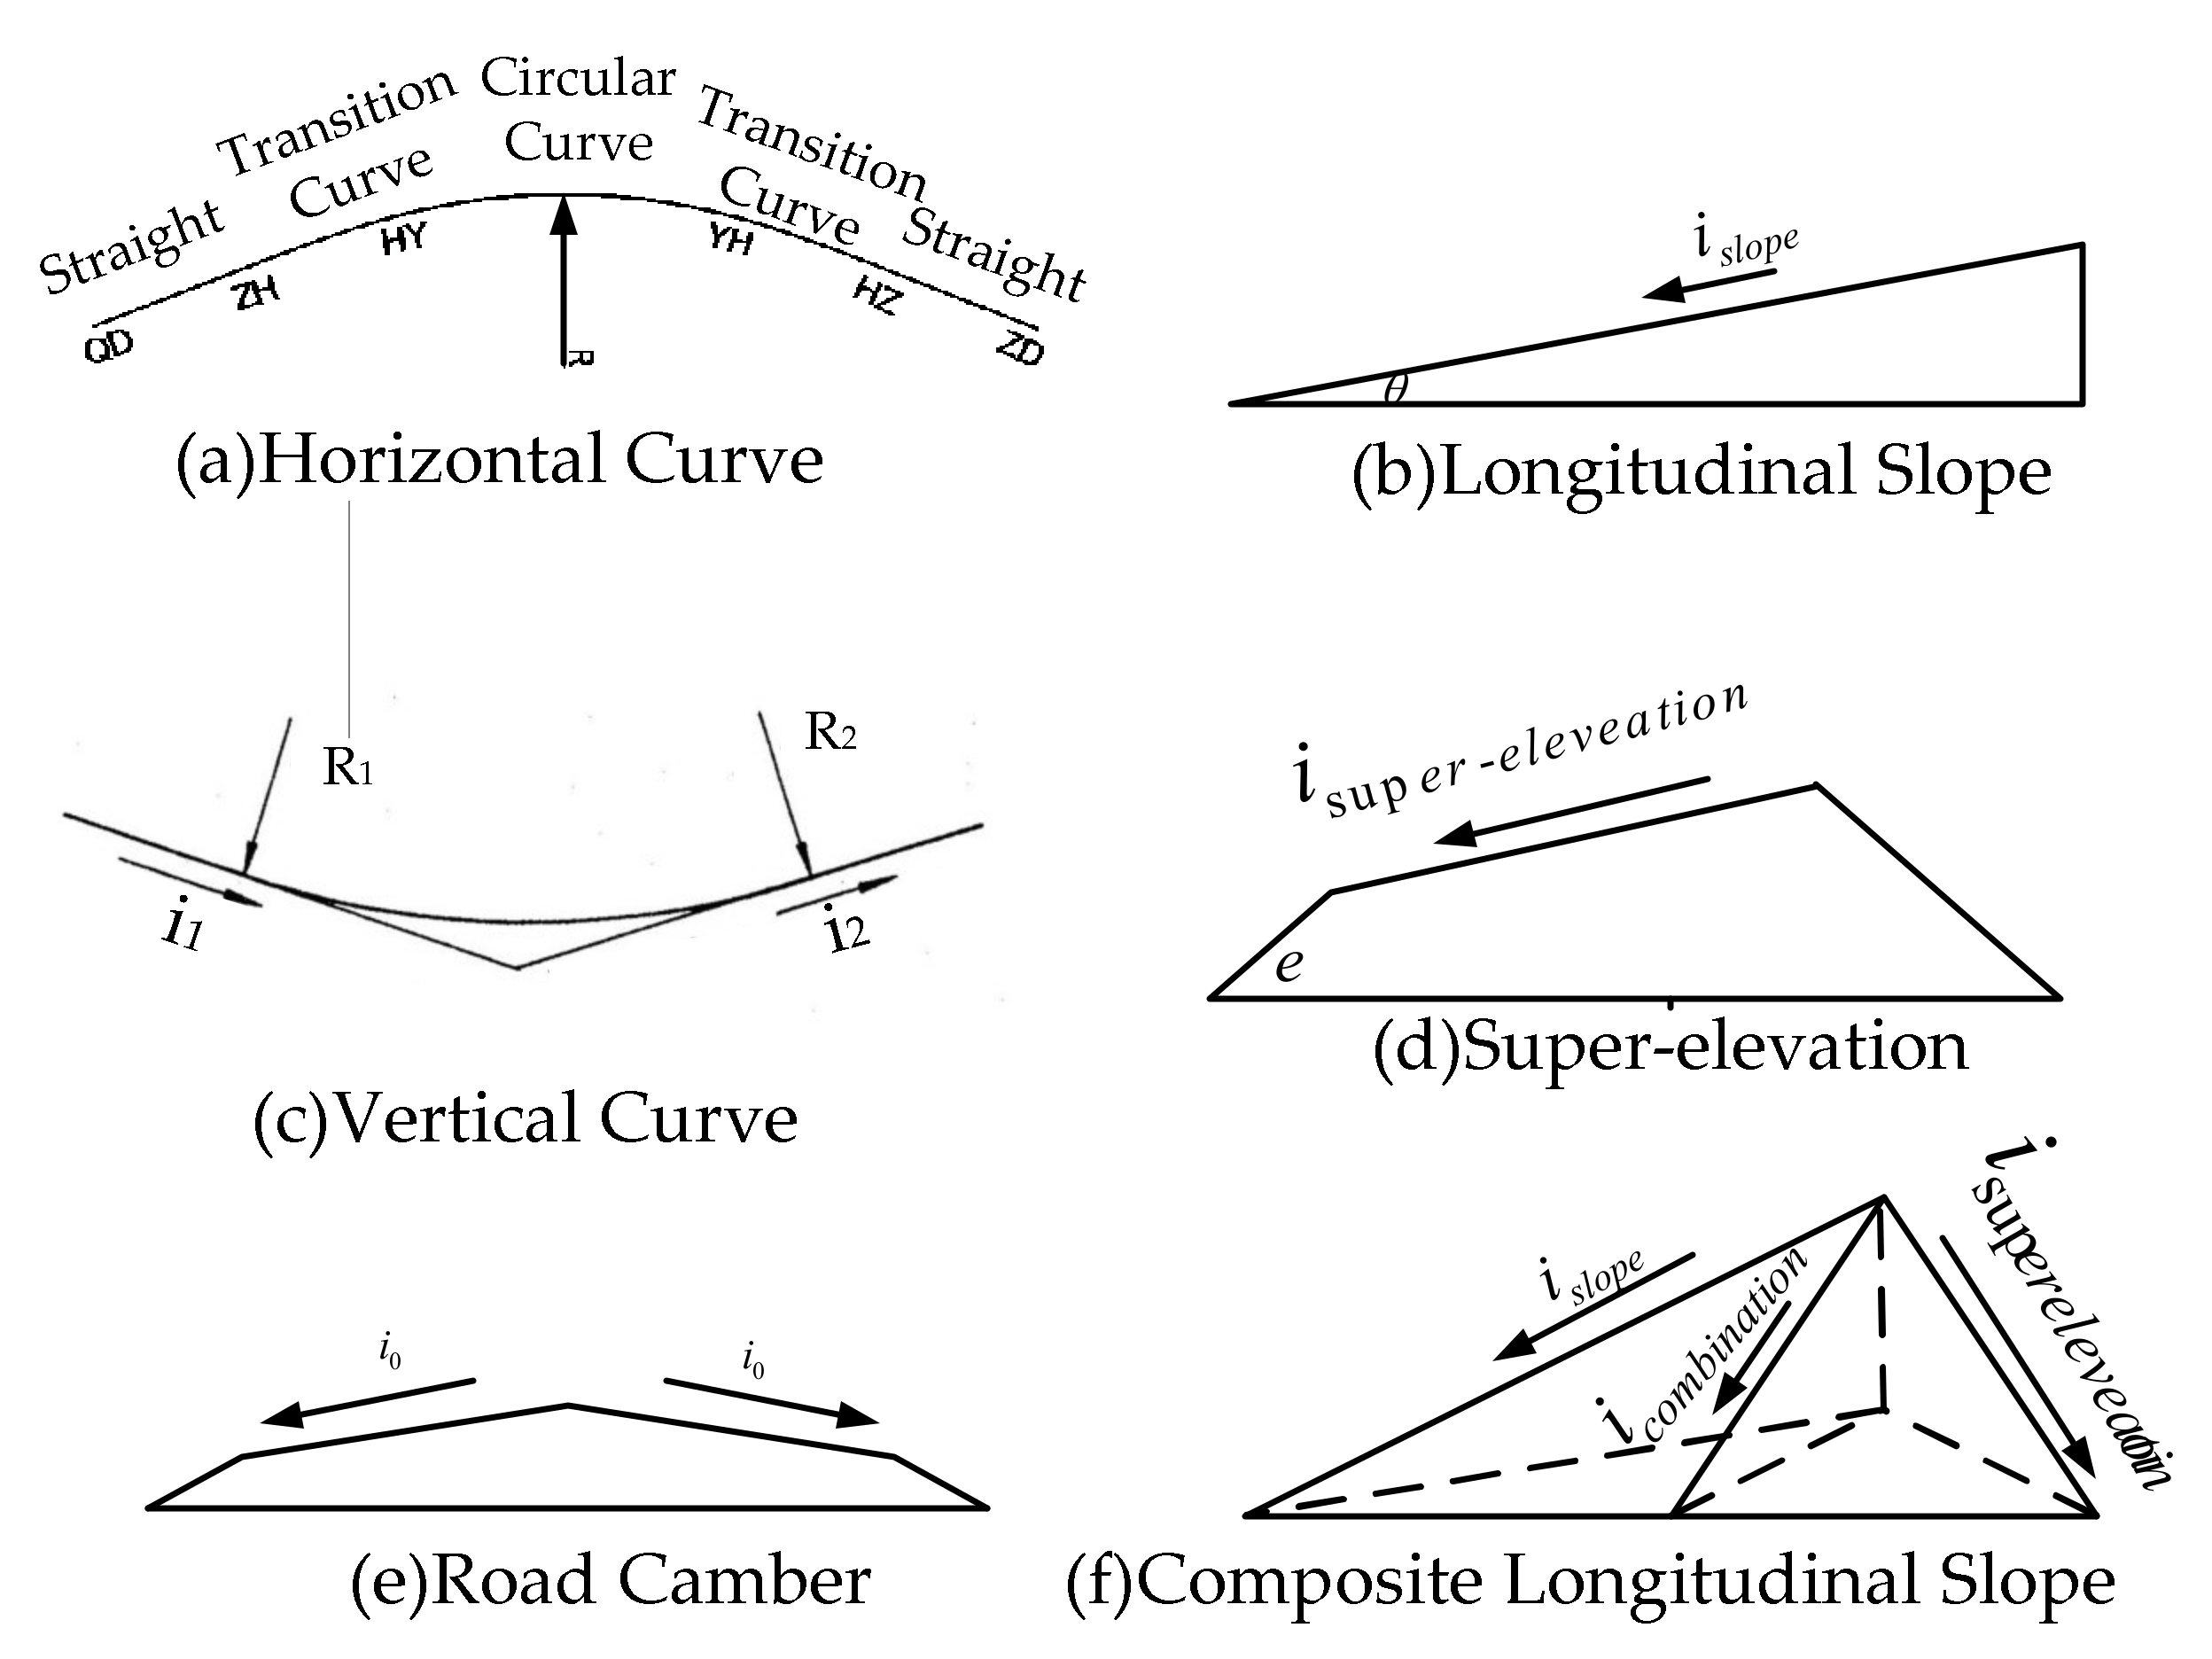
2.1. Road Model
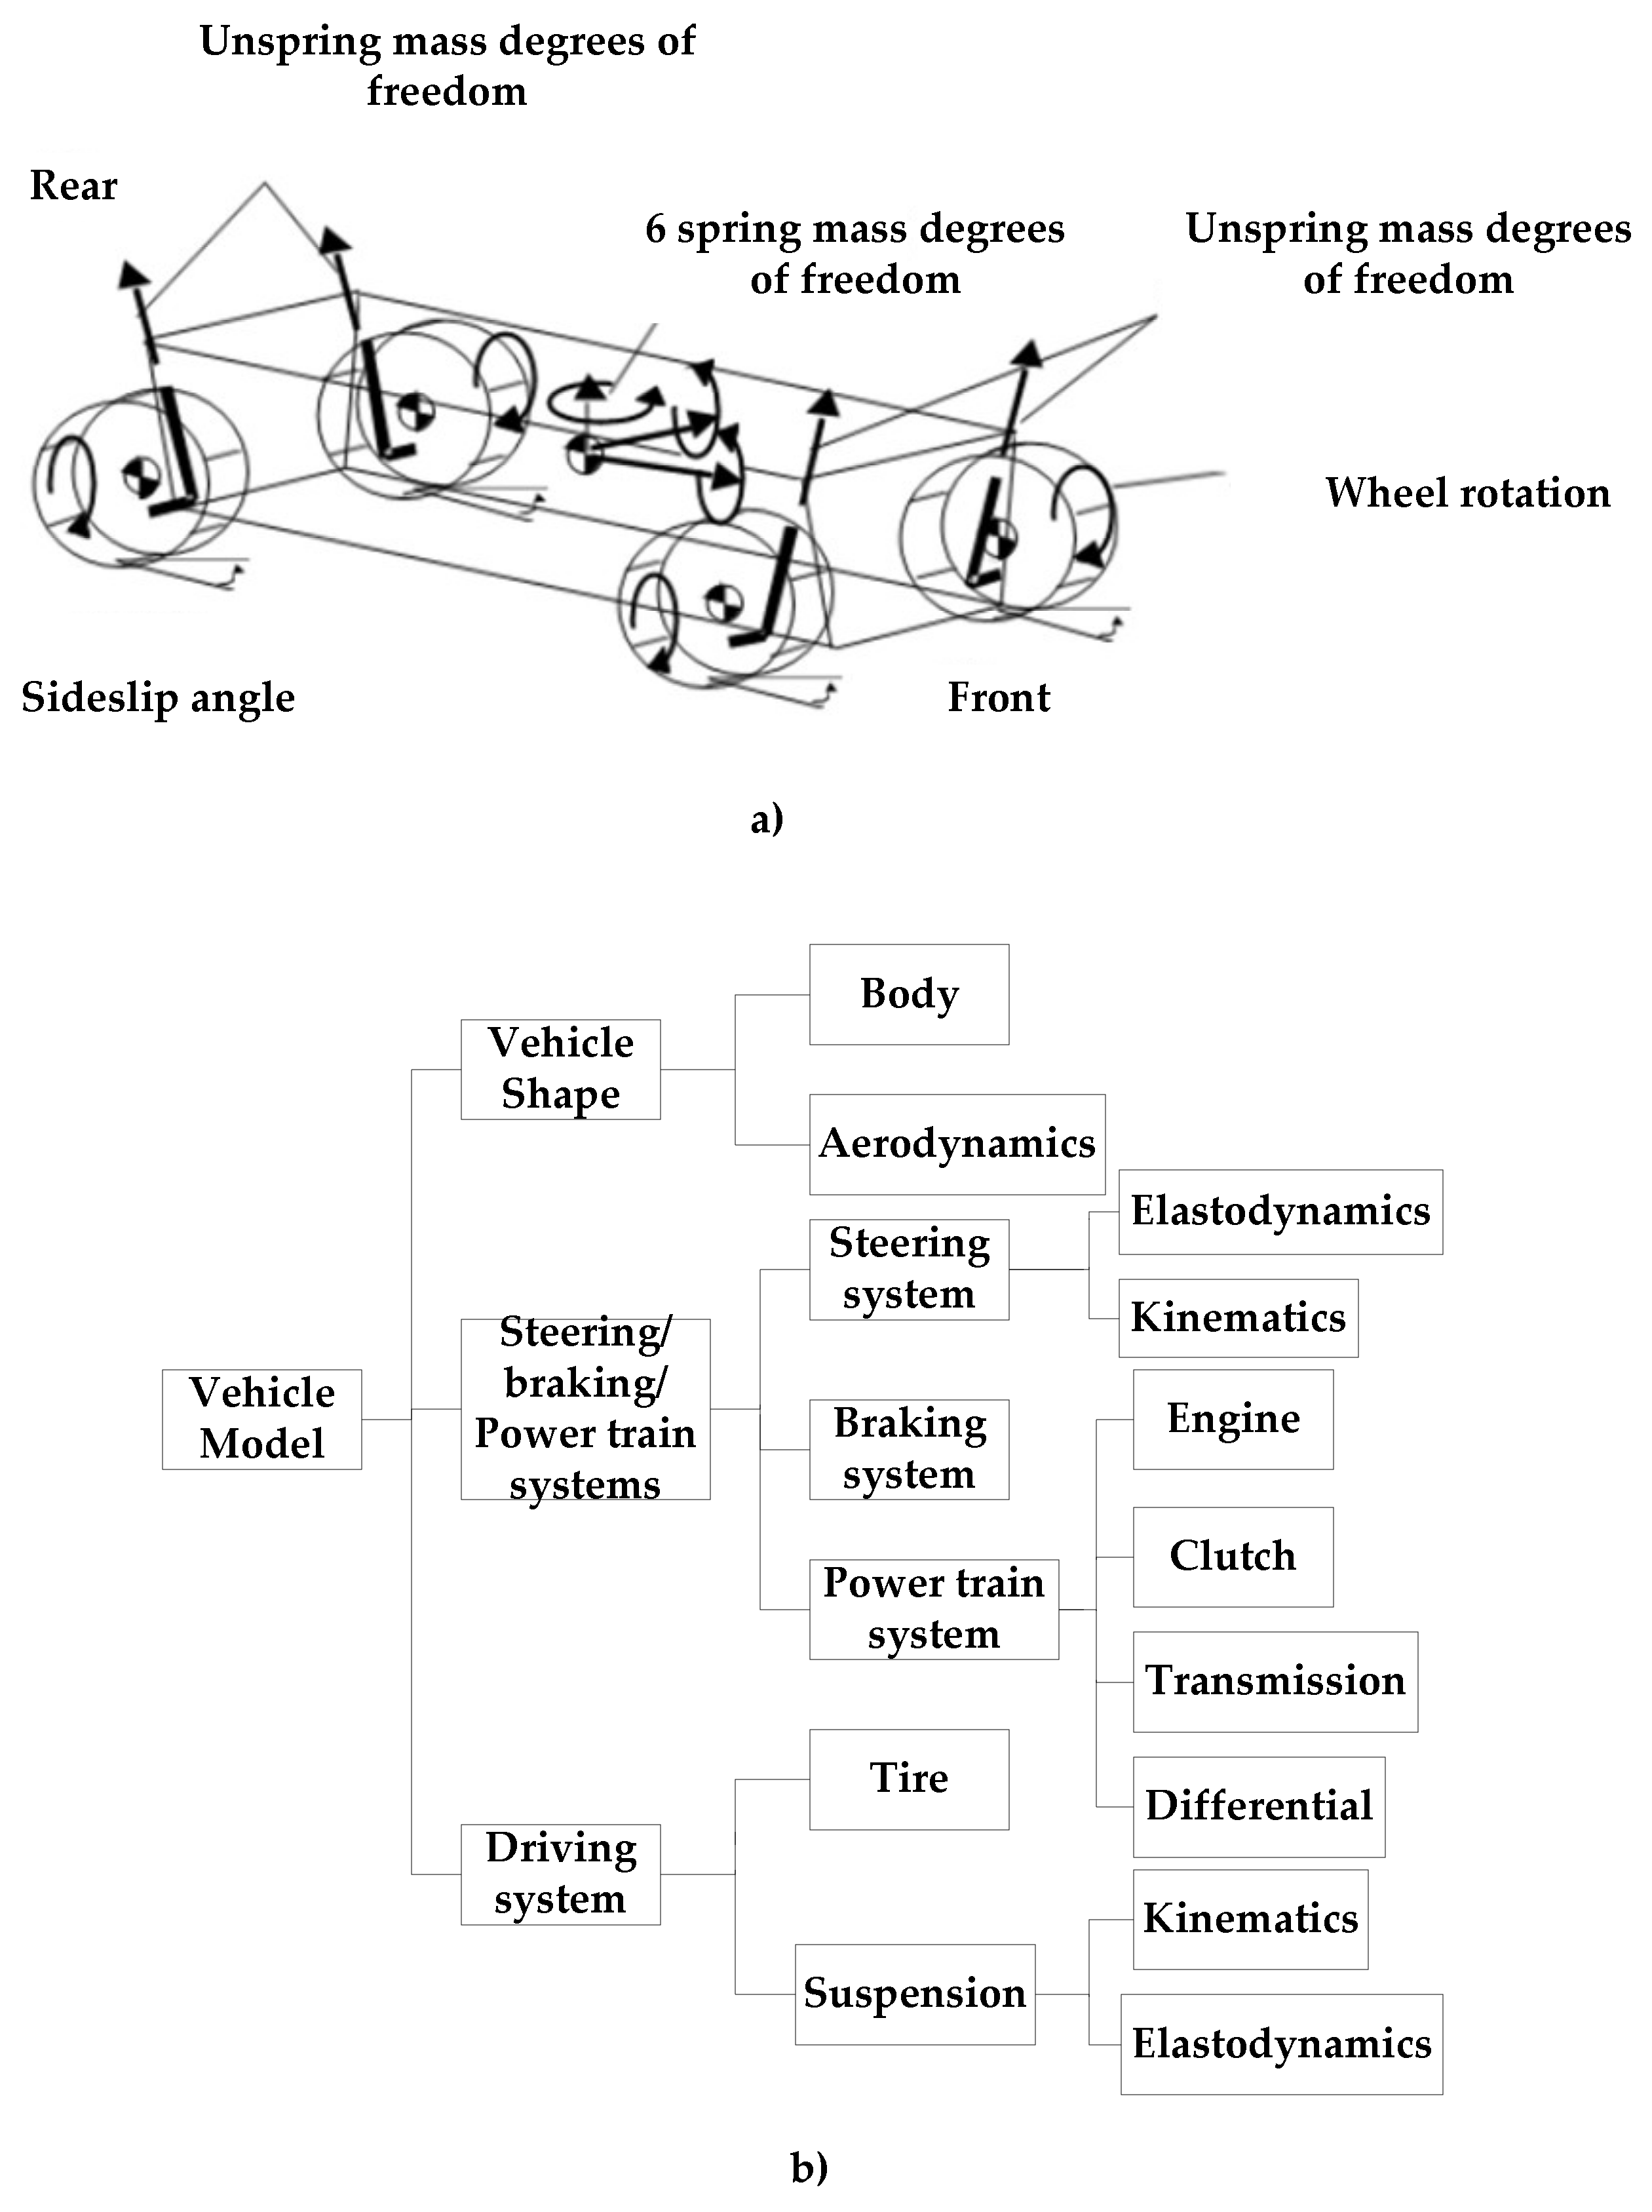
2.2. Vehicle Model
2.2.1. Full Vehicle Model
2.2.2. Tire Model
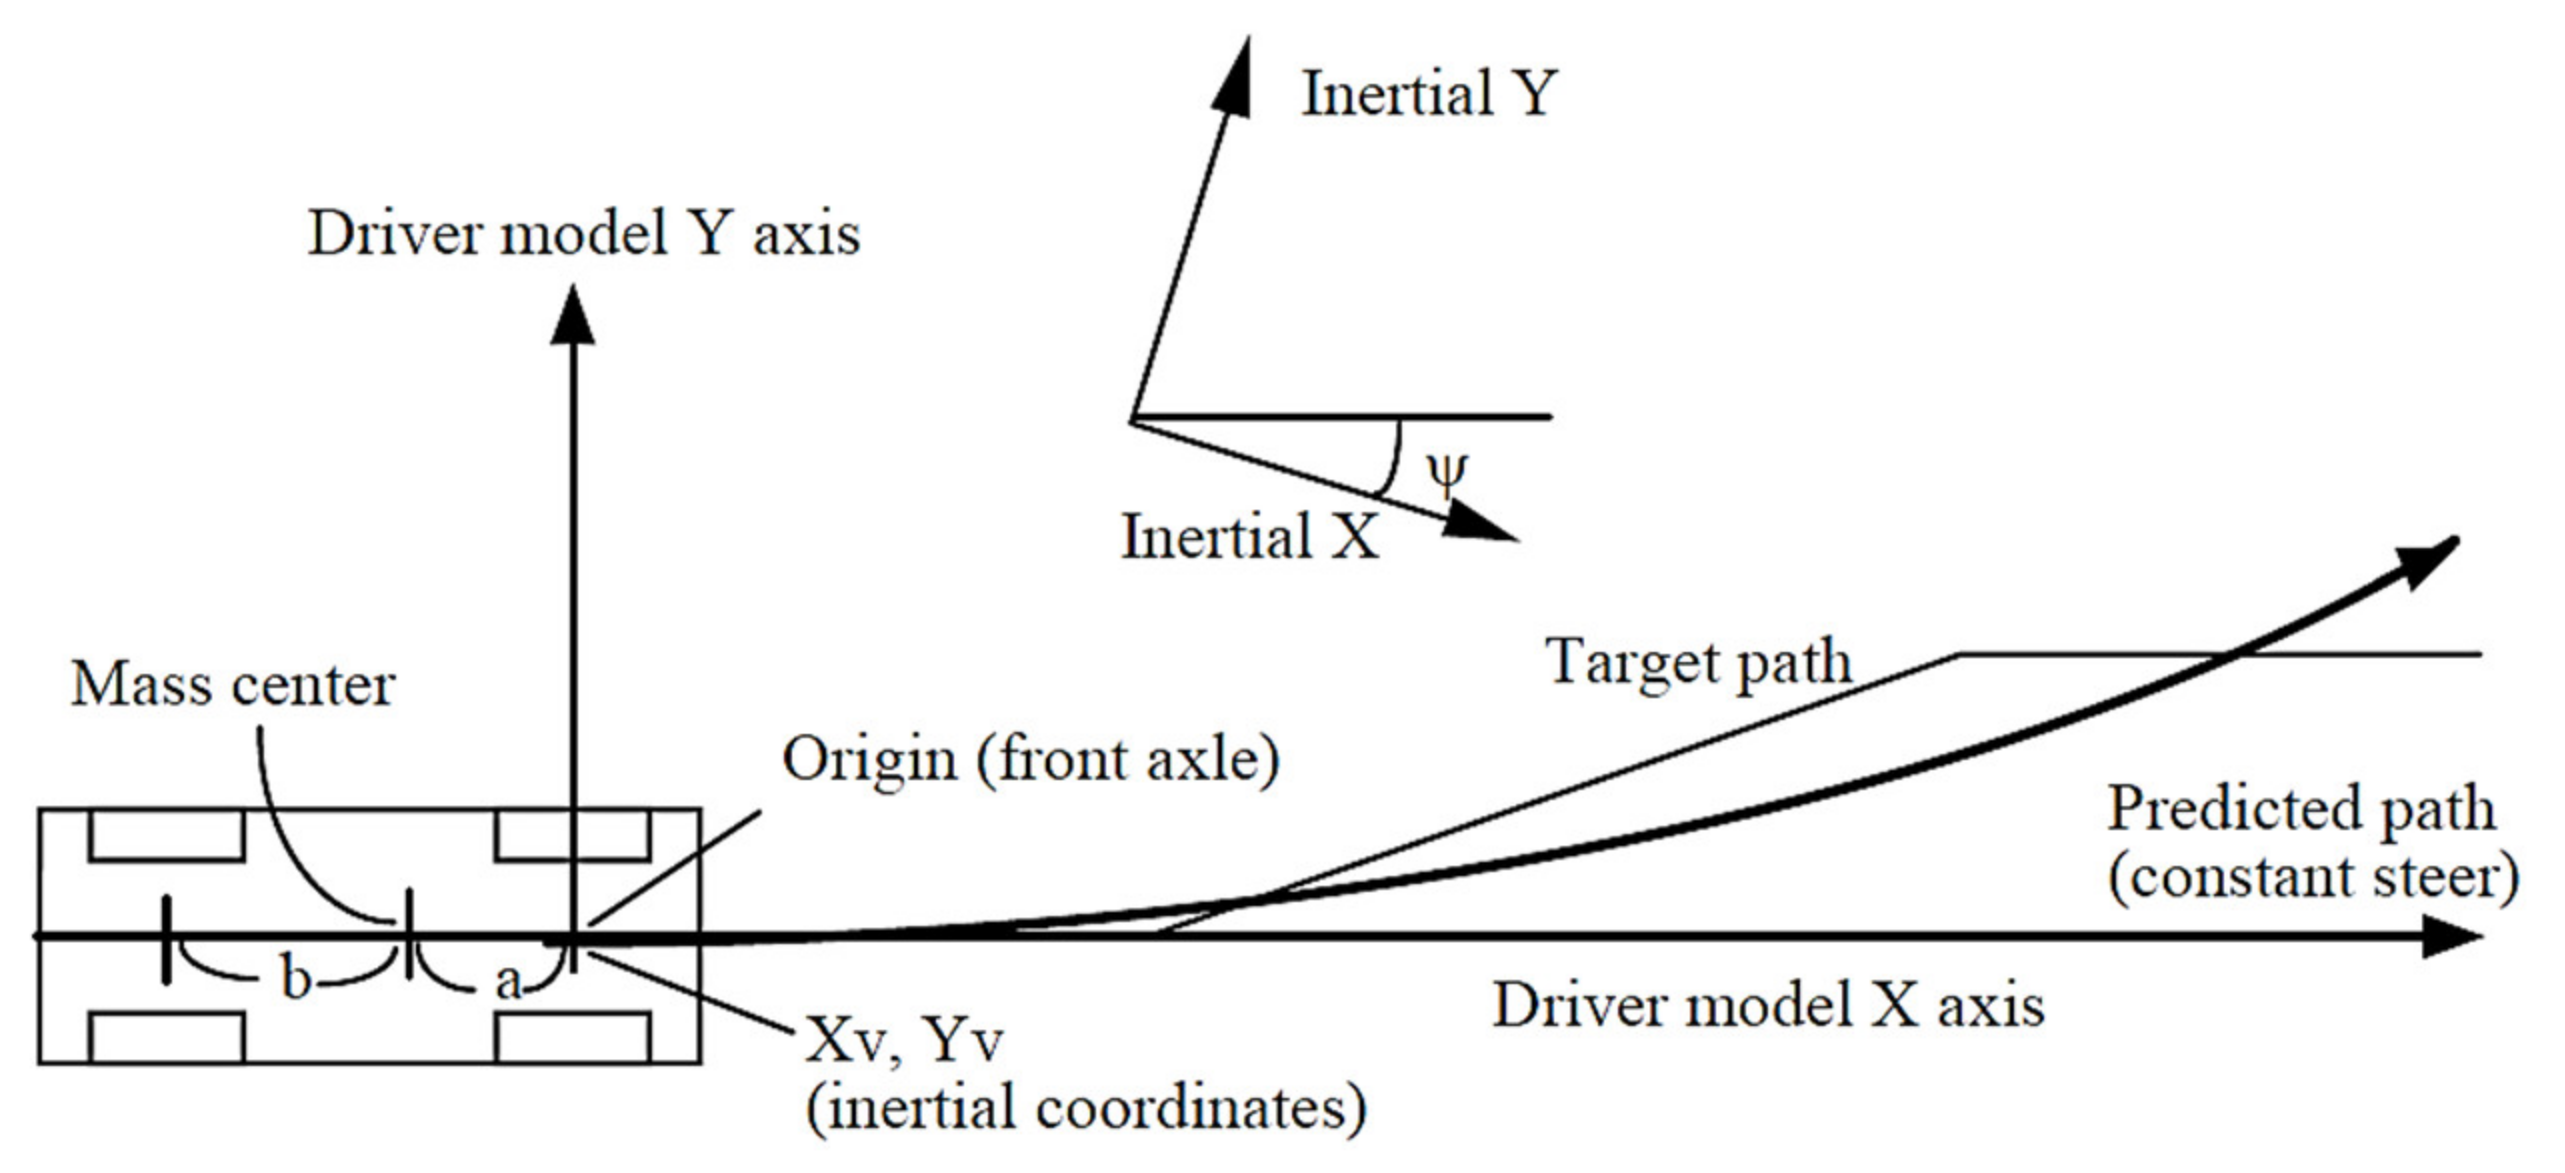
2.3. Driver Model
3. Vehicle Safety Margin of Rollover and Skidding
3.1. Safety Margin of Vehicle Rollover
3.2. Safety Margin of Vehicle Skidding
4. Numerical Analysis
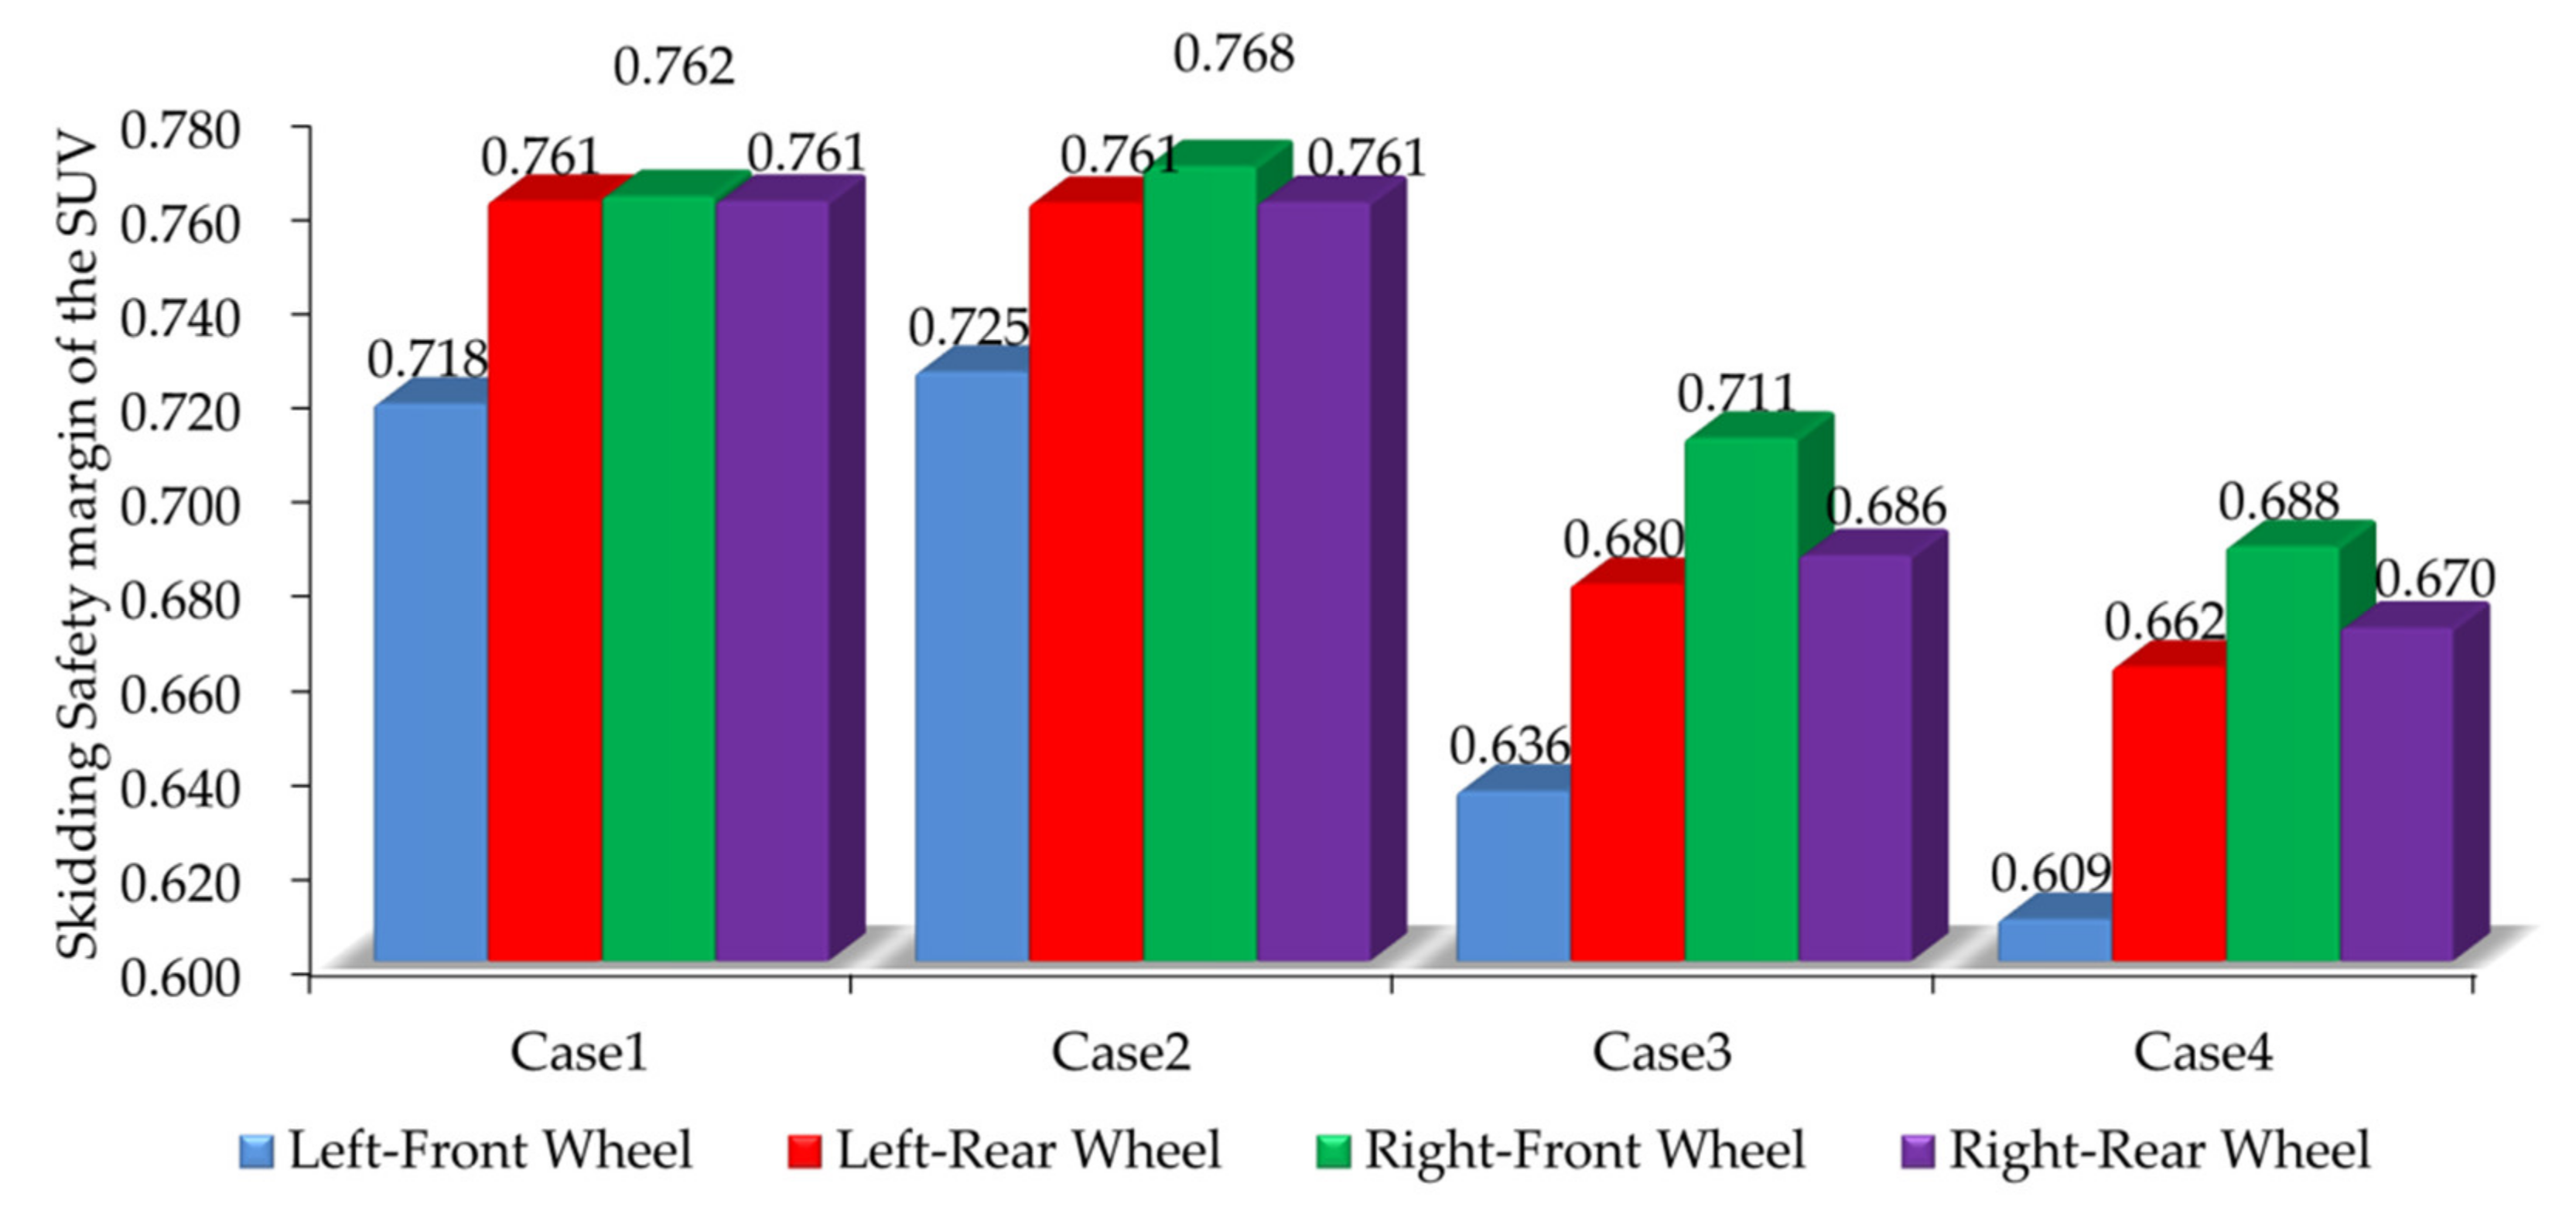
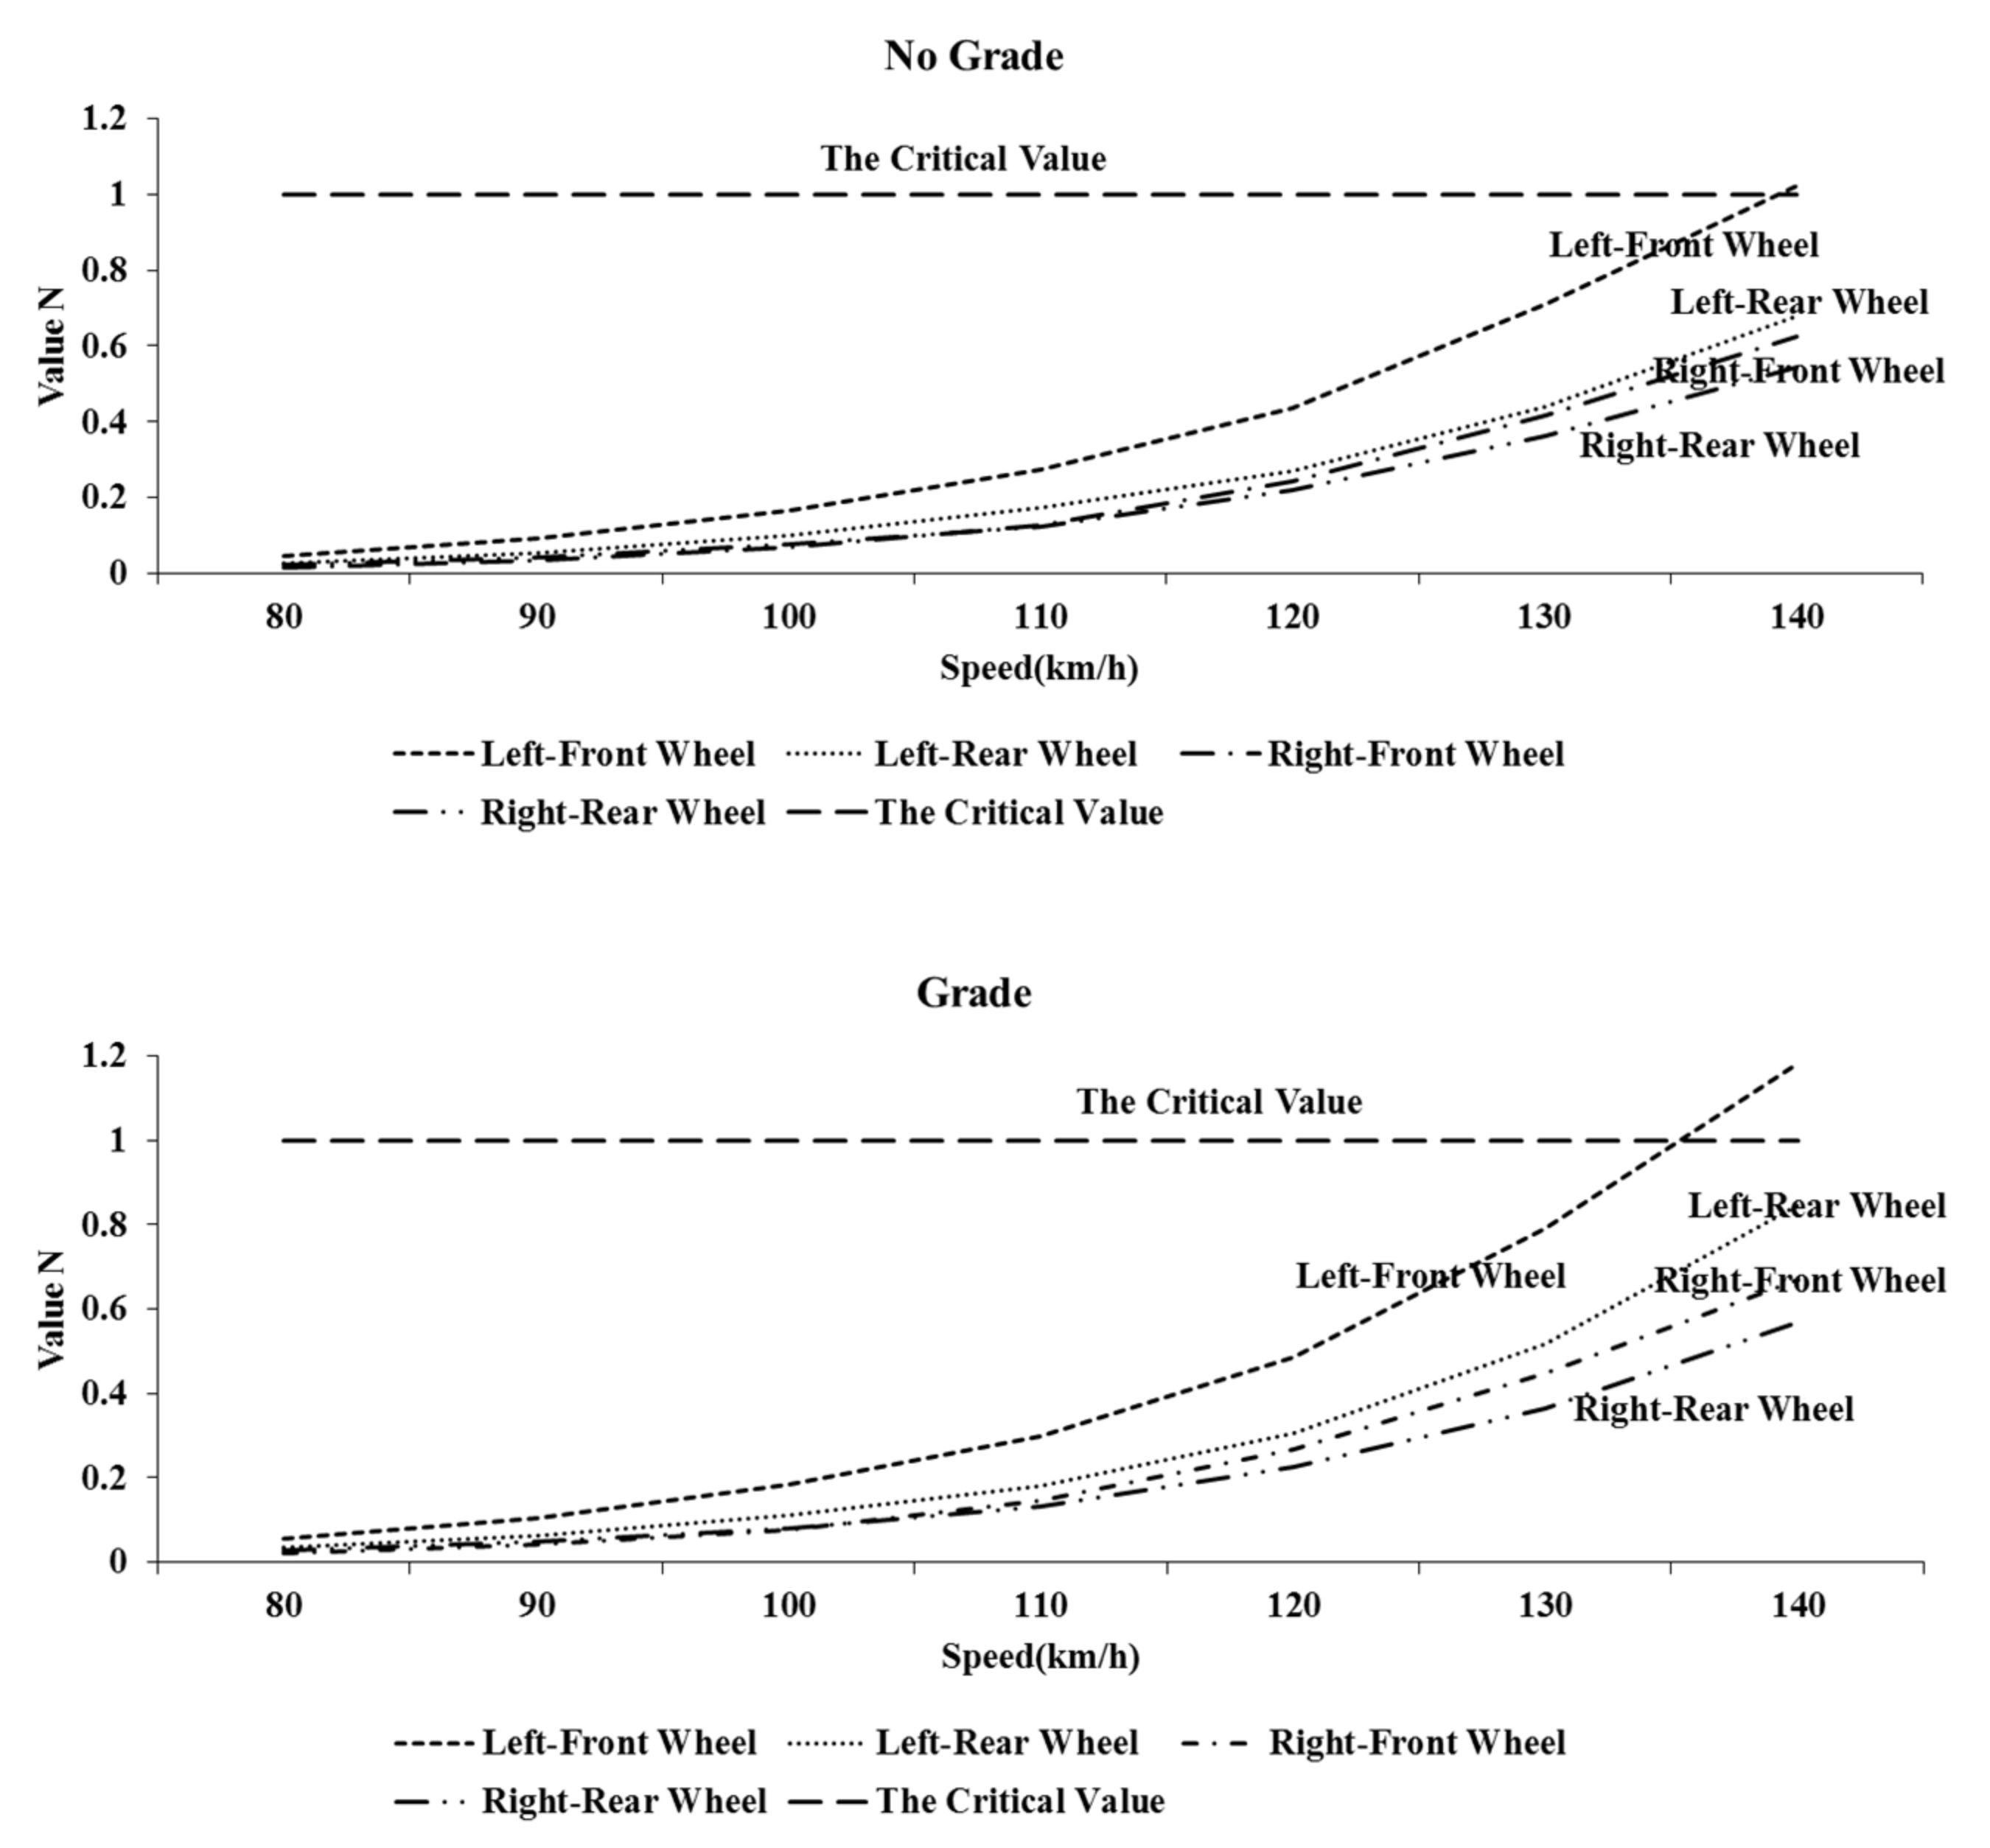
4.1. Determination of the Most Critical Wheel
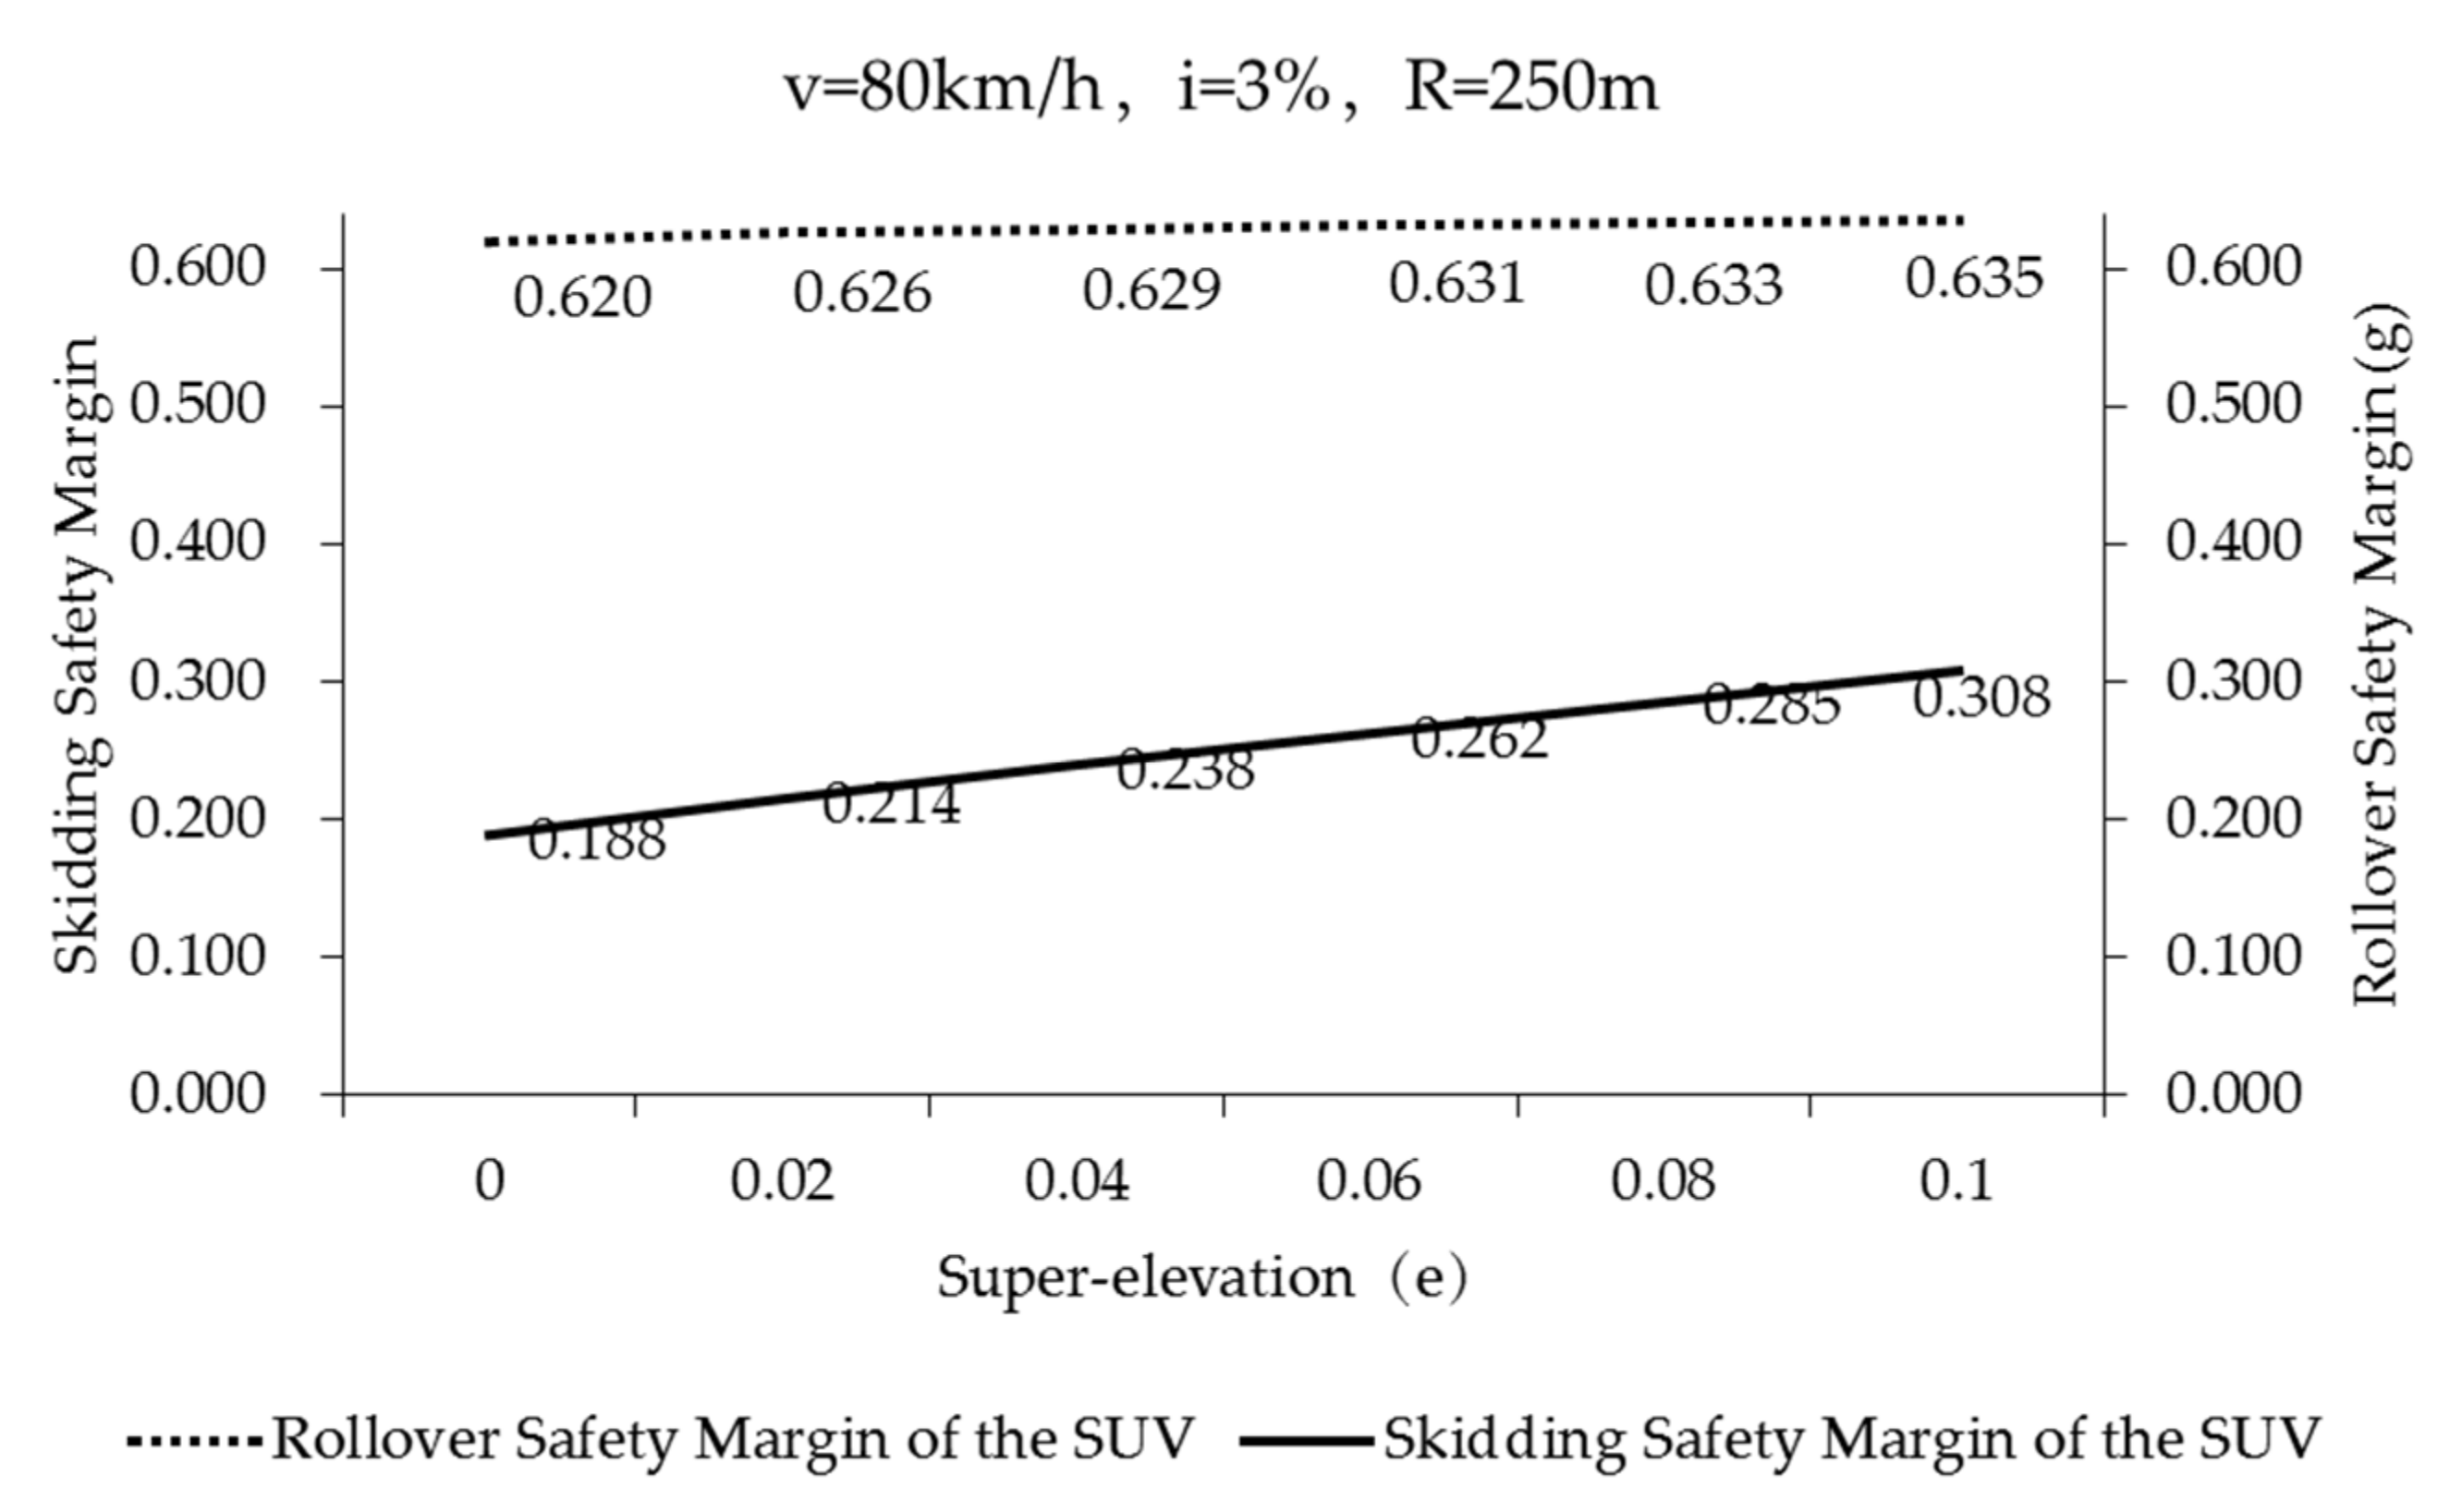
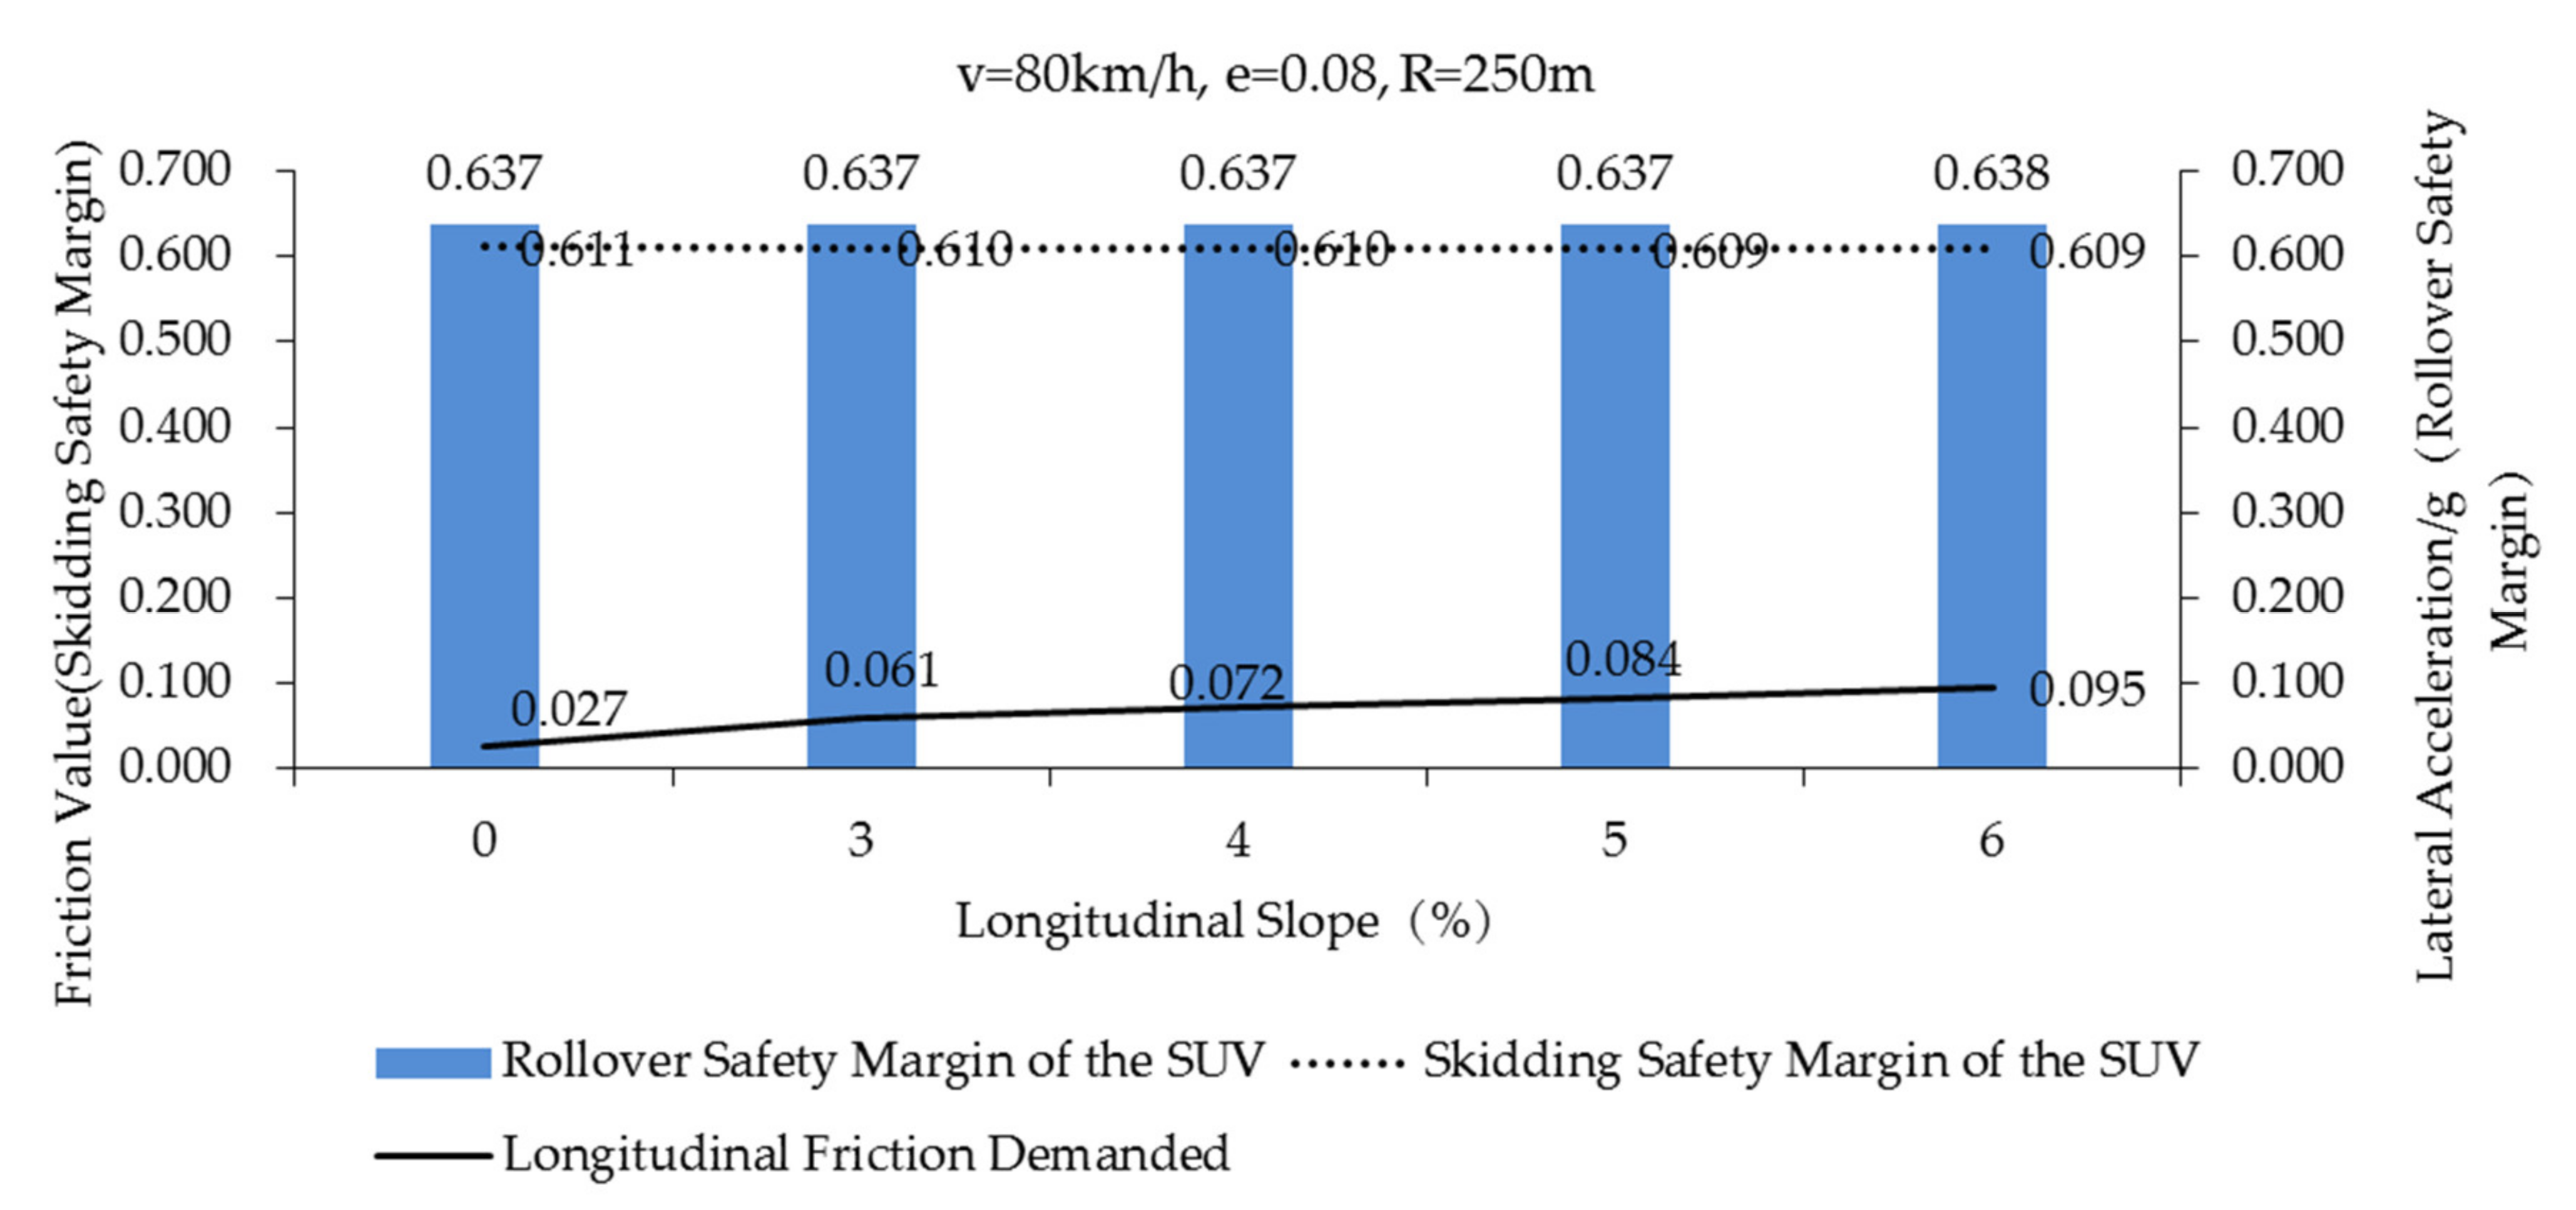
4.2. The Influence of Road Geometry on Vehicle Rollover and Skidding
4.3. Implementation of the Study
4.4. Policy Recommendations
5. Conclusions
Author Contributions
Funding
Acknowledgments
Conflicts of Interest
References
- Kassua, A.; Anderson, M. Analysis of severe and non-severe traffic crashes on wet and dry highways. Transp. Res. Interdiscip. Perspect. 2019, 2, 100043. [Google Scholar] [CrossRef]
- Li, C.; Fang, Q.; Ding, L.; Zhong, B. Risk analysis and management for highway operations safety using a covariate-balanced determinant detector. Accid. Anal. Prev. 2019, 133, 105290. [Google Scholar] [CrossRef] [PubMed]
- Saeed, T.U.; Hall, T.; Baroud, H.; Volovski, M.J. Analyzing road crash frequencies with uncorrelated and correlated random-parameters count models: An empirical assessment of multilane highways. Anal. Methods Accid. Res. 2019, 23, 100101. [Google Scholar] [CrossRef]
- Borsati, M.; Cascarano, M.; Bazzana, F. On the impact of average speed enforcement systems in reducing highway accidents: Evidence from the Italian Safety Tutor. Econ. Transp. 2019, 20, 100123. [Google Scholar] [CrossRef]
- Dadvar, S.; Lee, Y.J.; Shin, H.S. Improving crash predictability of the Highway Safety Manual through optimizing local calibration process. Accid. Anal. Prev. 2020, 136, 105393. [Google Scholar] [CrossRef] [PubMed]
- Barua, S.; El-Basyouny, K.; Islam, M.T. Multivariate random parameters collision count data models with spatial heterogeneity. Anal. Methods Accid. Res. 2016, 9, 1–15. [Google Scholar] [CrossRef]
- Chen, F.; Ma, X.; Chen, S.; Yang, L. Crash Frequency Analysis Using Hurdle Models withRandom Effects Considering Short-Term Panel Data. Int. J. Environ. Res. Public Health. 2016, 13, 1043. [Google Scholar] [CrossRef] [PubMed]
- Wen, H.; Zhang, X.; Zeng, Q.; Lee, J.; Yuan, Q. Investigating Spatial Autocorrelation and Spillover Effects in Freeway Crash-Frequency Data. Int. J. Env. Res. Public Health 2019, 16, 219. [Google Scholar] [CrossRef] [PubMed]
- Chen, S.; Saeed, T.U.; Alinizzi, M.; Lavrenz, S.; Labi, S. Safety sensitivity to roadway characteristics: A comparison across highway classes. Accid. Anal. Prev. 2019, 123, 39–50. [Google Scholar] [CrossRef]
- Ahmad, N.; Ahmed, A.; Wali, B.; Saeed, T.U. Exploring Factors associated with Crash Severity on Motorways in Pakistan. In Proceedings of the Institution of Civil Engineers-Transport; Thomas Telford Ltd: London, UK, 2019; pp. 1–10. [Google Scholar] [CrossRef]
- Chen, S.; Saeed, T.U.; Alqadhi, S.D.; Labi, S. Safety impacts of pavement condition at two-lane and multi-lane highways: Accounting for heterogeneity and seemingly unrelated correlation across crash severities. Transp. A Transp. Sci. 2019, 15, 18–33. [Google Scholar]
- Chen, S.; Saeed, T.U.; Labi, S. Impact of road-surface condition on rural highway safety: A multivariate random-parameters negative binomial approach. Anal. Methods Accid. Res. 2017, 16, 75–89. [Google Scholar] [CrossRef]
- NHTSA. Traffic Safety Facts: 2016: A Compilation of Motor Vehicle Crash Data from the Fatality Analysis Reporting System and the General Estimates System; NHTSA, U.S. Department of Transportation: Washington, DC, USA, 2016. Available online: www.nhtsa.dot.gov (accessed on 8 November 2019).
- Federal Highway Administration, Horiz. Curve Saf. 2014. Available online: https://safety.fhwa.dot.gov/roadway_dept/horicurves/ (accessed on 12 December 2019).
- Chu, D.; Li, Z.; Wang, J.; Wu, C.; Hu, Z. Rollover speed prediction on curves for heavy vehicles using mobile smartphone. Measurement 2018, 130, 404–411. [Google Scholar] [CrossRef]
- Gooch, J.P.; Gayah, V.V.; Donnell, E.T. Quantifying the safety effects of horizontal curves on two-way, two-lane rural roads. Accid. Anal. Prev. 2016, 92, 71–81. [Google Scholar] [CrossRef] [PubMed]
- Yu, Z.S. Automobile Theory, 3rd ed.; China Machine Press: Beijing, China, 2011. [Google Scholar]
- Azimi, G.; Rahimi, A.; Asgari, H.; Jin, X. Severity analysis for large truck rollover crashes using a random parameter ordered logit model. Accid. Anal. Prev. 2020, 135, 105355. [Google Scholar] [CrossRef] [PubMed]
- Kim, T.; Bose, D.; Foster, J.; Bollapragada, V.; Crandall, J.R.; Clauser, M.; Kerrigan, J.R. Identification of characteristics and frequent scenarios of single-vehicle rollover crashes during pre-ballistic phase; part 1—A descriptive study. Accid. Anal. Prev. 2017, 107, 31–39. [Google Scholar] [CrossRef]
- Rusli, R.; Haque, M.M.; King, M.; Voon, W.S. Single-vehicle crashes along rural mountainous highways in Malaysia: An application of random parameters negative binomial model. Accid. Anal. Prev. 2017, 102, 153–164. [Google Scholar] [CrossRef]
- Van Petegem, J.W.H.; Wegman, F. Analyzing road design risk factors for run-off-road crashes in the Netherlands with crash prediction models. J. Saf. Res. 2014, 49, 121–127. [Google Scholar] [CrossRef]
- Farmer, C.M.; Lund, A.K. Rollover risk of cars and light trucks after accounting for driver and environmental factors. Accid. Anal. Prev. 2002, 34, 163–173. [Google Scholar] [CrossRef]
- Fitzpatrick, K.; Lord, D.; Park, B.-J. Horizontal curve accident modificationfactor with consideration of driveway density on rural four-lane highways intexas. ASCE J. Transp. Eng. 2010, 136, 827–835. [Google Scholar] [CrossRef]
- Wang, B.; Hallmark, S.; Savolainen, P.; Dong, J. Crashes and near-crashes on horizontal curves along rural two-lane highways: Analysis of naturalistic driving data. J. Saf. Res. 2017, 63, 163–169. [Google Scholar] [CrossRef]
- Zhang, W. Vehicle Dynamics Analysis of Single Vehicle Road Traffic Accident and Regression Model. Master’s Thesis, Xiamen University, Xiamen, China, 2017. [Google Scholar]
- Sun, L.; You, K.; Wang, D.; Gu, W. Influence analysis of road conditions on vehicle rollover. J. Southeast Univ. (Nat. Sci. Ed.) 2013, 43, 645–648. [Google Scholar]
- Imine, H.; Benallegue, A.; Madani, T.; Srairi, S. Rollover Risk Prediction of Heavy Vehicle Using High-Order Sliding-Mode Observer: Experimental Results. IEEE Trans. Veh. Technol. 2014, 63, 2533–2543. [Google Scholar] [CrossRef]
- Phanomchoeng, G.; Rajamani, R. New Rollover Index for the Detection of Tripped and Untripped Rollovers. IEEE Trans. Ind. Electron. 2013, 60, 4726–4736. [Google Scholar] [CrossRef]
- Larish, C.; Piyabongkarn, D.; Tsourapas, V.; Rajamani, R. A New Predictive Lateral Load Transfer Ratio for Rollover Prevention Systems. IEEE Trans. Veh. Technol. 2013, 62, 2928–2936. [Google Scholar] [CrossRef]
- You, K.S.; Sun, L. Reliability analysis of vehicle stability on combined horizontal and vertical alignments: Driving safety perspective. J. Transp. Eng. 2013, 139, 804–813. [Google Scholar] [CrossRef]
- You, K.S.; Sun, L.; Gu, W.J. Reliability-Based Risk Analysis of Roadway Horizontal Curves. J. Transp. Eng. 2012, 138, 1071–1081. [Google Scholar] [CrossRef]
- Mavromatis, S.; Laiou, A.; Yannis, G. Safety assessment of control design parameters through vehicle dynamics model. Accid. Anal. Prev. 2019, 125, 330–335. [Google Scholar] [CrossRef]
- MOT. Technical Standard of Highway Engineering (JTG B 01—2014). 2014. Available online: https://vdisk.weibo.com/s/qjmrgTLUFDbFh?category_id=4...ref (accessed on 1 December 2019).
- Khattak, A.J.; Rocha, M. Are suvs supremely unsafe vehicles? Analysis of rollovers and injuries with sport utility vehicles. Trans. Res. Rec. J. Trans. Res. Board 2003, 1840, 167–177. [Google Scholar] [CrossRef]
- Anarkooli, A.J.; Hosseinpour, M.; Kardar, A. Investigation of factors affecting the injury severity of single-vehicle rollover crashes: A random-effects generalized ordered probit model. Accid. Anal. Prev. 2017, 106, 399–410. [Google Scholar] [CrossRef]
- Liu, Y.C.; You, R.D.; Yang, W.H. Road Reconnaissance Design, 2rd ed.; China Electric Power Press: Beijing, China, 2010. [Google Scholar]
- Zhang, C.; Meng, L.; Wang, S.J.; Chen, J.B.; Shao, D.J. Sideslip Risk simulation analysis of passenger car braking behavior on expressway curved sections. China J. Highw. Transp. 2015, 28, 135–142. [Google Scholar]
- Kontaratos, M.; Psarianos, B.; Yotis, A. Minimum horizontal curve radius as function of grade incurred by vehicle motion in driving mode. In Transportation Research Record 1445; National Research Council: Washington, DC, USA, 1994; pp. 86–93. [Google Scholar]
- You, K.S. Vehicle Dynamic and Reliability Reliability Based Highway Safety Analysis and Design Optimization. Ph.D. Thesis, Southeast University, Nanjing, China, 2012. [Google Scholar]
- Pacejka, H.B. Tires and Vehicle Dynamics; Elsevier: Oxford, UK, 2005. [Google Scholar]
- Pacejka, H.B.; Sharp, R.S. Shear force development by pneumatic tires in steady state conditions: A Review of Modeling Aspects. Veh. Syst. Dyn. 1991, 20, 121–176. [Google Scholar] [CrossRef]
- Su, Z.C. Study on Vehicle Dynamic Stability Control on Steering and Braking Maneuvers. Master’s Thesis, Chongqing University, Chongqing, China, 2007. [Google Scholar]
- MacAdam, C.C. An optimal preview control for linear systems. J. Dyn. Syst. Meas. Control ASME 1980, 102, 188–190. [Google Scholar] [CrossRef]
- MacAdam, C.C. Application of an optimal preview control for simulation of Closed-loop Automobile Driving. IEEE Trans. Syst. Man Cybern. 1981, 11, 393–399. [Google Scholar] [CrossRef]
- Harwood, D.W.; Mason, J.M. Horizontal curve design for passenger cars and trucks. In Transportation Research Record 1445; Transportation Research Board: Washington, DC, USA, 1994; pp. 22–33. [Google Scholar]
- Lamm, R.; Psarianos, B.; Mailaender, T. Highway Design and Traffic Safety Engineering Handbook; McGraw-Hill Companies: New York, NY, USA, 1999. [Google Scholar]
- Gauss, F. Skid resistance properties of tires and their influence on vehicle control in skidding accidents. In Transportation Research Board 621; TRB, National Research Council: Washington, DC, USA, 1976; pp. 8–18. [Google Scholar]


| Parameter (unit) | Value |
|---|---|
| Sprung mass ms (kg) | 1430 |
| Full vehicle m (kg) | 1610 |
| Moment of inertia of sprung mass around X-axis Ixx (kg.m2) | 700.7 |
| Moment of inertia of sprung mass around Y-axis Iyy (kg.m2) | 2059.2 |
| Moment of inertia of sprung mass around Z-axis Izz (kg.m2) | 2059.2 |
| Horizontal distance between center of mass and front wheels a (mm) | 1050 |
| Horizontal distance between center of mass and rear wheels b (mm) | 1610 |
| Centroid height h (mm) | 650 |
| The height between the center of mass and the center of roll hc (mm) | 573 |
| Front wheelbase cf (mm) | 1565 |
| Rear wheelbase cr (mm) | 1565 |
| Distance from the tilt centers to the ground hf (mm) (front) | 77 |
| Distance from the tilt centers to the ground hr (mm) (rear) | 130 |
| Roll stiffness of suspensions Kf (N.m.rad-1)(front) | 181000 |
| Roll stiffness of suspensions Kr (N.m.rad-1)(rear) | 57000 |
| Damping coefficient of suspensions bf (N.m.rad-1)(front) | 8430 |
| Damping coefficient of suspensions br (N.m.rad-1)(rear) | 8430 |
| Wheel radius R (mm) | 347 |
| Wheel moment of inertia Iw (kg.m2) | 0.9 |
| a0 | a1 | a2 | a3 | a4 | a5 | a6 | a7 | a8 |
| 1.30 | −21.3 | 1101 | 1078 | 1.82 | 0.208 | 0 | −0.354 | 0.707 |
| b0 | b1 | b2 | b3 | b4 | b5 | b6 | b7 | b8 |
| 1.65 | −22.1 | 1144 | 49.6 | 226 | 0.069 | −0.006 | 0.056 | 0.486 |
| Good Friction Pavement(dry) | Poor Friction Pavement (Wet) | ||
|---|---|---|---|
| fTmax | fRmax | fTmax | fRmax |
| 0.85 | 0.78 | 0.5 | 0.46 |
| fRmax = 0.925fTmax | |||
| Road Model | Rmin(m)(80 km/h) | Grade(Upslope) | Super-Elevation | Road Camber |
|---|---|---|---|---|
| Case 1 | ∞ | 0 | 0 | 0.02 |
| Case 2 | ∞ | 6% | 0 | 0.02 |
| Case 3 | 250 | 0 | 0.1 | 0.02 |
| Case 4 | 250 | 6% | 0.08 | 0.02 |
| Rmin: Radius of the Circular Curve | ||||
| Road Models | Rmin(m) | Peak Friction Coefficient fTmax | Grade (Upgrade) | Super-Elevation | Road Camber |
|---|---|---|---|---|---|
| Case 1 | 250 | 0.85 (good friction pavement);0.50 (poor friction pavement) | 3% | 0 | 0.02 |
| Case 2 | 250 | 3% | 0.02 | 0.02 | |
| Case 3 | 250 | 3% | 0.04 | 0.02 | |
| Case 4 | 250 | 3% | 0.06 | 0.02 | |
| Case 5 | 250 | 3% | 0.08 | 0.02 | |
| Case 6 | 250 | 3% | 0.1 | 0.02 | |
| Case 7 | 250 | 0.85 (good friction pavement) | 0 | 0.08 | 0.02 |
| Case 8 | 250 | 3% | 0.08 | 0.02 | |
| Case 9 | 250 | 4% | 0.08 | 0.02 | |
| Case 10 | 250 | 5% | 0.08 | 0.02 | |
| Case 11 | 250 | 6% | 0.08 | 0.02 | |
| fTmax: Peak Friction Coefficient Rmin: Radius of Circular Curve | |||||
© 2020 by the authors. Licensee MDPI, Basel, Switzerland. This article is an open access article distributed under the terms and conditions of the Creative Commons Attribution (CC BY) license (http://creativecommons.org/licenses/by/4.0/).
Share and Cite
Yin, Y.; Wen, H.; Sun, L.; Hou, W. The Influence of Road Geometry on Vehicle Rollover and Skidding. Int. J. Environ. Res. Public Health 2020, 17, 1648. https://doi.org/10.3390/ijerph17051648
Yin Y, Wen H, Sun L, Hou W. The Influence of Road Geometry on Vehicle Rollover and Skidding. International Journal of Environmental Research and Public Health. 2020; 17(5):1648. https://doi.org/10.3390/ijerph17051648
Chicago/Turabian StyleYin, Yanna, Huiying Wen, Lu Sun, and Wei Hou. 2020. "The Influence of Road Geometry on Vehicle Rollover and Skidding" International Journal of Environmental Research and Public Health 17, no. 5: 1648. https://doi.org/10.3390/ijerph17051648
APA StyleYin, Y., Wen, H., Sun, L., & Hou, W. (2020). The Influence of Road Geometry on Vehicle Rollover and Skidding. International Journal of Environmental Research and Public Health, 17(5), 1648. https://doi.org/10.3390/ijerph17051648