Morbidity Rates in an Area with High Livestock Density: A Registry-Based Study Including Different Groups of Patients with Respiratory Health Problems

 ,
,
Abstract

1. Introduction
2. Materials and Methods
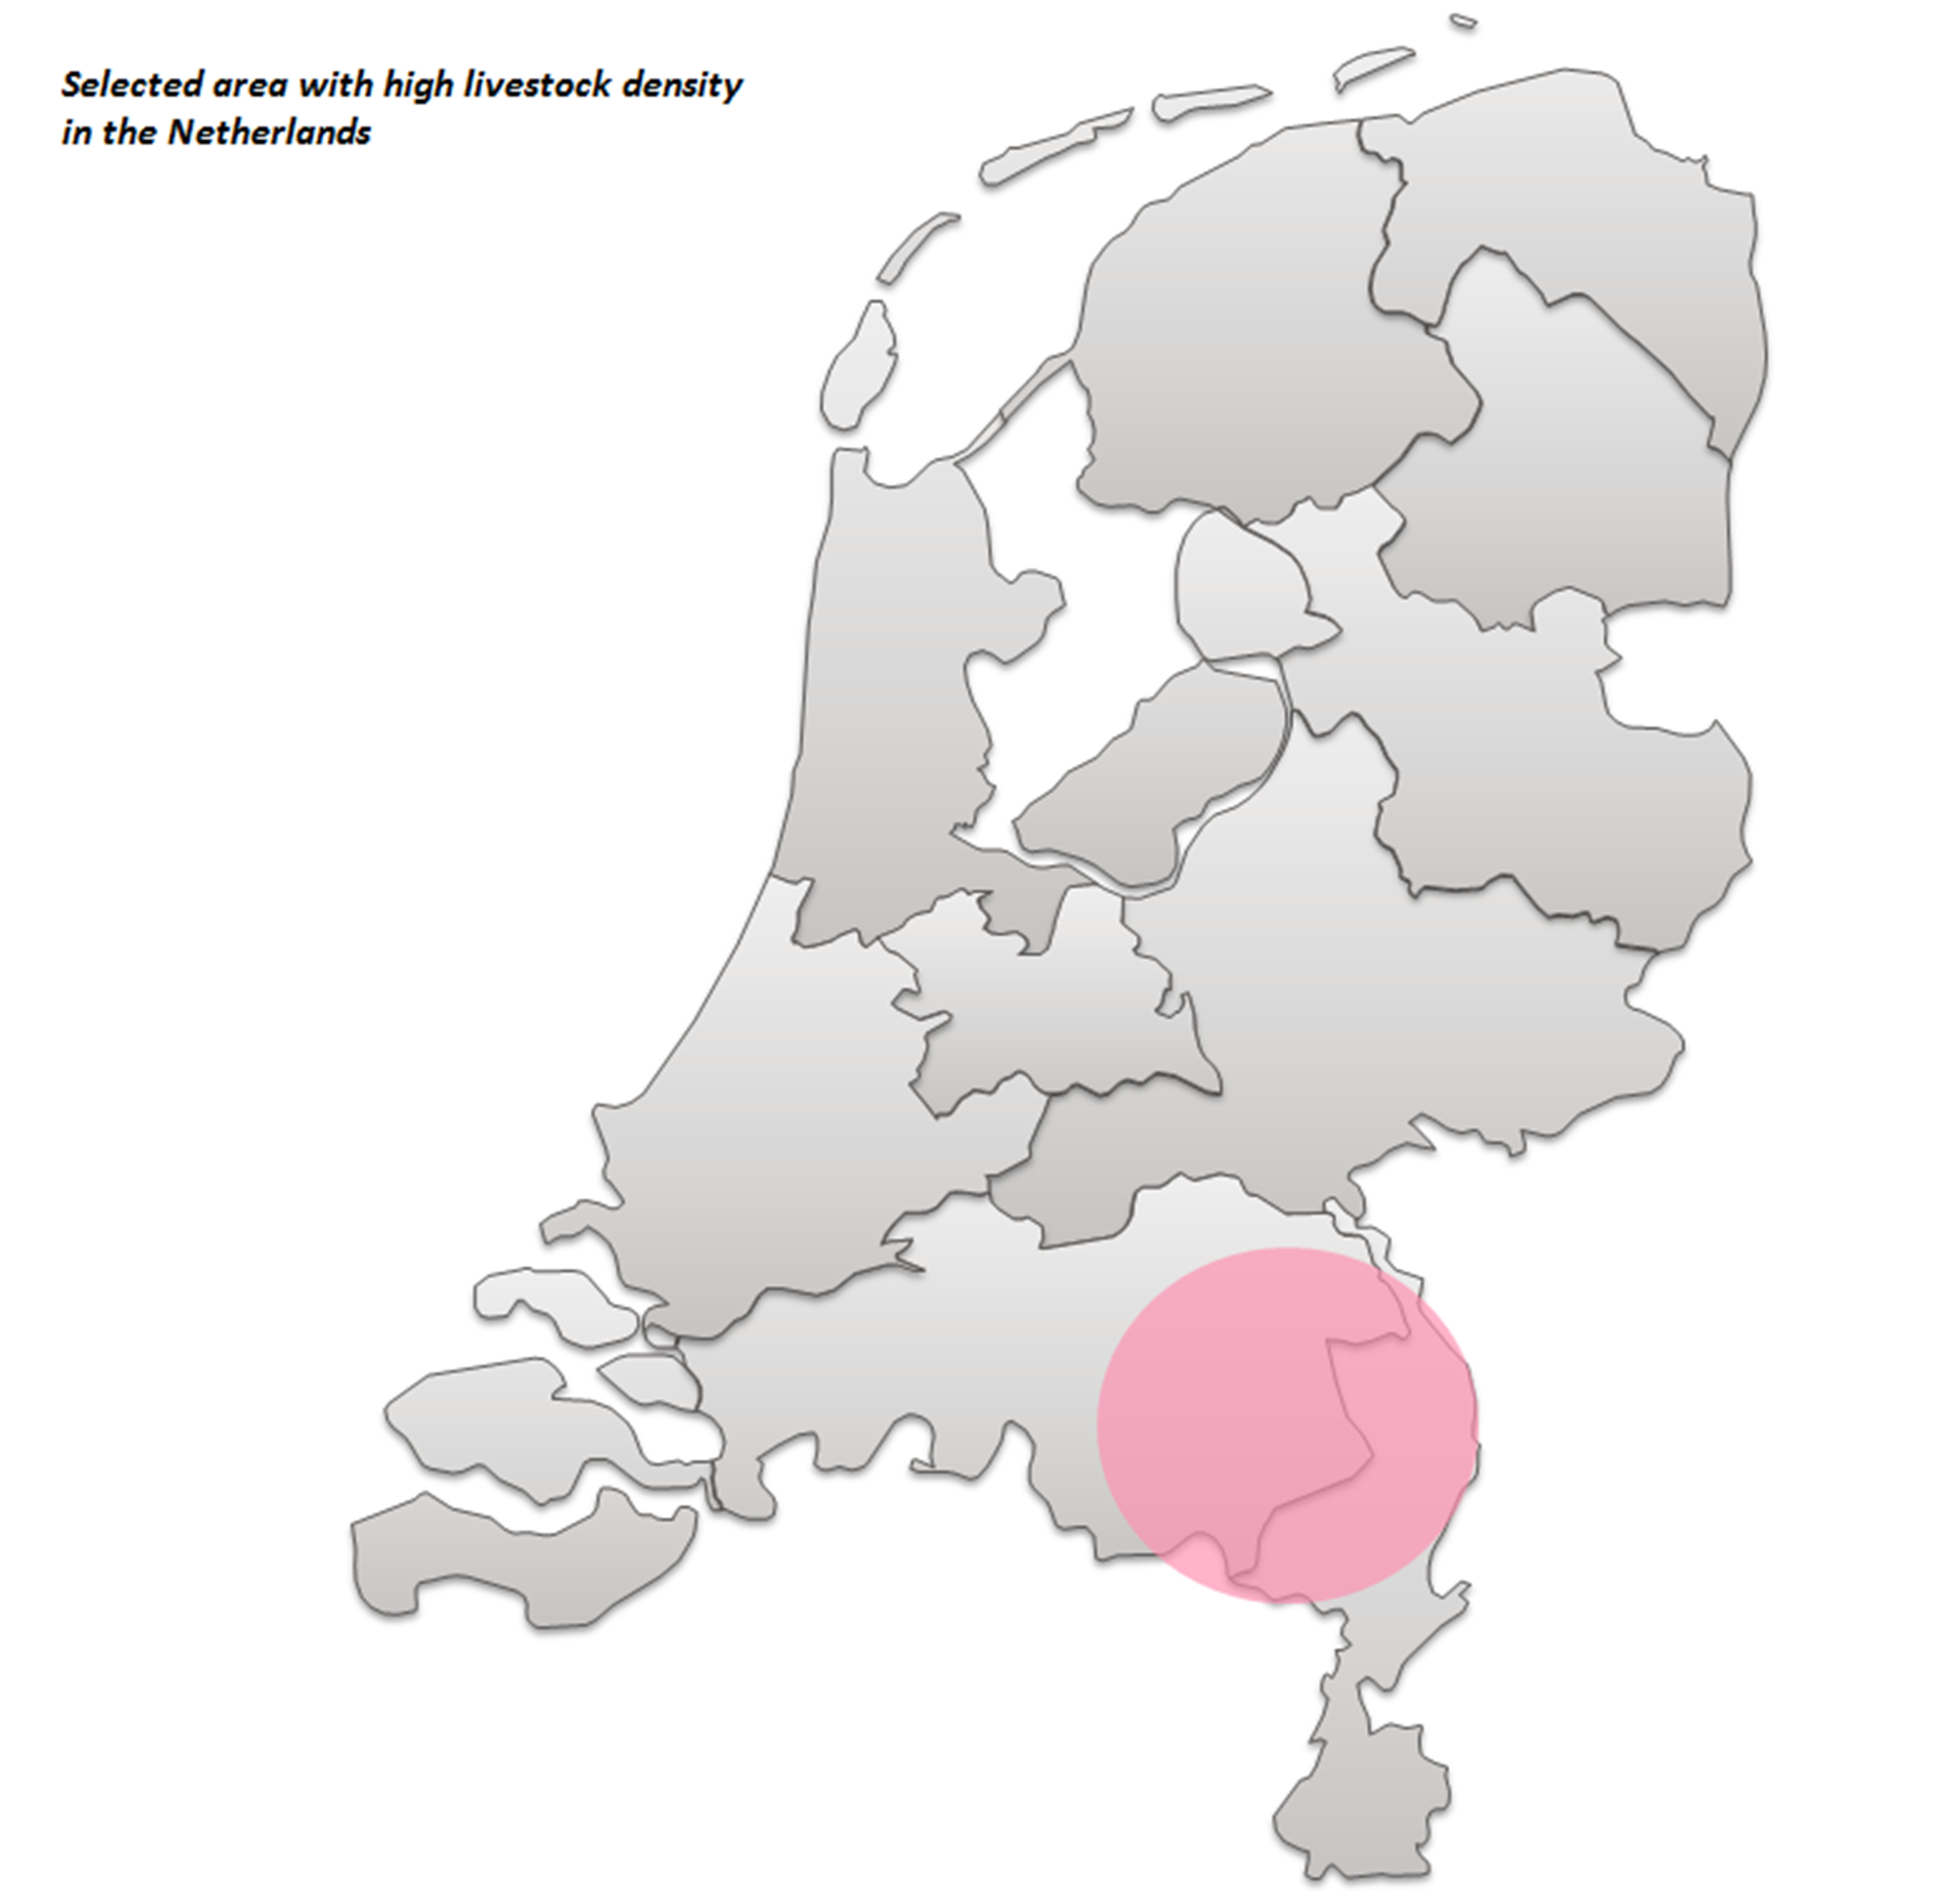
2.1. Study Design and Participants
2.2. Ethics
2.3. Definition of Subgroups
2.4. Health Outcome Assessment
2.5. Statistical Analyses
3. Results
3.1. Sample Characteristics
3.2. Differences in Prevalence Rates between Areas with High and Low Livestock Density
3.3. Differences in Health Outcomes within Respiratory Patient Subgroups
3.4. Differences in Health Outcomes within Susceptible Age Subgroups
3.5. Differences in Prescription of Broad-Spectrum Antibiotics and the Greater Cluster of Anti-Infectives for Systemic Use
4. Discussion
5. Conclusions
Author Contributions
Funding
Acknowledgments
Conflicts of Interest
Appendix A

| Selected Areas | ||||
|---|---|---|---|---|
| Rural Areas with High Livestock Density (Livestock Dense Areas) | Rural Areas with Low Livestock Density (Control Areas) | |||
| General Practices | Patients | General Practices | Patients | |
| 2014 | 25 | 106,688 | 22 | 75,390 |
| 2015 | 24 | 103,621 | 22 | 74,746 |
| 2016 | 24 | 102,975 | 22 | 76,704 |
| Subgroup | Definition |
|---|---|
| Susceptible age subgroups | |
| Children | Age 0–14 years |
| Elderly | Age ≥ 65 years |
| Respiratory patient groups | |
| Pneumonia | Every patient registered with the ICPC code R81 |
| Asthma | Every patient of age ≥ 6 years without COPD, registered with the ICPC code R96 |
| COPD | Every patient of age ≥ 40 years without asthma, registered with the ICPC code R91 or R95 |
| ACOS | Every patient of age ≥ 40 years diagnosed with COPD (ICPC codes R91 or R95) and asthma (ICPC code R96) |
| Respiratory patient groups (alternative case definitions) | |
| Asthma | Every patient registered with the ICPC code R96 |
| COPD | Every patient of age ≥ 40 years registered with the ICPC code R91 or R95 |
| ACOS | Every patient of age ≥ 40 years diagnosed with COPD (ICPC codes R91 or R95) or asthma (ICPC code R96) |
| Health Symptoms/Conditions | ICPC Code (s) |
|---|---|
| Pneumonia | R81 |
| Lower respiratory tract infections | R81–R83 |
| Hay fever/Allergic rhinitis | R97 |
| Asthma | R96 |
| Cough, shortness of breath/dyspnea, wheezing | R02, R03, R05 |
| Chronic bronchitis/ bronchiectasis | R91 |
| COPD | R91, R95 |
| Lung cancer | R84–R85 |
| Upper respiratory tract infections | R74–R78 |
| Influenza | R80 |
| Chronic enteritis/Ulcerative colitis | D94 |
| Vertigo/Dizziness | N17 |
| Eczema | S87 |
| Gastroenteritis | D70, D73 |
| Coronary heart disease | K74–K76 |
| Vertiginous syndrome | H82 |
| Depression | P03, P76 |
| Hypertension | K86 |
| 2014 | 2015 | 2016 | |
|---|---|---|---|
| Livestock dense areas | |||
| Gender (% female) | 49.6 | 49.5 | 49.5 |
| Age (mean (SD) | 42.6 (23.1) | 43.1 (23.2) | 43.6 (23.3) |
| Children n | 15,674 | 14,795 | 14,108 |
| Elderly n | 21,280 | 21,528 | 22,178 |
| Respiratory patient groups | |||
| Pneumonia | |||
| Subjects n | 2865 | 3349 | 3032 |
| Gender (% female) | 50.0 | 47.0 | 47.5 |
| Age (mean (SD) | 56.9 (26.4) | 57.8 (26.3) | 57.6 |
| Asthma | |||
| Subjects n | 6933 | 6824 | 7063 |
| Gender (% female) | 50.5 | 50.2 | 50.2 |
| Age (mean (SD) | 37.8 (21.2) | 38.3 (21.4) | 38.9 (21.5) |
| COPD | |||
| Subjects n | 2814 | 2768 | 2738 |
| Gender (% female) | 43.9 | 44.3 | 44.7 |
| Age (mean (SD) | 69.5 (11.1) | 69.7 (11.1) | 69.8 (11.1) |
| ACOS | |||
| Subjects n | 945 | 950 | 981 |
| Gender (% female) | 52.6 | 52.5 | 51.9 |
| Age (mean (SD) | 66.4 (11.7) | 67.0 (11.7) | 67.6 (11.7) |
| CONTROL AREAS | |||
| Total sample | |||
| Gender (% female) | 49.9 | 49.7 | 49.7 |
| Age (mean (SD) | 43.0 (23.5) | 43.5 (23.5) | 43.6 (23.6) |
| Children n | 11,526 | 11,080 | 11,118 |
| Elderly n | 15,991 | 16,211 | 16,999 |
| Respiratory patient groups | |||
| Pneumonia | |||
| Subjects n | 984 | 1107 | 1012 |
| Gender (% female) | 50.0 | 47.2 | 46.5 |
| Age (mean (SD) | 57.7 (26.6) | 58.8 (25.7) | 57.6 |
| Asthma | |||
| Subjects n | 5597 | 5746 | 6011 |
| Gender (% female) | 53.2 | 53.2 | 52.9 |
| Age (mean (SD) | 39.5 (21.2) | 40.0 (21.3) | 40.6 (21.4) |
| COPD | |||
| Subjects n | 2205 | 2139 | 2184 |
| Gender (% female) | 43.5 | 43.9 | 44.0 |
| Age (mean (SD) | 70.7 (11.6) | 71.1 (11.5) | 71.1 (11.4) |
| ACOS | |||
| Subjects n | 738 | 749 | 773 |
| Gender (% female) | 53.9 | 54.1 | 53.8 |
| Age (mean (SD) | 66.1 (12.0) | 66.5 (12.1) | 67.0 (12.1) |
| Average Prevalence 2014–2016 | ||
|---|---|---|
| Livestock Dense Area | Control Area | |
| Pneumonia | 2.01 | 1.43 |
| Lower respiratory tract infections | 2.28 | 1.85 |
| Hay fever/Allergic rhinitis | 3.89 | 4.14 |
| Asthma a | 8.14 | 9.55 |
| Cough, shortness of breath/dyspnea, wheezing | 7.68 | 6.61 |
| Chronic bronchitis/bronchiectasis b | 1.59 | 1.25 |
| COPD b | 6.35 | 6.99 |
| Lung cancer b | 0.72 | 0.69 |
| Upper respiratory tract infections | 9.57 | 10.5 |
| Influenza | 0.62 | 0.76 |
| Chronic enteritis/Ulcerative colitis | 0.88 | 0.81 |
| Vertigo/Dizziness | 1.73 | 1.51 |
| Eczema | 9.54 | 8.87 |
| Gastroenteritis | 1.31 | 1.16 |
| Coronary heart disease b | 8.99 | 8.81 |
| Vertiginous syndrome | 1.48 | 1.14 |
| Depression | 3.93 | 3.29 |
| Hypertension b | 25.9 | 27.2 |
| 2014 | 2015 | 2016 | |
|---|---|---|---|
| Pneumonia | 1.43 (0.75–2.73) | 1.98 (0.95–4.14) | 2.22 (1.20–4.1) |
| Lower respiratory tract infections | 1.31 (0.71–2.42) | 1.80 (0.89–3.63) | 1.87 (0.99–3.53) |
| Hay fever/Allergic rhinitis | 1.01 (0.74–1.37) | 1.06 (0.78–1.44) | 1.07 (0.78–1.48) |
| Asthma c | 1.05 (0.74–1.48) | 0.96 (0.69–1.35) | 1.01 (0.70–1.46) |
| Cough, shortness of breath/dyspnea, wheezing | 1.15 (0.82–1.61) | 1.31 (0.96–1.78) | 1.15 (0.83–1.58) |
| Upper respiratory tract infections | 0.99 (0.78–1.25) | 1.02 (0.82–1.26) | 1.13 (0.81–1.58) |
| Influenza | 1.19 (0.41–3.47) | 0.79 (0.31–2.04) | 1.23 (0.61–2.49) |
| Chronic enteritis/Ulcerative colitis | 1.12 (0.20–6.35) | 2.27 (0.28–18.6) | 2.31 (0.24–21.8) |
| Vertigo/Dizziness | 0.92 (0.41–2.03) | 2.15 (0.83–5.57) | 1.00 (0.38–2.60) |
| Eczema | 1.11 (0.79–1.56) | 1.14 (0.84–1.55) | 1.09 (0.81–1.46) |
| Gastroenteritis | 1.05 (0.74–1.48) | 1.17 (0.83–1.64) | 1.26 (0.88–1.82) |
| Vertiginous syndrome | 1.77 (0.45–6.97) | 3.68 (0.44–30.3) | 10.9 (0.67–178.5) |
| Depression | 0.70 (0.35–1.41) | 0.84 (0.40–1.74) | 0.80 (0.35–1.80) |
| 2014 | 2015 | 2016 | |
|---|---|---|---|
| Pneumonia | 1.49 (0.98–2.25) | 1.55 (1.09–2.20) | 1.70 (1.18–2.45) |
| Lower respiratory tract infections | 1.38 (0.93–2.04) | 1.49 (1.06–2.10) | 1.61 (1.13–2.29) |
| Hay fever/Allergic rhinitis | 0.91 (0.62–1.34) | 0.97 (0.67–1.40) | 0.99 (0.71–1.39) |
| Asthma | 0.85 (0.64–1.14) | 0.82 (0.62–1.08) | 0.86 (0.67–1.11) |
| Cough, shortness of breath/dyspnea, wheezing | 1.23 (0.94–1.62) | 1.33 (1.04–1.68) | 1.38 (1.03–1.84) |
| Chronic bronchitis/bronchiectasis | 1.40 (0.85–2.30) | 1.35 (0.82–2.22) | 1.42 (0.90–2.24) |
| COPD | 0.93 (0.76–1.15) | 0.95 (0.77–1.17) | 0.97 (0.80–1.18) |
| Lung cancer | 1.07 (0.85–1.35) | 1.04 (0.83–1.32) | 1.23 (0.91–1.67) |
| Upper respiratory tract infections | 0.93 (0.74–1.17) | 0.92 (0.73–1.17) | 0.85 (0.65–1.11) |
| Influenza | 1.35 (0.55–3.29) | 1.26 (0.46–3.46) | 1.27 (0.77–2.08) |
| Chronic enteritis/Ulcerative colitis | 1.11 (0.81–1.52) | 1.16 (0.86–1.55) | 1.15 (0.86–1.53) |
| Vertigo/Dizziness | 1.28 (0.94–1.75) | 1.27 (0.93–1.73) | 1.16 (0.81–1.67) |
| Eczema | 1.12 (0.62–2.04) | 1.12 (0.64–1.97) | 1.11 (0.63–1.95) |
| Gastroenteritis | 1.02 (0.74–1.41) | 1.02 (0.70–1.49) | 1.31 (0.88–1.95) |
| Coronary heart disease | 1.13 (0.92–1.40) | 1.11 (0.90–1.37) | 1.12 (0.92–1.35) |
| Vertiginous syndrome | 1.52 (1.11–2.08) | 1.54 (1.11–2.14) | 1.46 (1.05–2.03) |
| Depression | 1.38 (1.02–1.86) | 1.45 (1.08–1.94) | 1.30 (0.98–1.72) |
| Hypertension | 1.00 (0.79–1.25) | 1.00 (0.80–1.24) | 1.00 (0.80–1.25) |
| 2014 | 2015 | 2016 | |
|---|---|---|---|
| Hay fever/Allergic rhinitis | 0.73 (0.19–2.77) | 0.30 (0.10–1.23) | 0.80 (0.18–3.55) |
| Asthma c | 0.61 (0.20–1.89) | 0.51 (0.20–1.3) | 1.23 (0.36–4.13) |
| Cough, shortness of breath/dyspnea, wheezing | 2.19 (0.98–4.85) | 1.71 (0.82–3.57) | 2.01 (0.81–4.96) |
| Upper respiratory tract infections | 0.85 (0.46–1.54) | 0.96 (0.51–1.81) | 0.98 (0.42–2.29) |
| Influenza | i.n.c | i.n.c | 1.83 (0.20–16.5) |
| Chronic enteritis/Ulcerative colitis | i.n.c | i.n.c | i.n.c |
| Vertigo/Dizziness | i.n.c | i.n.c | i.n.c |
| Eczema | 1.37 (0.69–2.72) | 0.76 (0.34–1.70) | 0.85 (0.38–1.88) |
| Gastroenteritis | 2.74 (0.64–11.8) | 0.82 (0.30–2.27) | 1.78 (0.33–9.69) |
| Vertiginous syndrome | i.n.c | i.n.c | i.n.c |
| Depression | i.n.c | i.n.c | i.n.c |
| 2014 | 2015 | 2016 | |
|---|---|---|---|
| Hay fever/Allergic rhinitis | 1.21 (0.40–3.60) | 0.82 (0.35–1.94) | 0.98 (0.37–2.55) |
| Asthma | 0.58 (0.32–1.04) | 0.73 (0.42–1.26) | 0.77 (0.45–1.31) |
| Cough, shortness of breath/dyspnea, wheezing | 1.27 (0.73–2.22) | 1.36 (0.80–2.31) | 1.19 (0.66–2.15) |
| Chronic bronchitis/bronchiectasis | 1.48 (0.68–3.18) | 1.64 (0.73–3.68) | 1.01 (0.49–2.08) |
| COPD | 0.89 (0.57–1.38) | 0.87 (0.56–1.35) | 0.84 (0.62–1.15) |
| Lung cancer | 1.26 (0.61–2.62) | 0.80 (0.40–1.60) | 1.14 (0.51–2.54) |
| Upper respiratory tract infections | 0.95 (0.64–1.39) | 0.71 (0.53–0.96) | 0.74 (0.50–1.09) |
| Influenza | 2.97 (0.39–22.5) | 0.91 (0.19–4.32) | 1.15 (0.43–3.11) |
| Chronic enteritis/Ulcerative colitis | 2.66 (0.35–20.3) | 0.93 (0.21–4.01) | 1.58 (0.46–5.38) |
| Vertigo/Dizziness | 1.59 (0.77–3.30) | 1.42 (0.61–3.28) | 1.30 (0.63–2.66) |
| Eczema | 1.34 (0.58–3.06) | 0.93 (0.49–1.78) | 1.22 (0.60–2.46) |
| Gastroenteritis | 1.24 (0.54–2.82) | 0.72 (0.30–1.69) | 1.68 (0.62–4.57) |
| Coronary heart disease | 1.40 (1.00–1.96) | 0.98 (0.72–1.33) | 0.93 (0.63–1.38) |
| Vertiginous syndrome | 2.01 (0.76–5.32) | 1.63 (0.66–4.03) | 0.90 (0.36–2.26) |
| Depression | 1.34 (0.69–2.59) | 1.58 (0.81–3.07) | 1.28 (0.64–2.56) |
| Hypertension | 0.88 (0.57–1.37) | 1.02 (0.69–1.50) | 1.23 (0.81–1.86) |
| 2014 | 2015 | 2016 | |
|---|---|---|---|
| Pneumonia | 0.95 (0.37–2.42) | 0.91 (0.33–2.52) | 1.73 (0.70–4.26) |
| Lower respiratory tract infections | 1.04 (0.43–2.53) | 0.92 (0.33–2.60) | 1.38 (0.60–3.18) |
| Hay fever/Allergic rhinitis | 0.79 (0.48–1.3) | 0.90 (0.55–1.45) | 0.81 (0.48–1.37) |
| Cough, shortness of breath/dyspnea, wheezing | 1.56 (0.82–2.97) | 1.30 (0.7–2.43) | 1.26 (0.72–2.19) |
| Upper respiratory tract infections | 1.01 (0.68–1.53) | 0.90 (0.63–1.30) | 0.77 (0.45–1.31) |
| Influenza | i.n.c | 1.11 (0.15–8.32) | 0.85 (0.30–2.43) |
| Chronic enteritis/Ulcerative colitis | i.n.c | 2.93 (0.13–63.3) | i.n.c |
| Vertigo/Dizziness | i.n.c | 2.00 (0.23–17.5) | 0.32 (0.03–3.23) |
| Eczema | 0.93 (0.63–1.36) | 0.98 (0.67–1.43) | 1.00 (0.67–1.49) |
| Gastroenteritis | 0.64 (0.26–1.56) | 1.07 (0.36–3.17) | 1.38 (0.47–4.05) |
| Vertiginous syndrome | i.n.c | i.n.c | i.n.c |
| Depression | 0.69 (0.13–3.57) | 1.33 (0.19–9.30) | 0.80 (0.03–17.7) |
| 2014 | 2015 | 2016 | |
|---|---|---|---|
| Pneumonia | 1.18 (0.57–2.42) | 1.73 (0.81–3.66) | 1.82 (0.84–3.95) |
| Lower respiratory tract infections | 1.19 (0.58–2.45) | 1.86 (0.96–3.61) | 2.09 (1.00–4.36) ‡ |
| Hay fever/Allergic rhinitis | 0.67 (0.34–1.33) | 0.77 (0.43–1.38) | 1.20 (0.60–2.41) |
| Cough, shortness of breath/dyspnea, wheezing | 1.39 (0.82–2.38) | 1.46 (0.88–2.44) | 1.40 (0.85–2.31) |
| Lung cancer | 1.03 (0.31–3.40) | 0.69 (0.19–2.51) | 1.10 (0.34–3.55) |
| Upper respiratory tract infections | 1.02 (0.63–1.62) | 0.91 (0.61–1.38) | 0.88 (0.52–1.48) |
| Influenza | 0.66 (0.06–7.02) | 1.30 (0.13–12.8) | 1.56 (0.38–6.40) |
| Chronic enteritis/Ulcerative colitis | 3.09 (0.82–11.6) | 3.00 (0.79–11.4) | 1.55 (0.51–4.72) |
| Vertigo/Dizziness | 1.87 (0.85–4.10) | 1.19 (0.66–2.14) | 1.48 (0.78–2.77) |
| Eczema | 1.45 (0.67–3.10) | 1.52 (0.80–2.88) | 1.57 (0.82–3.02) |
| Gastroenteritis | 0.30 (0.08–1.09) | 0.94 (0.36–2.44) | 1.32 (0.37–4.68) |
| Coronary heart disease | 1.10 (0.72–1.68) | 1.10 (0.71–1.71) | 1.08 (0.73–1.60) |
| Vertiginous syndrome | 0.87 (0.44–1.73) | 1.10 (0.53–2.27) | 1.08 (0.58–2.01) |
| Depression | 1.28 (0.66–2.51) | 1.33 (0.77–2.29) | 1.15 (0.65–2.03) |
| Hypertension | 0.96 (0.70–1.32) | 0.96 (0.70–1.33) | 1.07 (0.79–1.44) |
| 2014 | 2015 | 2016 | |
|---|---|---|---|
| Pneumonia | 1.10 (0.72–1.66) | 1.25 (0.75–2.08) | 1.38 (0.88–2.17) |
| Lower respiratory tract infections | 1.06 (0.74–1.51) | 1.23 (0.77–1.96) | 1.36 (0.88–2.10) |
| Hay fever/Allergic rhinitis | 0.97 (0.70–1.36) | 1.02 (0.75–1.40) | 1.06 (0.77–1.45) |
| Cough, shortness of breath/dyspnea, wheezing | 1.28 (0.86–1.89) | 1.37 (0.96–1.96) | 1.53 (1.05–2.24) |
| Chronic bronchitis/bronchiectasis c | 1.79 (0.90–3.56) | 1.87 (1.00–3.49) ‡ | 1.84 (1.00–3.37) ‡ |
| COPD c | 1.15 (0.81–1.63) | 1.18 (0.84–1.65) | 1.21 (0.86–1.70) |
| Lung cancer c | 1.27 (0.62–2.60) | 0.99 (0.48–2.02) | 1.26 (0.65–2.47) |
| Upper respiratory tract infection | 0.95 (0.74–1.22) | 0.94 (0.74–1.19) | 0.85 (0.62–1.16) |
| Influenza | 1.18 (0.38–3.63) | 0.88 (0.27–2.81) | 1.00 (0.58–1.72) |
| Chronic enteritis/Ulcerative colitis | 0.96 (0.63–1.45) | 0.93 (0.61–1.41) | 0.95 (0.63–1.43) |
| Vertigo/Dizziness | 1.26 (0.82–1.94) | 1.14 (0.78–1.67) | 1.46 (0.99–2.15) |
| Eczema | 1.06 (0.73–1.54) | 1.08 (0.74–1.57) | 1.12 (0.78–1.6) |
| Gastroenteritis | 0.89 (0.55–1.43) | 1.15 (0.75–1.76) | 1.43 (0.93–2.2) |
| Coronary heart disease c | 0.98 (0.69–1.39) | 0.95 (0.68–1.33) | 0.94 (0.70–1.28) |
| Vertiginous syndrome | 1.27 (0.89–1.81) | 1.42 (0.99–2.05) | 1.12 (0.77–1.63) |
| Depression | 1.26 (0.85–1.86) | 1.32 (0.95–1.84) | 1.20 (0.89–1.62) |
| Hypertension c | 1.06 (0.83–1.37) | 1.07 (0.84–1.38) | 1.08 (0.84–1.38) |
| Broad-spectrum antibiotics ÷ | 0.95 (0.75–1.22) | 0.87 (0.65–1.15) | 0.87 (0.64–1.18) |
| All anti-infectives L | 0.96 (0.79–1.17) | 0.90 (0.72–1.14) | 0.93 (0.72–1.19) |
| 2014 | 2015 | 2016 | |
|---|---|---|---|
| Pneumonia | 0.95 (0.37–2.41) | 0.86 (0.32–2.32) | 1.71 (0.70–4.18) |
| Lower respiratory tract infections | 1.04 (0.42–2.52) | 0.88 (0.32–2.40) | 1.36 (0.59–3.14) |
| Hay fever/Allergic rhinitis | 0.79 (0.48–1.29) | 0.89 (0.55–1.44) | 0.80 (0.48–1.32) |
| Cough, shortness of breath/dyspnea, wheezing | 1.57 (0.83–2.99) | 1.30 (0.70–2.42) | 1.25 (0.72–2.17) |
| Upper respiratory tract infection | 1.05 (0.69–1.58) | 0.92 (0.64–1.32) | 0.79 (0.46–1.35) |
| Influenza | i.n.c | 1.11 (0.15–8.20) | 0.84 (0.30–2.40) |
| Chronic enteritis/Ulcerative colitis | i.n.c | 2.92 (0.13–63.3) | i.n.c |
| Vertigo/Dizziness | i.n.c | 2.01 (0.23–17.5) | 0.32 (0.03–3.24) |
| Eczema | 0.93 (0.63–1.35) | 0.98 (0.67–1.43) | 0.99 (0.67–1.47) |
| Gastroenteritis | 0.63 (0.26–1.55) | 1.13 (0.38–3.38) | 1.56 (0.53–4.62) |
| Vertiginous syndrome | i.n.c | i.n.c | i.n.c |
| Depression | 0.69 (0.13–3.56) | 1.32 (0.19–9.30) | 0.8 (0.03–17.7) |
| Broad-spectrum antibiotics ÷ | 1.27 (0.73–2.21) | 1.20 (0.63–2.29) | 0.70 (0.40–1.23) |
| All anti-infectives L | 1.02 (0.69–1.51) | 0.92 (0.55–1.55) | 0.89 (0.55–1.45) |
| 2014 | 2015 | 2016 | |
|---|---|---|---|
| Pneumonia | 1.09 (0.60–1.98) | 1.38 (0.71–2.67) | 1.55 (0.86–2.80) |
| Lower respiratory tract infections | 1.00 (0.56–1.75) | 1.41 (0.78–2.53) | 1.68 (0.96–2.92) |
| Hay fever/Allergic rhinitis | 0.71 (0.40–1.25) | 0.78 (0.46–1.32) | 1.15 (0.63–2.08) |
| Cough, shortness of breath/dyspnea, wheezing | 1.36 (0.83–2.21) | 1.42 (0.93–2.17) | 1.62 (1.01–2.60) |
| Chronic bronchitis/bronchiectasis | 1.74 (0.82–3.73) | 1.85 (0.91–3.72) | 1.76 (0.89–3.48) |
| COPD | 1.16 (0.80–1.69) | 1.19 (0.82–1.74) | 1.24 (0.86–1.80) |
| Lung cancer | 1.17 (0.51–2.70) | 0.95 (0.40–2.26) | 1.35 (0.58–3.15) |
| Upper respiratory tract infection | 1.05 (0.68–1.62) | 0.93 (0.63–1.37) | 0.85 (0.50–1.43) |
| Influenza | 0.73 (0.14–3.82) | 1.09 (0.16–7.48) | 1.22 (0.42–3.49) |
| Chronic enteritis/Ulcerative colitis | 1.86 (0.66–5.22) | 2.02 (0.64–6.35) | 1.47 (0.54–4.00) |
| Vertigo/Dizziness | 1.47 (0.82–2.61) | 1.23 (0.76–1.99) | 1.56 (0.93–2.62) |
| Eczema | 1.48 (0.71–3.05) | 1.42 (0.77–2.61) | 1.44 (0.79–2.62) |
| Gastroenteritis | 0.48 (0.18–1.26) | 0.98 (0.44–2.20) | 1.09 (0.49–2.40) |
| Coronary heart disease | 1.01 (0.69–1.49) | 1.01 (0.69–1.46) | 1.00 (0.71–1.42) |
| Vertiginous syndrome | 1.18 (0.68–2.05) | 1.45 (0.81–2.58) | 1.17 (0.70–1.98) |
| Depression | 1.22 (0.69–2.17) | 1.25 (0.83–1.89) | 1.17 (0.77–1.79) |
| Hypertension | 1.04 (0.76–1.42) | 1.02 (0.75–1.39) | 1.09 (0.82–1.45) |
| Broad-spectrum antibiotics ÷ | 1.00 (0.68–1.45) | 0.96 (0.70–1.33) | 0.92 (0.63–1.36) |
| All anti-infectives L | 0.96 (0.71–1.31) | 0.89 (0.65–1.20) | 0.94 (0.67–1.30) |
| 2014 | 2015 | 2016 | |
|---|---|---|---|
| Pneumonia | 1.55 (0.98–2.44) | 1.56 (0.99–2.47) | 1.44 (0.94–2.22) |
| Asthma | 0.96 (0.70–1.31) | 0.92 (0.66–1.28) | 0.95 (0.68–1.34) |
| Lower respiratory tract infections | 1.44 (0.96–2.15) | 1.52 (0.98–2.34) | 1.41 (0.95–2.11) |
| Hay fever/Allergic rhinitis | 0.79 (0.48–1.30) | 0.89 (0.52–1.52) | 1.16 (0.67–2.00) |
| Cough, shortness of breath/dyspnea, wheezing | 1.36 (0.85–2.17) | 1.62 (1.08–2.41) | 1.68 (1.07–2.65) |
| Lung cancer | 1.30 (0.91–1.88) | 1.22 (0.84–1.76) | 1.24 (0.82–1.88) |
| Upper respiratory tract infections | 1.02 (0.77–1.36) | 1.05 (0.74–1.47) | 0.89 (0.63–1.26) |
| Influenza | 1.01 (0.31–3.28) | 0.69 (0.18–2.58) | 1.28 (0.69–2.38) |
| Chronic enteritis/Ulcerative colitis | 0.88 (0.52–1.49) | 0.90 (0.51–1.61) | 0.98 (0.57–1.68) |
| Vertigo/Dizziness | 1.31 (0.85–2.00) | 1.16 (0.65–2.04) | 1.35 (0.84–2.16) |
| Eczema | 1.05 (0.62–1.78) | 1.04 (0.63–1.71) | 1.11 (0.65–1.87) |
| Gastroenteritis | 0.90 (0.51–1.57) | 0.94 (0.53–1.66) | 0.80 (0.42–1.53) |
| Coronary heart disease | 1.08 (0.83–1.41) | 1.03 (0.79–1.33) | 1.09 (0.87–1.37) |
| Vertiginous syndrome | 1.59 (1.03–2.45) | 1.88 (1.14–3.10) | 1.44 (0.88–2.36) |
| Depression | 1.53 (1.10–2.12) | 1.48 (1.07–2.05) | 1.36 (0.95–1.94) |
| Hypertension | 1.09 (0.82–1.43) | 1.10 (0.83–1.44) | 1.06 (0.80–1.40) |
| Broad-spectrum antibiotics ÷ | 1.15 (0.93–1.42) | 1.05 (0.80–1.37) | 1.14 (0.86–1.50) |
| All anti-infectives L | 1.03 (0.86–1.23) | 0.95 (0.78–1.16) | 1.02 (0.75–1.38) |
| 2014 | 2015 | 2016 | |
|---|---|---|---|
| Pneumonia | 1.24 (0.67–2.26) | 1.20 (0.58–2.47) | 1.20 (0.58–2.44) |
| Lower respiratory tract infections | 1.12 (0.64–1.94) | 1.21 (0.61–2.38) | 1.18 (0.60–2.32) |
| Hay fever/Allergic rhinitis | 1.12 (0.55–2.31) | 1.15 (0.58–2.26) | 1.47 (0.65–3.30) |
| Cough, shortness of breath/dyspnea, wheezing | 1.27 (0.69–2.34) | 1.58 (0.97–2.55) | 1.96 (1.14–3.38) |
| Lung cancer | 1.49 (0.54–4.10) | 1.36 (0.51–3.66) | 1.75 (0.67–4.57) |
| Upper respiratory tract infections | 1.10 (0.68–1.78) | 1.02 (0.61–1.72) | 0.63 (0.37–1.07) |
| Influenza | 1.60 (0.28–8.99) | 0.49 (0.10–2.96) | 1.65 (0.48–5.64) |
| Chronic enteritis/Ulcerative colitis | 0.48 (0.17–1.37) | 0.60 (0.21–1.73) | 0.61 (0.22–1.70) |
| Vertigo/Dizziness | 1.07 (0.50–2.29) | 0.96 (0.50–1.85) | 1.57 (0.81–3.04) |
| Eczema | 1.27 (0.67–2.41) | 1.15 (0.65–2.03) | 1.14 (0.65–2.00) |
| Gastroenteritis | 0.72 (0.26–1.96) | 0.93 (0.36–2.42) | 0.85 (0.27–2.67) |
| Coronary heart disease | 0.85 (0.52–1.39) | 0.82 (0.54–1.25) | 0.82 (0.55–1.23) |
| Vertiginous syndrome | 1.40 (0.65–3.04) | 1.61 (0.71–3.66) | 1.01 (0.45–2.25) |
| Depression | 1.32 (0.76–2.31) | 1.13 (0.70–1.83) | 1.45 (0.86–2.44) |
| Hypertension | 1.09 (0.73–1.62) | 1.04 (0.71–1.53) | 1.04 (0.75–1.43) |
| 2014 | 2015 | 2016 | |
|---|---|---|---|
| Pneumonia | 1.37 (0.90–2.08) | 1.56 (1.02–2.38) | 1.54 (1.02–2.32) |
| Lower respiratory tract infections | 1.27 (0.89–1.82) | 1.54 (1.03–2.29) | 1.51 (1.30–2.21) |
| Hay fever/Allergic rhinitis | 0.83 (0.55–1.25) | 0.86 (0.58–1.29) | 1.01 (0.68–1.50) |
| Cough, shortness of breath/dyspnea, wheezing | 1.28 (0.82–1.98) | 1.48 (1.01–2.17) | 1.61 (1.06–2.44) |
| Lung cancer | 1.29 (0.90–1.85) | 1.17 (0.83–1.66) | 1.24 (0.84–1.83) |
| Upper respiratory tract infections | 0.96 (0.75–1.22) | 0.96 (0.74–1.25) | 0.86 (0.62–1.19) |
| Influenza | 0.87 (0.34–2.28) | 0.78 (0.26–2.34) | 1.43 (0.87–2.34) |
| Chronic enteritis/Ulcerative colitis | 1.02 (0.70–1.49) | 0.98 (0.67–1.45) | 1.01 (0.70–1.48) |
| Vertigo/Dizziness | 1.39 (0.95–2.04) | 1.21 (0.76–1.91) | 1.45 (0.97–2.18) |
| Eczema | 1.12 (0.72–1.76) | 1.13 (0.72–1.77) | 1.18 (0.75–1.87) |
| Gastroenteritis | 0.88 (0.58–1.32) | 0.97 (0.62–1.53) | 1.01 (0.66–1.56) |
| Coronary heart disease | 1.08 (0.84–1.41) | 1.03 (0.80–1.35) | 1.08 (0.85–1.36) |
| Vertiginous syndrome | 1.39 (1.00–1.93) | 1.67 (1.14–2.44) | 1.32 (0.89–1.95) |
| Depression | 1.37 (0.98–1.92) | 1.46 (1.06–2.02) | 1.33 (1.00–1.76) ‡ |
| Hypertension | 1.08 (0.86–1.37) | 1.10 (0.87–1.39) | 1.08 (0.84–1.38) |
| Broad-spectrum antibiotics ÷ | 1.05 (0.85–1.30) | 0.97 (0.76–1.24) | 1.02 (0.78–1.33) |
| All anti-infectives L | 1.00 (0.83–1.20) | 0.94 (0.78–1.14) | 0.98 (0.75–1.28) |
References
- Brunekreef, B.; Harrison, R.M.; Kunzli, N.; Querol, X.; Sutton, M.A.; Heederik, D.J. Reducing the health effect of particles from agriculture. Lancet Respir. Med. 2015, 3, 831–832. [Google Scholar] [CrossRef]
- Bauer, S.E.; Tsigaridis, K.; Miller, R. Significant atmospheric aerosol pollution caused by world food cultivation. Geophys. Res. Lett. 2016, 43, 5394–5400. [Google Scholar] [CrossRef]
- Vieno, M.; Heal, M.R.; Twigg, M.M.; MacKenzie, I.A.; Braban, C.F.; Lingard, J.J.N. The UK particulate matter air pollution episode of March–April 2014: More than Saharan dust. Environ. Res. Lett. 2016, 11, 044004. [Google Scholar] [CrossRef]
- Smit, L.A.; Heederik, D. Impacts of intensive livestock production on human health in densely populated regions. GeoHealth 2017, 1, 272–277. [Google Scholar] [CrossRef]
- Dungan, R. Board-invited review: Fate and transport of bioaerosols associated with livestock operations and manures. J. Anim. Sci. 2010, 88, 3693–3706. [Google Scholar] [CrossRef] [PubMed]
- Klous, G.; Huss, A.; Heederik, D.J.; Coutinho, R.A. Human-livestock contacts and their relationship to transmission of zoonotic pathogens, a systematic review of literature. One Health 2016, 2, 65–76. [Google Scholar] [CrossRef] [PubMed]
- Radon, K.; Schulze, A.; Ehrenstein, V.; van Strien, R.T.; Praml, G.; Nowak, D. Environmental exposure to confined animal feeding operations and respiratory health of neighboring residents. Epidemiology 2007, 18, 300–308. [Google Scholar] [CrossRef] [PubMed]
- Schulze, A.; Römmelt, H.; Ehrenstein, V.; van Strien, R.; Praml, G.; Küchenhoff, H. Effects on pulmonary health of neighboring residents of concentrated animal feeding operations: Exposure assessed using optimized estimation technique. Arch. Environ. Occup. Health 2011, 66, 146–154. [Google Scholar] [CrossRef] [PubMed]
- Smit, L.A.; van der Sman-de Beer, F.; Opstal-van Winden, A.W.; Hooiveld, M.; Beekhuizen, J.; Wouters, I.M. fever and pneumonia in an area with a high livestock density: A large population-based study. PLoS ONE 2012, 7, e38843. [Google Scholar] [CrossRef]
- Pavilonis, B.T.; Sanderson, T.; Merchant, J.A. Relative exposure to swine animal feeding operations and childhood asthma prevalence in an agricultural cohort. Environ. Res. 2013, 122, 74–80. [Google Scholar] [CrossRef]
- Borlée, F.; Yzermans, C.J.; Aalders, B.; Rooijackers, J.; Krop, E.; Maassen, C.B. Air pollution from livestock farms is associated with airway obstruction in neighboring residents. Am. J. Respir. Crit. Care Med. 2017, 196, 1152–1161. [Google Scholar] [CrossRef]
- Douglas, P.; Robertson, S.; Gay, R.; Hansell, A.L.; Gant, T.W. A systematic review of the public health risks of bioaerosols from intensive farming. Int. J. Hyg. Environ. Health 2017, 221, 134–173. [Google Scholar] [CrossRef] [PubMed]
- Dijkstra, F.; van der Hoek, W.; Wijers, N.; Schimmer, B.; Rietveld, A.; Wijkmans, C.J. The 2007–2010 Q fever epidemic in the Netherlands: Characteristics of notified acute Q fever patients and the association with dairy goat farming. FEMS Immunol. Med. Microbiol. 2012, 64, 3–12. [Google Scholar] [CrossRef] [PubMed]
- Hooiveld, M.; Smit, L.A.; van der Sman-de Beer, F.; Wouters, I.M.; van Dijk, C.E.; Spreeuwenberg, P. Doctor-diagnosed health problems in a region with a high density of concentrated animal feeding operations: A cross-sectional study. Environ. Health 2016, 15, 24. [Google Scholar] [CrossRef]
- van Dijk, C.E.; Zock, J.-P.; Baliatsas, C.; Smit, L.A.; Borlée, F.; Spreeuwenberg, P. Health conditions in rural areas with high livestock density: Analysis of seven consecutive years. Environ. Pollut. 2017, 222, 374–382. [Google Scholar] [CrossRef] [PubMed]
- Kalkowska, D.A.; Boender, G.J.; Smit, L.A.; Baliatsas, C.; Yzermans, C.J.; Heederik, D.J. Associations between pneumonia and residential distance to livestock farms over a five-year period in a large population-based study. PLoS ONE 2018, 13, e0200813. [Google Scholar] [CrossRef]
- Borlée, F.; Yzermans, C.J.; van Dijk, C.E.; Heederik, D.; Smit, L.A. Increased respiratory symptoms in COPD patients living in the vicinity of livestock farms. Eur. Respir. J. 2015, 46, 1605–1614. [Google Scholar] [CrossRef]
- van Dijk, C.E.; Garcia-Aymerich, J.; Carsin, A.E.; Smit, L.A.; Borlée, F.; Heederik, D.J. Risk of exacerbations in COPD and asthma patients living in the neighbourhood of livestock farms: Observational study using longitudinal data. Int. J. Hyg. Environ. Health 2016, 219, 278–287. [Google Scholar] [CrossRef]
- Baliatsas, C.; Smit, L.A.; Dückers, M.L.; van Dijk, C.E.; Heederik, D.; Yzermans, C.J. Patients with overlapping diagnoses of asthma and COPD: Is livestock exposure a risk factor for comorbidity and coexisting symptoms and infections? BMC Pulm. Med. 2019, 19, 105. [Google Scholar] [CrossRef]
- Verheij, R.A. NIVEL Zorgregistraties Eerste Lijn: Huisarts. [Netherlands Primary Care Database: General Practitioners]. Utrecht: NIVEL. Available online: https://www.nivel.nl/en/nivel-primary-care-database (accessed on 13 February 2019).
- Maassen, K.; Heederik, D.; Yzermans, C.J.; Hagenaars, T.; van der Hoek, W. Veehouderij en Gezondheid Omwonenden; RIVM Report 2016-0058; RIVM: Bilthoven, The Netherlands, 2016; pp. 41–47. (In Dutch) [Google Scholar]
- De Rooij, M.M.; Heederik, D.J.; Borlée, F.; Hoek, G.; Wouters, I.M. Spatial and temporal variation in endotoxin and PM10 concentrations in ambient air in a livestock dense area. Environ. Res. 2017, 153, 161–170. [Google Scholar] [CrossRef] [PubMed]
- De Rooij, M.M.; Heederik, D.J.; van Nunen, E.J.; van Schothorst, I.J.; Maassen, C.B.; Hoek, G.; Wouters, I.M. Spatial Variation of Endotoxin Concentrations Measured in Ambient in a Livestock-Dense Area:Implementation of a Land-Use Regression Approach. Environ. Health Perspect. 2018, 126, 017003. [Google Scholar] [CrossRef]
- Lamberts, H.; Wood, M. ICPC, International Classification of Primary Care; Oxford University Press: New York, NY, USA, 1987. [Google Scholar]
- Nielen, M.M.; Spronk, I.; Davids, R.; Korevaar, J.C.; Poos, R.; Hoeymans, N. Estimating morbidity rates based on routine electronic health records in primary care: Observational study. JMIR Med. Inform. 2019, 7, e11929. [Google Scholar] [CrossRef]
- WHO. Guidelines for ATC Classification and DDD Assignment WHO Collaborating Centre for Drug Statistics Methodology; Nordic Council on Medicines: Oslo, Norway, 2003. [Google Scholar]
- Knol, F.; Veldheer, V. Neighbourhood Status Development in the Netherlands 1998–2010. 2012. The Netherlands Institute for Social Research. Available online: https://www.scp.nl/english/Publications/Summaries_by_year/Summaries_2012/Neighbourhood_status_development_in_the_Netherlands_1998_2010 (accessed on 4 March 2019).
- Galobardes, B.; Shaw, M.; Lawlor, D.; Lynch, J.W.; Davey Smith, G. Indicators of socioeconomic position: Methods in social epidemiology. J. Epidemiol. Community Health 2006, 60, 47–85. [Google Scholar]
- Freidl, G.S.; Spruijt, I.T.; Borlée, F.; Smit, L.A.; van Gageldonk-Lafeber, A.B.; Heederik, D.J. Livestock associated risk factors for pneumonia in an area of intensive animal farming in the Netherlands. PLoS ONE 2017, 12, e0174796. [Google Scholar] [CrossRef]
- Klous, G.; Smit, L.A.; Freidl, G.S.; Borlée, F.; van der Hoek, W.; IJzermans, C.J. Pneumonia risk of people living close to goat and poultry farms–Taking GPS derived mobility patterns into account. Environ. Int. 2018, 115, 150–160. [Google Scholar] [CrossRef]
- Mohangoo, A.D.; Van Der Linden, M.W.; Schellevis, F.G.; Raat, H. Prevalence estimates of asthma or COPD from a health interview survey and from general practitioner registration: what’s the difference? Eur. J. Public Health 2005, 16, 101–105. [Google Scholar] [CrossRef]
- Borlée, F.; Yzermans, C.J.; Krop, E.; Aalders, B.; Rooijackers, J.; Zock, J.P. Spirometry, questionnaire and electronic medical record-based COPD in a population survey: Comparing prevalence, level of agreement and associations with potential risk factors. PLoS ONE 2017, 12, e0171494. [Google Scholar] [CrossRef]
- Villeneuve, P.J.; Ali, A.; Challacombe, L.; Hebert, S. Intensive hog farming operations and self-reported health among nearby rural residents in Ottawa, Canada. BMC Public Health. 2009, 9, 330. [Google Scholar] [CrossRef]
- Hooiveld, M.; van Dijk, C.E.; van der Sman-de Beer, F.; Smit, L.A.; Vogelaar, M.; Wouters, I.M. Odour annoyance in the neighbourhood of livestock farming–perceived health and health care seeking behaviour. Ann. Agric. Environ. Med. 2015, 22, 55–61. [Google Scholar] [CrossRef][Green Version]
- Potter, R.C.; Kaneene, J.B.; Gardiner, J. A comparison of Campylobacter jejuni enteritis incidence rates in high- and low-poultry-density counties: Michigan 1992–1999. Vector Borne Zoonotic Dis. 2002, 2, 137–143. [Google Scholar] [CrossRef]
- Febriani, Y.; Levallois, P.; Lebel, G.; Gingras, S. Association between indicators of livestock farming intensity and hospitalization rate for acute gastroenteritis. Epidemiol. Infect. 2009, 137, 1073–1085. [Google Scholar] [CrossRef] [PubMed]
- Cheng, M.F.; Ho, S.C.; Chiu, H.F.; Wu, T.N.; Chen, P.S.; Yang, C.Y. Consequences of exposure to Asian dust storm events on daily pneumonia hospital admissions in Taipei, Taiwan. J. Toxicol. Environ. Health Part A 2008, 71, 1295–1299. [Google Scholar] [CrossRef] [PubMed]
- Rivas-Santiago, C.E.; Sarkar, S.; Cantarella, P.; Osornio-Vargas, Á.; Quintana-Belmare, R.; Meng, Q. Air pollution particulate matter alters antimycobacterial respiratory epithelium innate immunity. Infect. Immun. 2015, 83, 2507–2517. [Google Scholar] [CrossRef] [PubMed]
- Smit, L.A.; Boender, G.J.; de Steenhuijsen Piters, W.A.; Hagenaars, T.J.; Huijskens, E.G.; Rossen, J.W. Increased risk of pneumonia in residents living near poultry farms: Does the upper respiratory tract microbiota play a role? Pneumonia 2017, 9, 3. [Google Scholar] [CrossRef]
- Morroy, G.; Peters, J.B.; van Nieuwenhof, M.; Bor, H.H.; Hautvast, J.L.; van der Hoek, W. The health status of Q-fever patients after long-term follow-up. BMC Infect. Dis. 2011, 11, 97. [Google Scholar] [CrossRef]
- Hussain-Yusuf, H.; Islam, A.; Healy, B.; Lockhart, M.; Nguyen, C.; Sukocheva, O. An analysis of Q fever patients 6 years after an outbreak in Newport, Wales, UK. QJM Int. J. Med. 2012, 105, 1067–1073. [Google Scholar] [CrossRef]
- Keijmel, S.P.; Raijmakers, R.P.; Bleeker-Rovers, C.P.; van der Meer, J.W.; Netea, M.G.; Schoffelen, T. Altered interferon-γ response in patients with Q-fever fatigue syndrome. J. Infect. 2016, 72, 478–485. [Google Scholar] [CrossRef]
- Borlée, F.; Yzermans, C.J.; Oostwegel, F.S.; Schellevis, F.; Heederik, D.; Smit, L.A. Attitude toward livestock farming does not influence the earlier observed association between proximity to goat farms and self-reported pneumonia. Environ. Epidemiol. 2019, 3, e041. [Google Scholar] [CrossRef]
- Smit, L.A.; Hooiveld, M.; van der Sman-de Beer, F.; Opstal-van Winden, A.W.; Beekhuizen, J.; Wouters, I.M. Air pollution from livestock farms, and asthma, allergic rhinitis and COPD among neighbouring residents. Occup. Environ. Med. 2014, 71, 134–140. [Google Scholar] [CrossRef]
| 2014 | 2015 | 2016 | |
|---|---|---|---|
| Pneumonia | 1.45 (1.00–2.10) | 1.58 (1.09–2.30) | 1.60 (1.13–2.28) |
| Lower respiratory tract infections | 1.31 (0.94–1.83) | 1.44 (1.01–2.05) | 1.46 (1.03–2.05) |
| Hay fever/Allergic rhinitis | 0.95 (0.75–1.21) | 1.00 (0.80–1.25) | 1.01 (0.78–1.30) |
| Asthma b | 0.87 (0.68–1.12) | 0.84 (0.66–1.06) | 0.85 (0.68–1.07) |
| Cough, shortness of breath/dyspnea, wheezing | 1.14 (0.90–1.45) | 1.27 (1.03–1.57) | 1.27 (0.98–1.66) |
| Chronic bronchitis/bronchiectasis c | 1.38 (0.83–2.29) | 1.42 (0.87–2.33) | 1.45 (0.93–2.27) |
| COPD c | 0.97 (0.77–1.22) | 0.98 (0.78–1.24) | 1.01 (0.81–1.25) |
| Lung cancer c | 1.09 (0.89–1.33) | 1.09 (0.89–1.35) | 1.28 (0.92–1.78) |
| Upper respiratory tract infections | 0.93 (0.76–1.14) | 0.95 (0.77–1.16) | 0.98 (0.76–1.25) |
| Influenza | 1.19 (0.59–2.38) | 1.03 (0.50–2.15) | 1.15 (0.76–1.74) |
| Chronic enteritis/Ulcerative colitis | 1.13 (0.92–1.40) | 1.13 (0.90–1.42) | 1.15 (0.91–1.44) |
| Vertigo/Dizziness | 1.18 (0.86–1.63) | 1.12 (0.84–1.50) | 1.16 (0.83–1.62) |
| Eczema | 1.11 (0.72–1.70) | 1.12 (0.75–1.67) | 1.07 (0.72–1.59) |
| Gastroenteritis | 1.08 (0.80–1.46) | 1.14 (0.84–1.54) | 1.42 (1.02–1.98) |
| Coronary heart disease c | 1.12 (0.91–1.37) | 1.07 (0.88–1.31) | 1.08 (0.90–1.29) |
| Vertiginous syndrome | 1.44 (1.12–1.85) | 1.45 (1.10–1.92) | 1.40 (1.06–1.84) |
| Depression | 1.25 (0.97–1.60) | 1.26 (1.01–1.58) | 1.23 (0.98–1.55) |
| Hypertension c | 0.99 (0.82–1.20) | 0.98 (0.82–1.19) | 0.98 (0.81–1.18) |
| 2014 | 2015 | 2016 | |
|---|---|---|---|
| Hay fever/Allergic rhinitis | 0.95 (0.54–1.66) | 0.89 (0.54–1.49) | 0.83 (0.47–1.47) |
| Asthma b | 0.65 (0.46–0.93) | 0.68 (0.46–1.01) | 0.80 (0.55–1.17) |
| Cough, shortness of breath/dyspnea, wheezing | 1.35 (0.82–2.23) | 1.26 (0.80–2.01) | 1.45 (0.81–2.60) |
| Chronic bronchitis/bronchiectasis c | 1.44 (0.74–2.81) | 1.64 (0.75–3.57) | 1.07 (0.57–2.02) |
| COPD c | 0.95 (0.63–1.43) | 0.94 (0.64–1.38) | 0.83 (0.62–1.13) |
| Lung cancer c | 1.19 (0.62–2.28) | 0.84 (0.46–1.55) | 1.25 (0.62–2.50) |
| Upper respiratory tract infections | 0.90 (0.65–1.25) | 0.77 (0.61–0.99) | 0.85 (0.64–1.13) |
| Influenza | 2.74 (0.75–10.0) | 0.84 (0.26–2.78) | 1.06 (0.57–1.96) |
| Chronic enteritis/Ulcerative colitis | 1.08 (0.38–3.04) | 1.10 (0.41–2.97) | 1.35 (0.55–3.34) |
| Vertigo/Dizziness | 1.44 (0.78–2.68) | 1.27 (0.65–2.45) | 1.19 (0.64–2.21) |
| Eczema | 1.22 (0.70–2.12) | 0.87 (0.53–1.43) | 0.96 (0.57–1.61) |
| Gastroenteritis | 1.44 (0.73–2.86) | 0.83 (0.43–1.59) | 1.66 (0.82–3.35) |
| Coronary heart disease c | 1.33 (0.96–1.85) | 0.98 (0.74–1.29) | 0.96 (0.65–1.40) |
| Vertiginous syndrome | 1.91 (0.84–4.32) | 1.93 (0.84–4.43) | 1.15 (0.52–2.52) |
| Depression | 1.24 (0.71–2.16) | 1.18 (0.71–1.97) | 1.30 (0.81–2.07) |
| Hypertension c | 0.93 (0.67–1.29) | 1.00 (0.74–1.34) | 1.08 (0.78–1.50) |
| 2014 | 2015 | 2016 | |
|---|---|---|---|
| Pneumonia | 1.00 (0.65–1.55) | 1.21 (0.72–2.04) | 1.42 (0.88–2.27) |
| Lower respiratory tract infections | 1.00 (0.70–1.44) | 1.19 (0.73–1.93) | 1.39 (0.88–2.19) |
| Hay fever/Allergic rhinitis | 0.96 (0.68–1.34) | 1.01 (0.73–1.40) | 1.04 (0.75–1.44) |
| Cough, shortness of breath/dyspnea, wheezing | 1.27 (0.86–1.88) | 1.33 (0.92–1.91) | 1.45 (1.00–2.10) ‡ |
| Lung cancer c | 1.03 (0.37–2.86) | 0.60 (0.20–1.81) | 0.86 (0.30–2.45) |
| Upper respiratory tract infections | 0.93 (0.74–1.17) | 0.92 (0.74–1.14) | 0.88 (0.64–1.19) |
| Influenza | 0.86 (0.27–2.74) | 0.95 (0.25–3.55) | 1.01 (0.56–1.82) |
| Chronic enteritis/Ulcerative colitis | 1.09 (0.69–1.72) | 1.00 (0.63–1.58) | 0.99 (0.63–1.56) |
| Vertigo/Dizziness | 1.28 (0.82–1.98) | 1.17 (0.78–1.75) | 1.42 (0.91–2.20) |
| Eczema | 1.04 (0.71–1.50) | 1.07 (0.73–1.56) | 1.11 (0.78–1.60) |
| Gastroenteritis | 0.89 (0.53–1.50) | 1.18 (0.73–1.91) | 1.54 (0.93–2.55) |
| Coronary heart disease c | 1.01 (0.72–1.40) | 0.97 (0.69–1.37) | 0.98 (0.71–1.36) |
| Vertiginous syndrome | 1.20 (0.79–1.82) | 1.40 (0.89–2.20) | 1.16 (0.84–1.59) |
| Depression | 1.23 (0.80–1.87) | 1.35 (0.95–1.92) | 1.16 (0.73–1.85) |
| Hypertension c | 1.04 (0.81–1.34) | 1.08 (0.83–1.39) | 1.08 (0.83–1.41) |
| 2014 | 2015 | 2016 | |
|---|---|---|---|
| Pneumonia | 1.70 (1.03–2.79) | 1.70 (1.07–2.71) | 1.51 (0.99–2.28) |
| Lower respiratory tract infections | 1.58 (1.01–2.47) | 1.61 (1.04–2.49) | 1.46 (0.99–2.16) |
| Hay fever/Allergic rhinitis | 0.63 (0.39–1.01) | 0.75 (0.44–1.26) | 0.93 (0.52–1.65) |
| Cough, shortness of breath/dyspnea, wheezing | 1.36 (0.84–2.19) | 1.60 (1.06–2.42) | 1.55 (0.97–2.49) |
| Lung cancer c | 1.27 (0.85–1.91) | 1.18 (0.78–1.78) | 1.17 (0.76–1.82) |
| Upper respiratory tract infections | 0.97 (0.74–1.28) | 1.03 (0.72–1.46) | 0.99 (0.69–1.41) |
| Influenza | 0.62 (0.15–2.50) | 0.63 (0.13–3.09) | 1.17 (0.56–2.45) |
| Chronic enteritis/Ulcerative colitis | 1.09 (0.55–2.17) | 1.03 (0.49–2.20) | 1.11 (0.56–2.20) |
| Vertigo/Dizziness | 1.39 (0.85–2.24) | 1.23 (0.64–2.37) | 1.32 (0.77–2.26) |
| Eczema | 0.95 (0.53–1.70) | 1.00 (0.55–1.81) | 1.07 (0.58–2.00) |
| Gastroenteritis | 0.98 (0.53–1.81) | 0.98 (0.53–1.81) | 0.78 (0.39–1.55) |
| Coronary heart disease c | 1.15 (0.91–1.46) | 1.10 (0.88–1.37) | 1.19 (0.95–1.48) |
| Vertiginous syndrome | 1.63 (1.03–2.6) | 1.94 (1.07–3.52) | 1.69 (0.91–3.15) |
| Depression | 1.62 (1.11–2.35) | 1.65 (1.14–2.39) | 1.37 (0.89–2.11) |
| Hypertension c | 1.09 (0.82–1.46) | 1.13 (0.85–1.50) | 1.08 (0.80–1.46) |
| 2014 | 2015 | 2016 | |
|---|---|---|---|
| Broad-spectrum antibiotics ÷ | |||
| Total sample | 0.92 (0.75–1.13) | 0.86 (0.68–1.08) | 0.96 (0.75–1.24) |
| Children b | 1.03 (0.77–1.37) | 0.93 (0.69–1.25) | 0.97 (0.71–1.34) |
| Elderly c | 0.98 (0.80–1.20) | 0.95 (0.77–1.17) | 1.02 (0.81–1.29) |
| Patients with pneumonia (total) | 1.23 (0.87–1.74) | 1.49 (1.10–2.03) | 1.27 (0.82–1.96) |
| Children with pneumonia b | 1.42 (0.74–2.71) | 2.10 (0.85–5.20) | 1.37 (0.51–3.68) |
| Elderly with pneumonia c | 1.43 (0.93–2.19) | 1.53 (1.10–2.14) | 1.41 (0.89–2.23) |
| All asthma patients (without comorbid COPD) d | 0.88 (0.67–1.14) | 0.84 (0.62–1.12) | 0.82 (0.60–1.13) |
| Children with asthma e | 1.26 (0.72–2.21) | 1.24 (0.65–2.37) | 0.67 (0.38–1.18) |
| Elderly with asthma c | 0.90 (0.55–1.46) | 0.88 (0.61–1.26) | 0.83 (0.54–1.25) |
| COPD patients (without comorbid asthma) f | 1.14 (0.91–1.42) | 1.08 (0.83–1.41) | 1.22 (0.92–1.60) |
| ACOS patients f | 1.23 (0.85–1.78) | 0.93 (0.62–1.38) | 0.94 (0.59–1.50) |
| All anti-infectives L | |||
| Total sample | 0.94 (0.82–1.08) | 0.89 (0.77–1.03) | 0.98 (0.79–1.21) |
| Children b | 0.99 (0.78–1.27) | 0.90 (0.69–1.18) | 1.06 (0.81–1.37) |
| Elderly c | 0.94 (0.81–1.09) | 0.88 (0.77–1.02) | 0.99 (0.79–1.23) |
| Patients with pneumonia (total) | 0.92 (0.61–1.39) | 0.98 (0.72–1.34) | 0.92 (0.60–1.41) |
| Children with pneumonia b | 0.92 (0.43–1.99) | 0.99 (0.43–2.25) | 1.39 (0.50–3.90) |
| Elderly with pneumonia c | 1.03 (0.63–1.67) | 1.03 (0.71–1.50) | 0.91 (0.55–1.49) |
| All asthma patients (without comorbid COPD) d | 0.91 (0.74–1.12) | 0.88 (0.70–1.11) | 0.88 (0.70–1.10) |
| Children with asthma e | 0.97 (0.65–1.45) | 0.92 (0.54–1.54) | 0.88 (0.54–1.43) |
| Elderly with asthma c | 0.93 (0.65–1.32) | 0.83 (0.59–1.18) | 0.81 (0.61–1.07) |
| All COPD patients (without comorbid asthma) f | 1.00 (0.83–1.21) | 0.94 (0.76–1.16) | 1.01 (0.76–1.36) |
| ACOS patients f | 1.12 (0.78–1.62) | 0.95 (0.64–1.40) | 0.96 (0.57–1.63) |
© 2020 by the authors. Licensee MDPI, Basel, Switzerland. This article is an open access article distributed under the terms and conditions of the Creative Commons Attribution (CC BY) license (http://creativecommons.org/licenses/by/4.0/).
Share and Cite
Baliatsas, C.; Dückers, M.; Smit, L.A.M.; Heederik, D.; Yzermans, J. Morbidity Rates in an Area with High Livestock Density: A Registry-Based Study Including Different Groups of Patients with Respiratory Health Problems. Int. J. Environ. Res. Public Health 2020, 17, 1591. https://doi.org/10.3390/ijerph17051591
Baliatsas C, Dückers M, Smit LAM, Heederik D, Yzermans J. Morbidity Rates in an Area with High Livestock Density: A Registry-Based Study Including Different Groups of Patients with Respiratory Health Problems. International Journal of Environmental Research and Public Health. 2020; 17(5):1591. https://doi.org/10.3390/ijerph17051591
Chicago/Turabian StyleBaliatsas, Christos, Michel Dückers, Lidwien A.M. Smit, Dick Heederik, and Joris Yzermans. 2020. "Morbidity Rates in an Area with High Livestock Density: A Registry-Based Study Including Different Groups of Patients with Respiratory Health Problems" International Journal of Environmental Research and Public Health 17, no. 5: 1591. https://doi.org/10.3390/ijerph17051591
APA StyleBaliatsas, C., Dückers, M., Smit, L. A. M., Heederik, D., & Yzermans, J. (2020). Morbidity Rates in an Area with High Livestock Density: A Registry-Based Study Including Different Groups of Patients with Respiratory Health Problems. International Journal of Environmental Research and Public Health, 17(5), 1591. https://doi.org/10.3390/ijerph17051591