Understanding the Sociocognitive Process of Construction Workers’ Unsafe Behaviors: An Agent-Based Modeling Approach


 and
and
Abstract
1. Introduction
2. Literature Review
2.1. Sociocognitive Process of Construction Workers
2.1.1. Individual Cognitive Process of Construction Workers
2.1.2. Social Group and Social Organizational Factors
2.2. Agent-Based Modeling
3. Methodology
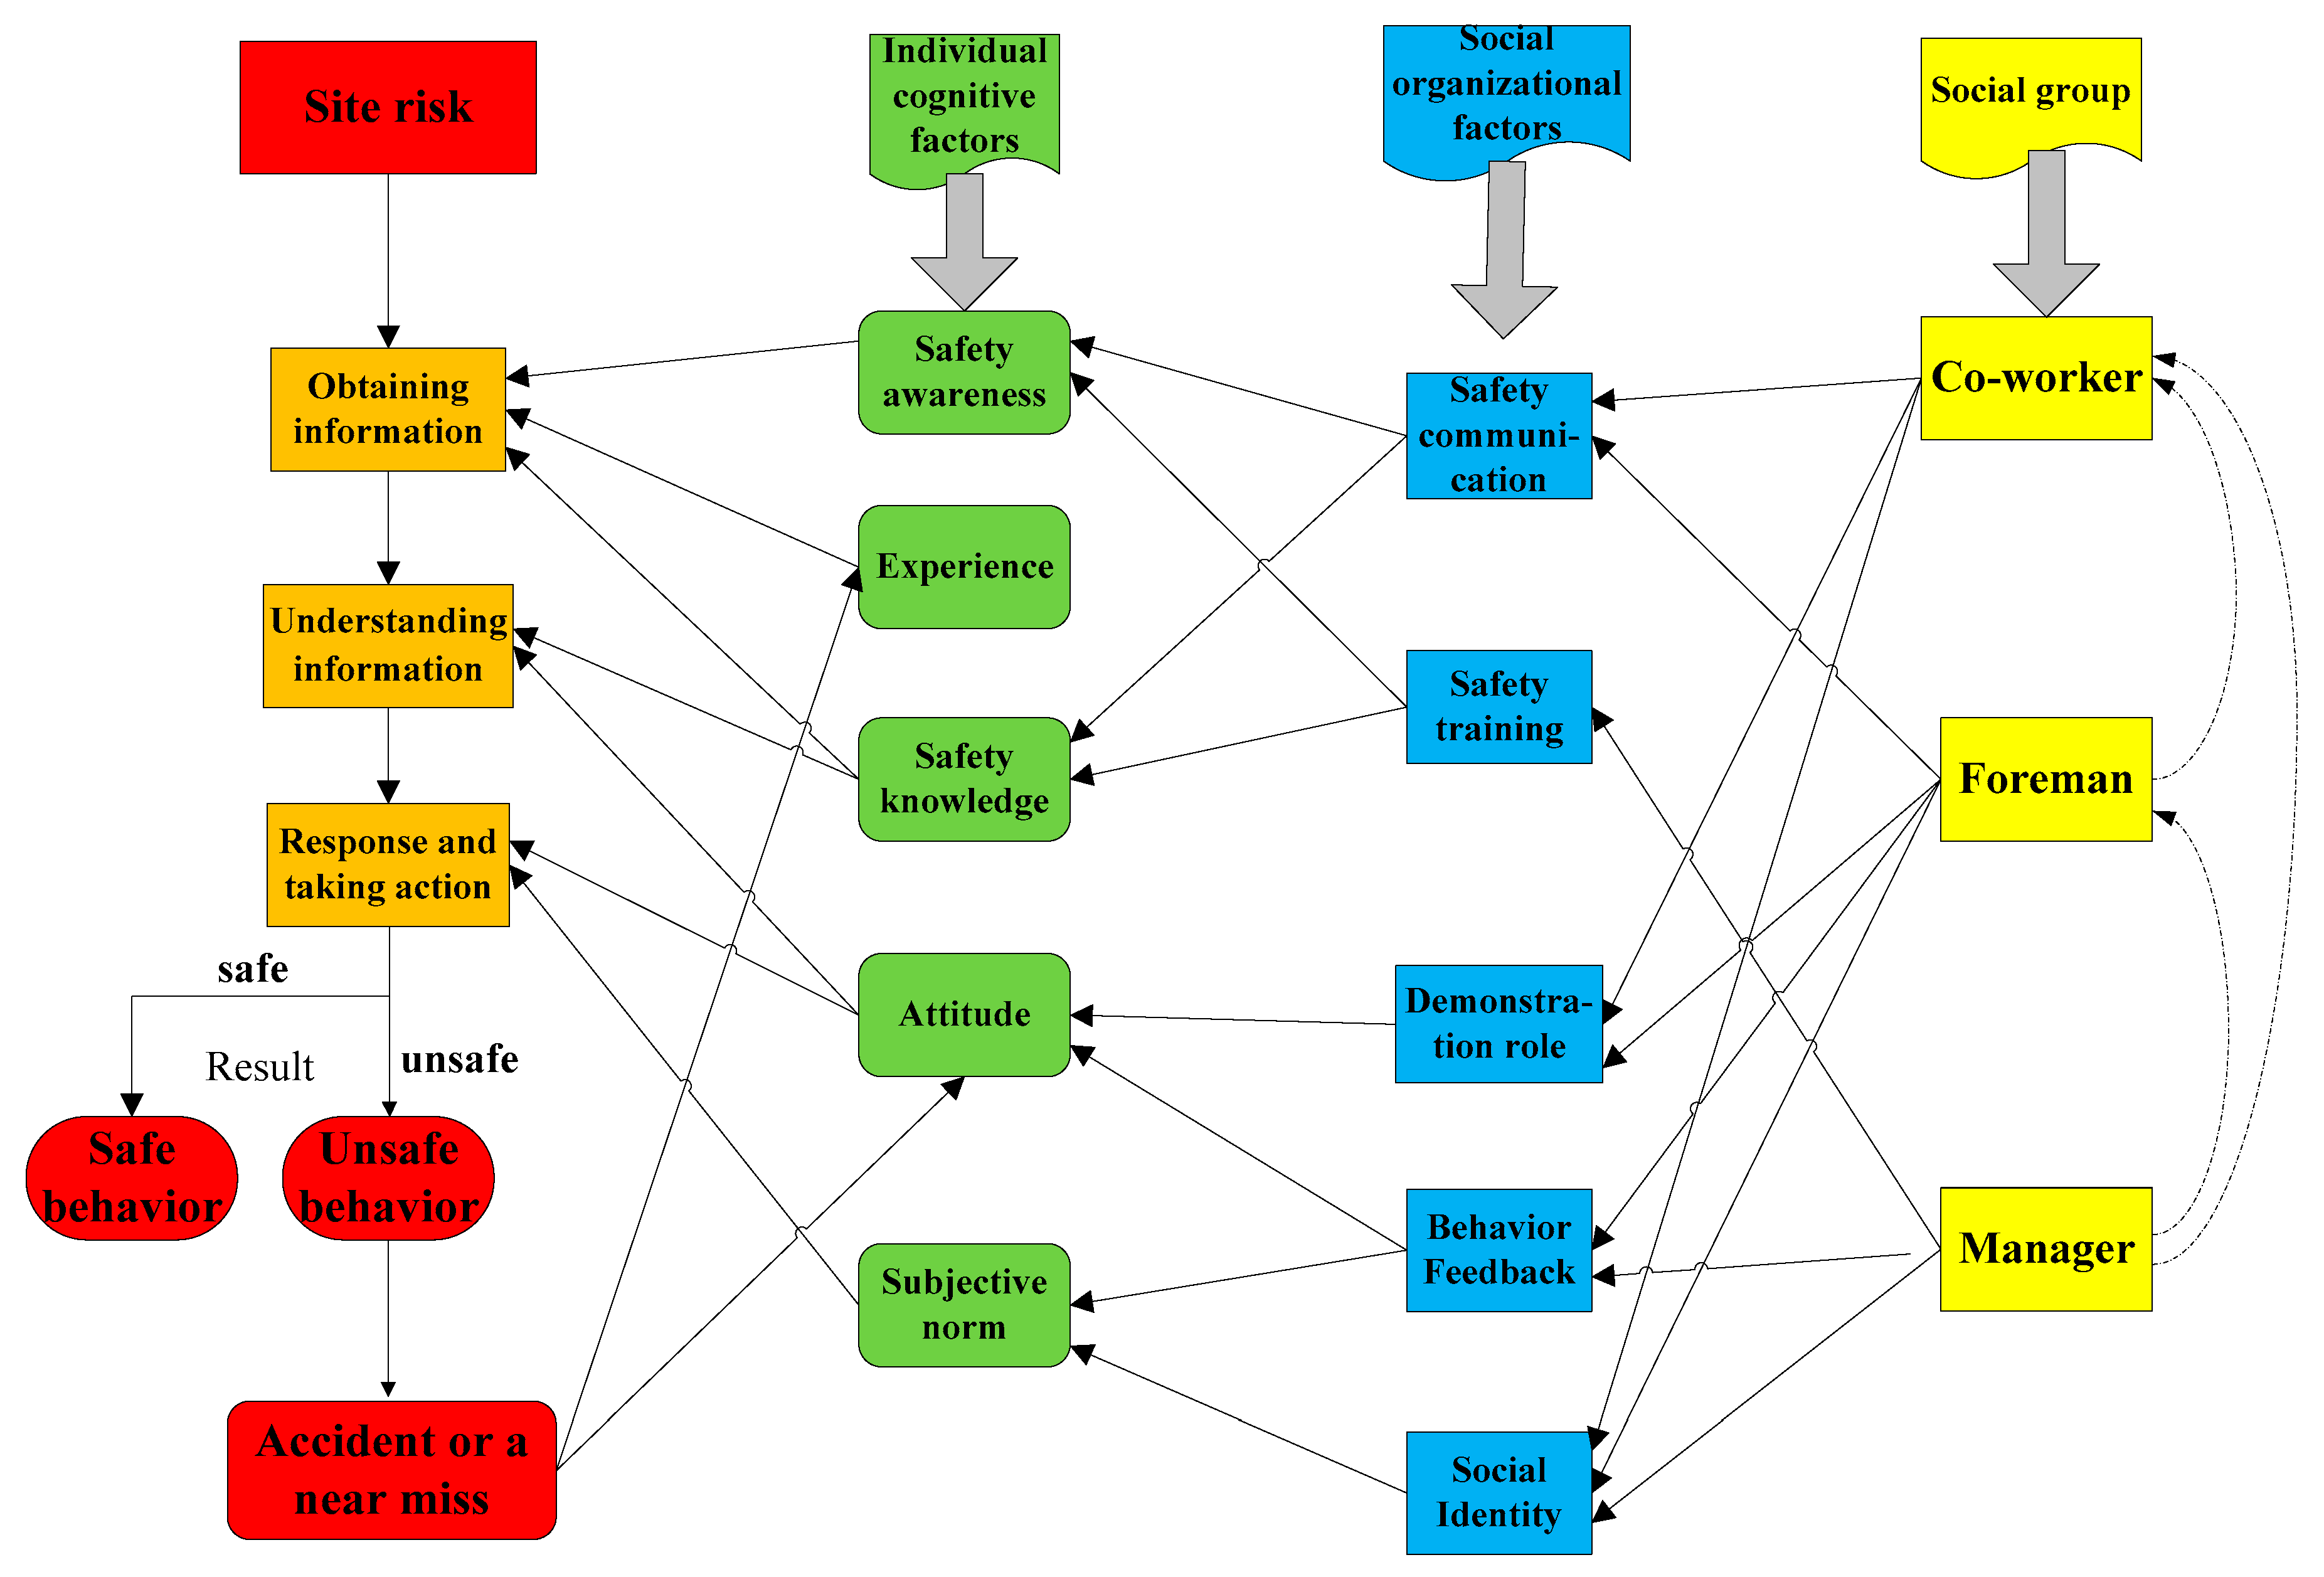
3.1. Framework
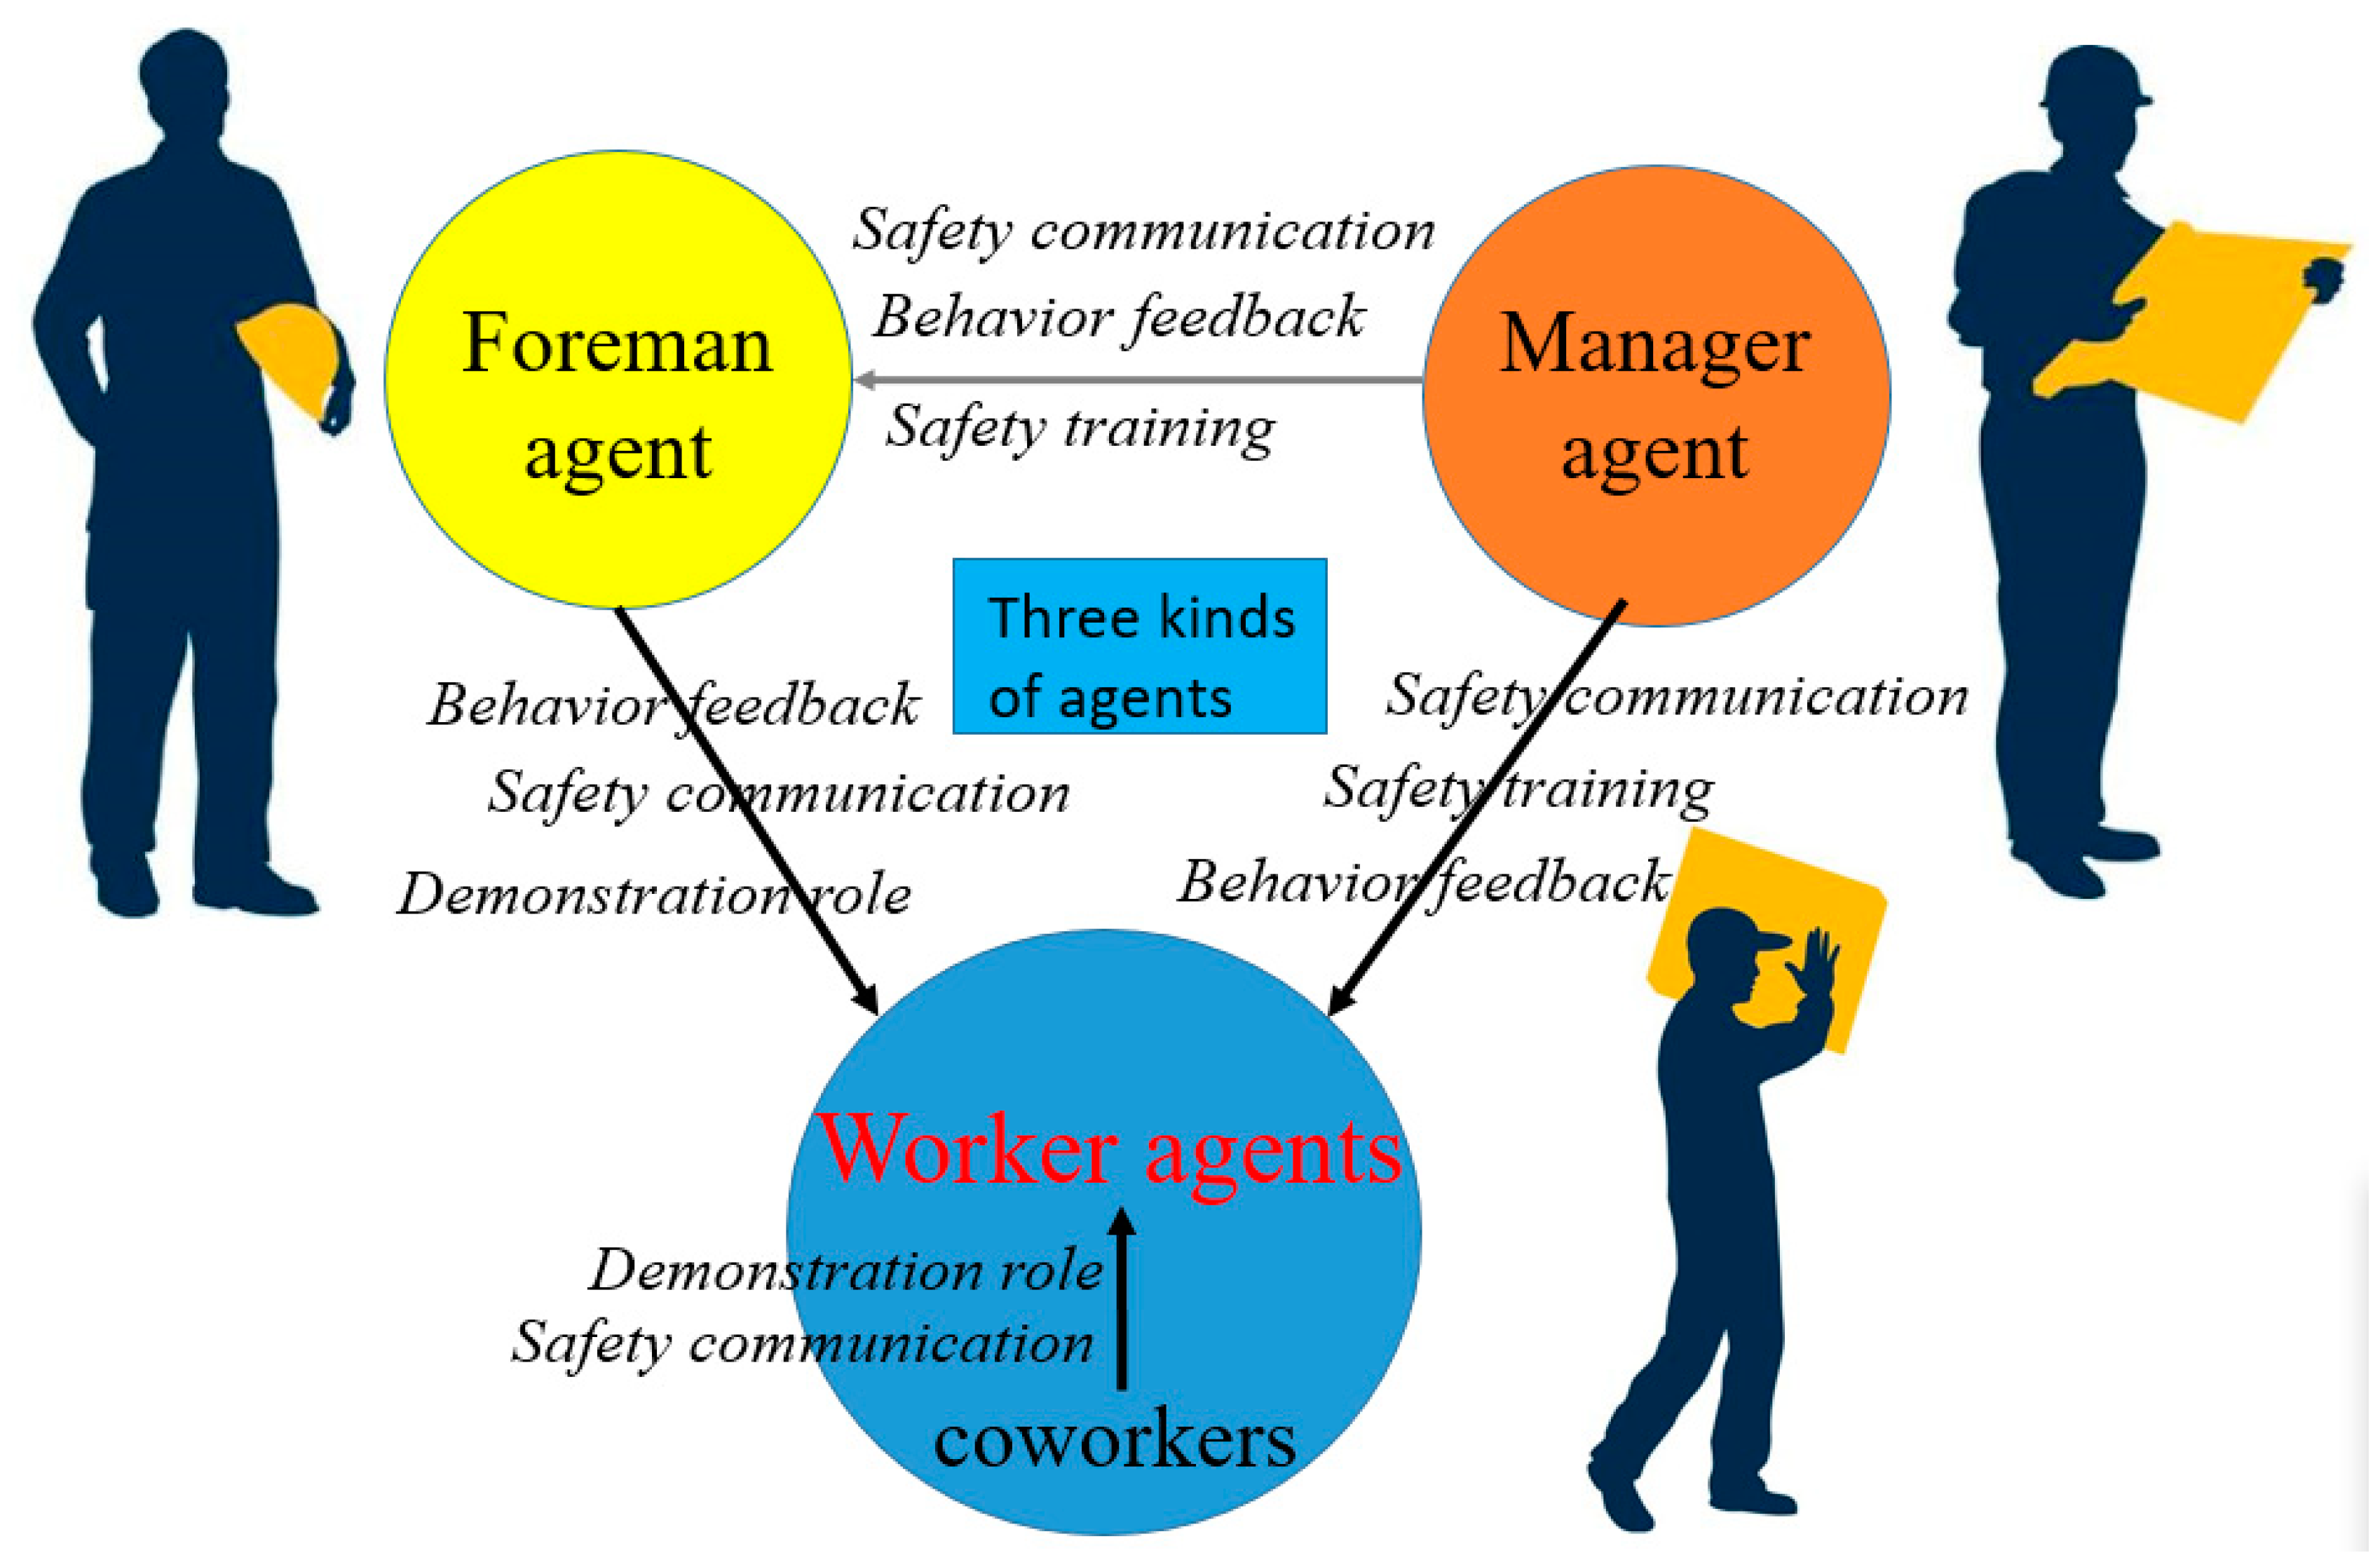
3.2. Defining the Agent’s Types and Relationships
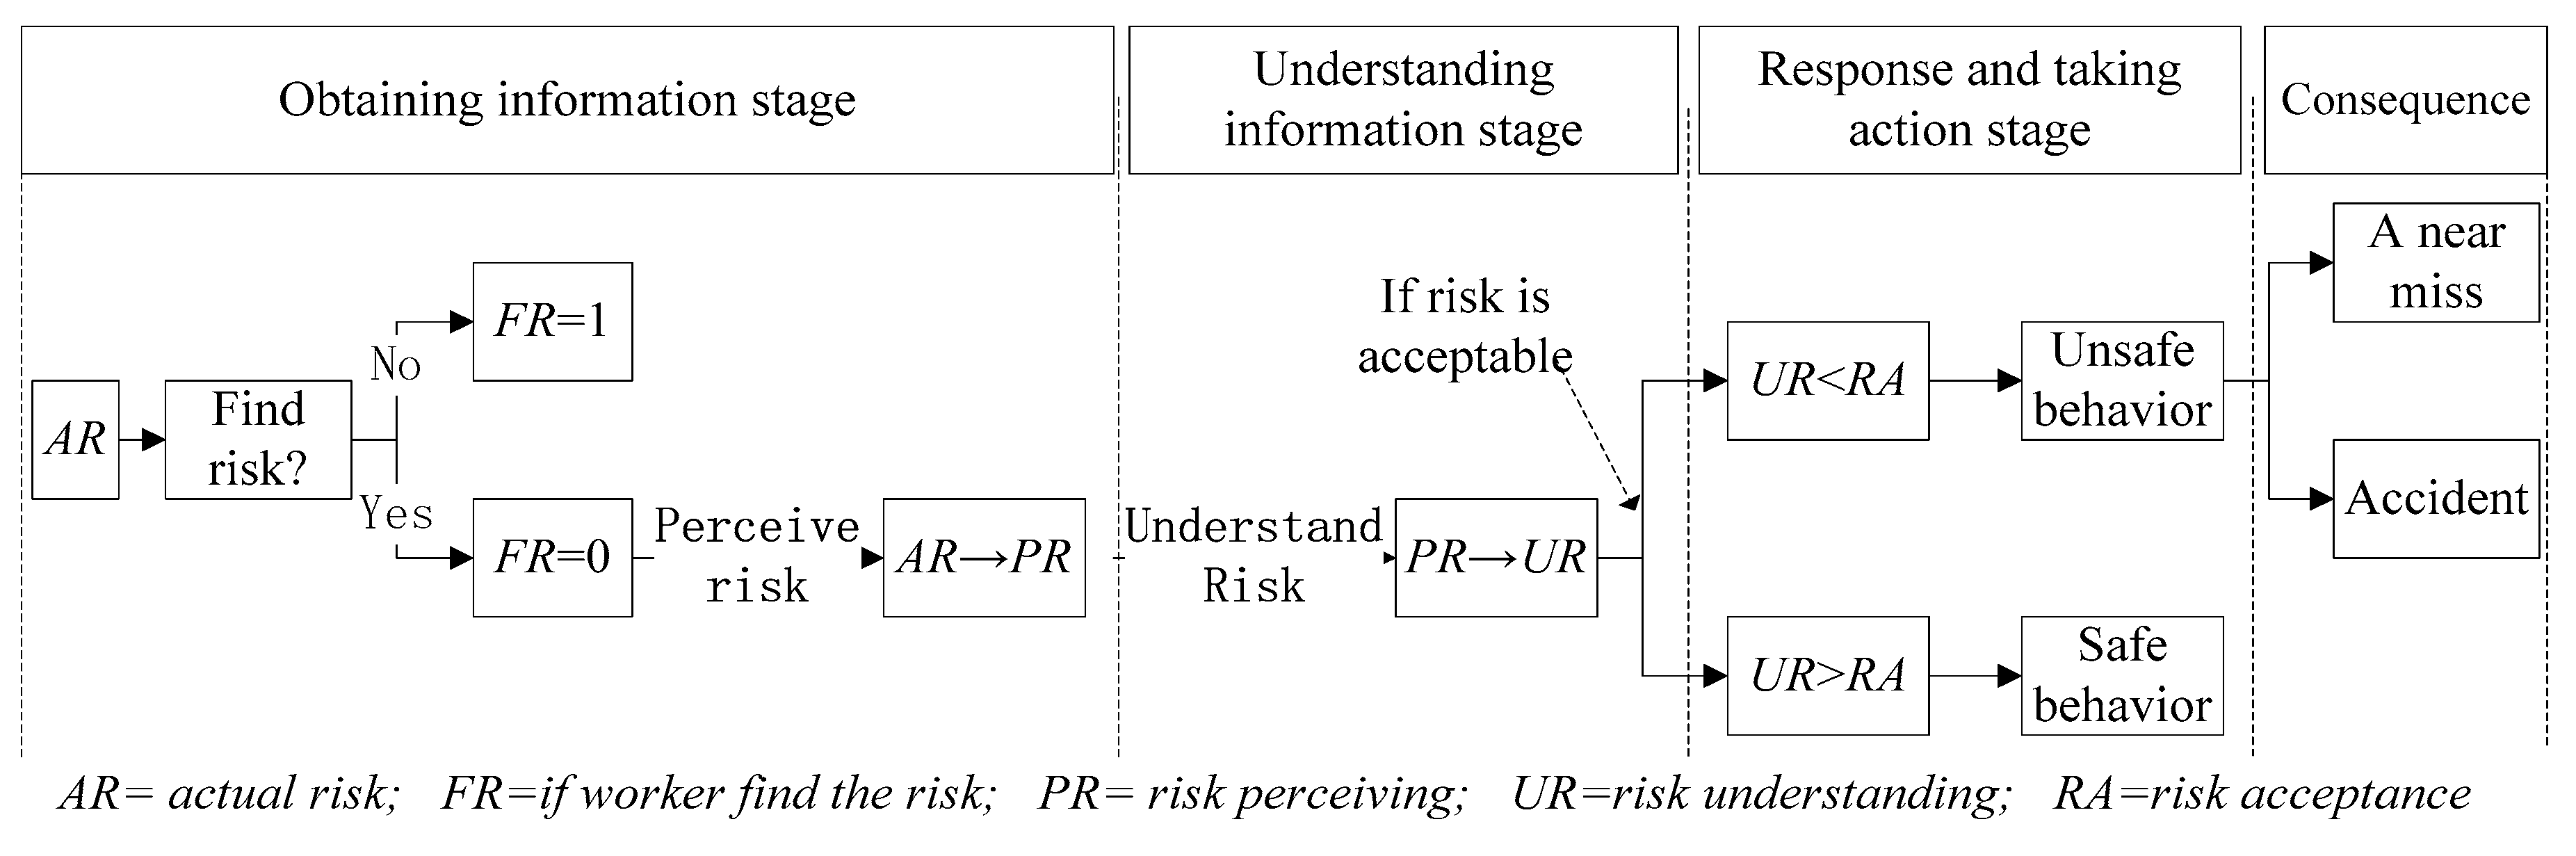
3.3. Worker’s Individual Cognitive Model
3.3.1. Stage of Obtaining Information
3.3.2. Stage of Understanding Information
3.3.3. Stage of Responding and Taking Action
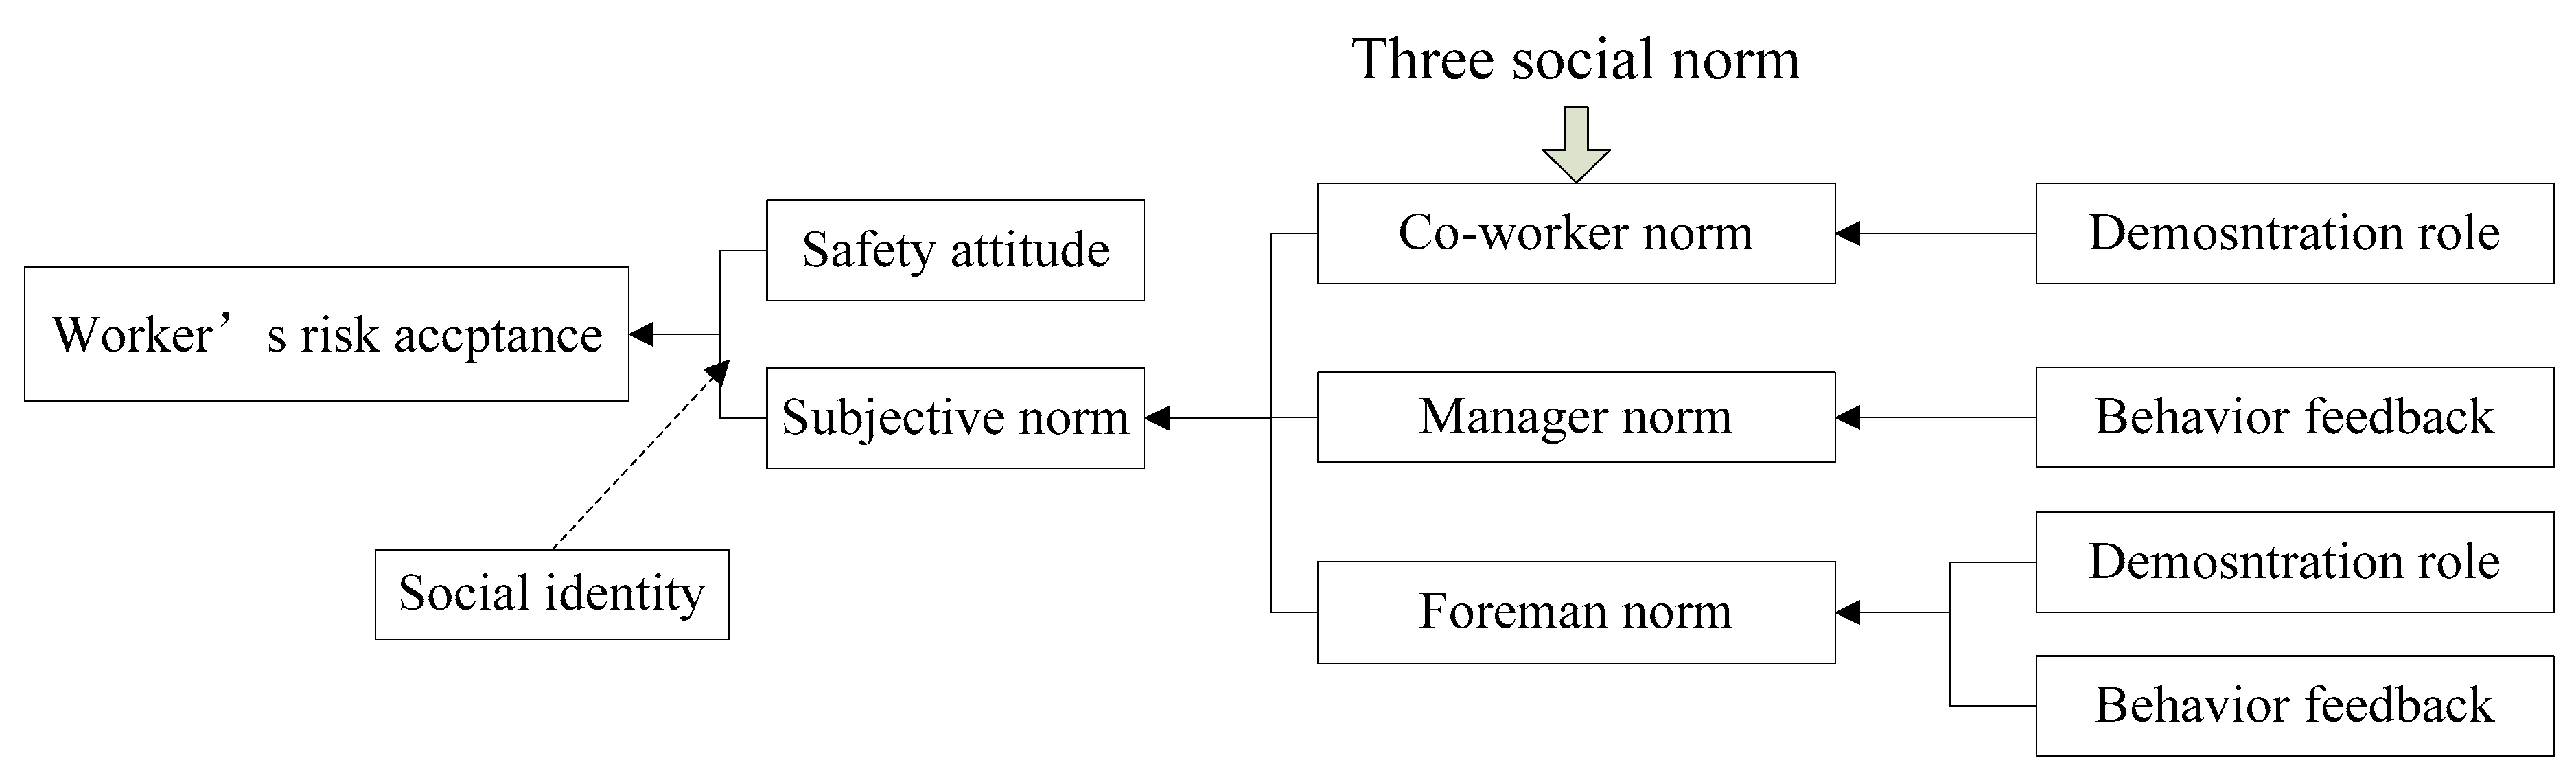
3.4. Model of Coworker, Foreman, and Manager Interaction
3.4.1. Interaction Model in the Stages of Obtaining Information and Understanding Information
3.4.2. Interaction Model in the Stage of Responding and Taking Action
Foreman Norm
Coworker Norm
Manager Norm
3.5. Model Initialization
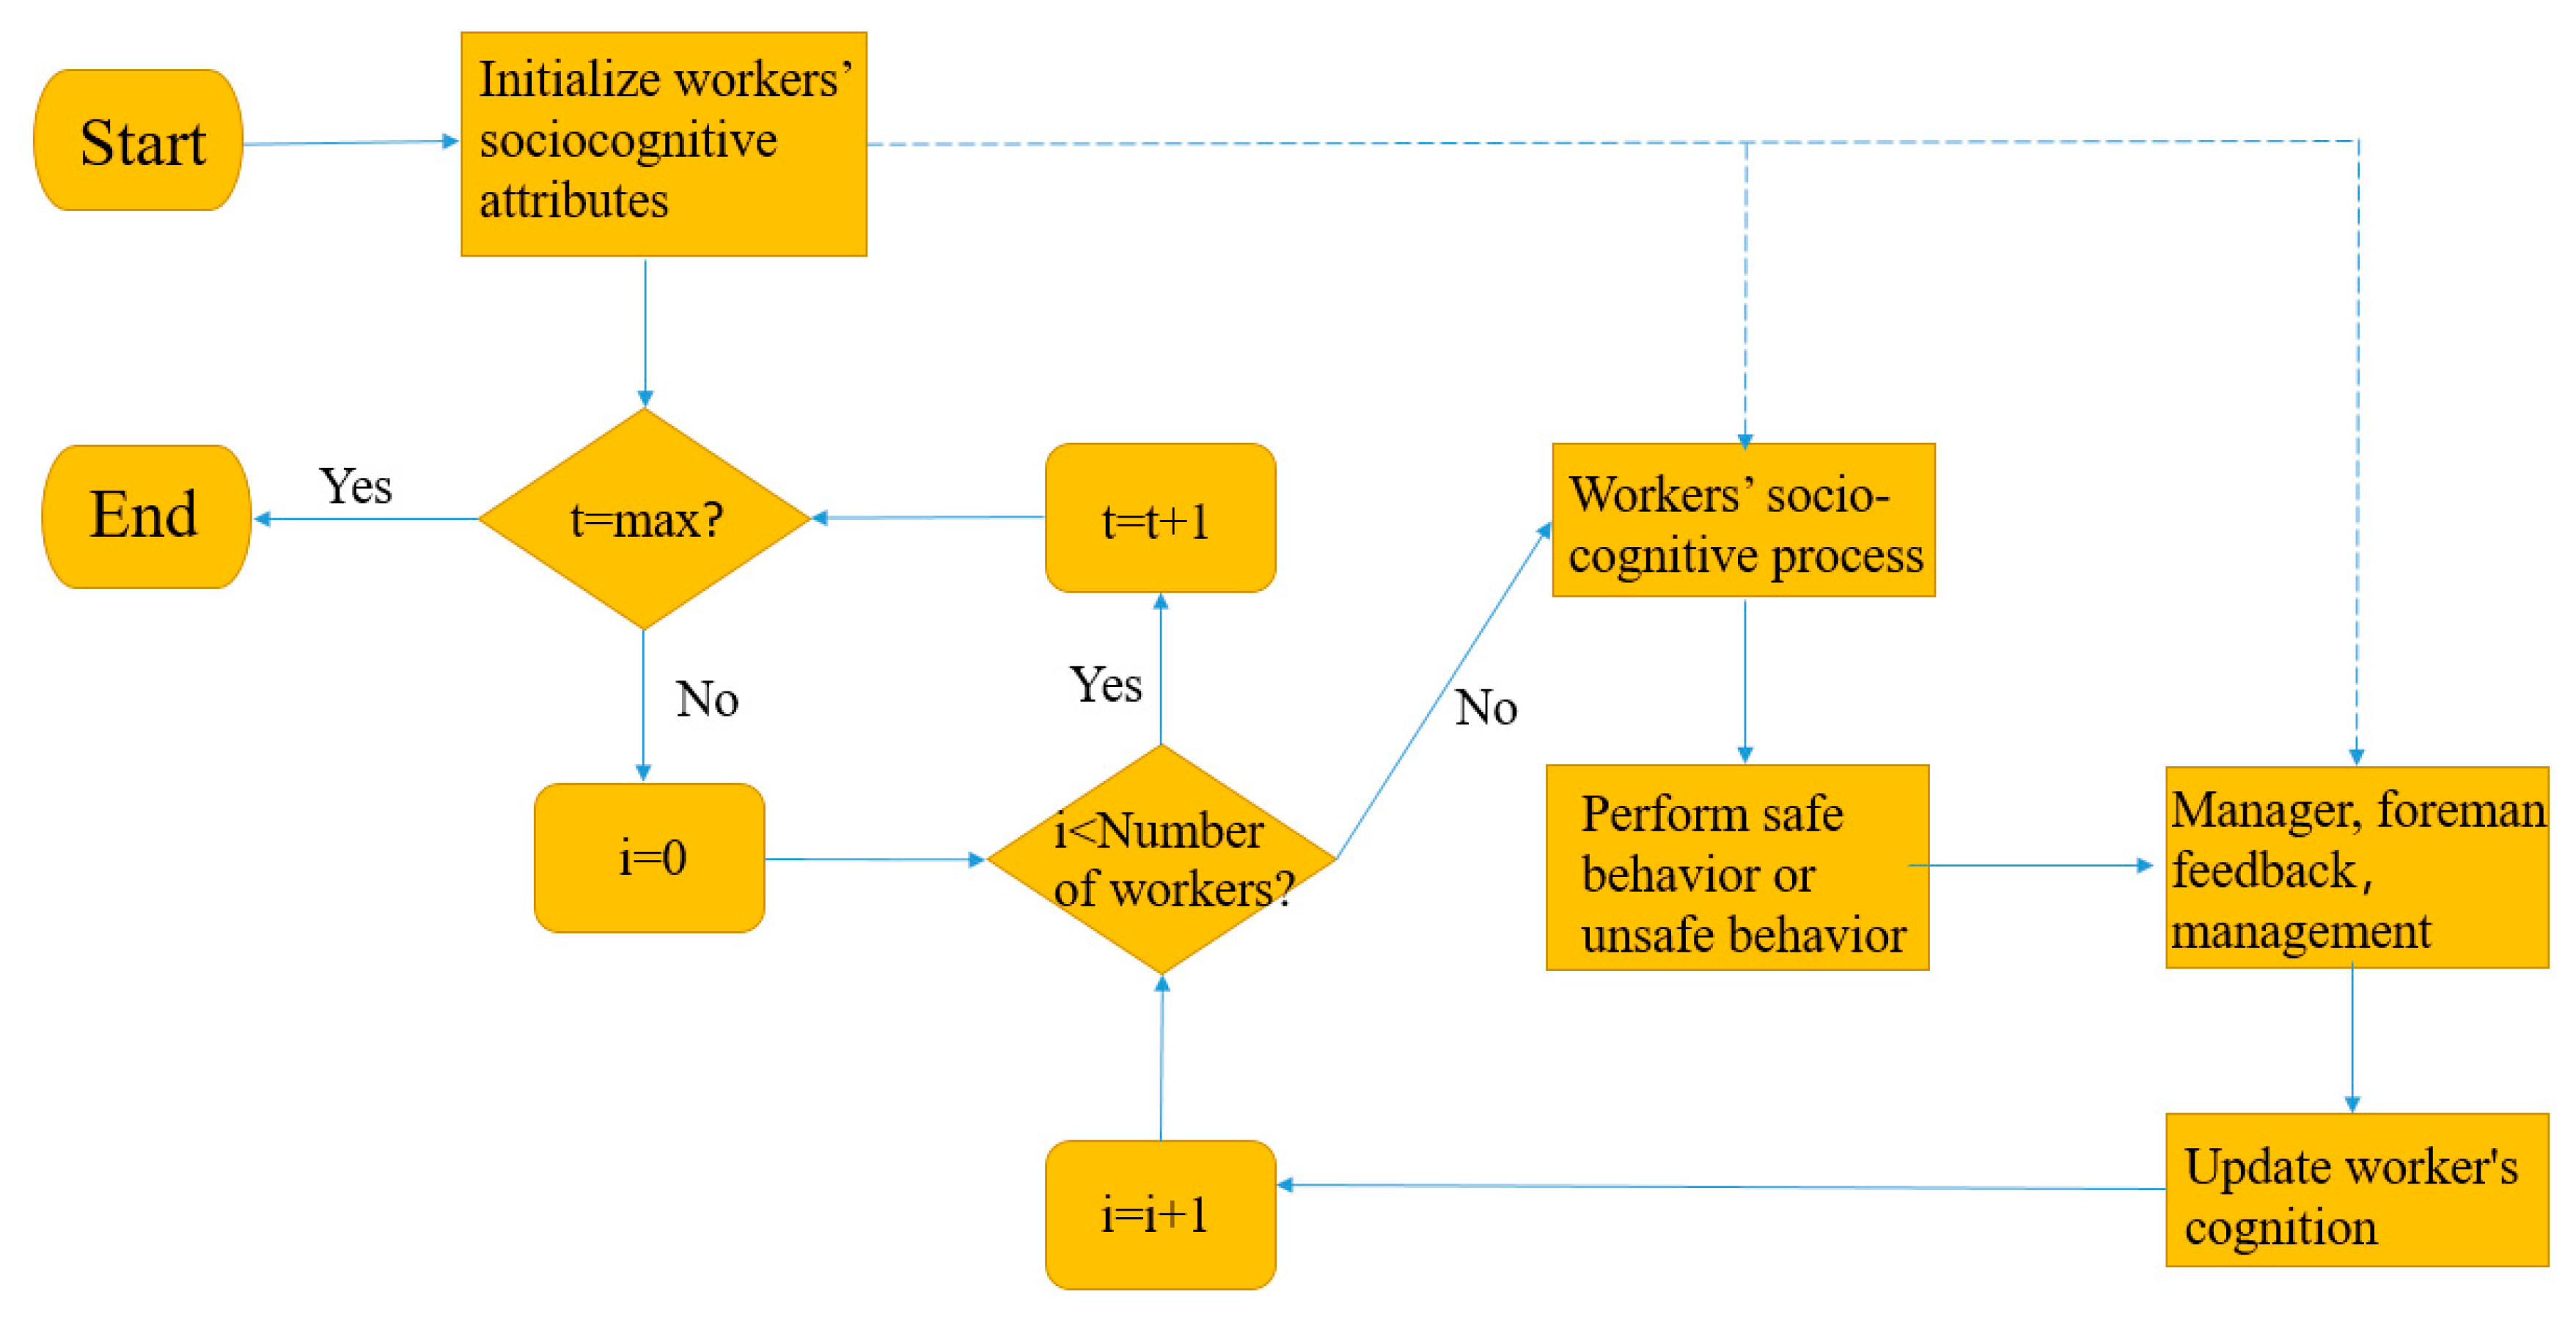
3.5.1. Simulation Process
3.5.2. Initializing Parameters
3.6. Model Validation
4. Result
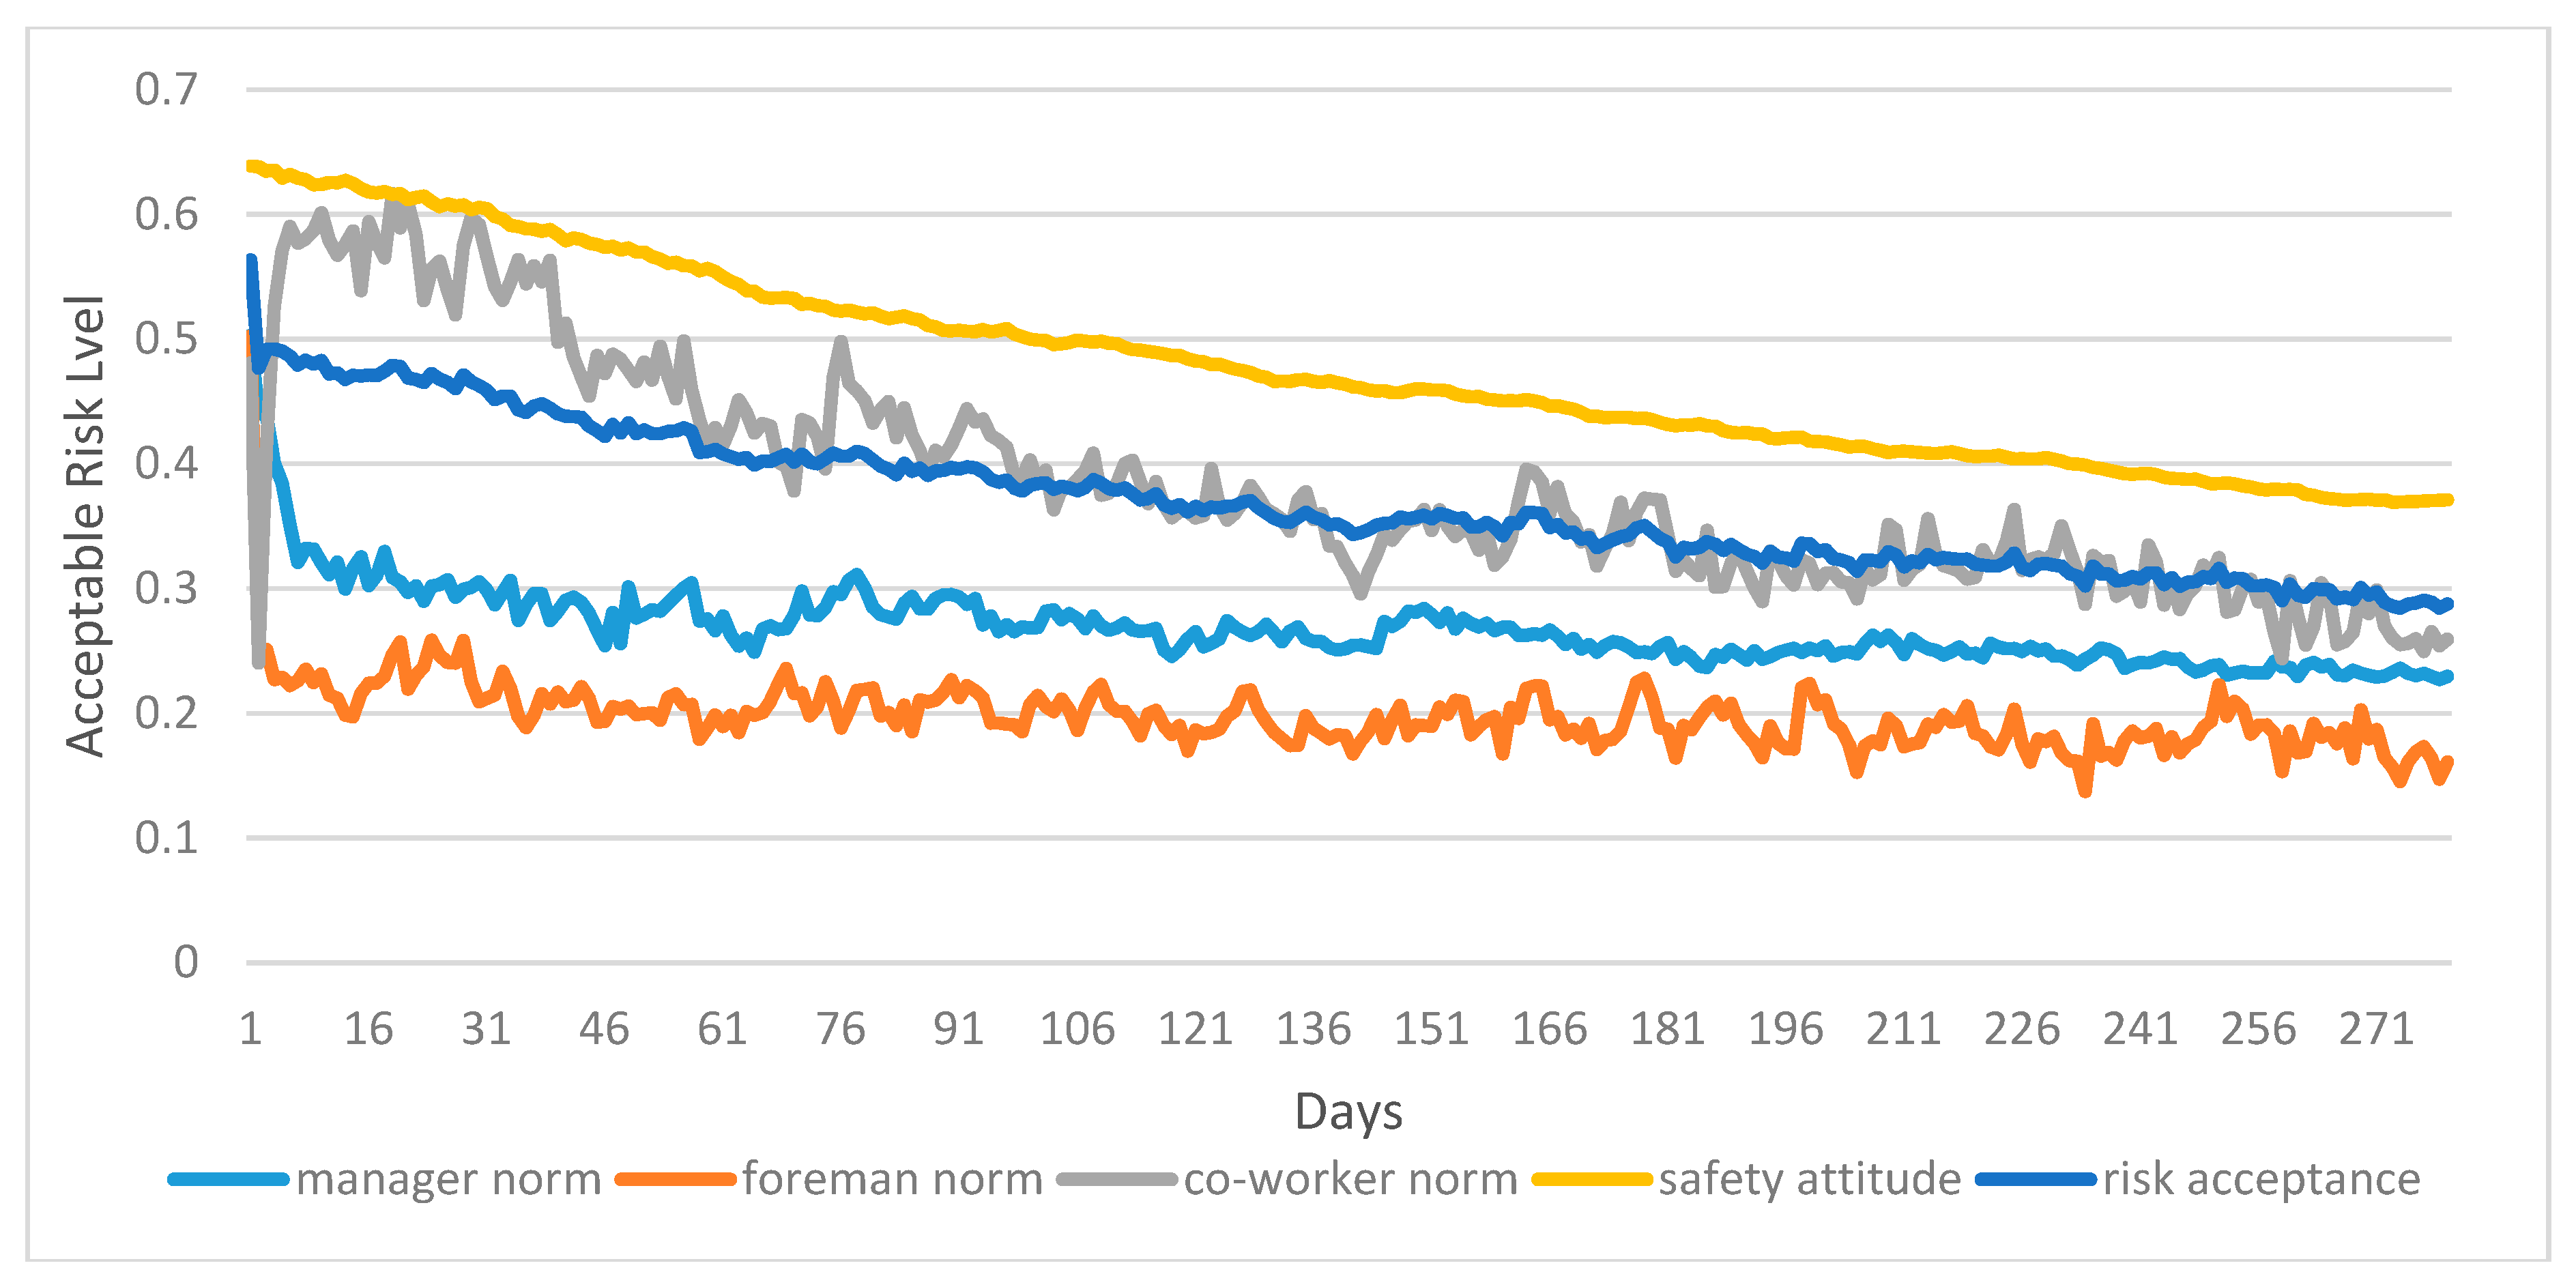
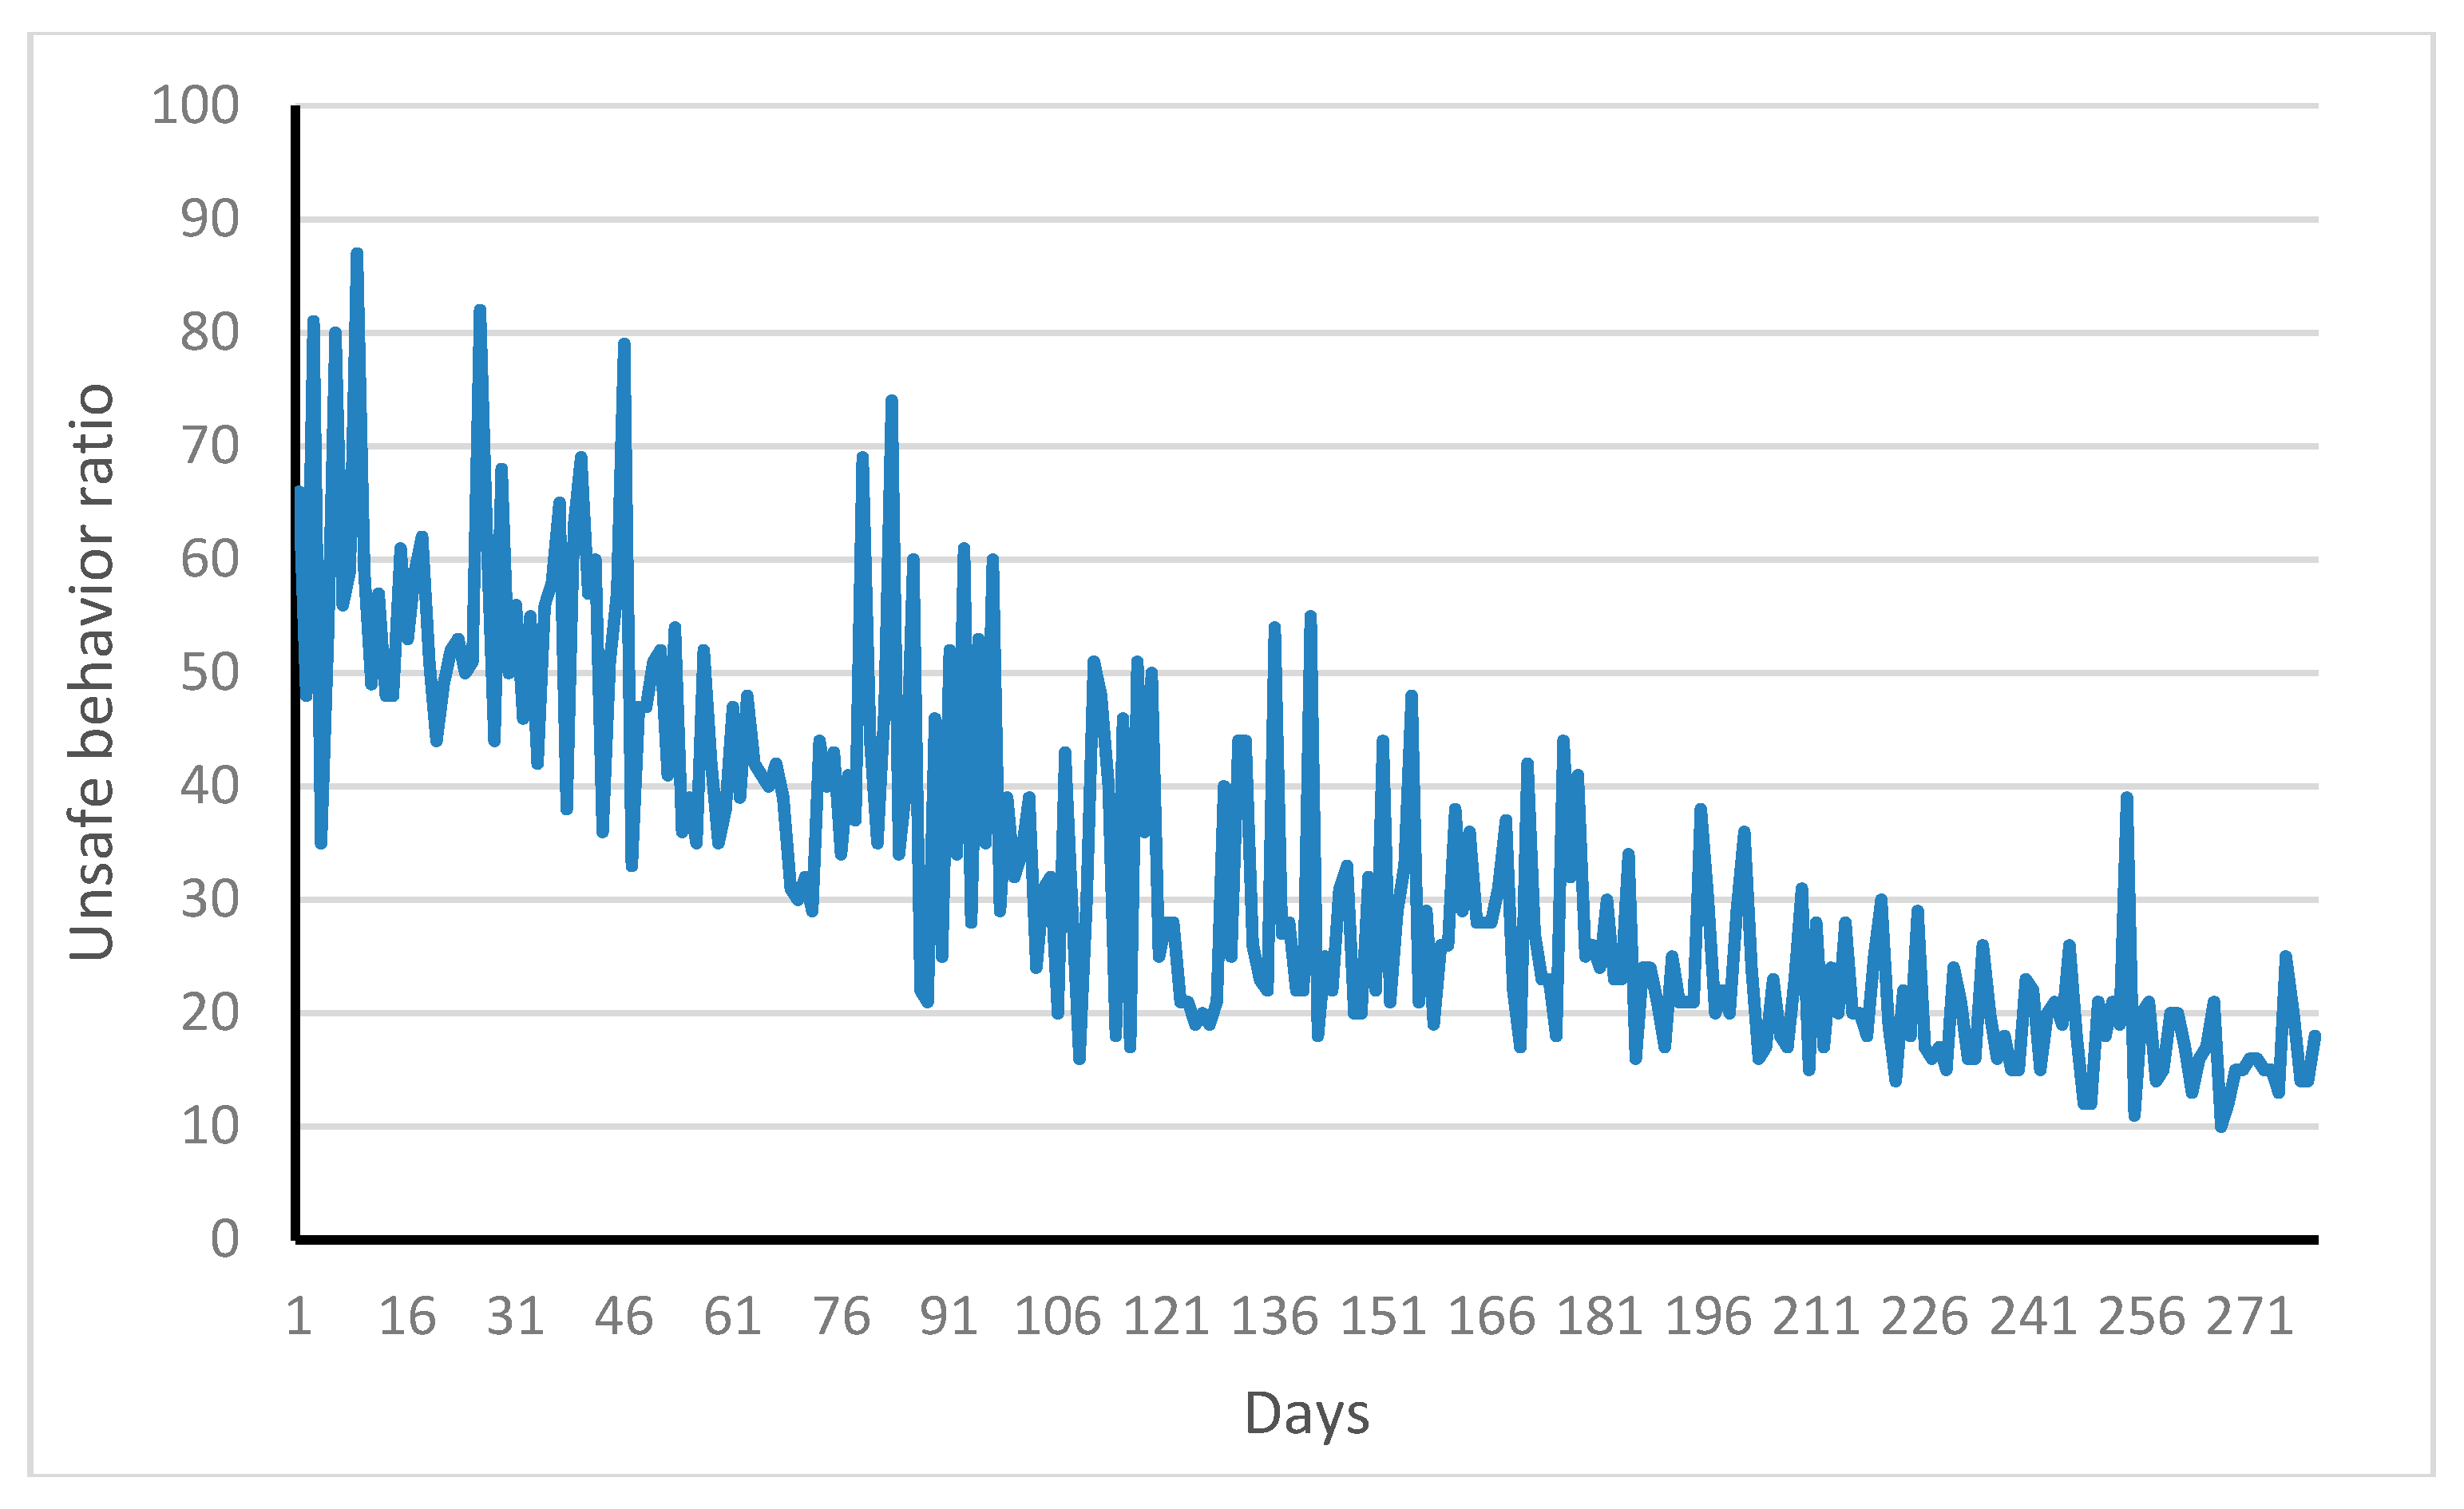
4.1. Manager, Foreman, and Coworker Interaction Influence Baseline Model
4.2. Not Considering the Single Social Norm or Foreman’s Demonstration Role
4.3. Causes of Cognitive Failure of Construction Workers
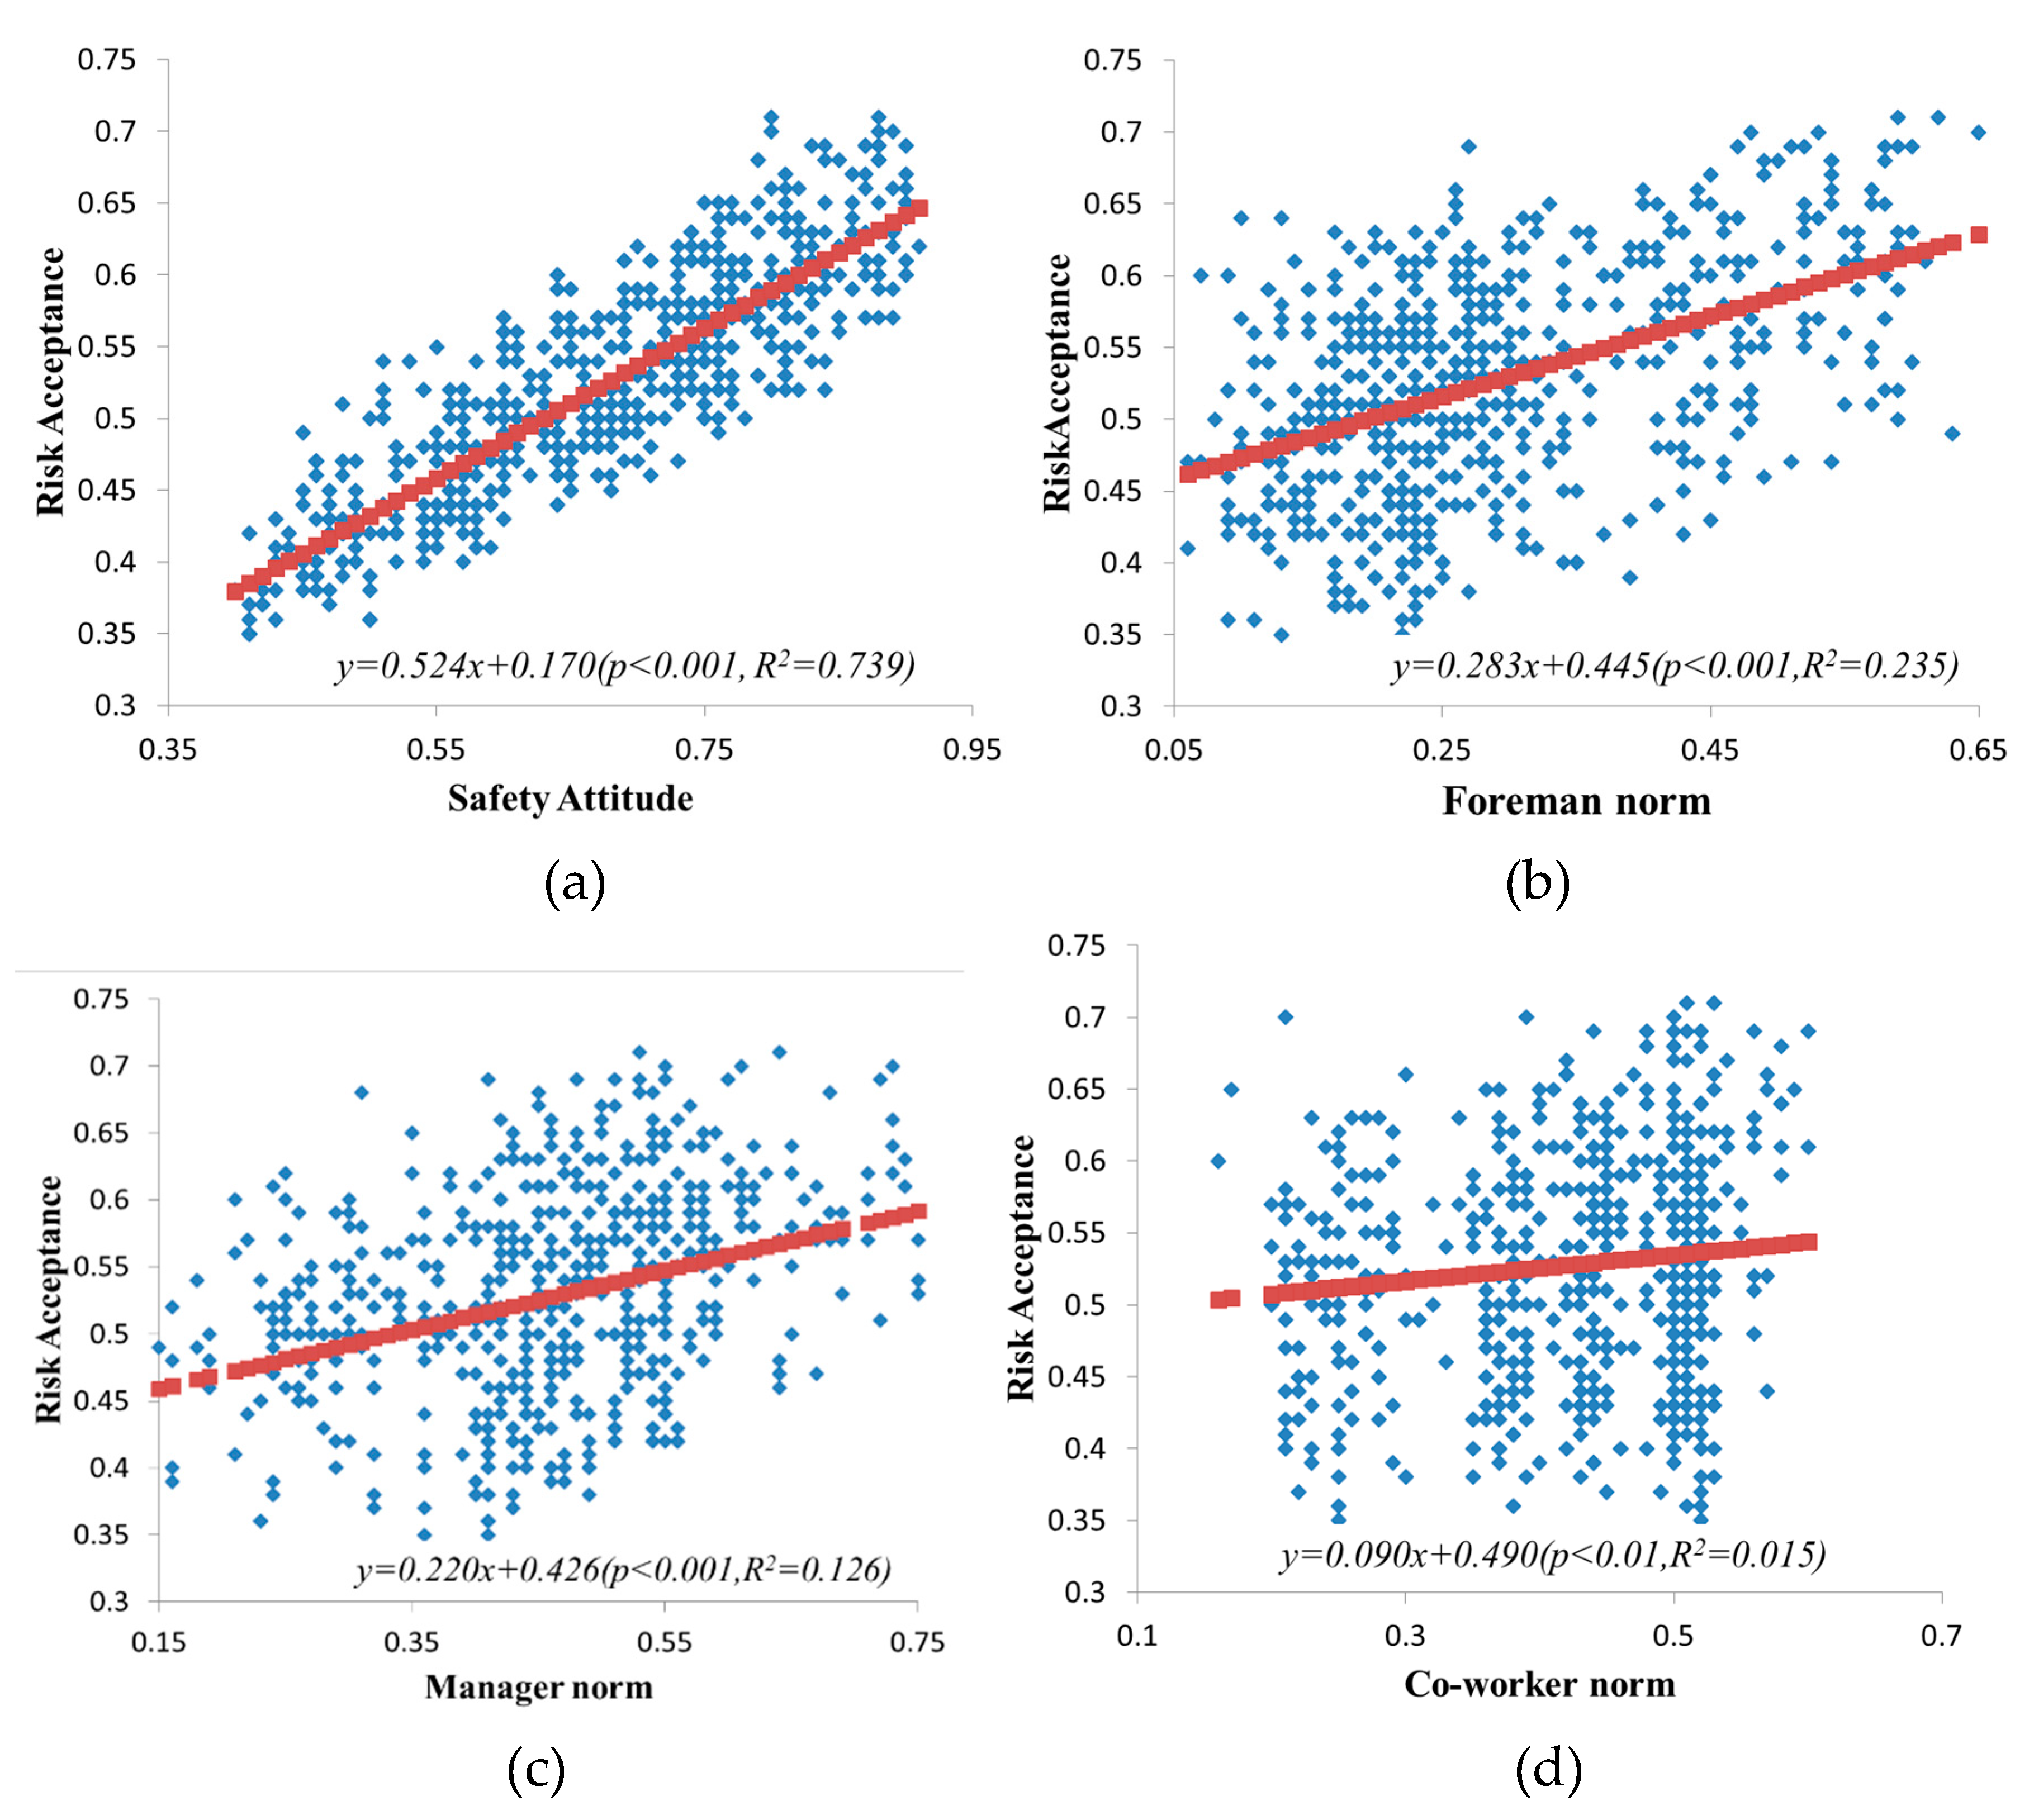
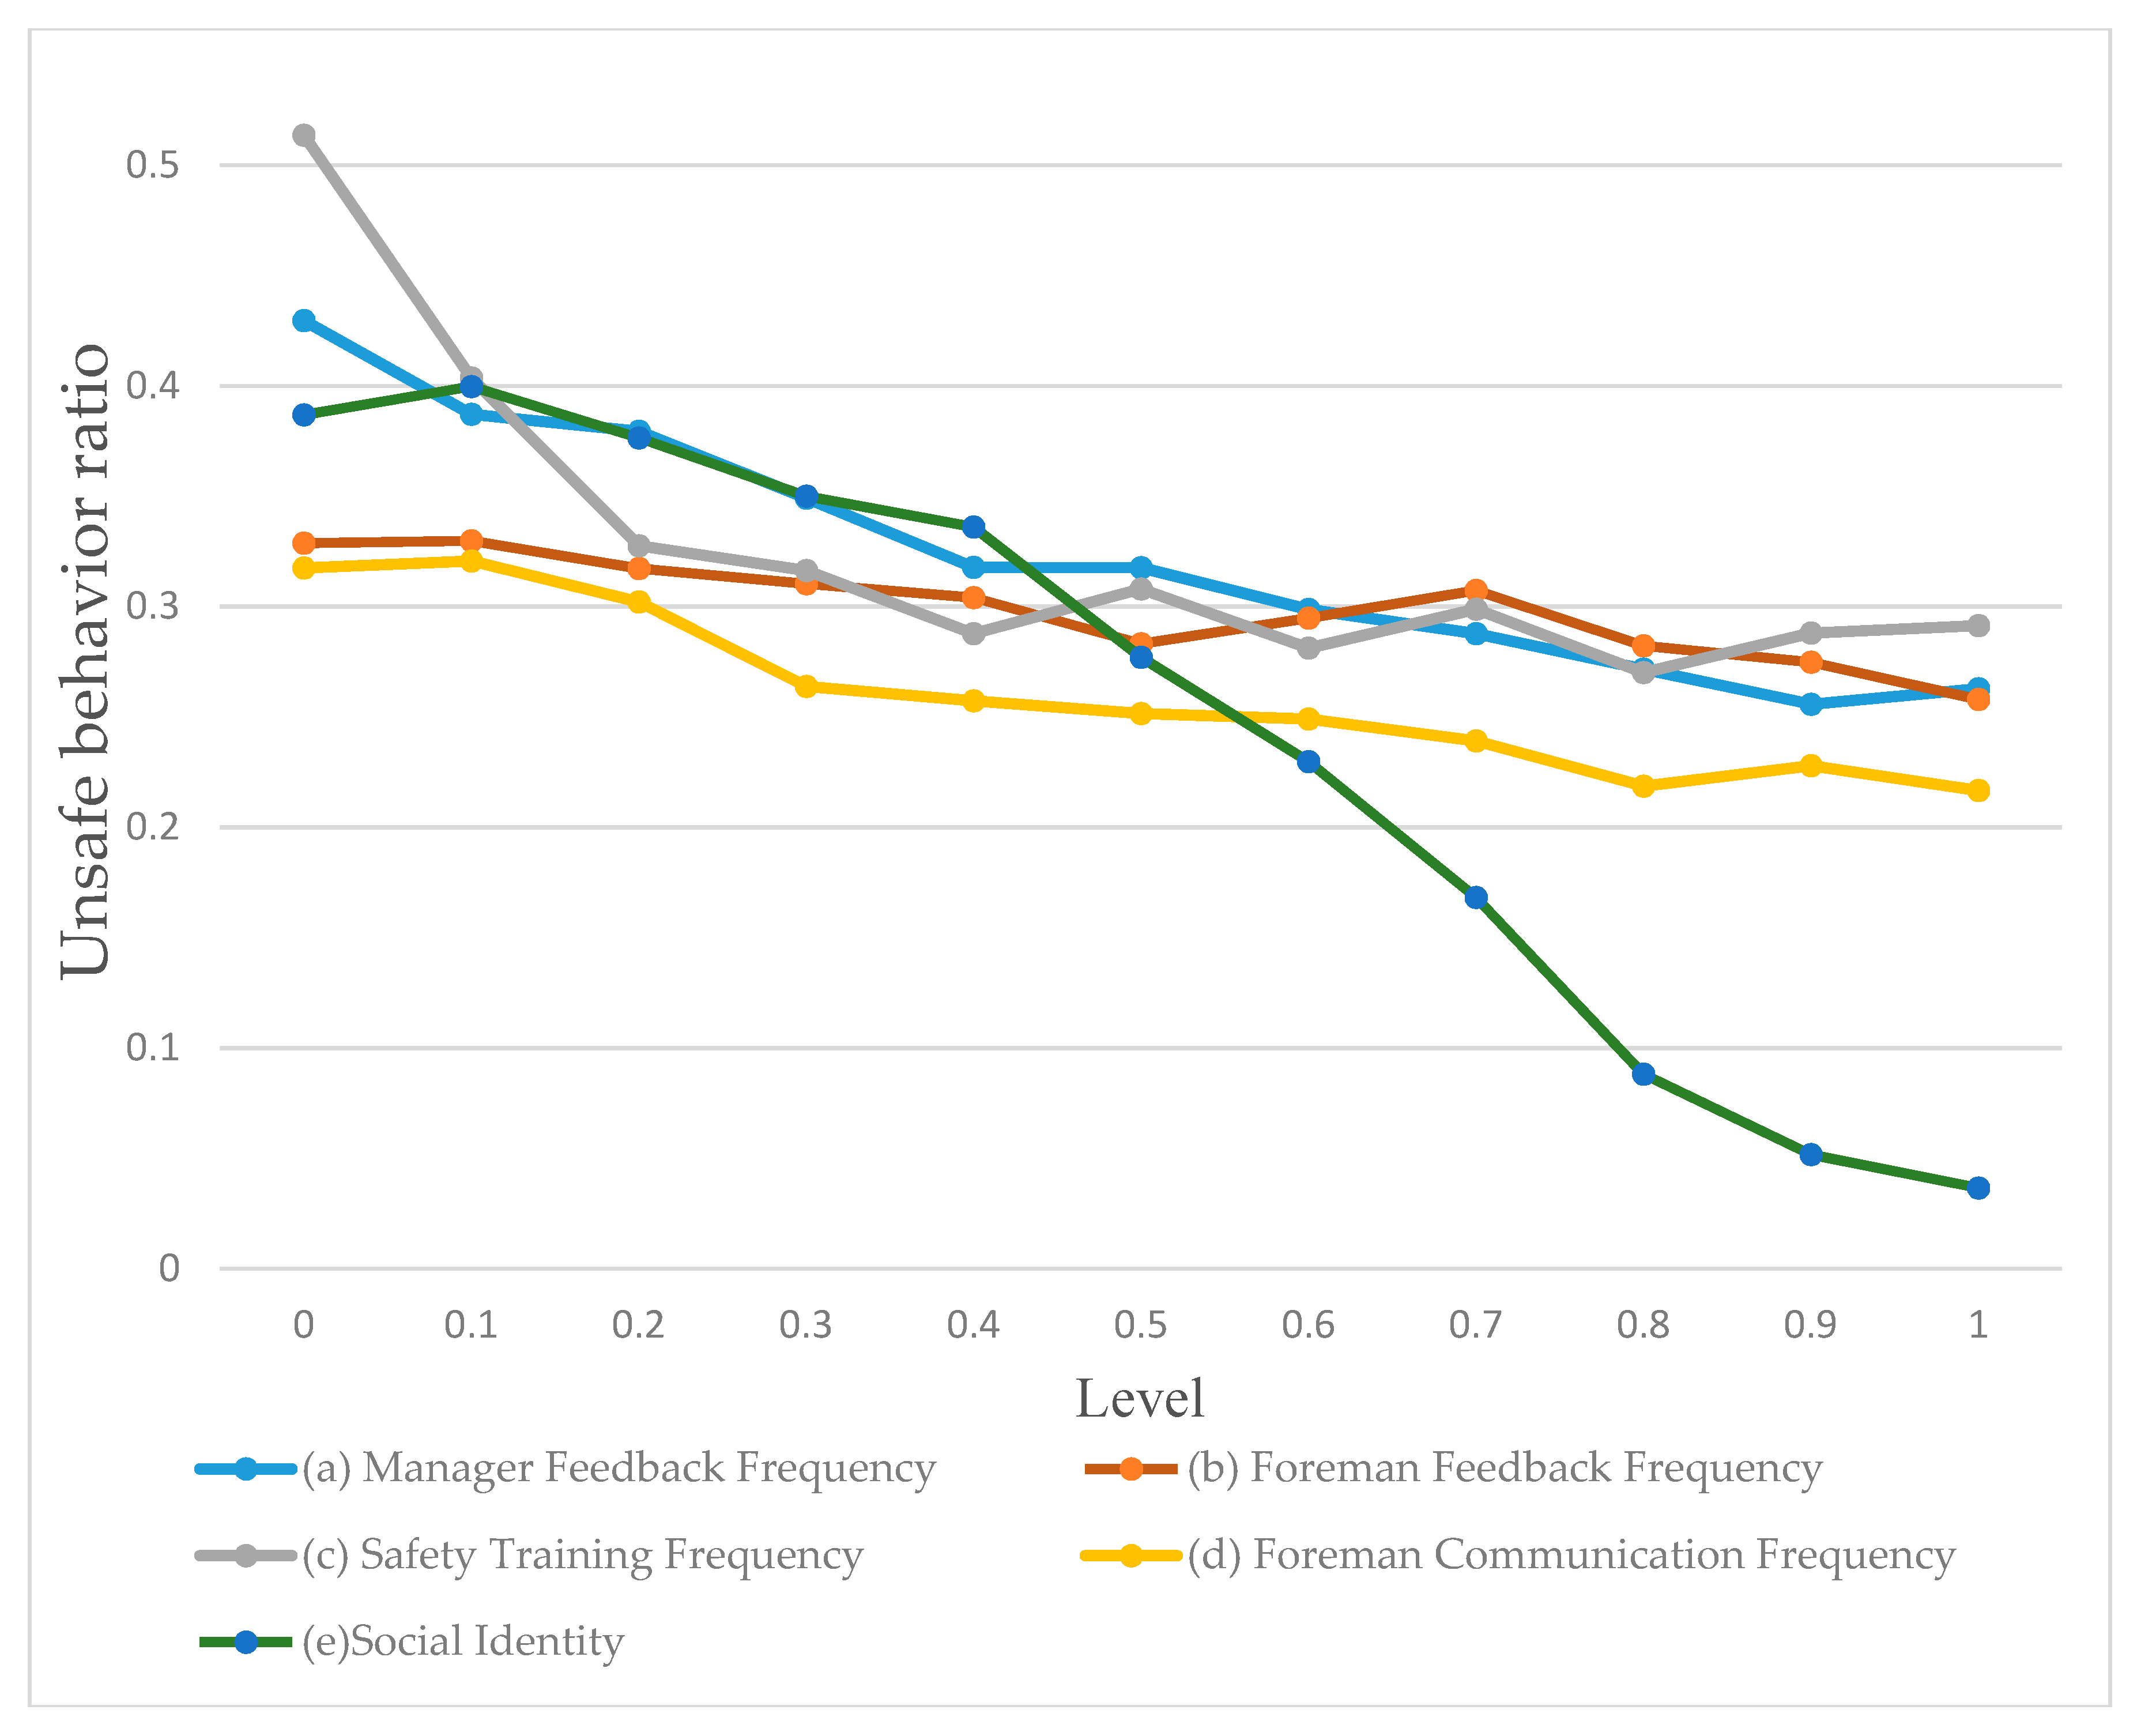
4.4. Analysis of Single Social Organizational Factors Influence
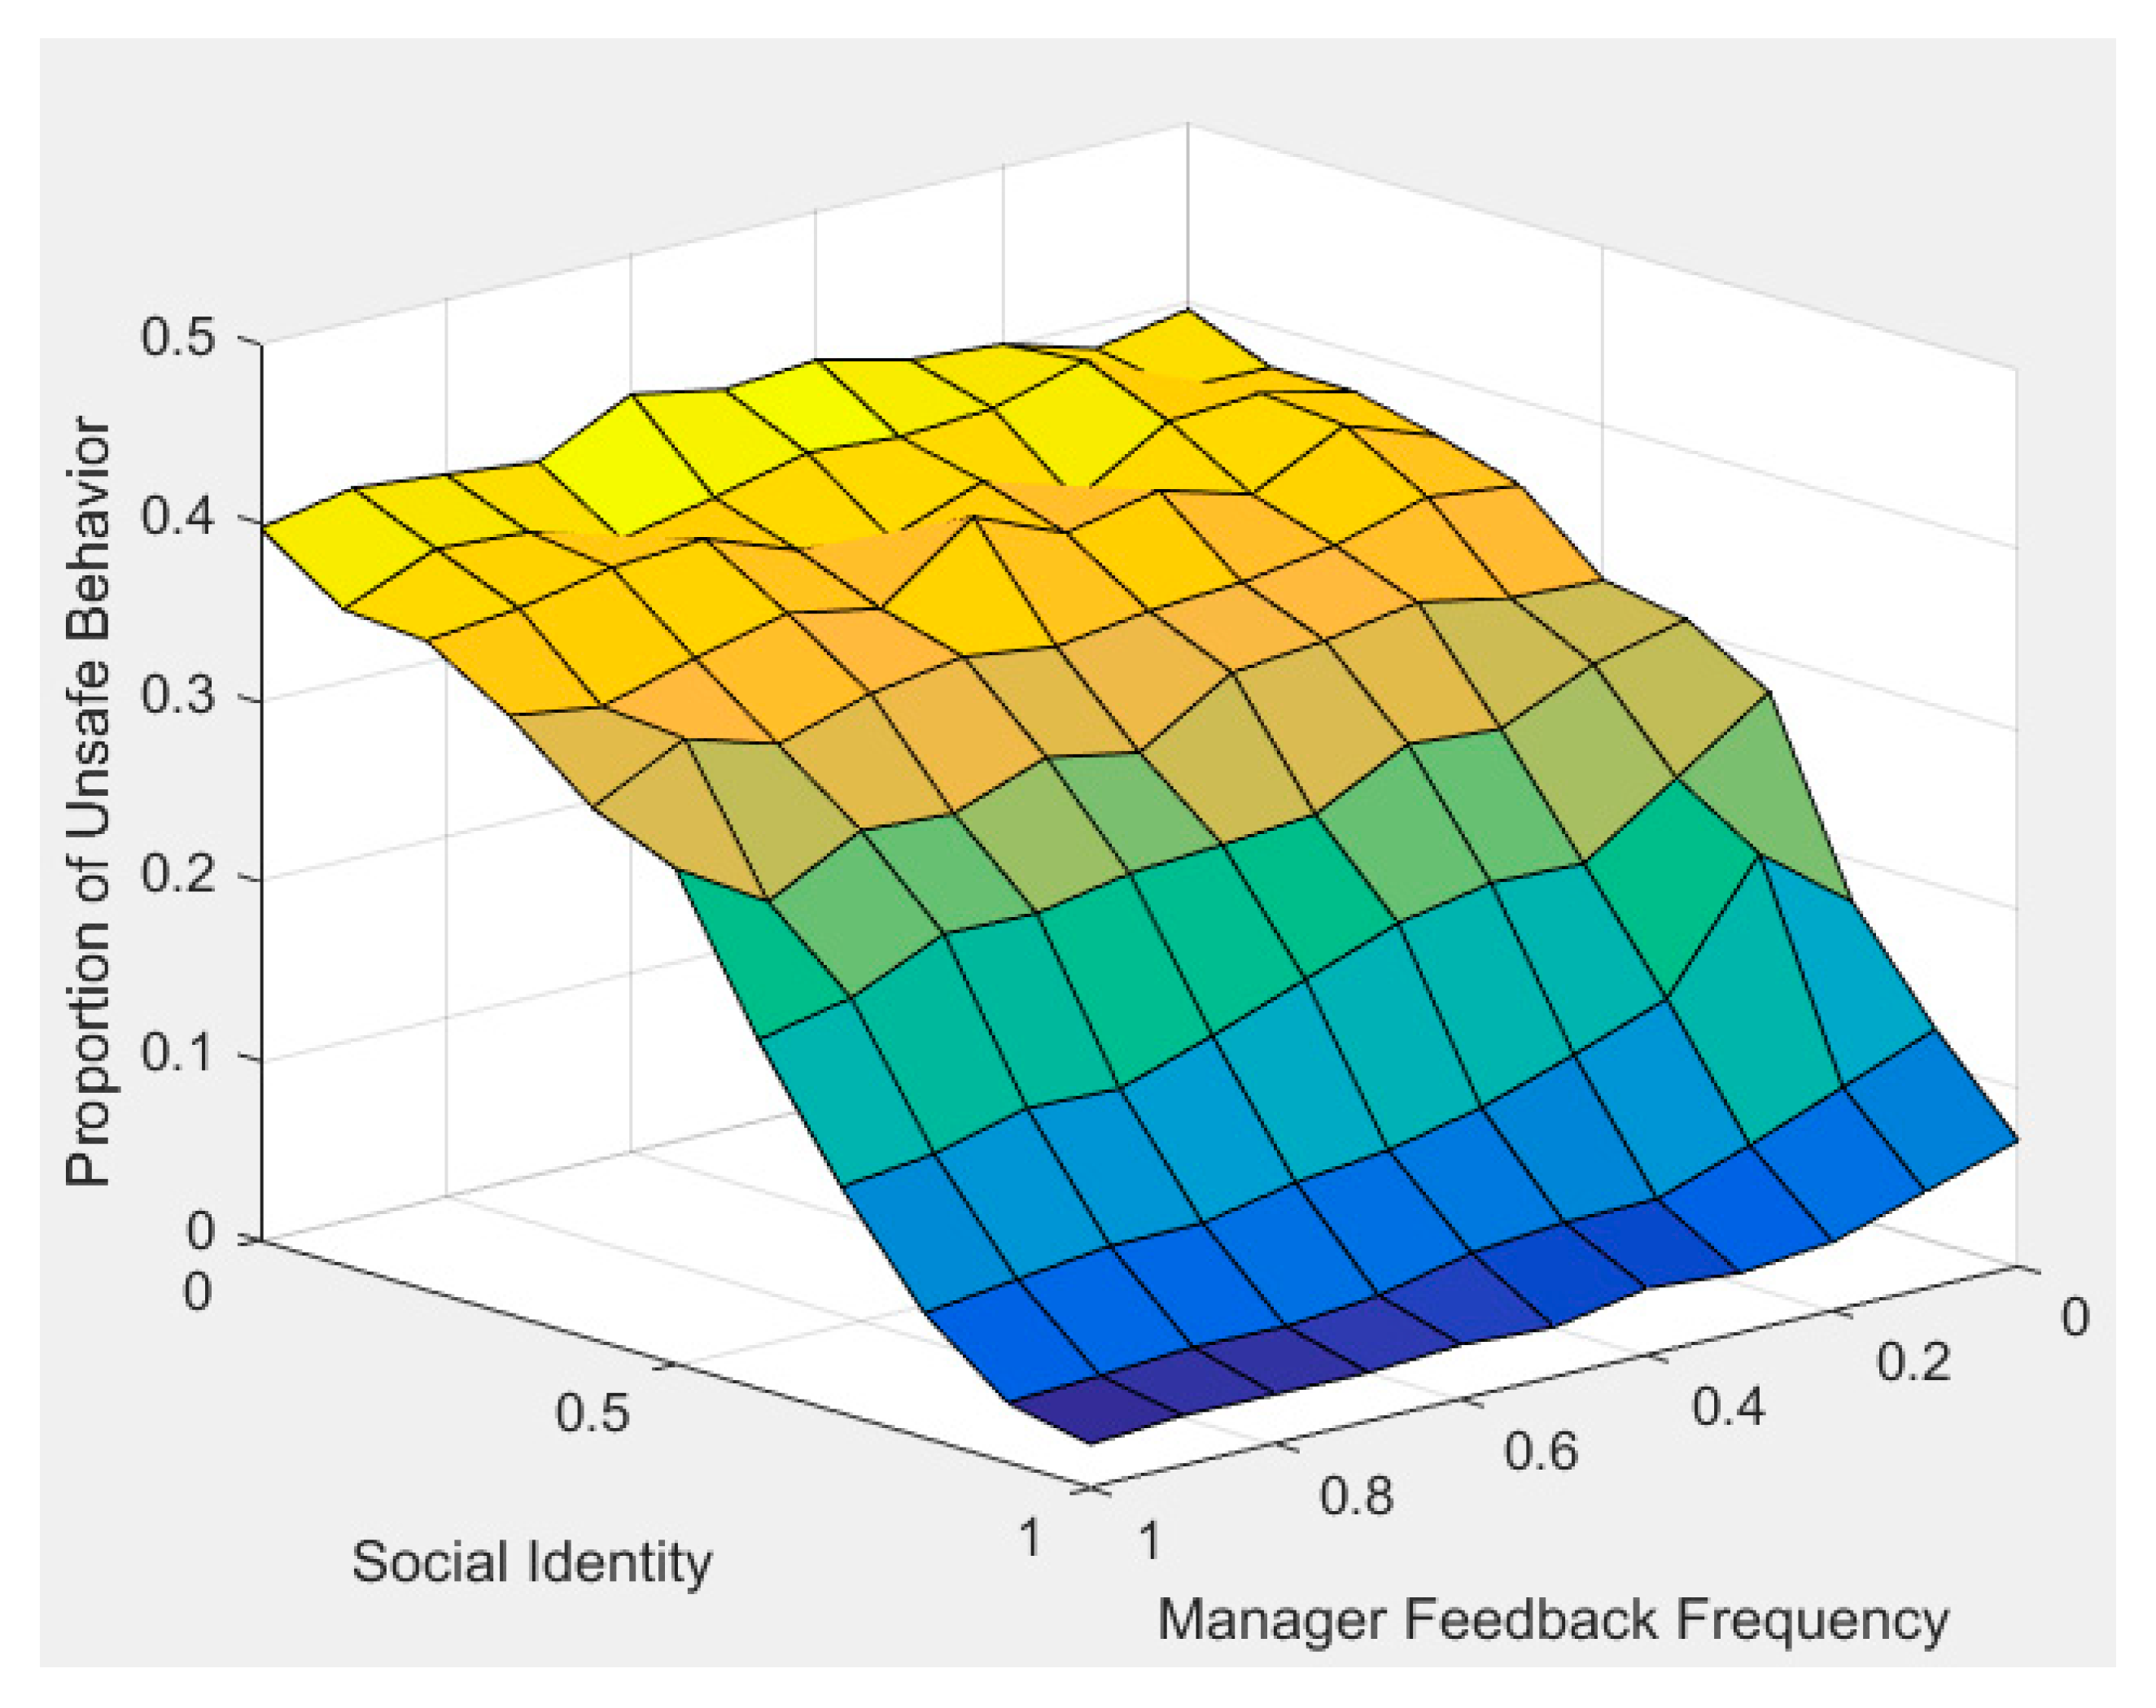
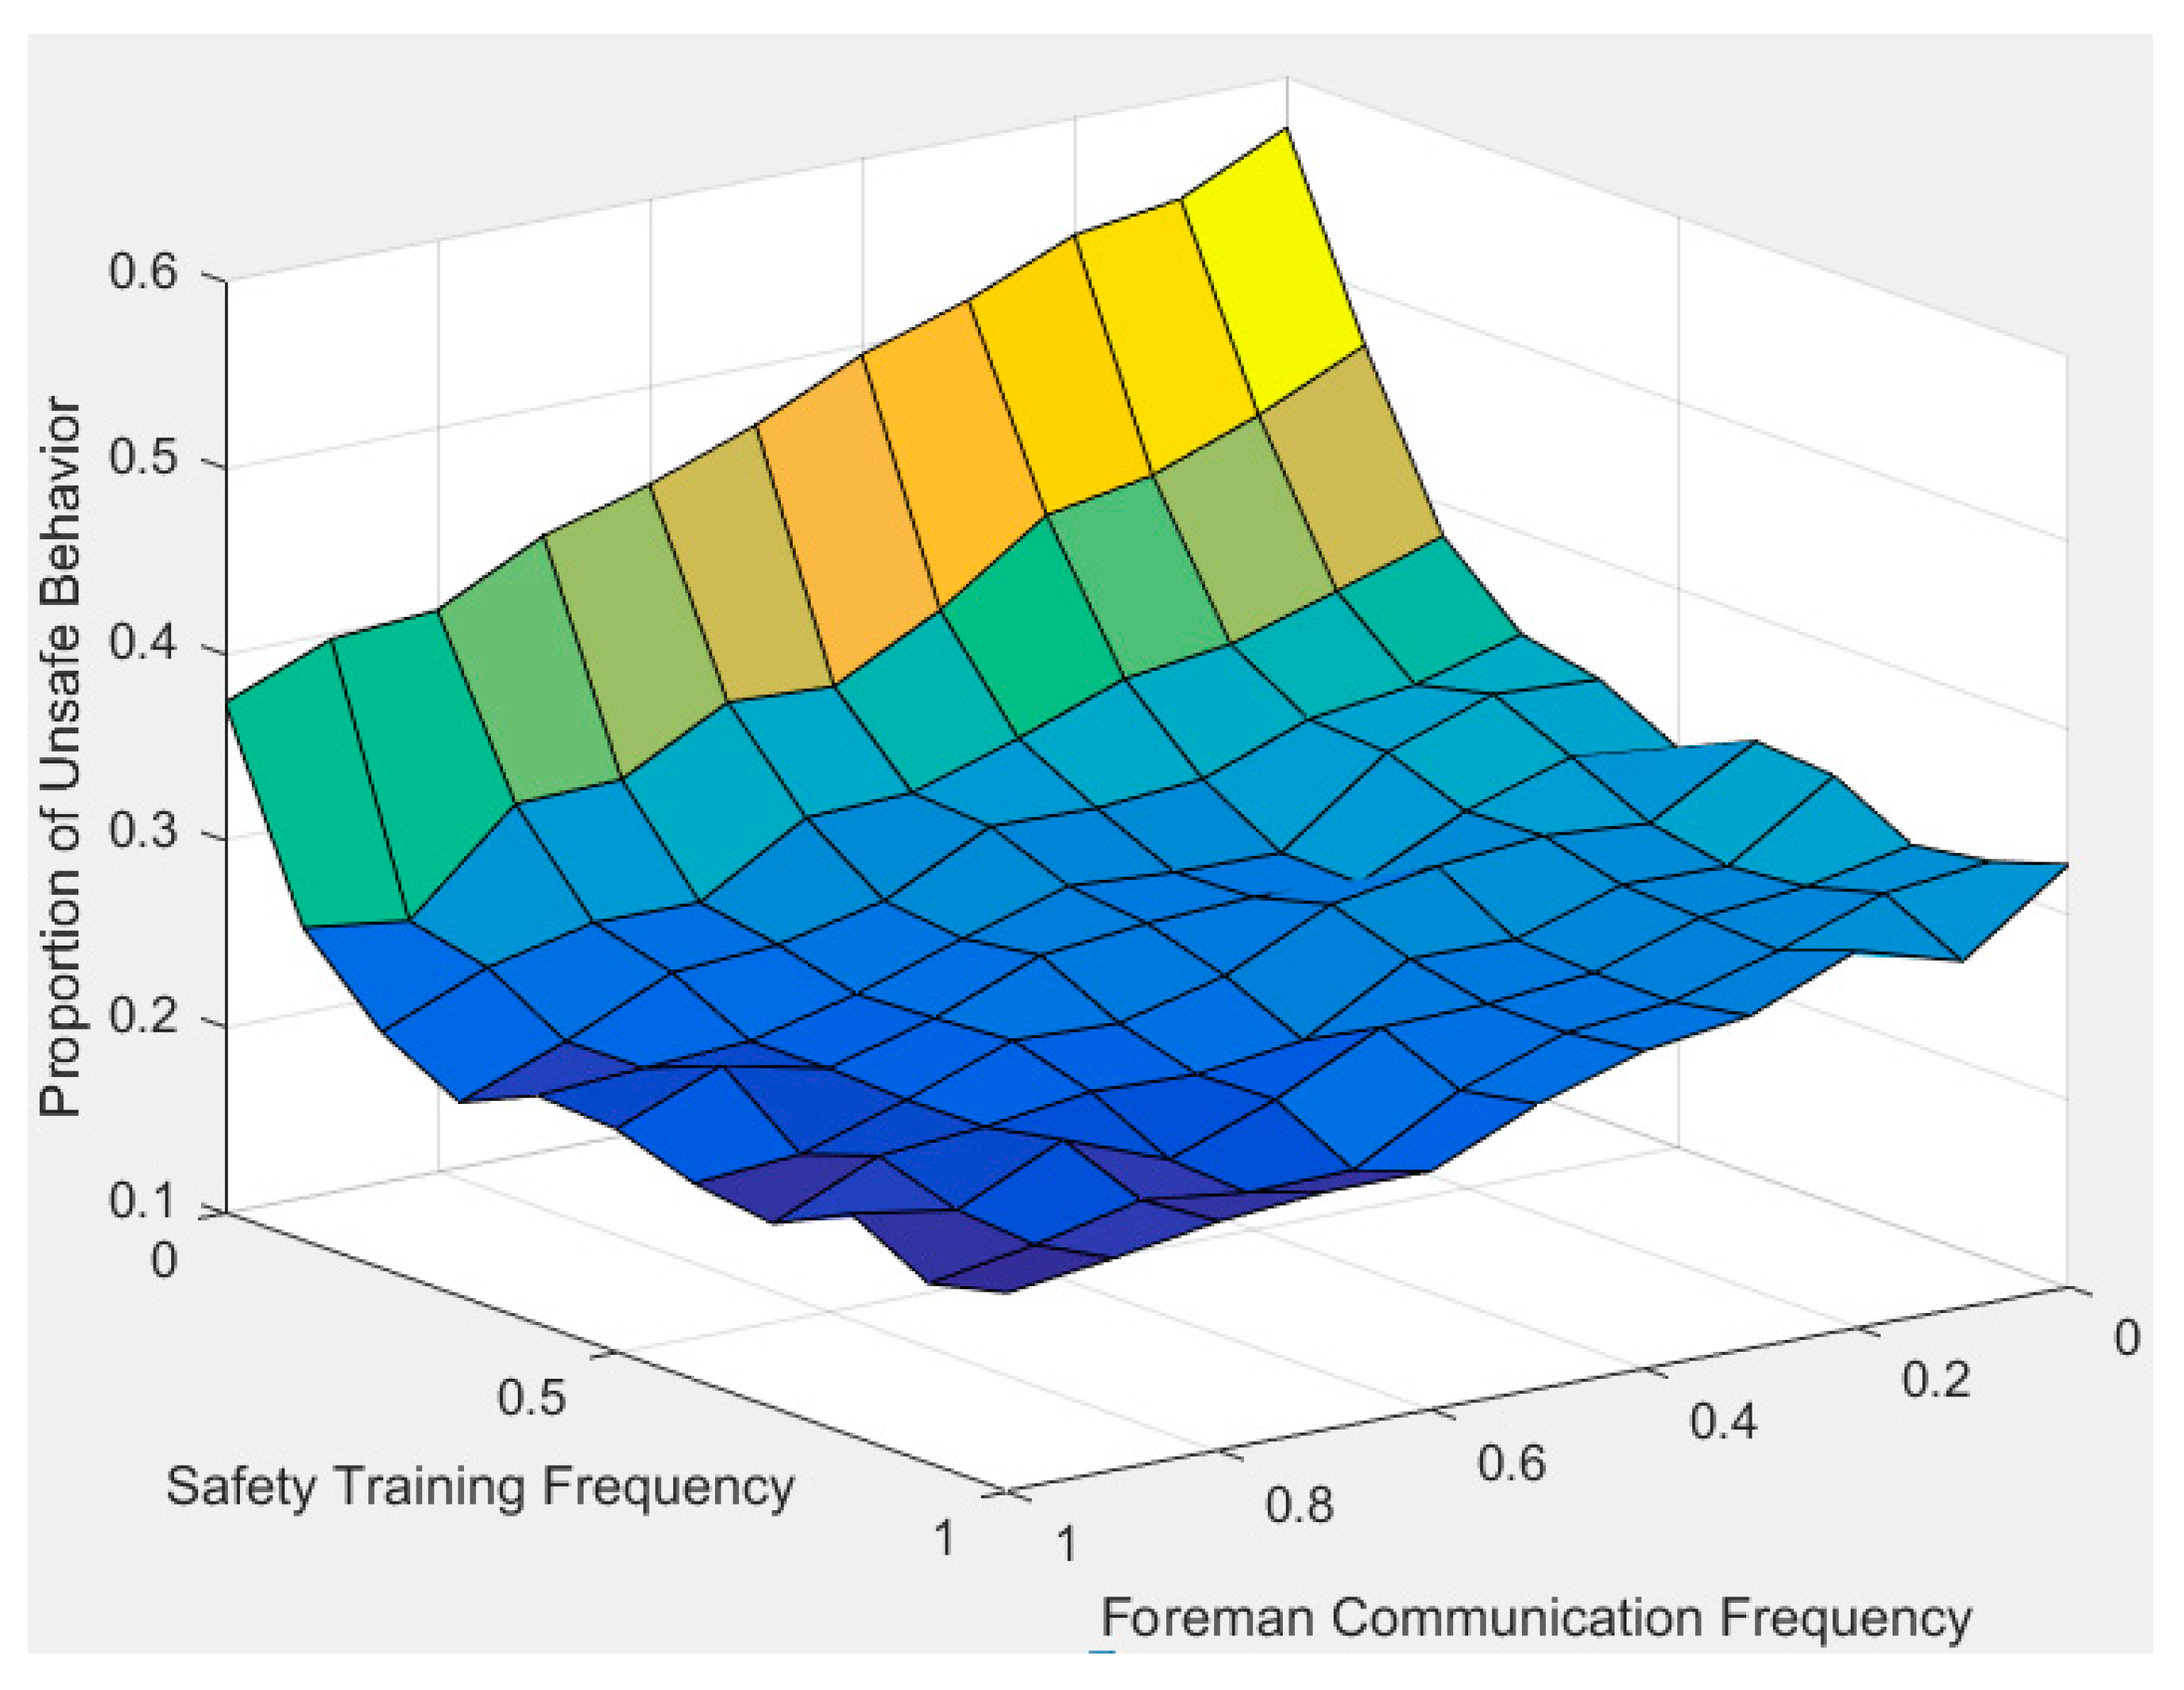
4.5. Analysis of Paired Social Organizational Influence
5. Discussion
5.1. Implications of Social Group on Workers’ Unsafe Behavior
5.2. Sociocognitive Causes of Unsafe Behavior of Construction Workers
5.3. Effects of Social Identity on Safety Behavior
5.4. Effects of Safety Meeting and Safety Communication on Safety Behavior
5.5. Effects of Behavior Feedback on Safety Behavior
5.6. The Practical Significance of the Model
5.7. Limitation and Future Work
6. Conclusions
Author Contributions
Funding
Acknowledgments
Conflicts of Interest
References
- Fang, D.; Zhao, C.; Zhang, M. A cognitive model of construction workers’ unsafe behaviors. J. Constr. Eng. Manag. 2016, 142, 1118. [Google Scholar] [CrossRef]
- Khosravi, Y.; Asilian-Mahabadi, H.; Hajizadeh, E.; Hassanzadeh-Rangi, N.; Bastani, H.; Behzadan, A.H. Factors influencing unsafe behaviors and accidents on construction sites: A review. Int. J. Occup. Saf. Ergon. 2014, 20, 111–125. [Google Scholar] [CrossRef] [PubMed]
- Occupational Safety and Health Administration, Fatal Occupational Injuries Counts and Rates by Selected Industries. Available online: https://www.bls.gov/news.release/cfoi.t04.htm (accessed on 31 December 2019).
- U.K. Office for National Statistics, Employees and Self-employed by Industry. Available online: https://www.ons.gov.uk/employmentandlabourmarket/peopleinwork/employmentandemployeetypes/datasets/employeesandselfemployedbyindustryemp14 (accessed on 15 December 2019).
- U.K. Health and Safety Executive, Fatal Injuries Arising From Accidents at Work in Great Britain 2017. Available online: http://www.hse.gov.uk/statistics/pdf/fatalinjuries.pdf (accessed on 15 December 2019).
- Ministry of Emergency Management of the People’s Republic of China, Circular of the State Council’s Office of the Security Council on the State of Work Safety in the Construction Industry in the First Half of 2018. Available online: https://www.mem.gov.cn/gk/tzgg/tb/201807/t20180725_230568.shtml (accessed on 31 December 2019).
- Salminen, S.; Tallberg, T. Human errors in fatal and serious occupational accidents in finland. Ergonomics 1996, 39, 980–988. [Google Scholar] [CrossRef] [PubMed]
- Li, H.; Li, X.; Luo, X.; Siebert, J. Investigation of the causality patterns of non-helmet use behavior of construction workers. Autom. Constr. 2017, 80, 95–103. [Google Scholar] [CrossRef]
- Heinrich, H.W.; Petersen, D.; Roos, N. Industrial Accident Prevention; McGraw-Hill Book Company: New York, NY, USA, 1950. [Google Scholar]
- Suraji, A.; Duff, A.R.; Peckitt, S.J. Development of causal model of construction accident causation. J. Constr. Eng. Manag.-Asce 2001, 127, 337–344. [Google Scholar] [CrossRef]
- Fang, D.; Wu, H. Development of a Safety Culture Interaction (SCI) model for construction projects. Saf. Sci. 2013, 57, 138–149. [Google Scholar] [CrossRef]
- Torner, M.; Pousette, A. Safety in construction—A comprehensive description of the characteristics of high safety standards in construction work, from the combined perspective of supervisors and experienced workers. J. Saf. Res. 2009, 40, 399–409. [Google Scholar] [CrossRef]
- Pandit, B.; Albert, A.; Patil, Y.; Al-Bayati, A.J. Fostering safety communication among construction workers: Role of safety climate and crew-level cohesion. Int. J. Environ. Res. Public Health 2019, 16. [Google Scholar] [CrossRef]
- Mitropoulos, P.; Cupido, G.; Namboodiri, M. Cognitive Approach to Construction Safety: Task Demand-Capability Model. J. Constr. Eng. Manag. 2009, 135, 881–889. [Google Scholar] [CrossRef]
- Zhang, M.; Fang, D. A cognitive analysis of why Chinese scaffolders do not use safety harnesses in construction. Constr. Manag. Econ. 2013, 31, 207–222. [Google Scholar] [CrossRef]
- Kines, P. Case studies of occupational falls from heights: Cognition and behavior in context. J. Saf. Res. 2003, 34, 263–271. [Google Scholar] [CrossRef]
- Chang, Y.H.J.; Mosleh, A. Cognitive modeling and dynamic probabilistic simulation of operating crew response to complex system accidents. Part 1: Overview of the IDAC Model. Reliab. Eng. Syst. Saf. 2007, 92, 997–1013. [Google Scholar] [CrossRef]
- Hollands, J.; Wickens, C.D. Engineering Psychology and Human Performance; Prentice Hallupper Saddle Rivernj: Upper Saddle River, NJ, USA, 1999. [Google Scholar]
- Rasmussen, J. Information Processing and Human-Machine Inter-Action. An Approach to Cognitive Engineering; Elsevier: Amsterdam, The Netherlands, 1987. [Google Scholar]
- Wang, Y.; Chong, H.Y.; Liao, P.C.; Ren, H. Interactive mechanism of working environments and construction behaviors with cognitive work analysis: An elevator installation case study. Int. J. Occup. Saf. Ergon. 2017, 1–15, 1408. [Google Scholar] [CrossRef]
- Choudhry, R.M.; Fang, D. Why operatives engage in unsafe work behavior: Investigating factors on construction sites. Saf. Sci. 2008, 46, 566–584. [Google Scholar] [CrossRef]
- Lombardi, D.A.; Verma, S.K.; Brennan, M.J.; Perry, M.J. Factors influencing worker use of personal protective eyewear. Accid. Anal. Prev. 2009, 41, 755–762. [Google Scholar] [CrossRef]
- Uwakweh, B.O. Effect of foremen on construction apprentice. J. Constr. Eng. Manag.-Asce 2005, 131, 1320–1327. [Google Scholar] [CrossRef]
- Grill, M.; Nielsen, K. Promoting and impeding safety—A qualitative study into direct and indirect safety leadership practices of constructions site managers. Saf. Sci. 2019, 114, 148–159. [Google Scholar] [CrossRef]
- Chiaburu, D.S.; Harrison, D.A. Do peers make the place? Conceptual synthesis and meta-analysis of coworker effects on perceptions, attitudes, OCBs, and performance. J. Appl. Psychol. 2008, 93, 1082–1103. [Google Scholar] [CrossRef]
- Zhang, P.; Li, N.; Jiang, Z.; Fang, D.; Anumba, C.J. An agent-based modeling approach for understanding the effect of worker-management interactions on construction workers’ safety-related behaviors. Autom. Constr. 2019, 97, 29–43. [Google Scholar] [CrossRef]
- Kaskutas, V.; Dale, A.M.; Lipscomb, H.; Evanoff, B. Fall prevention and safety communication training for foremen: Report of a pilot project designed to improve residential construction safety. J. Saf. Res. 2013, 44, 111–118. [Google Scholar] [CrossRef] [PubMed]
- Chang, J.H.; Han, S.; AbouRizk, S.M.; Kanerva, J. Stratified statistical analysis for effectiveness evaluation of frontline worker safety intervention: Case study of construction steel fabrication. Saf. Sci. 2019, 115, 89–102. [Google Scholar] [CrossRef]
- Low, B.K.L.; Man, S.S.; Chan, A.H.S.; Alabdulkarim, S. Construction worker risk-taking behavior model with individual and organizational factors. Int. J. Environ. Res. Public Health 2019, 16. [Google Scholar] [CrossRef] [PubMed]
- Jiang, Z.M.; Fang, D.P.; Zhang, M.C. Understanding the Causation of Construction Workers’ Unsafe Behaviors Based on System Dynamics Modeling. J. Manag. Eng. 2015, 31, 14. [Google Scholar] [CrossRef]
- Chang, Y.H.J.; Mosleh, A. Cognitive modeling and dynamic probabilistic simulation of operating crew response to complex system accidents. Part 5: Dynamic probabilistic simulation of the IDAC model. Reliab. Eng. Syst. Saf. 2007, 92, 1076–1101. [Google Scholar] [CrossRef]
- Bruch, E.; Atwell, J. Agent-Based Models in Empirical Social Research. Sociol. Methods Res. 2015, 44, 186–221. [Google Scholar] [CrossRef]
- Macal, C.M.; North, M.J. Tutorial on agent-based modelling and simulation. J. Simul. 2010, 4, 151–162. [Google Scholar] [CrossRef]
- Weimer, C.W.; Miller, J.O.; Hill, R.R. Agent-based modeling: An introduction and primer. In Proceedings of the 2016 Winter Simulation Conference, Arlington, VA, USA, 11–14 December 2016; pp. 65–79. [Google Scholar]
- Brown, C. Cognitive Psychology; Elsevier: Amsterdam, The Netherlands, 2007; pp. 1–223. [Google Scholar] [CrossRef]
- Sawacha, E.; Naoum, S.; Fong, D. Factors affecting safety performance on construction sites. Int. J. Proj. Manag. 1999, 17, 309–315. [Google Scholar] [CrossRef]
- Wang, J.Y.; Zou, P.X.W.; Li, P.P. Critical factors and paths influencing construction workers’ safety risk tolerances. Accid. Anal. Prev. 2016, 93, 267–279. [Google Scholar] [CrossRef]
- Ajzen, I. The theory of planned behavior. Organ. Behav. Hum. Decis. Process. 1991, 50, 179–211. [Google Scholar] [CrossRef]
- Choi, B.; Lee, S. An Empirically Based Agent-Based Model of the Sociocognitive Process of Construction Workers’ Safety Behavior. J. Constr. Eng. Manag. 2018, 144. [Google Scholar] [CrossRef]
- Goles, T.; Jayatilaka, B.; George, B.; Parsons, L.; Chambers, V.; Taylor, D.; Brune, R. Softlifting: Exploring determinants of attitude. J. Bus. Ethics 2008, 77, 481–499. [Google Scholar] [CrossRef]
- Geller, E.S. IF ONLY MORE WOULD ACTIVELY CARE. J. Appl. Behav. Anal. 1991, 24, 607–612. [Google Scholar]
- Liang, H.K.; Lin, K.Y.; Zhang, S.J.; Su, Y.K. The Impact of Coworkers’ Safety Violations on an Individual Worker: A Social Contagion Effect within the Construction Crew. Int. J. Environ. Res. Public Health 2018, 15, 773. [Google Scholar] [CrossRef]
- Kines, P.; Andersen, L.P.S.; Spangenberg, S.; Mikkelsen, K.L.; Dyreborg, J.; Zohar, D. Improving construction site safety through leader-based verbal safety communication. J. Saf. Res. 2010, 41, 399–406. [Google Scholar] [CrossRef]
- Cheung, Z.; Hight, R.; Hurley, F.; McKoon-Schultz, K. Keys to success and safety for the construction foreman: An ergonomic approach to cost reduction. Appl. Occup. Environ. Hyg. 2002, 17, 661–663. [Google Scholar] [CrossRef]
- Skeepers, N.C.; Mbohwa, C. A study on the leadership behaviour, safety leadership and safety performance in the construction industry in South Africa. In Proceedings of the Industrial Engineering and Service Science IESS 2015, Yogyakarta, Indonesia, 1–2 September 2015; Pujawan, N., Ciptomulyono, U., Baihaqi, I., Santosa, B., Eds.; Elsevier Science Bv: Amsterdam, The Netherlands, 2015; Volume 4, pp. 10–16. [Google Scholar]
- Goh, Y.M.; Ubeynarayana, C.U.; Wong, K.L.X.; Guo, B.H.W. Factors influencing unsafe behaviors: A supervised learning approach. Accid. Anal. Prev. 2018, 118, 77–85. [Google Scholar] [CrossRef]
- Cameron, I.; Duff, R. A critical review of safety initiatives using goal setting and feedback. Constr. Manag. Econ. 2007, 25, 495–508. [Google Scholar] [CrossRef]
- Tam, C.M.; Zeng, S.X.; Deng, Z.M. Identifying elements of poor construction safety management in China. Saf. Sci. 2004, 42, 569–586. [Google Scholar] [CrossRef]
- Liang, H.; Zhang, S. Impact of supervisors’ safety violations on an individual worker within a construction crew. Saf. Sci. 2019, 120, 679–691. [Google Scholar] [CrossRef]
- Probst, T.M. Safety and insecurity: Exploring the moderating effect of organizational safety climate. J. Occup. Health Psychol. 2004, 9, 3–10. [Google Scholar] [CrossRef] [PubMed]
- Griffin, M.A.; Neal, A. Perceptions of safety at work: A framework for linking safety climate to safety performance, knowledge, and motivation. J. Occup. Health Psychol. 2000, 5, 347–358. [Google Scholar] [CrossRef]
- Fang, D.P.; Wu, C.L.; Wu, H.J. Impact of the Supervisor on Worker Safety Behavior in Construction Projects. J. Manag. Eng. 2015, 31, 12. [Google Scholar] [CrossRef]
- Wachter, J.K.; Yorio, P.L. A system of safety management practices and worker engagement for reducing and preventing accidents: An empirical and theoretical investigation. Accid. Anal. Prev. 2014, 68, 117–130. [Google Scholar] [CrossRef] [PubMed]
- Cigularov, K.P.; Chen, P.Y.; Rosecrance, J. The effects of error management climate and safety communication on safety: A multi-level study. Accid. Anal. Prev. 2010, 42, 1498–1506. [Google Scholar] [CrossRef] [PubMed]
- Chmutina, K.; Rose, J. Building resilience: Knowledge, experience and perceptions among informal construction stakeholders. Int. J. Disaster Risk Reduct. 2018, 28, 158–164. [Google Scholar] [CrossRef]
- Choi, B.; Ahn, S.; Lee, S.H. Role of Social Norms and Social Identifications in Safety Behavior of Construction Workers. I: Theoretical Model of Safety Behavior under Social Influence. J. Constr. Eng. Manag. 2017, 143, 13. [Google Scholar] [CrossRef]
- Badham, J. An Introduction to Agent-Based Modeling: Modeling Natural, Social, and Engineered Complex Systems with NETLogo. Jasss 2015, 18, 3. [Google Scholar]
- Sawhney, A.; Bashford, H.; Walsh, K.; Mulky, A.R. Agent-Based Modeling and Simulation in Construction; Ieee: New York, NY, USA, 2003; pp. 1541–1547. [Google Scholar] [CrossRef]
- Kim, K.; Kim, K.J. Multi-agent-based simulation system for construction operations with congested flows. Autom. Constr. 2010, 19, 867–874. [Google Scholar] [CrossRef]
- Ahn, S.; Lee, S.; Steel, R.P. Effects of Workers’ Social Learning: Focusing on Absence Behavior. J. Constr. Eng. Manag. 2013, 139, 1015–1025. [Google Scholar] [CrossRef]
- Goh, Y.M.; Ali, M.J.A. A hybrid simulation approach for integrating safety behavior into construction planning: An earthmoving case study. Accid. Anal. Prev. 2016, 93, 310–318. [Google Scholar] [CrossRef] [PubMed]
- Sharpanskykh, A.; Stroeve, S.H. An agent-based approach for structured modeling, analysis and improvement of safety culture. Comput. Math. Organ. Theory 2011, 17, 77–117. [Google Scholar] [CrossRef]
- Ji, T.T.; Wei, H.H.; Cheng, J.Y. Understanding the effect of co-worker support on construction safety performance from the perspective of risk theory: An agent-based modeling approach. J. Civ. Eng. Manag. 2019, 25, 132–144. [Google Scholar] [CrossRef]
- Ahmad, M.W.; Mourshed, M.; Yuce, B.; Rezgui, Y. Computational intelligence techniques for HVAC systems: A review. Build. Simul. 2016, 9, 359–398. [Google Scholar] [CrossRef]
- Thompson, R.C.; Hilton, T.F.; Wilt, L.A. Where the safety rubber meets the shop floor: A confirmatory model of management influence on workplace safety. J. Saf. Res. 1998, 29, 15–24. [Google Scholar] [CrossRef]
- Reason, J. Modelling the basic error tendencies of human operators. Reliab. Eng. Syst. Saf. 1988, 22, 137–153. [Google Scholar] [CrossRef]
- Cordell, D.M. Risk tolerance in two dimensions. J. Financ. Plan. 2002, 15, 30–35. [Google Scholar]
- Zohar, D.; Luria, G. The use of supervisory practices as leverage to improve safety behavior: A cross-level intervention model. J. Saf. Res. 2003, 34, 567–577. [Google Scholar] [CrossRef]
- Lu, M.; Cheung, C.M.; Li, H.; Hsu, S.C. Understanding the relationship between safety investment and safety performance of construction projects through agent-based modeling. Accid. Anal. Prev. 2016, 94, 8–17. [Google Scholar] [CrossRef]
- Raviv, G.; Fishbain, B.; Shapira, A. Analyzing risk factors in crane-related near-miss and accident reports. Saf. Sci. 2017, 91, 192–205. [Google Scholar] [CrossRef]
- Shin, M.; Lee, H.S.; Park, M.; Moon, M.; Han, S. A system dynamics approach for modeling construction workers’ safety attitudes and behaviors. Accid. Anal. Prev. 2014, 68, 95–105. [Google Scholar] [CrossRef] [PubMed]
- Liang, H.K.; Lin, K.Y.; Zhang, S.J. Understanding the Social Contagion Effect of Safety Violations within a Construction Crew: A Hybrid Approach Using System Dynamics and Agent-Based Modeling. Int. J. Environ. Res. Public Health 2018, 15, 2696. [Google Scholar] [CrossRef] [PubMed]
- Ormerod, P.; Rosewell, B. Validation and Verification of Agent-Based Models in the Social Sciences. In Epistemological Aspects of Computer Simulation in the Social Sciences; Squazzoni, F., Ed.; Springer: Berlin, Germany, 2009; Volume 5466, pp. 130–140. [Google Scholar]
- Sargent, R.G.; IEEE. Verification and Validation of Simulation models. In Proceedings of the 2009 Winter Simulation Conference, IEEE, New York, NY, USA, 13–16 December 2009; pp. 162–176. [Google Scholar] [CrossRef]
- Axtell, R.L.; Epstein, J.M. Agent-based modeling: Understanding our creations. Bull. St. Fe Inst. 1994, 9, 28–32. [Google Scholar]
- Ahn, S.; Lee, S. Methodology for Creating Empirically Supported Agent-Based Simulation with Survey Data for Studying Group Behavior of Construction Workers. J. Constr. Eng. Manag. 2015, 141, 9. [Google Scholar] [CrossRef]
- Rodriguez-Lujan, I.; Huerta, R.; Elkan, C.; Cruz, C.S. Quadratic programming feature selection. J. Mach. Learn. Res. 2010, 11, 1491–1516. [Google Scholar]
- Mu, Y.; Liu, X.; Wang, L. A Pearson’s correlation coefficient based decision tree and its parallel implementation. Inf. Sci. 2018, 435, 40–58. [Google Scholar] [CrossRef]
- Sa, J.; Seo, D.C.; Choi, S.D. Comparison of risk factors for falls from height between commercial and residential roofers. J. Saf. Res. 2009, 40, 1–6. [Google Scholar] [CrossRef]
- Industry Injury and Illness Data, Table 1-Incidence Rates-Detailed Industry Level-2016. Available online: https://www.bls.gov/iif/oshsum.htm (accessed on 2 September 2019).
- Zohar, D. The effects of leadership dimensions, safety climate, and assigned priorities on minor injuries in work groups. J. Organ. Behav. 2002, 23, 75–92. [Google Scholar] [CrossRef]
- Bandura, A. Social-Learning Theory of aggression. J. Commun. 1978, 28, 12–29. [Google Scholar] [CrossRef]
- Bruk-Lee, V.; Spector, P.E. The social stressors-counterproductive work behaviors link: Are conflicts with supervisors and coworkers the same? J. Occup. Health Psychol. 2006, 11, 145–156. [Google Scholar] [CrossRef]
- Casper, A.; Tremmel, S.; Sonnentag, S. The power of affect: A three-wave panel study on reciprocal relationships between work events and affect at work. J. Occup. Organ. Psychol. 2019, 92, 436–460. [Google Scholar] [CrossRef]
- Kulkarni, V.S.; Devalkar, R.V. Postural analysis of building construction workers using ergonomics. Int. J. Constr. Manag. 2019, 19, 464–471. [Google Scholar] [CrossRef]
- Chung, Y.S. Seemingly irrational driving behavior model: The effect of habit strength and anticipated affective reactions. Accid. Anal. Prev. 2015, 82, 79–89. [Google Scholar] [CrossRef]
- Yin, X.; Wang, H.; Yin, P.; Zhu, H. Agent-based opinion formation modeling in social network: A perspective of social psychology. Phys. A Stat. Mech. Appl. 2019, 532, 121786. [Google Scholar] [CrossRef]
- Smith, J.R.; Louis, W.R. Do as we say and as we do: The interplay of descriptive and injunctive group norms in the attitude-behaviour relationship. Br. J. Soc. Psychol. 2008, 47, 647–666. [Google Scholar] [CrossRef] [PubMed]
- Hogg, M.A.; Reid, S.A. Social identity, self-categorization, and the communication of group norms. Commun. Theory 2006, 16, 7–30. [Google Scholar] [CrossRef]
- Tanis, M.; Postmes, T. Short Communication—A social identity approach to trust: Interpersonal perception, group membership and trusting behaviour. Eur. J. Soc. Psychol. 2005, 35, 413–424. [Google Scholar] [CrossRef]
- Seyranian, V. Social identity framing communication strategies for mobilizing social change. Leadersh. Q. 2014, 25, 468–486. [Google Scholar] [CrossRef]
- Burke, M.J.; Sarpy, S.A.; Smith-Crowe, K.; Chan-Serafin, S.; Salvador, R.O.; Islam, G. Relative effectiveness of worker safety and health training methods. Am. J. Public Health 2006, 96, 315–324. [Google Scholar] [CrossRef]
- Burke, M.J.; Salvador, R.O.; Smith-Crowe, K.; Chan-Serafin, S.; Smith, A.; Sonesh, S. The Dread Factor: How Hazards and Safety Training Influence Learning and Performance. J. Appl. Psychol. 2011, 96, 46–70. [Google Scholar] [CrossRef]
- Borys, D. The role of safe work method statements in the Australian construction industry. Saf. Sci. 2012, 50, 210–220. [Google Scholar] [CrossRef]
- Marin, L.S.; Roelofs, C. Promoting Construction Supervisors’ Safety-Efficacy to Improve Safety Climate: Training Intervention Trial. J. Constr. Eng. Manag. 2017, 143, 9. [Google Scholar] [CrossRef]
- Wang, P.; Wu, P.; Wang, J.; Chi, H.L.; Wang, X.Y. A Critical Review of the Use of Virtual Reality in Construction Engineering Education and Training. Int. J. Environ. Res. Public Health 2018, 15, 1204. [Google Scholar] [CrossRef] [PubMed]
- Goedert, J.D.; Rokooei, S. Project-Based Construction Education with Simulations in a Gaming Environment. Int. J. Constr. Educ. Res. 2016, 12, 208–223. [Google Scholar] [CrossRef]
- Rhoton, W.W. A procedure to improve compliance with coal mine safety regulations. J. Organ. Behav. Manag. 1980, 2, 243–249. [Google Scholar] [CrossRef]
- Fellner, D.J.; Sulzer-Azaroff, B. Increasing industrial safety practices and conditions through posted feedback. J. Saf. Res. 1984, 15, 7–21. [Google Scholar] [CrossRef]
- Choudhry, R.M. Behavior-based safety on construction sites: A case study. Accid. Anal. Prev. 2014, 70, 14–23. [Google Scholar] [CrossRef]
- Chua, D.K.H.; Goh, Y.M. Incident causation model for improving feedback of safety knowledge. J. Constr. Eng. Manag. 2004, 130, 542–551. [Google Scholar] [CrossRef]
- Axelrod, R. Advancing the art of simulation in the social sciences. Complexity 1997, 3, 16–22. [Google Scholar] [CrossRef]


| Parameter | Value |
|---|---|
| Time | 280 |
| Number of working groups | 5 |
| Number of workers per working group | 20 |
| Actual risk | Triangular (0.1,0.5,0.9) |
| Workers’ initial attitude | U(0.4,0.9) |
| Workers’ initial risk understanding coefficient | U(0.6,1.2) |
| Workers’ initial safety awareness | 0.8 |
| Workers’ initial safety knowledge | 0.8 |
| Workers’ social identity | 0.5 |
| Weight of coworker norm | 0.2 |
| Weight of foreman norm | 0.45 |
| Weight of manager norm | 0.35 |
| The frequency at which the foreman gives workers positive feedback | 0.1 |
| The frequency at which the foreman gives workers negative feedback | 0.6 |
| The frequency at which the manager gives workers positive feedback | 0.1 |
| The frequency at which the manager gives workers negative feedback | 0.6 |
| The frequency of manager safety training | 0.5 |
| Frequency of communication between workers and coworkers | 0.3 |
| Frequency of communication between workers and foreman | 0.3 |
| The improvement in worker safety knowledge by manager safety training | 0.1 |
| The effect of manager safety training on workers’ safety awareness | 0.2 |
| The effect of communicating with coworkers to improve workers’ safety awareness | 0.01 |
| The effect of communicating with foreman to improve workers’ safety awareness | 0.2 |
| Influencing factors | Statistics | Safety Awareness | Safety Knowledge |
|---|---|---|---|
| Safety Communication | Pearson correlation | 0.705 ** | 0.690 ** |
| Significant (bilateral) | 0.000 | 0.000 | |
| N | 280 | 280 | |
| Safety Training | Pearson correlation | 0.735 ** | 0.743 ** |
| Significant (bilateral) | 0.000 | 0.000 | |
| N | 280 | 280 |
| Items | Simulation Results | Empirical Data |
|---|---|---|
| Ratio of unsafe behavior | 0.326 | 1/3 [11,79] |
| Ratio of near misses and accident | 9.47:1 | 300:30 [39] |
| Rate of accident | 3.35 | 3.2 [80] |
| Types | Unsafe Behavior Ratio | Accident Rate | ||
|---|---|---|---|---|
| Value | Increased from Baseline Model | Value | Increased from Baseline Model | |
| Excluding manager norm | 0.346 | 6.13% | 3.46% | 3.28% |
| Excluding coworker norm | 0.329 | 0.92% | 3.36% | 0.30% |
| Excluding foreman norm | 0.370 | 13.50% | 3.81% | 12.07% |
| Excluding demonstration role of foreman | 0.344 | 6.13% | 3.41% | 1.79% |
| Baseline Model | 0.326 | 3.35% | ||
| Parameter | Case 1 | Case 2 | Case 3 | Case 4 |
|---|---|---|---|---|
| AR | 0.480 | 0.439 | 0.439 | 0.439 |
| PR | 0 | 0.522 | 0.453 | 0.595 |
| UR | 0 | 0.343 | 0.573 | 0.478 |
| RA | 0.716 | 0.475 | 0.629 | 0.403 |
| UB | 1 | 1 | 1 | 0 |
| AT | 0.931 | 0.656 | 0.844 | 0.578 |
| WN | 0.596 | 0.471 | 0.457 | 0.305 |
| FN | 0.676 | 0.258 | 0.342 | 0.237 |
| MN | 0.228 | 0.239 | 0.486 | 0.150 |
| ST | 0 | 0 | 0 | 1 |
| FCN | 0 | 0 | 1 | 0 |
| KL | 0.832 | 0.841 | 1.107 | 1.134 |
| SA | 0.832 | 0.841 | 1.007 | 1.034 |
© 2020 by the authors. Licensee MDPI, Basel, Switzerland. This article is an open access article distributed under the terms and conditions of the Creative Commons Attribution (CC BY) license (http://creativecommons.org/licenses/by/4.0/).
Share and Cite
Ye, G.; Yue, H.; Yang, J.; Li, H.; Xiang, Q.; Fu, Y.; Cui, C. Understanding the Sociocognitive Process of Construction Workers’ Unsafe Behaviors: An Agent-Based Modeling Approach. Int. J. Environ. Res. Public Health 2020, 17, 1588. https://doi.org/10.3390/ijerph17051588
Ye G, Yue H, Yang J, Li H, Xiang Q, Fu Y, Cui C. Understanding the Sociocognitive Process of Construction Workers’ Unsafe Behaviors: An Agent-Based Modeling Approach. International Journal of Environmental Research and Public Health. 2020; 17(5):1588. https://doi.org/10.3390/ijerph17051588
Chicago/Turabian StyleYe, Gui, Hongzhe Yue, Jingjing Yang, Hongyang Li, Qingting Xiang, Yuan Fu, and Can Cui. 2020. "Understanding the Sociocognitive Process of Construction Workers’ Unsafe Behaviors: An Agent-Based Modeling Approach" International Journal of Environmental Research and Public Health 17, no. 5: 1588. https://doi.org/10.3390/ijerph17051588
APA StyleYe, G., Yue, H., Yang, J., Li, H., Xiang, Q., Fu, Y., & Cui, C. (2020). Understanding the Sociocognitive Process of Construction Workers’ Unsafe Behaviors: An Agent-Based Modeling Approach. International Journal of Environmental Research and Public Health, 17(5), 1588. https://doi.org/10.3390/ijerph17051588