Disparity in Risk Factor Severity for Early Childhood Blood Lead among Predominantly African-American Black Children: The 1999 to 2010 US NHANES


Abstract
1. Introduction
2. Materials and Methods
2.1. Study Sample
2.2. Blood Lead
2.3. Covariates
2.4. Statistical Analysis
3. Results
3.1. Descriptive Statistics and Missing Data
3.2. Full Multiple Regression Model
3.3. Risk Factors in Stratified Multiple Regression Models
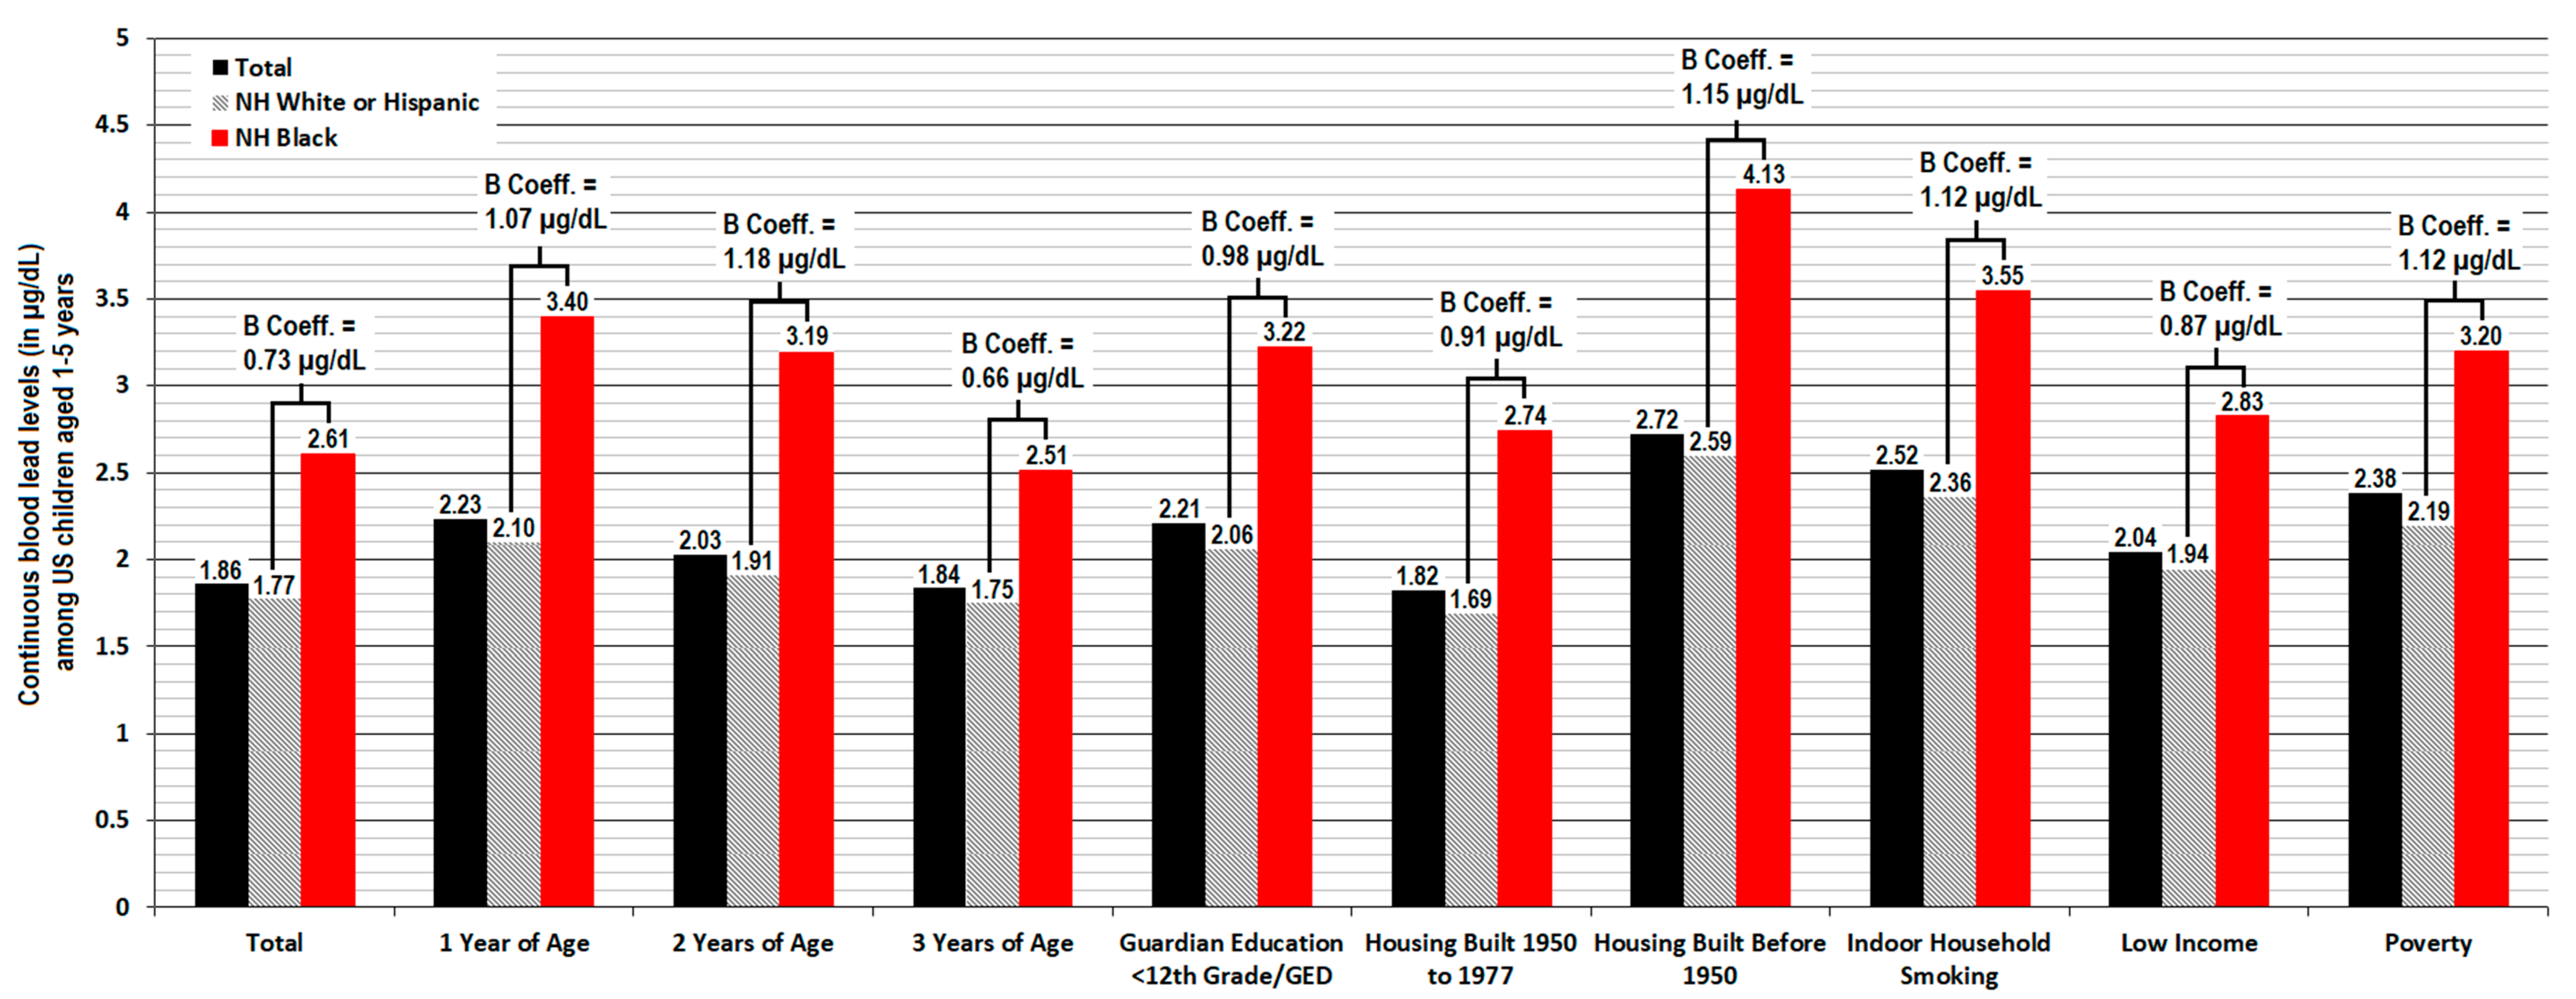
3.3.1. Continuous Blood Lead Level
3.3.2. Elevated Blood Lead Level
4. Discussion
4.1. Persistent Racial Disparity in Risk Factors
4.2. Safe Housing and Environmental Justice
4.3. Targeted Screening and Public Health Implications
4.4. Study Limitations and Interpretation
5. Conclusions
Supplementary Materials
Author Contributions
Funding
Conflicts of Interest
References
- Burns, M.S.; Gerstenberger, S.L. Implications of the new Centers for Disease Control and Prevention blood lead reference value. Am. J. Public Health 2014, 104, e27–e33. [Google Scholar] [CrossRef] [PubMed]
- American Academy of Pediatrics. Prevention of Childhood Lead Toxicity. Pediatrics 2016, 138, e20161493. [Google Scholar] [CrossRef] [PubMed]
- Sanders, T.; Liu, Y.; Buchner, V.; Tchounwou, P.B. Neurotoxic effects and biomarkers of lead exposure: A review. Rev. Environ. Health 2009, 24, 15–45. [Google Scholar] [CrossRef] [PubMed]
- Cecil, K.M.; Brubaker, C.J.; Adler, C.M.; Dietrich, K.N.; Altaye, M.; Egelhoff, J.C.; Wessel, S.; Elangovan, I.; Hornung, R.; Jarvis, K.; et al. Decreased brain volume in adults with childhood lead exposure. PLoS Med. 2008, 5, e112. [Google Scholar] [CrossRef] [PubMed]
- Dietrich, K.N.; Succop, P.A.; Berger, O.G.; Hammond, P.B.; Bornschein, R.L. Lead exposure and the cognitive development of urban preschool children: The Cincinnati Lead Study cohort at age 4 years. Neurotoxicol. Teratol. 1991, 13, 203–211. [Google Scholar] [CrossRef]
- Banks, E.C.; Ferretti, L.E.; Shucard, D.W. Effects of low level lead exposure on cognitive function in children: A review of behavioral, neuropsychological and biological evidence. Neurotoxicology 1997, 18, 237–281. [Google Scholar]
- Lanphear, B.P.; Dietrich, K.; Auinger, P.; Cox, C. Cognitive deficits associated with blood lead concentrations <10 microg/dL in US children and adolescents. Public Health Rep. 2000, 115, 521–529. [Google Scholar]
- Chiodo, L.M.; Covington, C.; Sokol, R.J.; Hannigan, J.H.; Jannise, J.; Ager, J.; Greenwald, M.; Delaney-Black, V. Blood lead levels and specific attention effects in young children. Neurotoxicol. Teratol. 2007, 29, 538–546. [Google Scholar] [CrossRef]
- Bellinger, D.C. Very low lead exposures and children’s neurodevelopment. Curr. Opin. Pediatrics 2008, 20, 172–177. [Google Scholar] [CrossRef]
- Bao, Q.S.; Lu, C.Y.; Song, H.; Wang, M.; Ling, W.; Chen, W.Q.; Deng, X.Q.; Hao, Y.T.; Rao, S. Behavioural development of school-aged children who live around a multi-metal sulphide mine in Guangdong province, China: A cross-sectional study. BMC Public Health 2009, 9, 217. [Google Scholar] [CrossRef]
- Senut, M.C.; Cingolani, P.; Sen, A.; Kruger, A.; Shaik, A.; Hirsch, H.; Suhr, S.T.; Ruden, D. Epigenetics of early-life lead exposure and effects on brain development. Epigenomics 2012, 4, 665–674. [Google Scholar] [CrossRef]
- Searle, A.K.; Baghurst, P.A.; van Hooff, M.; Sawyer, M.G.; Sim, M.R.; Galletly, C.; Clark, L.S.; McFarlane, A.C. Tracing the long-term legacy of childhood lead exposure: A review of three decades of the Port Pirie cohort study. Neurotoxicology 2014, 43, 46–56. [Google Scholar] [CrossRef] [PubMed]
- Shah-Kulkarni, S.; Ha, M.; Kim, B.M.; Kim, E.; Hong, Y.C.; Park, H.; Kim, Y.; Kim, B.N.; Chang, N.; Oh, S.Y.; et al. Neurodevelopment in early childhood affected by prenatal lead exposure and iron intake. Medicine 2016, 95, 2508. [Google Scholar] [CrossRef] [PubMed]
- Vorvolakos, T.; Arseniou, S.; Samakouri, M. There is no safe threshold for lead exposure: Alpha literature review. Psychiatriki 2016, 27, 204–214. [Google Scholar] [CrossRef] [PubMed]
- Lanphear, B.P.; Hornung, R.; Khoury, J.; Yolton, K.; Baghurst, P.; Bellinger, D.C.; Canfield, R.L.; Dietrich, K.N.; Bornschein, R.; Greene, T.; et al. Low-level environmental lead exposure and children’s intellectual function: An international pooled analysis. Environ. Health Perspect. 2005, 113, 894–899. [Google Scholar] [CrossRef] [PubMed]
- Crump, K.S.; Van Landingham, C.; Bowers, T.S.; Cahoy, D.; Chandalia, J.K. A statistical reevaluation of the data used in the Lanphear et al. (2005) pooled-analysis that related low levels of blood lead to intellectual deficits in children. Crit. Rev. Toxicol. 2013, 43, 785–799. [Google Scholar] [CrossRef]
- Remy, S.; Hambach, R.; Van Sprundel, M.; Teughels, C.; Nawrot, T.S.; Buekers, J.; Cornelis, C.; Bruckers, L.; Schoeters, G. Intelligence gain and social cost savings attributable to environmental lead exposure reduction strategies since the year 2000 in Flanders, Belgium. Environ. Health 2019, 18, 113. [Google Scholar] [CrossRef]
- He, J.; Ning, H.; Huang, R. Low blood lead levels and attention-deficit hyperactivity disorder in children: A systematic review and meta-analysis. Environ. Sci. Pollut. Res. Int. 2019, 26, 17875–17884. [Google Scholar] [CrossRef]
- Mielke, H.W.; Reagan, P.L. Soil is an important pathway of human lead exposure. Environ. Health Perspect. 1998, 106 (Suppl. 1), 217–229. [Google Scholar]
- Kokori, H.; Giannakopoulou, C.; Paspalaki, P.; Tsatsakis, A.; Sbyrakis, S. An anaemic infant in a coma. Lancet 1998, 352, 284. [Google Scholar] [CrossRef]
- Talbot, A.; Lippiatt, C.; Tantry, A. Lead in a case of encephalopathy. BMJ Case Rep. 2018, 2018. [Google Scholar] [CrossRef]
- Yabe, J.; Nakayama, S.M.; Nakata, H.; Toyomaki, H.; Yohannes, Y.B.; Muzandu, K.; Kataba, A.; Zyambo, G.; Hiwatari, M.; Narita, D.; et al. Current trends of blood lead levels, distribution patterns and exposure variations among household members in Kabwe, Zambia. Chemosphere 2020, 243, 125412. [Google Scholar] [CrossRef]
- Rosen, M.B.; Pokhrel, L.R.; Weir, M.H. A discussion about public health, lead and Legionella pneumophila in drinking water supplies in the United States. Sci. Total Environ. 2017, 590–591, 843–852. [Google Scholar] [CrossRef] [PubMed]
- Mahaffey, K.R.; Annest, J.L.; Roberts, J.; Murphy, R.S. National estimates of blood lead levels: United States, 1976-1980: Association with selected demographic and socioeconomic factors. N. Engl. J. Med. 1982, 307, 573–579. [Google Scholar] [CrossRef] [PubMed]
- Pirkle, J.L.; Brody, D.J.; Gunter, E.W.; Kramer, R.A.; Paschal, D.C.; Flegal, K.M.; Matte, T.D. The decline in blood lead levels in the United States. The National Health and Nutrition Examination Surveys (NHANES). JAMA 1994, 272, 284–291. [Google Scholar] [CrossRef] [PubMed]
- Meyer, P.A.; Pivetz, T.; Dignam, T.A.; Homa, D.M.; Schoonover, J.; Brody, D. Surveillance for elevated blood lead levels among children—United States, 1997–2001. MMWR Surveill. Summ. 2003, 52, 1–21. [Google Scholar] [PubMed]
- Jones, R.L.; Homa, D.M.; Meyer, P.A.; Brody, D.J.; Caldwell, K.L.; Pirkle, J.L.; Brown, M.J. Trends in blood lead levels and blood lead testing among US children aged 1 to 5 years, 1988–2004. Pediatrics 2009, 123, e376–e385. [Google Scholar] [CrossRef] [PubMed]
- Centers for Disease Control. Blood lead levels in children aged 1-5 years - United States, 1999–2010. MMWR Morb. Mortal. Wkly. Rep. 2013, 62, 245–248. [Google Scholar]
- Hwang, Y.H.; Hsiao, C.K.; Lin, P.W. Globally temporal transitions of blood lead levels of preschool children across countries of different categories of Human Development Index. Sci. Total Environ. 2019, 659, 1395–1402. [Google Scholar] [CrossRef]
- Cantor, A.G.; Hendrickson, R.; Blazina, I.; Griffin, J.; Grusing, S.; McDonagh, M.S. Screening for elevated blood lead levels in childhood and pregnancy: Updated evidence report and systematic review for the US Preventive Services Task Force. JAMA 2019, 321, 1510–1526. [Google Scholar] [CrossRef]
- Etchevers, A.; Bretin, P.; Lecoffre, C.; Bidondo, M.L.; Le Strat, Y.; Glorennec, P.; Le Tertre, A. Blood lead levels and risk factors in young children in France, 2008–2009. Int. J. Hyg. Environ. Health 2014, 217, 528–537. [Google Scholar] [CrossRef] [PubMed]
- Kaplowitz, S.A.; Perlstadt, H.; D’Onofrio, G.; Melnick, E.R.; Baum, C.R.; Kirrane, B.M.; Post, L.A. The predictive value of self-report questions in a clinical decision rule for pediatric lead poisoning screening. Public Health Rep. 2012, 127, 375–382. [Google Scholar] [CrossRef] [PubMed]
- Kaplowitz, S.A.; Perlstadt, H.; Post, L.A. Comparing lead poisoning risk assessment methods: Census block group characteristics vs. zip codes as predictors. Public Health Rep. 2010, 125, 234–245. [Google Scholar] [CrossRef]
- Litaker, D.; Kippes, C.M.; Gallagher, T.E.; O’Connor, M.E. Targeting lead screening: The Ohio Lead Risk Score. Pediatrics 2000, 106, E69. [Google Scholar] [CrossRef] [PubMed]
- Lanphear, B.P.; Weitzman, M.; Winter, N.L.; Eberly, S.; Yakir, B.; Tanner, M.; Emond, M.; Matte, T.D. Lead-contaminated house dust and urban children’s blood lead levels. Am. J. Public Health 1996, 86, 1416–1421. [Google Scholar] [CrossRef] [PubMed]
- Centers for Disease Control. Preventing Lead Poisoning in Young Children—United States. 1991. Available online: www.cdc.gov/nceh/lead/publications/books/plpyc/contents.htm (accessed on 1 May 2017).
- Ossiander, E.M. A systematic review of screening questionnaires for childhood lead poisoning. J. Public Health Manag. Pract. 2013, 19, E21–E29. [Google Scholar] [CrossRef] [PubMed]
- White, B.M.; Bonilha, H.S.; Ellis, C., Jr. Racial/ethnic differences in childhood blood lead levels among children <72 months of age in the United States: A systematic review of the literature. J. Racial Ethn. Health Disparities 2016, 3, 145–153. [Google Scholar] [PubMed]
- Morrison, D.; Lin, Q.; Wiehe, S.; Liu, G.; Rosenman, M.; Fuller, T.; Wang, J.; Filippelli, G. Spatial relationships between lead sources and children’s blood lead levels in the urban center of Indianapolis (USA). Environ. Geochem. Health 2013, 35, 171–183. [Google Scholar] [CrossRef]
- Moody, H.A.; Darden, J.T.; Pigozzi, B.W. The relationship of neighborhood socioeconomic differences and racial residential segregation to childhood blood lead levels in metropolitan Detroit. J. Urban. Health 2016, 93, 820–839. [Google Scholar] [CrossRef]
- Roberts, E.M.; English, P.B. Analysis of multiple-variable missing-not-at-random survey data for child lead surveillance using NHANES. Stat. Med. 2016, 35, 5417–5429. [Google Scholar] [CrossRef]
- Melman, S.T.; Nimeh, J.W.; Anbar, R.D. Prevalence of elevated blood lead levels in an inner-city pediatric clinic population. Environ. Health Perspect. 1998, 106, 655–657. [Google Scholar] [CrossRef] [PubMed]
- Lanphear, B.P.; Hornung, R.; Ho, M. Screening housing to prevent lead toxicity in children. Public Health Rep. 2005, 120, 305–310. [Google Scholar] [CrossRef] [PubMed]
- Raymond, J.S.; Anderson, R.; Feingold, M.; Homa, D.; Brown, M.J. Risk for elevated blood lead levels in 3- and 4-year-old children. Matern. Child. Health J. 2009, 13, 40–47. [Google Scholar] [CrossRef] [PubMed]
- Ford, D.M.; Margaritis, V.; Mendelsohn, A.B. Characteristics of childhood lead poisoning among Tennessee children ages one to five years, 2009–2013. Public Health 2016, 136, 188–191. [Google Scholar] [CrossRef] [PubMed]
- Keller, B.; Faciano, A.; Tsega, A.; Ehrlich, J. Epidemiologic characteristics of children with blood lead levels ≥45 µg/dL. J. Pediatrics 2017, 180, 229–234. [Google Scholar] [CrossRef] [PubMed]
- Benson, S.M.; Talbott, E.O.; Brink, L.L.; Wu, C.; Sharma, R.K.; Marsh, G.M. Environmental lead and childhood blood lead levels in US children: NHANES, 1999–2006. Arch. Environ. Occup. Health 2017, 72, 70–78. [Google Scholar] [CrossRef] [PubMed]
- Moody, H.; Grady, S.C. Lead Emissions and Population Vulnerability in the Detroit (Michigan, USA) Metropolitan Area, 2006–2013: A Spatial and Temporal Analysis. Int. J. Environ. Res. Public Health 2017, 14, 1445. [Google Scholar] [CrossRef]
- Brown, M.J.; Raymond, J.; Homa, D.; Kennedy, C.; Sinks, T. Association between children’s blood lead levels, lead service lines, and water disinfection, Washington, DC, 1998–2006. Environ. Res. 2011, 111, 67–74. [Google Scholar] [CrossRef]
- Sadler, R.C.; LaChance, J.; Hanna-Attisha, M. Social and built environmental correlates of predicted blood lead levels in the Flint water crisis. Am. J. Public Health 2017, 107, 763–769. [Google Scholar] [CrossRef]
- Hanna-Attisha, M.; LaChance, J.; Sadler, R.C.; Champney Schnepp, A. Elevated blood lead levels in children associated with the Flint drinking water crisis: A spatial analysis of risk and public health response. Am. J. Public Health 2016, 106, 283–290. [Google Scholar] [CrossRef]
- Miranda, M.L.; Anthopolos, R.; Hastings, D. A geospatial analysis of the effects of aviation gasoline on childhood blood lead levels. Environ. Health Perspect. 2011, 119, 1513–1516. [Google Scholar] [CrossRef]
- Brink, L.L.; Talbott, E.O.; Sharma, R.K.; Marsh, G.M.; Wu, W.C.; Rager, J.R.; Strosnider, H.M. Do US ambient air lead levels have a significant impact on childhood blood lead levels: Results of a national study. J. Environ. Public Health 2013, 2013, 278042. [Google Scholar] [CrossRef] [PubMed]
- Wheeler, D.C.; Raman, S.; Jones, R.M.; Schootman, M.; Nelson, E.J. Bayesian deprivation index models for explaining variation in elevated blood lead levels among children in Maryland. Spat. Spatiotemporal. Epidemiol. 2019, 30, 100286. [Google Scholar] [CrossRef] [PubMed]
- Bailey, A.J.; Sargent, J.D.; Goodman, D.C.; Freeman, J.; Brown, M.J. Poisoned landscapes: The epidemiology of environmental lead exposure in Massachusetts children 1990-1991. Soc. Sci. Med. 1994, 39, 757–766. [Google Scholar] [CrossRef]
- Sargent, J.D.; Brown, M.J.; Freeman, J.L.; Bailey, A.; Goodman, D.; Freeman, D.H., Jr. Childhood lead poisoning in Massachusetts communities: Its association with sociodemographic and housing characteristics. Am. J. Public Health 1995, 85, 528–534. [Google Scholar] [CrossRef] [PubMed]
- Griffith, D.A.; Doyle, P.G.; Wheeler, D.C.; Johnson, D.L. A tale of two swaths: Urban childhood blood lead levels across Syracuse, New York. Ann. Assoc. Am. Geogr. 1998, 88, 640–665. [Google Scholar] [CrossRef]
- Lanphear, B.P.; Byrd, R.S.; Auinger, P.; Schaffer, S.J. Community characteristics associated with elevated blood lead levels in children. Pediatrics 1998, 101, 264–271. [Google Scholar] [CrossRef]
- Miranda, M.L.; Dolinoy, D.C.; Overstreet, M.A. Mapping for prevention: GIS models for directing childhood lead poisoning prevention programs. Environ. Health Perspect. 2002, 110, 947–953. [Google Scholar] [CrossRef]
- Haley, V.B.; Talbot, T.O. Geographic analysis of blood lead levels in New York State children born 1994–1997. Environ. Health Perspect. 2004, 112, 1577–1582. [Google Scholar] [CrossRef]
- Kim, D.; Galeano, M.A.; Hull, A.; Miranda, M.L. A framework for widespread replication of a highly spatially resolved childhood lead exposure risk model. Environ. Health Perspect. 2008, 116, 1735–1739. [Google Scholar] [CrossRef]
- Winter, A.S.; Sampson, R.J. From lead exposure in early childhood to adolescent health: A Chicago birth cohort. Am. J. Public Health 2017, 107, 1496–1501. [Google Scholar] [CrossRef] [PubMed]
- Wheeler, D.C.; Jones, R.M.; Schootman, M.; Nelson, E.J. Explaining variation in elevated blood lead levels among children in Minnesota using neighborhood socioeconomic variables. Sci. Total Environ. 2019, 650, 970–977. [Google Scholar] [CrossRef] [PubMed]
- Campanella, R.; Mielke, H.W. Human geography of New Orleans’ high-lead geochemical setting. Environ. Geochem. Health 2008, 30, 531–540. [Google Scholar] [CrossRef] [PubMed]
- Aelion, C.M.; Davis, H.T.; Lawson, A.B.; Cai, B.; McDermott, S. Associations between soil lead concentrations and populations by race/ethnicity and income-to-poverty ratio in urban and rural areas. Environ. Geochem. Health 2013, 35, 1–12. [Google Scholar] [CrossRef]
- Ha, H.; Rogerson, P.A.; Olson, J.R.; Han, D.; Bian, L.; Shao, W. Analysis of pollution hazard intensity: A spatial epidemiology case study of soil Pb contamination. Int. J. Environ. Res. Public Health 2016, 13, 915. [Google Scholar] [CrossRef]
- Lanphear, B.P.; Weitzman, M.; Eberly, S. Racial differences in urban children’s environmental exposures to lead. Am. J. Public Health 1996, 86, 1460–1463. [Google Scholar] [CrossRef]
- Raymond, J.; Wheeler, W.; Brown, M.J. Inadequate and unhealthy housing, 2007 and 2009. MMWR Suppl. 2011, 60, 21–27. [Google Scholar]
- Jacobs, D.E.; Clickner, R.P.; Zhou, J.Y.; Viet, S.M.; Marker, D.A.; Rogers, J.W.; Zeldin, D.C.; Broene, P.; Friedman, W. The prevalence of lead-based paint hazards in U.S. housing. Environ. Health Perspect. 2002, 110, A599–A606. [Google Scholar] [CrossRef]
- Blumenthal, H.T.; Mayfield, R. An update on blood lead levels in pediatric patients of a neighborhood health center and an analysis of sources of exposure. J. Natl. Med. Assoc. 1995, 87, 99–104. [Google Scholar]
- Dilworth-Bart, J.E.; Moore, C.F. Mercy mercy me: Social injustice and the prevention of environmental pollutant exposures among ethnic minority and poor children. Child. Dev. 2006, 77, 247–265. [Google Scholar] [CrossRef]
- Centers for Disease Control. National Health and Examination Survey. National Center for Health Statistics. Available online: www.cdc.gov/nchs/nhanes (accessed on 17 January 2017).
- World Health Organization. Haemoglobin concentrations for the diagnosis of anaemia and assessment of severity. Vitam. Miner. Nutr. Inf. Syst. 2011. Available online: www.who.int/vmnis/indicators/haemoglobin (accessed on 17 January 2017).
- Roberts, E.M.; Madrigal, D.; Valle, J.; King, G.; Kite, L. Assessing child lead poisoning case ascertainment in the US, 1999–2010. Pediatrics 2017, 139, e20164266. [Google Scholar] [CrossRef] [PubMed]
- Schmidt, C.W. After the screening: What happens next for children with elevated blood lead? Environ. Health Perspect. 2017, 125, 102001. [Google Scholar] [CrossRef] [PubMed]
- Government Accountability Office. Housing and Community Grants: HUD Needs to Enhance Its requirements and Oversight of Jurisdictions’ Fair Housing Plans. 2010. Available online: www.Gao.gov/assets/320/311065.pdf (accessed on 15 May 2018).
- Desmond, M. Eviction and the reproduction of urban poverty. Am. J. Sociol. 2012, 118, 88–133. [Google Scholar] [CrossRef]
- Farfel, M.R.; Orlova, A.O.; Lees, P.S.; Rohde, C.; Ashley, P.J.; Chisolm, J.J., Jr. A study of urban housing demolitions as sources of lead in ambient dust: Demolition practices and exterior dust fall. Environ. Health Perspect. 2003, 111, 1228–1234. [Google Scholar] [CrossRef] [PubMed]
- Rabito, F.A.; Iqbal, S.; Shorter, C.F.; Osman, P.; Philips, P.E.; Langlois, E.; White, L.E. The association between demolition activity and children’s blood lead levels. Environ. Res. 2007, 103, 345–351. [Google Scholar] [CrossRef] [PubMed]
- Ahrens, K.A.; Haley, B.A.; Rossen, L.M.; Lloyd, P.C.; Aoki, Y. Housing assistance and blood lead levels: Children in the United States, 2005–2012. Am. J. Public Health 2016, 106, 2049–2056. [Google Scholar] [CrossRef]
- Chiofalo, J.M.; Golub, M.; Crump, C.; Calman, N. Pediatric blood lead levels within New York City public versus private housing, 2003–2017. Am. J. Public Health 2019, 109, 906–911. [Google Scholar] [CrossRef]
- Dignam, T.A.; Lojo, J.; Meyer, P.A.; Norman, E.; Sayre, A.; Flanders, W.D. Reduction of elevated blood lead levels in children in North Carolina and Vermont, 1996–1999. Environ. Health Perspect. 2008, 116, 981–985. [Google Scholar] [CrossRef]
- Leighton, J.; Klitzman, S.; Sedlar, S.; Matte, T.; Cohen, N.L. The effect of lead-based paint hazard remediation on blood lead levels of lead poisoned children in New York City. Environ. Res. 2003, 92, 182–190. [Google Scholar] [CrossRef]
- Kemper, A.R.; Cohn, L.M.; Fant, K.E.; Dombkowski, K.J.; Hudson, S.R. Follow-up testing among children with elevated screening blood lead levels. JAMA 2005, 293, 2232–2237. [Google Scholar] [CrossRef] [PubMed][Green Version]
- Zierold, K.M.; Havlena, J.; Anderson, H. Exposure to lead and length of time needed to make homes lead-safe for young children. Am. J. Public Health 2007, 97, 267–270. [Google Scholar] [CrossRef]
- Hambidge, S.J.; Emsermann, C.B.; Federico, S.; Steiner, J.F. Disparities in pediatric preventive care in the United States, 1993–2002. Arch. Pediatrics Adolesc. Med. 2007, 161, 30–36. [Google Scholar] [CrossRef]
- Geronimus, A.T.; Hillemeier, M.M. Patterns of blood lead levels in US Black and White women of childbearing age. Ethn. Dis. 1992, 2, 222–231. [Google Scholar] [PubMed]
- Hertz-Picciotto, I.; Schramm, M.; Watt-Morse, M.; Chantala, K.; Anderson, J.; Osterloh, J. Patterns and determinants of blood lead during pregnancy. Am. J. Epidemiol. 2000, 152, 829–837. [Google Scholar] [CrossRef] [PubMed]
- Schell, L.M.; Denham, M.; Stark, A.D.; Gomez, M.; Ravenscroft, J.; Parsons, P.J.; Aydermir, A.; Samelson, R. Maternal blood lead concentration, diet during pregnancy, and anthropometry predict neonatal blood lead in a socioeconomically disadvantaged population. Environ. Health Perspect. 2003, 111, 195–200. [Google Scholar] [CrossRef]
- Lee, M.G.; Chun, O.K.; Song, W.O. Determinants of the blood lead level of US women of reproductive age. J. Am. Coll. Nutr. 2005, 24, 1–9. [Google Scholar] [CrossRef]
- Cassidy-Bushrow, A.E.; Sitarik, A.R.; Havstad, S.; Park, S.K.; Bielak, L.F.; Austin, C.; Johnson, C.C.; Arora, M. Burden of higher lead exposure in African-Americans starts in utero and persists into childhood. Environ. Int. 2017, 108, 221–227. [Google Scholar] [CrossRef]
- Theppeang, K.; Glass, T.A.; Bandeen-Roche, K.; Todd, A.C.; Rohde, C.A.; Schwartz, B.S. Gender and race/ethnicity differences in lead dose biomarkers. Am. J. Public Health 2008, 98, 1248–1255. [Google Scholar] [CrossRef]
- Hernandez-Avila, M.; Gonzalez-Cossio, T.; Palazuelos, E.; Romieu, I.; Aro, A.; Fishbein, E.; Peterson, K.E.; Hu, H. Dietary and environmental determinants of blood and bone lead levels in lactating postpartum women living in Mexico City. Environ. Health Perspect. 1996, 104, 1076–1082. [Google Scholar] [CrossRef]
- Brown, M.J.; Hu, H.; Gonzales-Cossio, T.; Peterson, K.E.; Sanin, L.H.; de Luz Kageyama, M.; Palazuelos, E.; Aro, A.; Schnaas, L.; Hernandez-Avila, M. Determinants of bone and blood lead concentrations in the early postpartum period. Occup. Environ. Med. 2000, 57, 535–541. [Google Scholar] [CrossRef] [PubMed]
- Gulson, B.; Mizon, K.; Korsch, M.; Taylor, A. Revisiting mobilisation of skeletal lead during pregnancy based on monthly sampling and cord/maternal blood lead relationships confirm placental transfer of lead. Arch. Toxicol. 2016, 90, 805–816. [Google Scholar] [CrossRef] [PubMed]
- Gulson, B.; Taylor, A.; Eisman, J. Bone remodeling during pregnancy and post-partum assessed by metal lead levels and isotopic concentrations. Bone 2016, 89, 40–51. [Google Scholar] [CrossRef] [PubMed]
- Sampson, R.J.; Winter, A.S. The racial ecology of lead poisoning: Toxic inequality in Chicago neighborhoods, 1995–2013. Du Bois Rev. Soc. Sci. Res. Race 2016, 13, 261–283. [Google Scholar] [CrossRef]
- Dignam, T.A.; Evens, A.; Eduardo, E.; Ramirez, S.M.; Caldwell, K.L.; Kilpatrick, N.; Noonan, G.P.; Flanders, W.D.; Meyer, P.A.; McGeehin, M.A. High-intensity targeted screening for elevated blood lead levels among children in 2 inner-city Chicago communities. Am. J. Public Health 2004, 94, 1945–1951. [Google Scholar] [CrossRef] [PubMed]
- Kemper, A.R.; Bordley, W.C.; Downs, S.M. Cost-effectiveness analysis of lead poisoning screening strategies following the 1997 guidelines of the Centers for Disease Control and Prevention. Arch. Pediatrics Adolesc. Med. 1998, 152, 1202–1208. [Google Scholar] [CrossRef] [PubMed][Green Version]
- Madrigal, D.S.; Roberts, E. The consequences of missing children with elevated blood lead levels. Am. J. Public Health 2018, 108, e1. [Google Scholar] [CrossRef]
- Neuwirth, L.S. Resurgent lead poisoning and renewed public attention towards environmental social justice issues: A review of current efforts and call to revitalize primary and secondary lead poisoning prevention for pregnant women, lactating mothers, and children within the U.S. Int. J. Occup. Environ. Health 2018, 24, 86–100. [Google Scholar]
- Gould, E. Childhood lead poisoning: Conservative estimates of the social and economic benefits of lead hazard control. Environ. Health Perspect. 2009, 117, 1162–1167. [Google Scholar] [CrossRef]
- Newman, N.; Jones, C.; Page, E.; Ceballos, D.; Oza, A. Investigation of childhood lead poisoning from parental take-home exposure from an electronic scrap recycling facility—Ohio, 2012. MMWR Morb. Mortal. Wkly. Rep. 2015, 64, 743–745. [Google Scholar]
- Katner, A.; Pieper, K.; Brown, K.; Lin, H.Y.; Parks, J.; Wang, X.; Hu, C.Y.; Masters, S.; Mielke, H.; Edwards, M. Effectiveness of prevailing flush guidelines to prevent exposure to lead in tap water. Int. J. Environ. Res. Public Health 2018, 15, 1537. [Google Scholar] [CrossRef] [PubMed]
- Aelion, C.M.; Davis, H.T. Blood lead levels in children in urban and rural areas: Using multilevel modeling to investigate impacts of gender, race, poverty, and the environment. Sci. Total Environ. 2019, 694, 133783. [Google Scholar] [CrossRef] [PubMed]
- Alvarez, J.; Del Rio, M.; Mayorga, T.; Dominguez, S.; Flores-Montoya, M.G.; Sobin, C. A comparison of child blood lead levels in urban and rural children ages 5–12 years living in the border region of El Paso, Texas. Arch. Environ. Contam. Toxicol. 2018, 75, 503–511. [Google Scholar] [CrossRef] [PubMed]
- Carrel, M.; Zahrieh, D.; Young, S.G.; Oleson, J.; Ryckman, K.K.; Wels, B.; Simmons, D.L.; Saftlas, A. High prevalence of elevated blood lead levels in both rural and urban Iowa newborns: Spatial patterns and area-level covariates. PLoS ONE 2017, 12, e0177930. [Google Scholar] [CrossRef] [PubMed]
- Wiener, R.C.; Jurevic, R.J. Association of blood lead levels in children 0–72 months with living in Mid-Appalachia: A semi-ecologic study. Rural Remote Health 2016, 16, 3597. [Google Scholar] [PubMed]
- Havlena, J.; Kanarek, M.S.; Coons, M. Factors associated with the seasonality of blood lead levels among preschool Wisconsin children. WMJ 2009, 108, 151–155. [Google Scholar] [PubMed]
- Schell, L.M.; Denham, M.; Stark, A.D.; Ravenscroft, J.; Parsons, P.; Schulte, E. Relationship between blood lead concentration and dietary intakes of infants from 3 to 12 months of age. Environ. Res. 2004, 96, 264–273. [Google Scholar] [CrossRef]
- Choi, J.; Chang, J.Y.; Hong, J.; Shin, S.; Park, J.S.; Oh, S. Low-level toxic metal exposure in healthy weaning-age infants: Association with growth, dietary intake, and iron deficiency. Int. J. Environ. Res. Public Health 2017, 14, 388. [Google Scholar] [CrossRef]
- Talpur, S.; Afridi, H.I.; Kazi, T.G.; Talpur, F.N. Interaction of lead with calcium, iron, and zinc in the biological samples of malnourished children. Biol. Trace Elem. Res. 2018, 183, 209–217. [Google Scholar] [CrossRef]
- US Census Bureau. Overview of Race and Hispanic Origin: 2010. 2011. Available online: www.census.gov/prod/cen2010/briefs/c2010br-02.pdf (accessed on 15 May 2018).
- Itzigsohn, J.; Giorguli, S.; Vazquez, O. Immigrant incorporation and racial identity: Racial self-identification among Dominican immigrants. Ethn. Racial Stud. 2005, 28, 50–78. [Google Scholar] [CrossRef]
- Newby, C.A.; Dowling, J.A. Black and Hispanic: The racial identification of Afro-Cuban immigrants in the Southwest. Sociol. Perspect. 2007, 50, 343–366. [Google Scholar] [CrossRef]
- Eisenhower, A.; Suyemoto, K.; Lucchese, F.; Canenguez, K. “Which box should I check?”: Examining standard check box approaches to measuring race and ethnicity. Health Serv. Res. 2014, 49, 1034–1055. [Google Scholar] [CrossRef] [PubMed]
- Tehranifar, P.; Leighton, J.; Auchincloss, A.H.; Faciano, A.; Alper, H.; Paykin, A.; Wu, S. Immigration and risk of childhood lead poisoning: Findings from a case control study of New York City children. Am. J. Public Health 2008, 98, 92–97. [Google Scholar] [CrossRef] [PubMed]
- Eisenberg, K.W.; van Wijngaarden, E.; Fisher, S.G.; Korfmacher, K.S.; Campbell, J.R.; Fernandez, I.D.; Cochran, J.; Geltman, P.L. Blood lead levels of refugee children resettled in Massachusetts, 2000 to 2007. Am. J. Public Health 2011, 101, 48–54. [Google Scholar] [CrossRef]
- Brown, R.W.; Longoria, T. Multiple risk factors for lead poisoning in Hispanic sub-populations: A review. J. Immigr. Minor. Health 2010, 12, 715–725. [Google Scholar] [CrossRef]


| Independent Variable | Reporting | Sample (%) | BLL (in µg/dL) | EBLL (≥5 µg/dL) | ||
|---|---|---|---|---|---|---|
| Mean ± SD | p-Value | Mean ± SE | p-Value | |||
| Age in Years | 100% | |||||
| 4–5 years | 1028 (36.2%) | 1.76 ± 1.40 | – | 3.2% ± 0.6% | – | |
| 3 years | 463 (16.3%) | 1.94 ± 1.60 | 0.121 | 5.2% ± 1.0% | 0.092 | |
| 2 years | 685 (24.1%) | 2.28 ± 2.23 | <0.001 ** | 8.0% ± 1.0% | <0.001 ** | |
| 1 year | 665 (23.4%) | 2.49 ± 2.97 | <0.001 ** | 10.8% ± 1.2% | <0.001 ** | |
| Anemia | 99.5% | |||||
| No | 2692 (94.8%) | 2.06 ± 2.05 | – | 6.1% ± 0.5% | – | |
| Yes | 149 (5.2%) | 2.47 ± 3.02 | 0.101 | 12.8% ± 2.7% | 0.001 ** | |
| Binary Gender | 100% | |||||
| Female | 1338 (47.1%) | 2.05 ± 1.95 | – | 5.9% ± 0.6% | – | |
| Male | 1503 (52.9%) | 2.11 ± 2.25 | 0.470 | 7.0% ± 0.7% | 0.242 | |
| Bodyweight (in kg) | 97.9% | |||||
| Continuous (scaled) | 2841 (100%) | −0.11 per unit | <0.001 ** | −0.09% per unit | <0.001 ** | |
| Health Insurance Coverage | 99.3% | |||||
| Yes | 2547 (89.7%) | 2.05 ± 2.12 | – | 6.2% ± 0.5% | – | |
| No | 294 (10.3%) | 2.37 ± 2.09 | 0.013 ** | 9.2% ± 1.7% | 0.086 | |
| Household Income Level | 93.6% | |||||
| Middle to upper class | 1142 (40.2%) | 1.64 ± 1.32 | – | 2.9% ± 0.5% | – | |
| Low income | 831 (29.3%) | 2.19 ± 2.49 | <0.001 ** | 7.2% ± 0.9% | <0.001 ** | |
| Poverty | 868 (30.6%) | 2.57 ± 2.44 | <0.001 ** | 10.5% ± 1.0% | <0.001 ** | |
| Indoor Household Smoking | 99.1% | |||||
| No | 2392 (84.2%) | 1.94 ± 2.02 | – | 5.2% ± 0.5% | – | |
| Yes | 449 (15.8%) | 2.83 ± 2.46 | <0.001 ** | 13.4% ± 1.6% | <0.001 ** | |
| Low Birthweight | 99.7% | |||||
| No | 2601 (91.6%) | 2.06 ± 2.09 | – | 6.2% ± 0.5% | – | |
| Yes | 240 (8.4%) | 2.31 ± 2.39 | 0.116 | 9.6% ± 1.9% | 0.041 * | |
| Medicaid/CHIP Enrollment | 99.3% | |||||
| No | 1934 (68.1%) | 1.93 ± 2.16 | – | 5.4% ± 0.5% | – | |
| Yes | 907 (31.9%) | 2.40 ± 1.98 | <0.001 ** | 8.8% ± 0.9% | 0.001 ** | |
| Primary Guardian Education | 97.3% | |||||
| Some college or higher | 1377 (48.5%) | 1.90 ± 2.20 | – | 4.9% ± 0.6% | – | |
| 12th grade or GED | 706 (24.9%) | 2.10 ± 1.68 | 0.038 * | 6.9% ± 1.0% | 0.060 | |
| Less than 12th grade or GED | 758 (26.7%) | 2.40 ± 2.28 | <0.001 ** | 8.8% ± 1.0% | <0.001 ** | |
| Race/Ethnicity | 100% | |||||
| Hispanic | 1025 (36.1%) | 1.82 ± 1.71 | – | 4.4% ± 0.6% | – | |
| NH White | 1208 (42.5%) | 1.94 ± 1.83 | 0.166 | 5.5% ± 0.7% | 0.245 | |
| NH Black | 608 (21.4%) | 2.81 ± 2.95 | <0.001 ** | 12.0% ± 1.3% | <0.001 ** | |
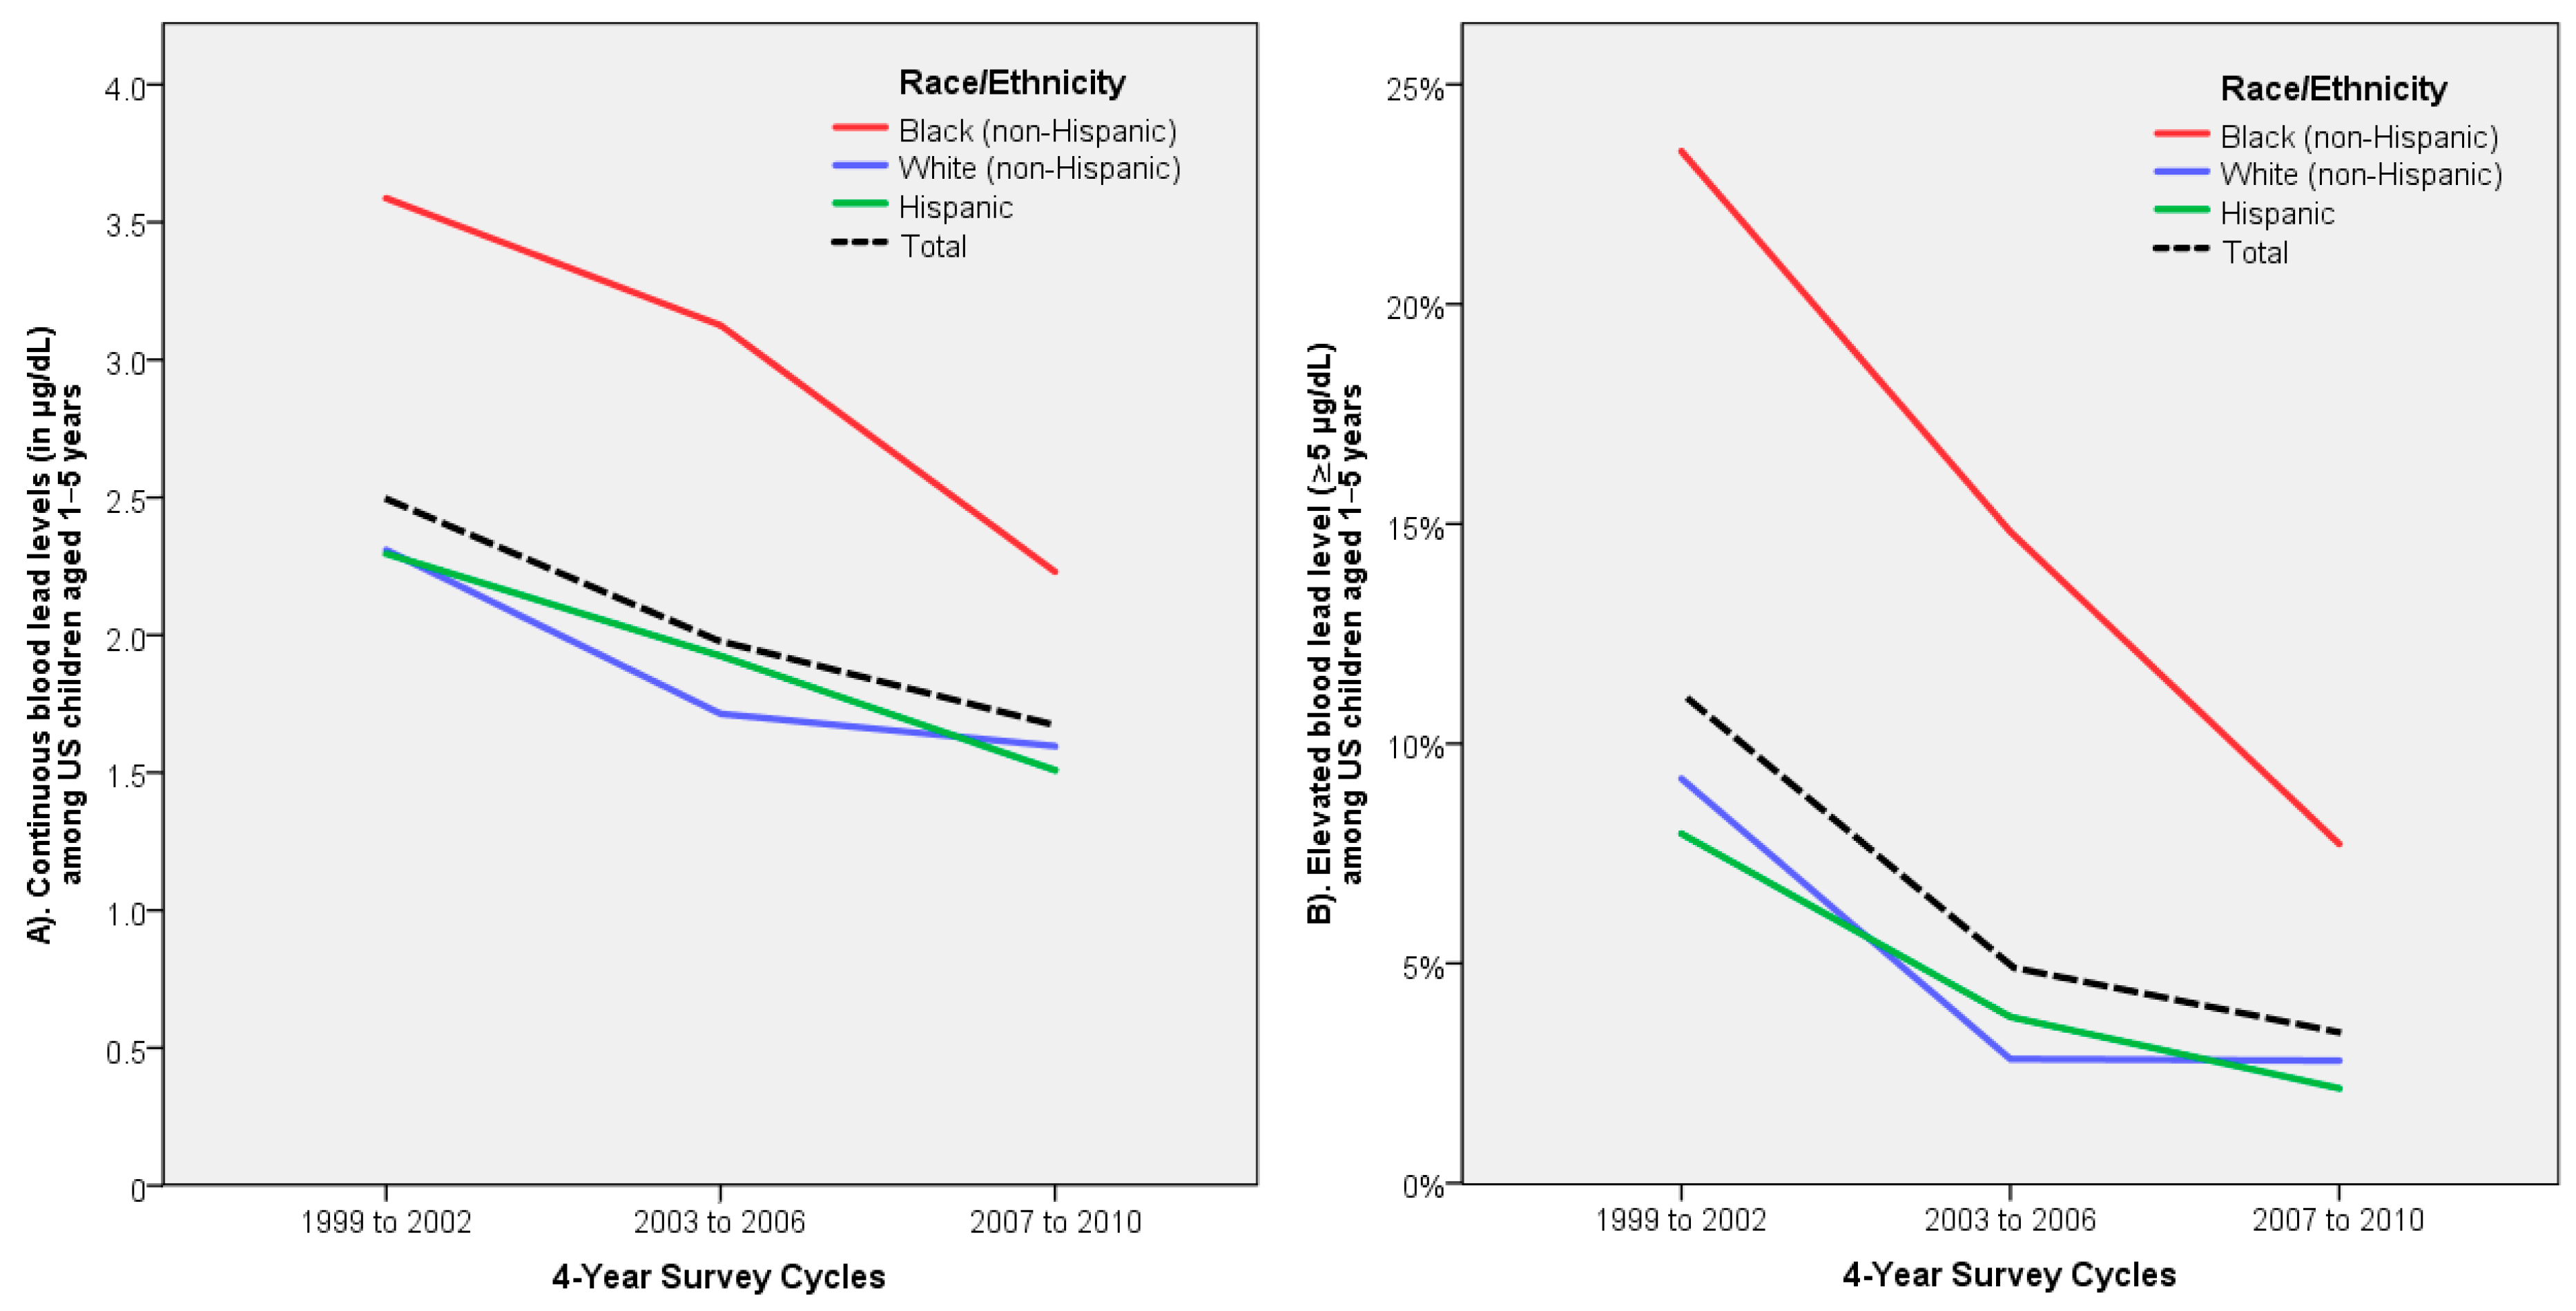
| Survey Years | 100% | |||||
| 1999 to 2002 | 832 (29.3%) | 2.56 ± 2.82 | – | 10.9% ± 1.1% | – | |
| 2003 to 2006 | 1035 (36.4%) | 2.06 ± 1.80 | <0.001 ** | 5.6% ± 0.7% | <0.001 ** | |
| 2007 to 2010 | 974 (34.3%) | 1.70 ± 1.59 | <0.001 ** | 3.6% ± 0.6% | <0.001 ** | |
| Water Treatment Devices Used | 98.7% | |||||
| No | 2108 (74.2%) | 2.23 ± 2.33 | – | 7.5% ± 0.6% | – | |
| Yes | 733 (25.8%) | 1.67 ± 1.25 | <0.001 ** | 3.5% ± 0.7% | <0.001 ** | |
| WIC Enrollment | 99.5% | |||||
| No | 1644 (57.9%) | 1.90 ± 2.11 | – | 4.8% ± 0.5% | – | |
| Yes | 1197 (42.1%) | 2.33 ± 2.10 | <0.001 ** | 8.8% ± 0.8% | <0.001 ** | |
| Year Housing Built | 64.4% | |||||
| 1978 to present | 1282 (45.1%) | 1.66 ± 1.26 | – | 2.9% ± 0.5% | – | |
| 1950 to 1977 | 945 (33.3%) | 2.04 ± 1.76 | <0.001 ** | 5.3% ± 0.7% | 0.004 ** | |
| Before 1950 | 614 (21.6%) | 3.03 ± 3.38 | <0.001 ** | 15.8% ± 1.5% | <0.001 ** | |
| TOTAL | 59.6% | 2841 | 2.08 ± 2.12 | – | 6.5% ± 0.5% | – |
| Independent Variable | BLL (in µg/dL) | EBLL (≥5 µg/dL) | ||||
|---|---|---|---|---|---|---|
| B Coeff. (β) | 95% CI | p-Value | Odds Ratio | 95% CI | p-Value | |
| Age in Years | ||||||
| 4–5 years | Reference | – | – | Reference | – | – |
| 3 years | +0.19 per unit (+0.105) | +0.10 to +0.28 | <0.001 ** | 1.7 | 0.92 to 3.2 | 0.089 |
| 2 years | 2.7 | 1.5 to 4.9 | 0.001 ** | |||
| 1 year | 3.4 | 1.7 to 6.9 | 0.001 ** | |||
| Anemia | ||||||
| No | Reference | – | – | Reference | – | – |
| Yes | +0.29 (+0.031) | −0.03 to +0.61 | 0.074 | 2.2 | 1.3 to 4.0 | 0.005 ** |
| Binary Gender | ||||||
| Female | Reference | – | – | Reference | – | – |
| Male | +0.11 (+0.025) | −0.04 to +0.25 | 0.151 | 1.3 | 0.90 to 1.8 | 0.178 |
| Bodyweight (in kg) | ||||||
| Continuous (scaled) | −0.02 per unit (−0.050) | −0.05 to 0.00 | 0.051 * | 0.98 | 0.92 to 1.1 | 0.554 |
| Health Insurance Coverage | ||||||
| Yes | Reference | – | – | Reference | – | – |
| No | +0.26 (+0.038) | +0.01 to +0.52 | 0.039 * | 1.3 | 0.77 to 2.2 | 0.332 |
| Household Income Level | ||||||
| Middle to upper class | Reference | – | – | Reference | – | – |
| Low income | +0.28 per unit (+0.109) | +0.17 to +0.39 | <0.001 ** | 2.2 | 1.4 to 3.7 | 0.002 ** |
| Poverty | 2.5 | 1.5 to 4.2 | 0.001 ** | |||
| Indoor Household Smoking | ||||||
| No | Reference | – | – | Reference | – | – |
| Yes | +0.42 (+0.072) | +0.21 to +0.62 | <0.001 ** | 1.8 | 1.2 to 2.7 | 0.002 ** |
| Low Birthweight | ||||||
| No | Reference | – | – | Reference | – | – |
| Yes | +0.05 (+0.007) | −0.21 to +0.31 | 0.681 | 1.3 | 0.79 to 2.3 | 0.285 |
| Medicaid/CHIP Enrollment | ||||||
| No | Reference | – | – | Reference | – | – |
| Yes | +0.12 (+0.027) | −0.07 to +0.31 | 0.204 | 1.0 | 0.70 to 1.5 | 0.859 |
| Primary Guardian Education | ||||||
| Some college or higher | Reference | – | – | Reference | – | – |
| 12th grade or GED | +0.11 per unit (+0.044) | +0.01 to +0.21 | 0.026 * | 1.0 | 0.65 to 1.6 | 0.986 |
| Less than 12th grade or GED | 1.3 | 0.86 to 2.0 | 0.210 | |||
| Race/Ethnicity | ||||||
| Hispanic | Reference | – | – | Reference | – | – |
| NH White | +0.46 per unit (+0.161) | +0.36 to +0.56 | <0.001 ** | 1.5 | 0.97 to 2.4 | 0.070 |
| NH Black | 3.5 | 2.2 to 5.5 | <0.001 ** | |||
| Survey Years | ||||||
| 1999 to 2002 | Reference | – | – | Reference | – | – |
| 2003 to 2006 | −0.40 per unit (−0.151) | −0.49 to −0.31 | <0.001 ** | 0.42 | 0.29 to 0.62 | <0.001 ** |
| 2007 to 2010 | 0.31 | 0.20 to 0.48 | <0.001 ** | |||
| Water Treatment Devices Used | ||||||
| No | Reference | – | – | Reference | – | – |
| Yes | −0.21 (−0.043) | −0.38 to −0.04 | 0.015 * | 0.83 | 0.52 to 1.3 | 0.420 |
| WIC Enrollment | ||||||
| No | Reference | – | – | Reference | – | – |
| Yes | −0.01 (−0.003) | −0.19 to +0.16 | 0.889 | 1.0 | 0.70 to 1.5 | 0.908 |
| Year Housing Built | ||||||
| 1978 to present | Reference | – | – | Reference | – | – |
| 1950 to 1977 | +0.61 per unit (+0.226) | +0.52 to +0.70 | <0.001 ** | 1.9 | 1.2 to 2.9 | 0.007 ** |
| Before 1950 | 7.1 | 4.6 to 10.8 | <0.001 ** | |||
| Model | Independent Variable | Sample (%) | BLL (in µg/dL) | EBLL (≥5 µg/dL) | ||||||
|---|---|---|---|---|---|---|---|---|---|---|
| Risk Factor | Mean ± SD | B Coeff. (β) | 95% CI | p-Value | Mean ± SE | Odds Ratio | 95% CI | p-Value | ||
| Full Model Total Sample | NH White or Hispanic | 2233 (78.6%) | 1.89 ± 1.78 | Reference | – | – | 5.0% ± 0.5% | Reference | – | – |
| NH Black | 608 (21.4%) | 2.81 ± 2.95 | +0.92 (+0.179) | +0.74 to +1.11 | <0.001 ** | 12.0% ± 1.3% | 2.6 | 1.9 to 3.6 | <0.001 ** | |
| Adjusteda | +0.83 (+0.160) | +0.65 to +1.00 | <0.001 ** | 2.8 | 1.9 to 3.9 | <0.001 ** | ||||
| Model 1—Age 1 Year of Age | NH White or Hispanic | 526 (79.1%) | 2.22 ± 2.34 | Reference | – | – | 8.9% ± 1.2% | Reference | – | – |
| NH Black | 139 (20.9%) | 3.51 ± 4.53 | +1.29 (+0.177) | +0.74 to +1.84 | <0.001 ** | 18.0% ± 3.3% | 2.2 | 1.3 to 3.8 | 0.003 ** | |
| Adjusteda,b | +1.00 (+0.136) | +0.47 to +1.53 | <0.001 ** | 2.0 | 1.1 to 3.7 | 0.035 * | ||||
| Model 2—Age 2 Years of Age | NH White or Hispanic | 554 (80.8%) | 2.00 ± 1.84 | Reference | – | – | 5.2% ± 0.9% | Reference | – | – |
| NH Black | 131 (19.2%) | 3.45 ± 3.19 | +1.45 (+0.256) | +1.04 to +1.86 | <0.001 ** | 19.8% ± 3.5% | 4.5 | 2.5 to 7.9 | 0.001 ** | |
| Adjusteda,b | +1.41 (+0.249) | +1.01 to +1.81 | <0.001 ** | 5.3 | 2.6 to 10.7 | <0.001 ** | ||||
| Model 3—Age 3 Years of Age | NH White or Hispanic | 355 (76.7%) | 1.75 ± 1.47 | Reference | – | – | 3.7% ± 1.0% | Reference | – | – |
| NH Black | 108 (23.3%) | 2.55 ± 1.87 | +0.80 (+0.211) | +0.46 to +1.14 | <0.001 ** | 10.2% ± 2.9% | 3.0 | 1.3 to 6.9 | 0.007 ** | |
| Adjusteda,b | +0.73 (+0.192) | +0.40 to +1.06 | <0.001 ** | 4.7 | 1.7 to 13.1 | 0.003 ** | ||||
| Model 4—Education Primary Guardian <12th Grade/GED | NH White or Hispanic | 624 (82.3%) | 2.17 ± 2.12 | Reference | – | – | 6.3% ± 1.0% | Reference | – | – |
| NH Black | 134 (17.7%) | 3.49 ± 2.67 | +1.32 (+0.221) | +0.90 to +1.74 | <0.001 ** | 20.9% ± 3.5% | 4.0 | 2.3 to 6.7 | <0.001 ** | |
| Adjusteda,c | +0.99 (+0.166) | +0.58 to +1.40 | <0.001 ** | 3.5 | 1.8 to 6.7 | <0.001 ** | ||||
| Model 5—Housing Housing Built 1950 to 1977 | NH White or Hispanic | 727 (76.9%) | 1.78 ± 1.36 | Reference | – | – | 3.0% ± 0.6% | Reference | – | – |
| NH Black | 218 (23.1%) | 2.90 ± 2.52 | +1.12 (+0.268) | +0.86 to +1.38 | <0.001 ** | 12.8% ± 2.3% | 4.7 | 2.6 to 8.4 | <0.001 ** | |
| Adjusteda,d | +1.02 (+0.244) | +0.76 to +1.27 | <0.001 ** | 5.6 | 2.8 to 11.2 | <0.001 ** | ||||
| Model 6—Housing Housing Built <1950 | NH White or Hispanic | 506 (82.4%) | 2.73 ± 2.71 | Reference | – | – | 13.4% ± 1.5% | Reference | – | – |
| NH Black | 108 (17.6%) | 4.43 ± 5.32 | +1.70 (+0.192) | +1.01 to +2.40 | <0.001 ** | 26.9% ± 4.3% | 2.4 | 1.4 to 3.9 | 0.001 ** | |
| Adjusteda,d | +1.22 (+0.138) | +0.54 to +1.90 | <0.001 ** | 1.8 | 1.0 to 3.2 | 0.053 * | ||||
| Model 7—Housing Indoor Household Smoking | NH White or Hispanic | 311 (71.3%) | 2.45 ± 1.95 | Reference | – | – | 9.6% ± 1.7% | Reference | – | – |
| NH Black | 122 (28.7%) | 3.93 ± 3.30 | +1.48 (+0.268) | +0.98 to +1.99 | <0.001 ** | 24.6% ± 3.9% | 3.1 | 1.8 to 5.4 | <0.001 ** | |
| Adjusteda,e | +1.30 (+0.234) | +0.79 to +1.80 | <0.001 ** | 3.3 | 1.6 to 6.4 | 0.001 ** | ||||
| Model 8—Income Low Income | NH White or Hispanic | 674 (81.1%) | 2.01 ± 1.93 | Reference | – | – | 6.2% ± 0.9% | Reference | – | – |
| NH Black | 157 (18.9%) | 2.96 ± 4.03 | +0.94 (+0.148) | +0.51 to +1.37 | <0.001 ** | 11.5% ± 2.6% | 2.0 | 1.1 to 3.5 | 0.025 * | |
| Adjusteda,f | +0.90 (+0.142) | +0.48 to +1.32 | <0.001 ** | 2.1 | 1.1 to 4.1 | 0.034 * | ||||
| Model 9—Income Poverty | NH White or Hispanic | 647 (74.5%) | 2.24 ± 2.07 | Reference | – | – | 7.1% ± 1.0% | Reference | – | – |
| NH Black | 221 (25.5%) | 3.53 ± 3.10 | +1.29 (+0.231) | +0.93 to +1.65 | <0.001 ** | 20.4% ± 2.7% | 3.3 | 2.1 to 5.2 | <0.001 ** | |
| Adjusteda,f | +1.22 (+0.220) | +0.89 to +1.58 | <0.001 ** | 4.1 | 2.3 to 7.0 | <0.001** | ||||
© 2020 by the authors. Licensee MDPI, Basel, Switzerland. This article is an open access article distributed under the terms and conditions of the Creative Commons Attribution (CC BY) license (http://creativecommons.org/licenses/by/4.0/).
Share and Cite
Yeter, D.; Banks, E.C.; Aschner, M. Disparity in Risk Factor Severity for Early Childhood Blood Lead among Predominantly African-American Black Children: The 1999 to 2010 US NHANES. Int. J. Environ. Res. Public Health 2020, 17, 1552. https://doi.org/10.3390/ijerph17051552
Yeter D, Banks EC, Aschner M. Disparity in Risk Factor Severity for Early Childhood Blood Lead among Predominantly African-American Black Children: The 1999 to 2010 US NHANES. International Journal of Environmental Research and Public Health. 2020; 17(5):1552. https://doi.org/10.3390/ijerph17051552
Chicago/Turabian StyleYeter, Deniz, Ellen C. Banks, and Michael Aschner. 2020. "Disparity in Risk Factor Severity for Early Childhood Blood Lead among Predominantly African-American Black Children: The 1999 to 2010 US NHANES" International Journal of Environmental Research and Public Health 17, no. 5: 1552. https://doi.org/10.3390/ijerph17051552
APA StyleYeter, D., Banks, E. C., & Aschner, M. (2020). Disparity in Risk Factor Severity for Early Childhood Blood Lead among Predominantly African-American Black Children: The 1999 to 2010 US NHANES. International Journal of Environmental Research and Public Health, 17(5), 1552. https://doi.org/10.3390/ijerph17051552