Relationship Between Traffic Volume and Accident Frequency at Intersections


Abstract
:1. Introduction
2. Materials and Methods
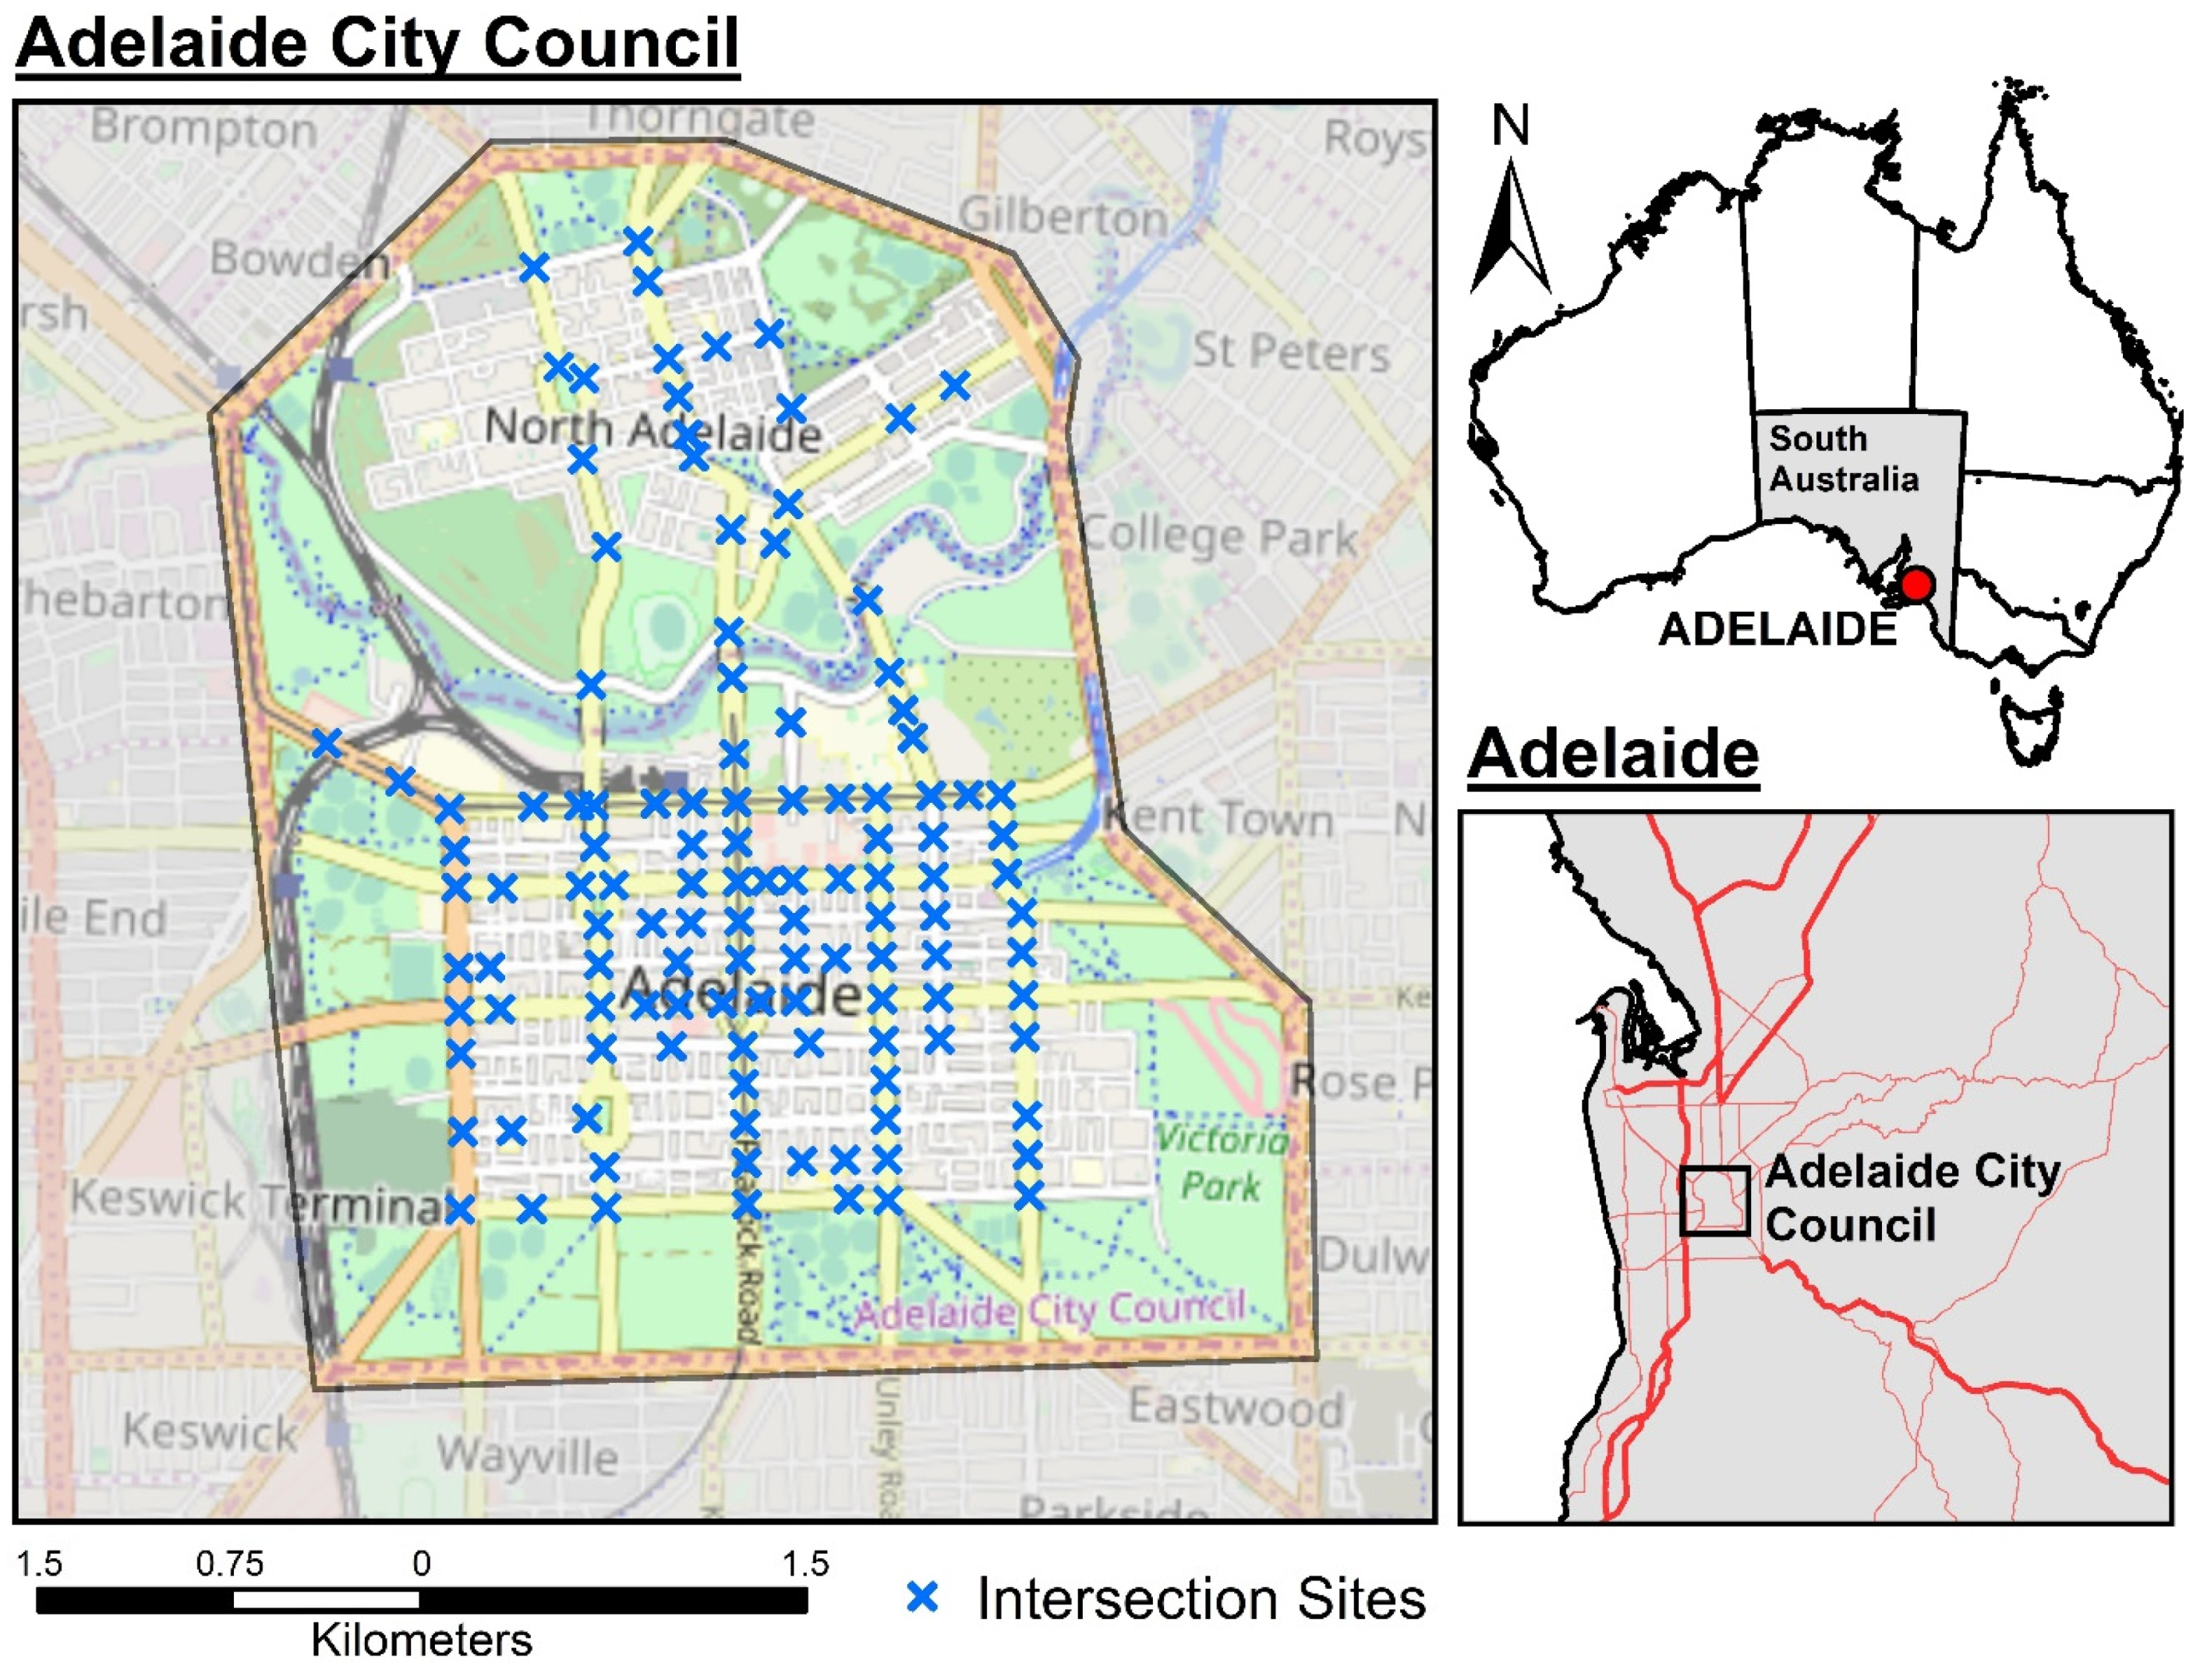
2.1. Study Area
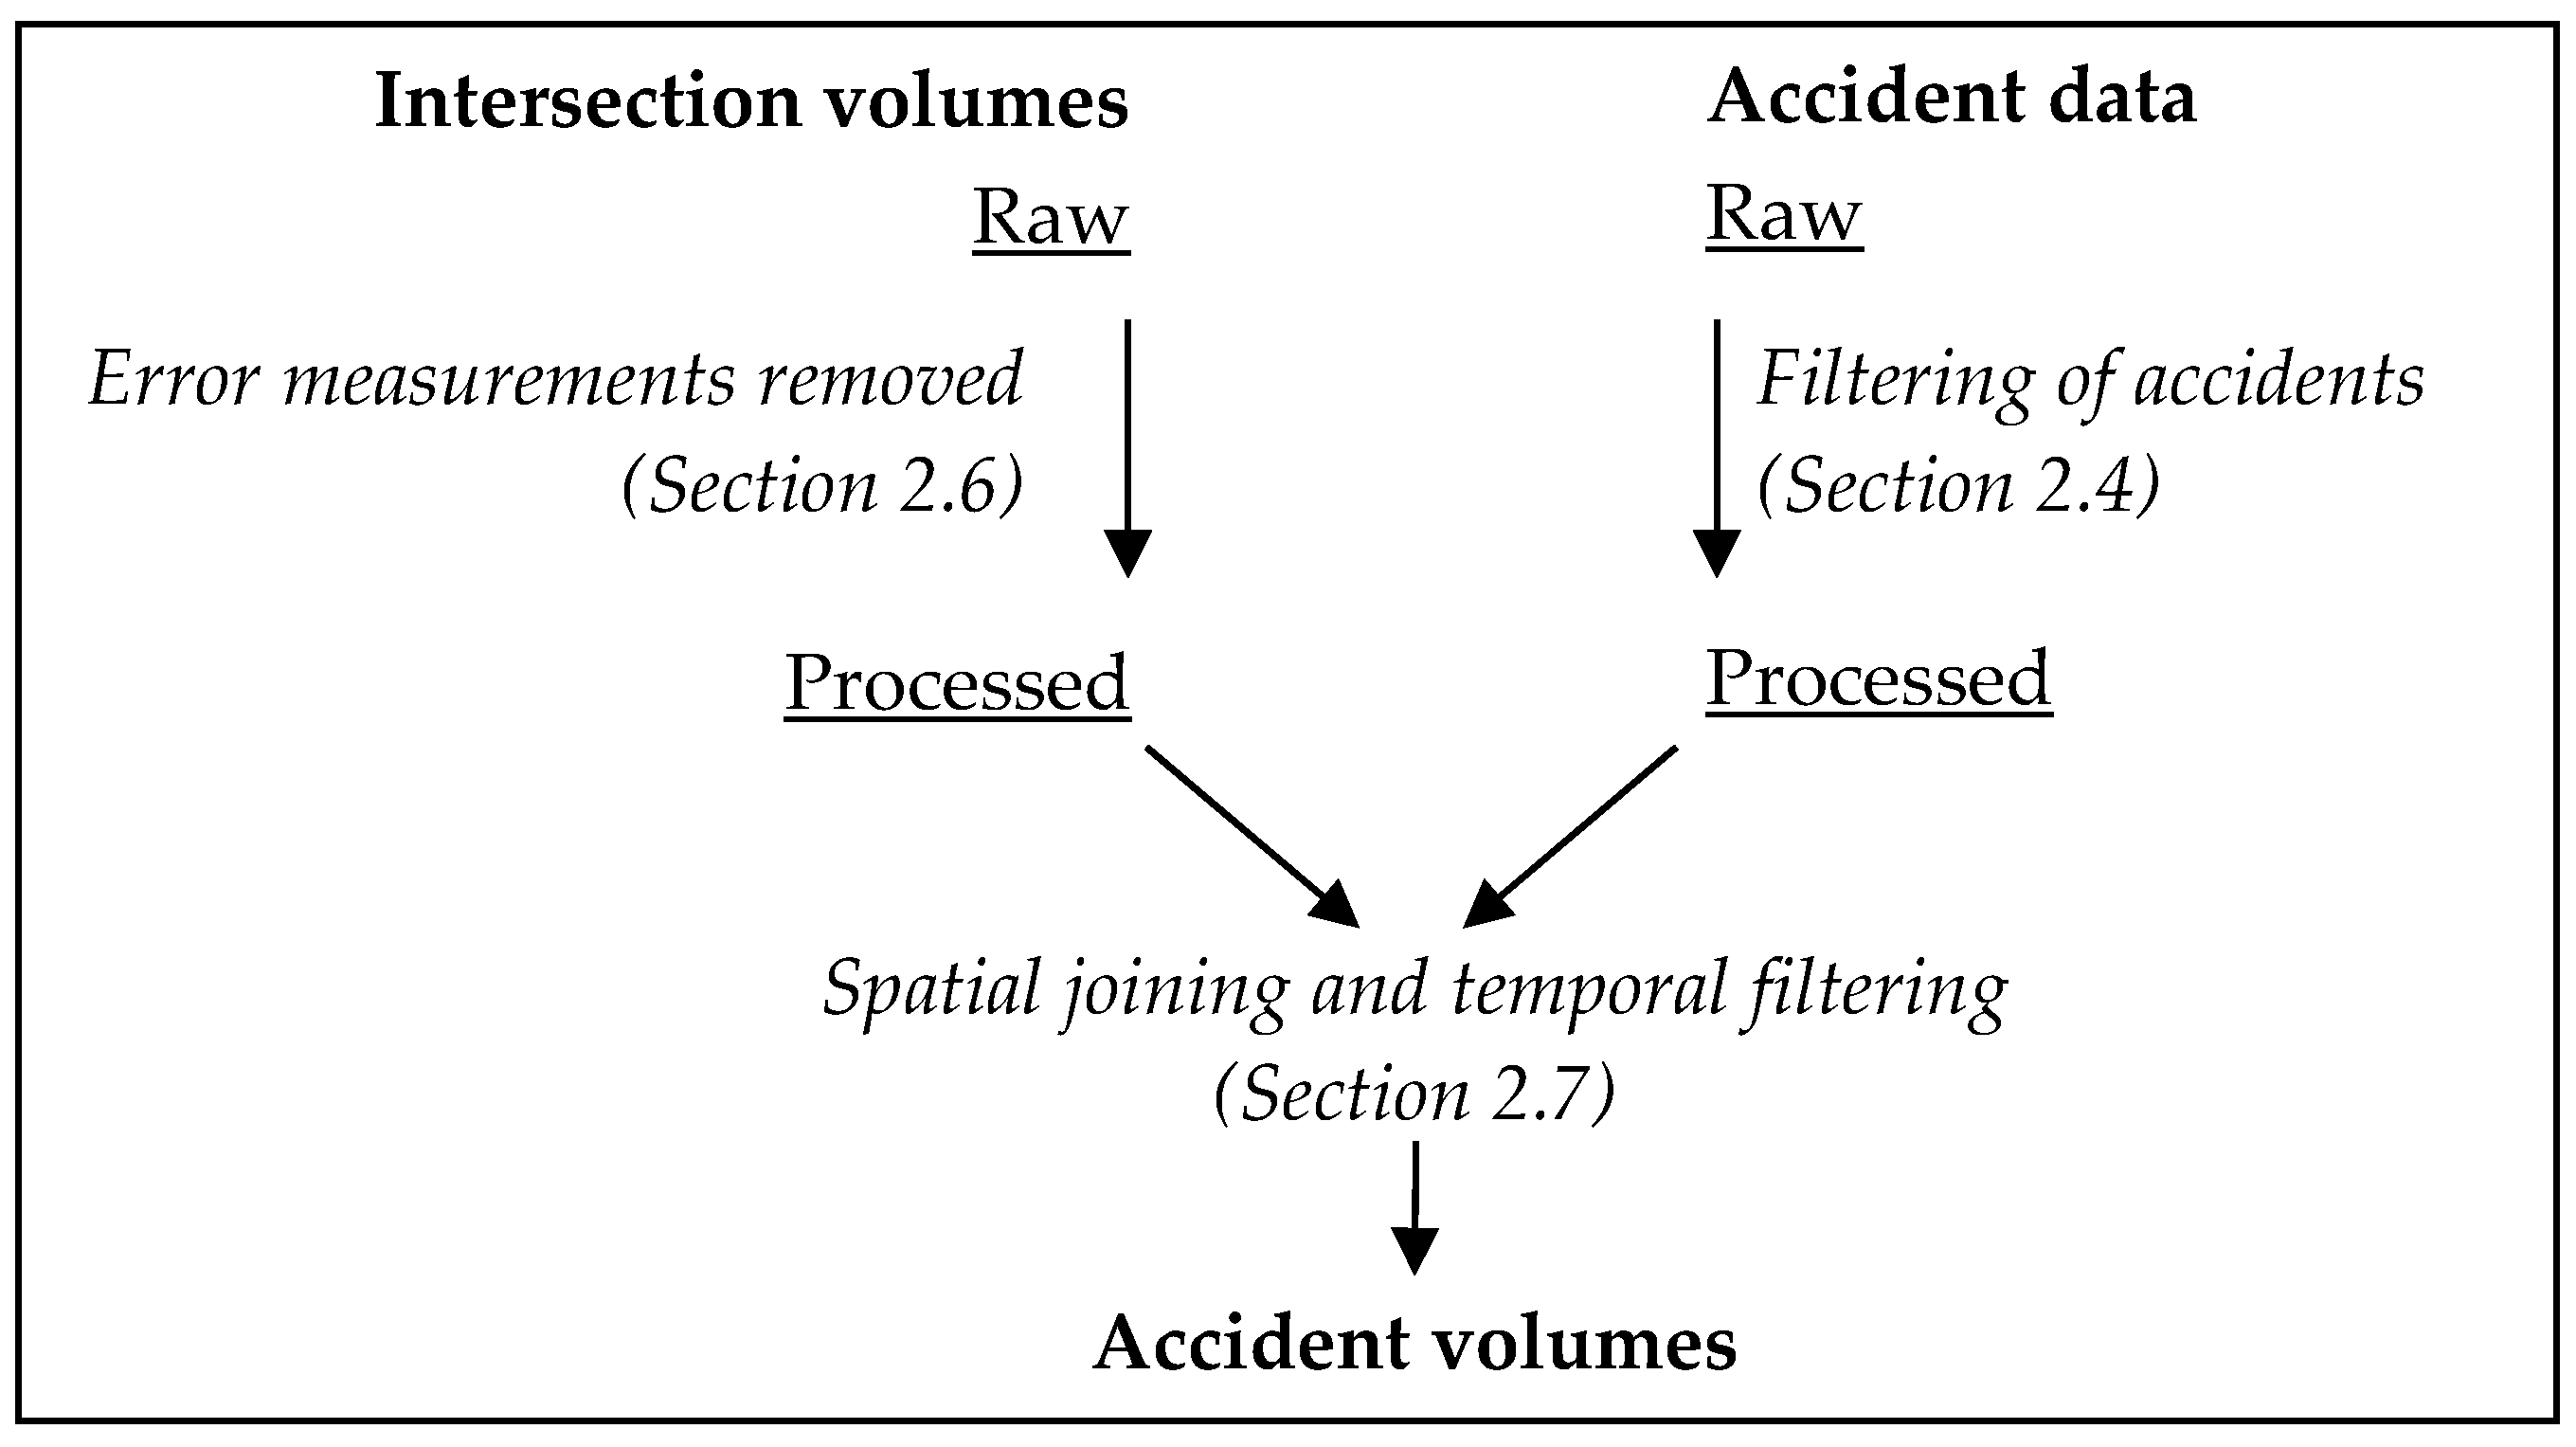
2.2. Data Processing Workflow
2.3. Accident Data
2.4. Processing Accident Data
2.5. Intersection Traffic Volume Data
2.6. Processing Intersection Traffic Volume Data
2.7. Joining Accident and Traffic Volume Datasets
2.8. Rainfall Data
2.9. Accounting for Variability in Intersection Capacity
2.10. Analysing the Relationship Between Traffic Volume and Accident Frequency
- Linear:
- accident frequency ~ traffic volume
- Quadratic:
- accident frequency ~ traffic volume + (traffic volume)2
- Natural Spline:
- accident frequency ~ natural spline (traffic volume, 4 d.f.)
2.11. Accident Severity Analysis
2.12. Rainfall Risk Analysis
3. Results
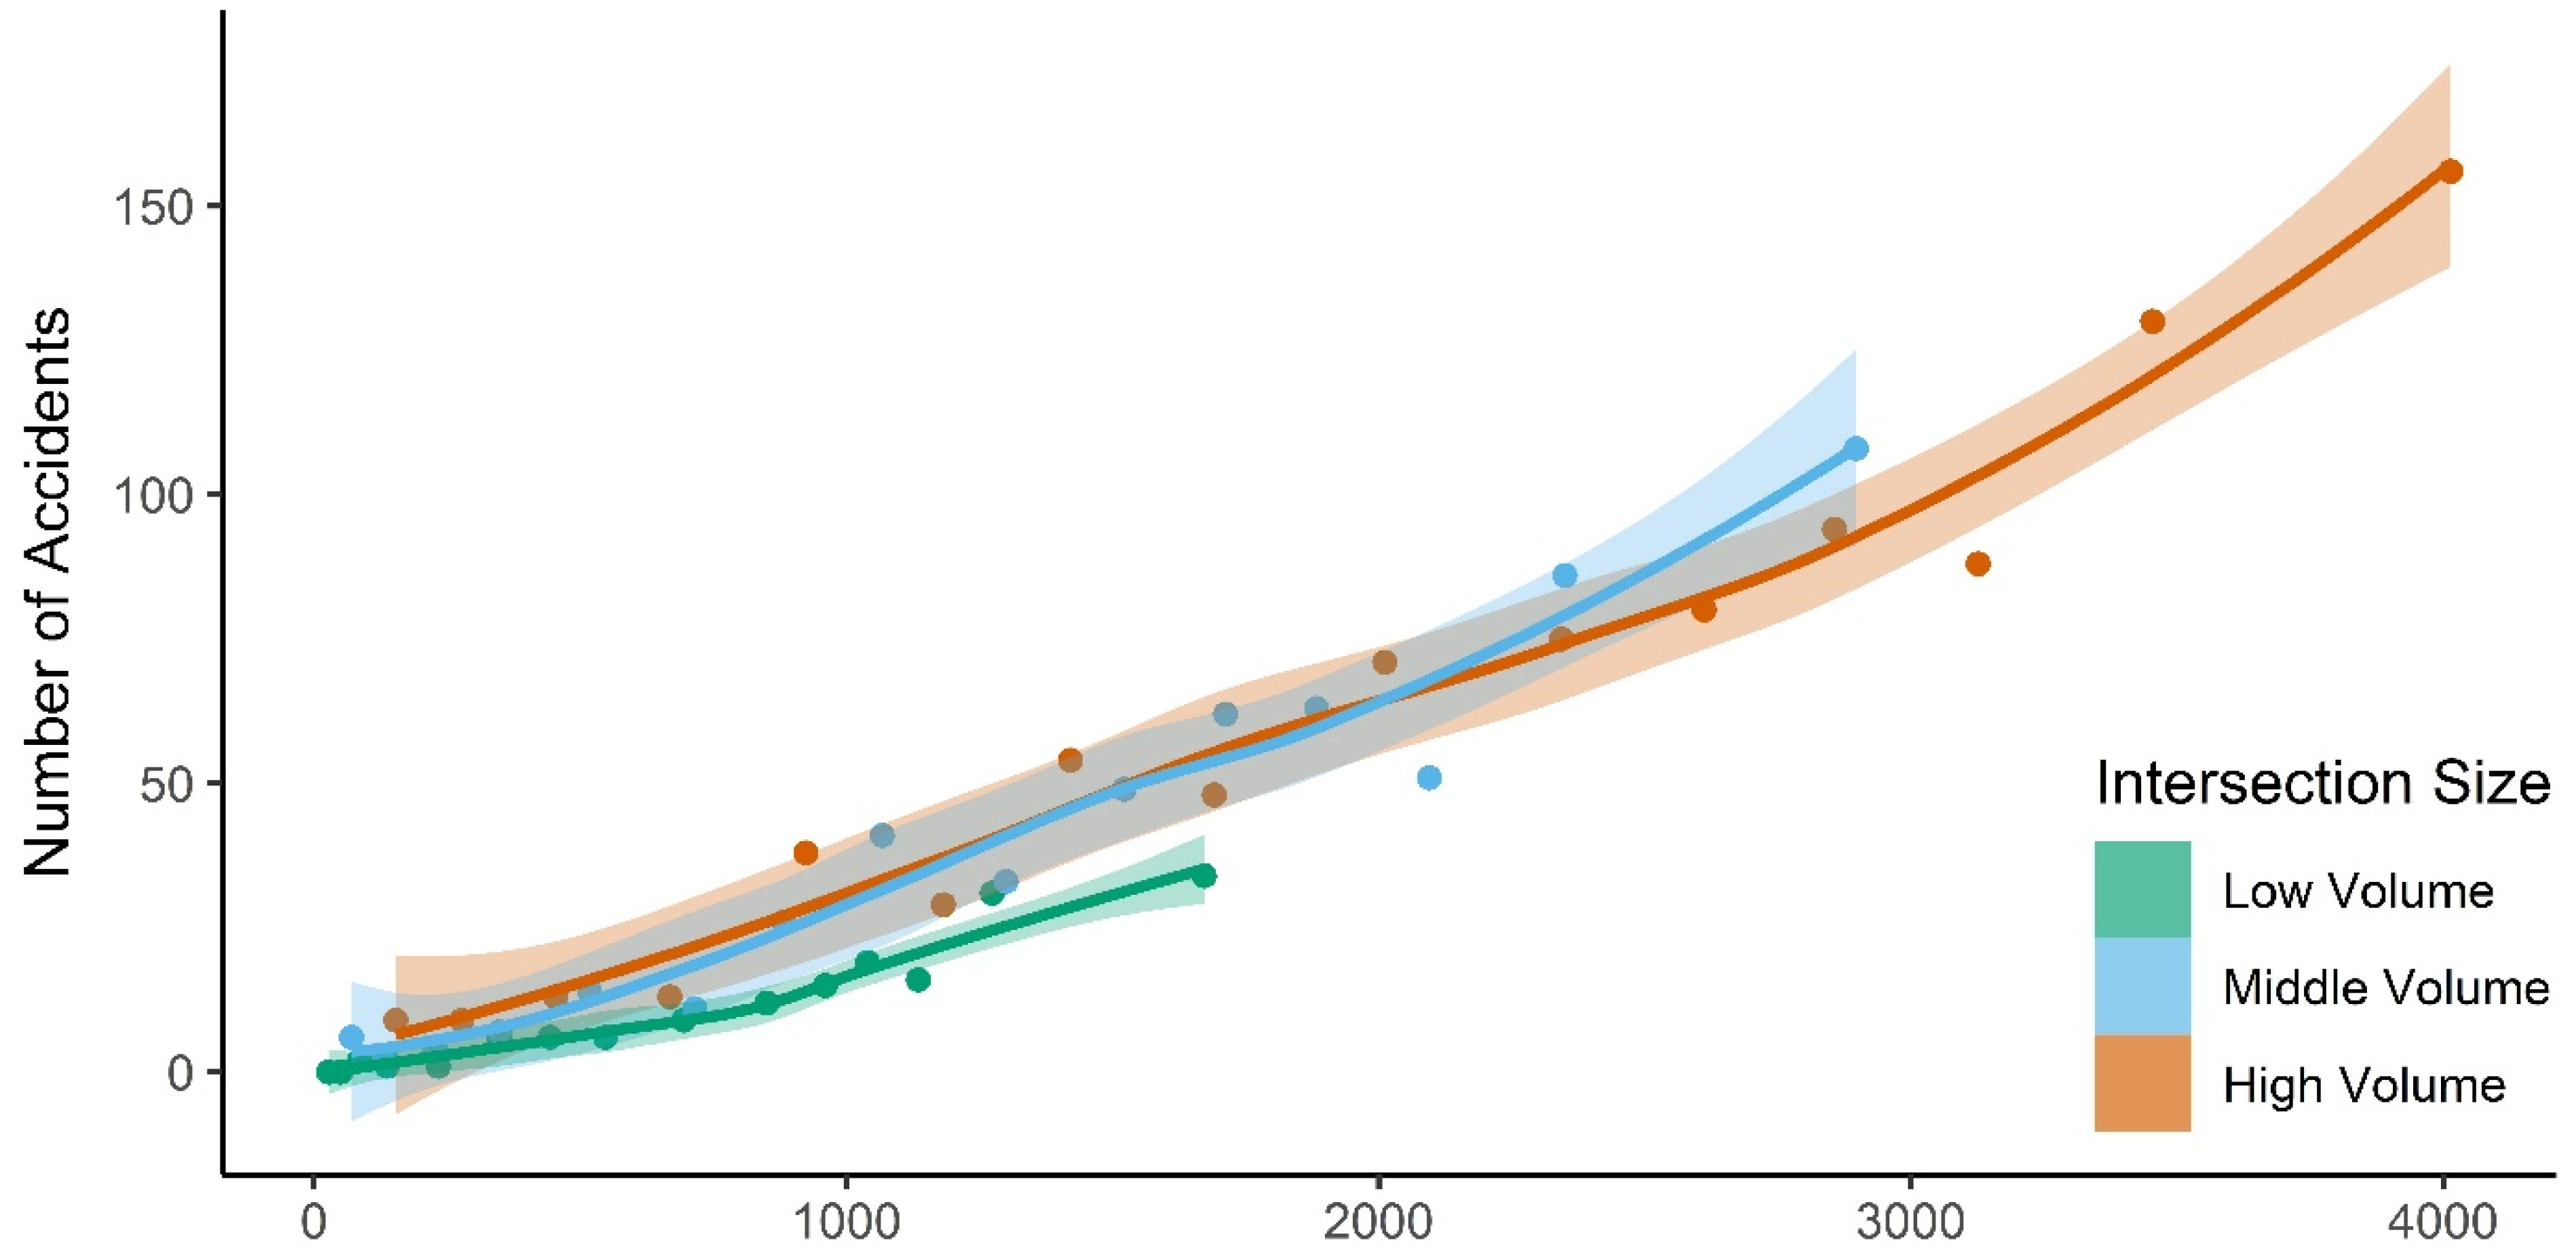
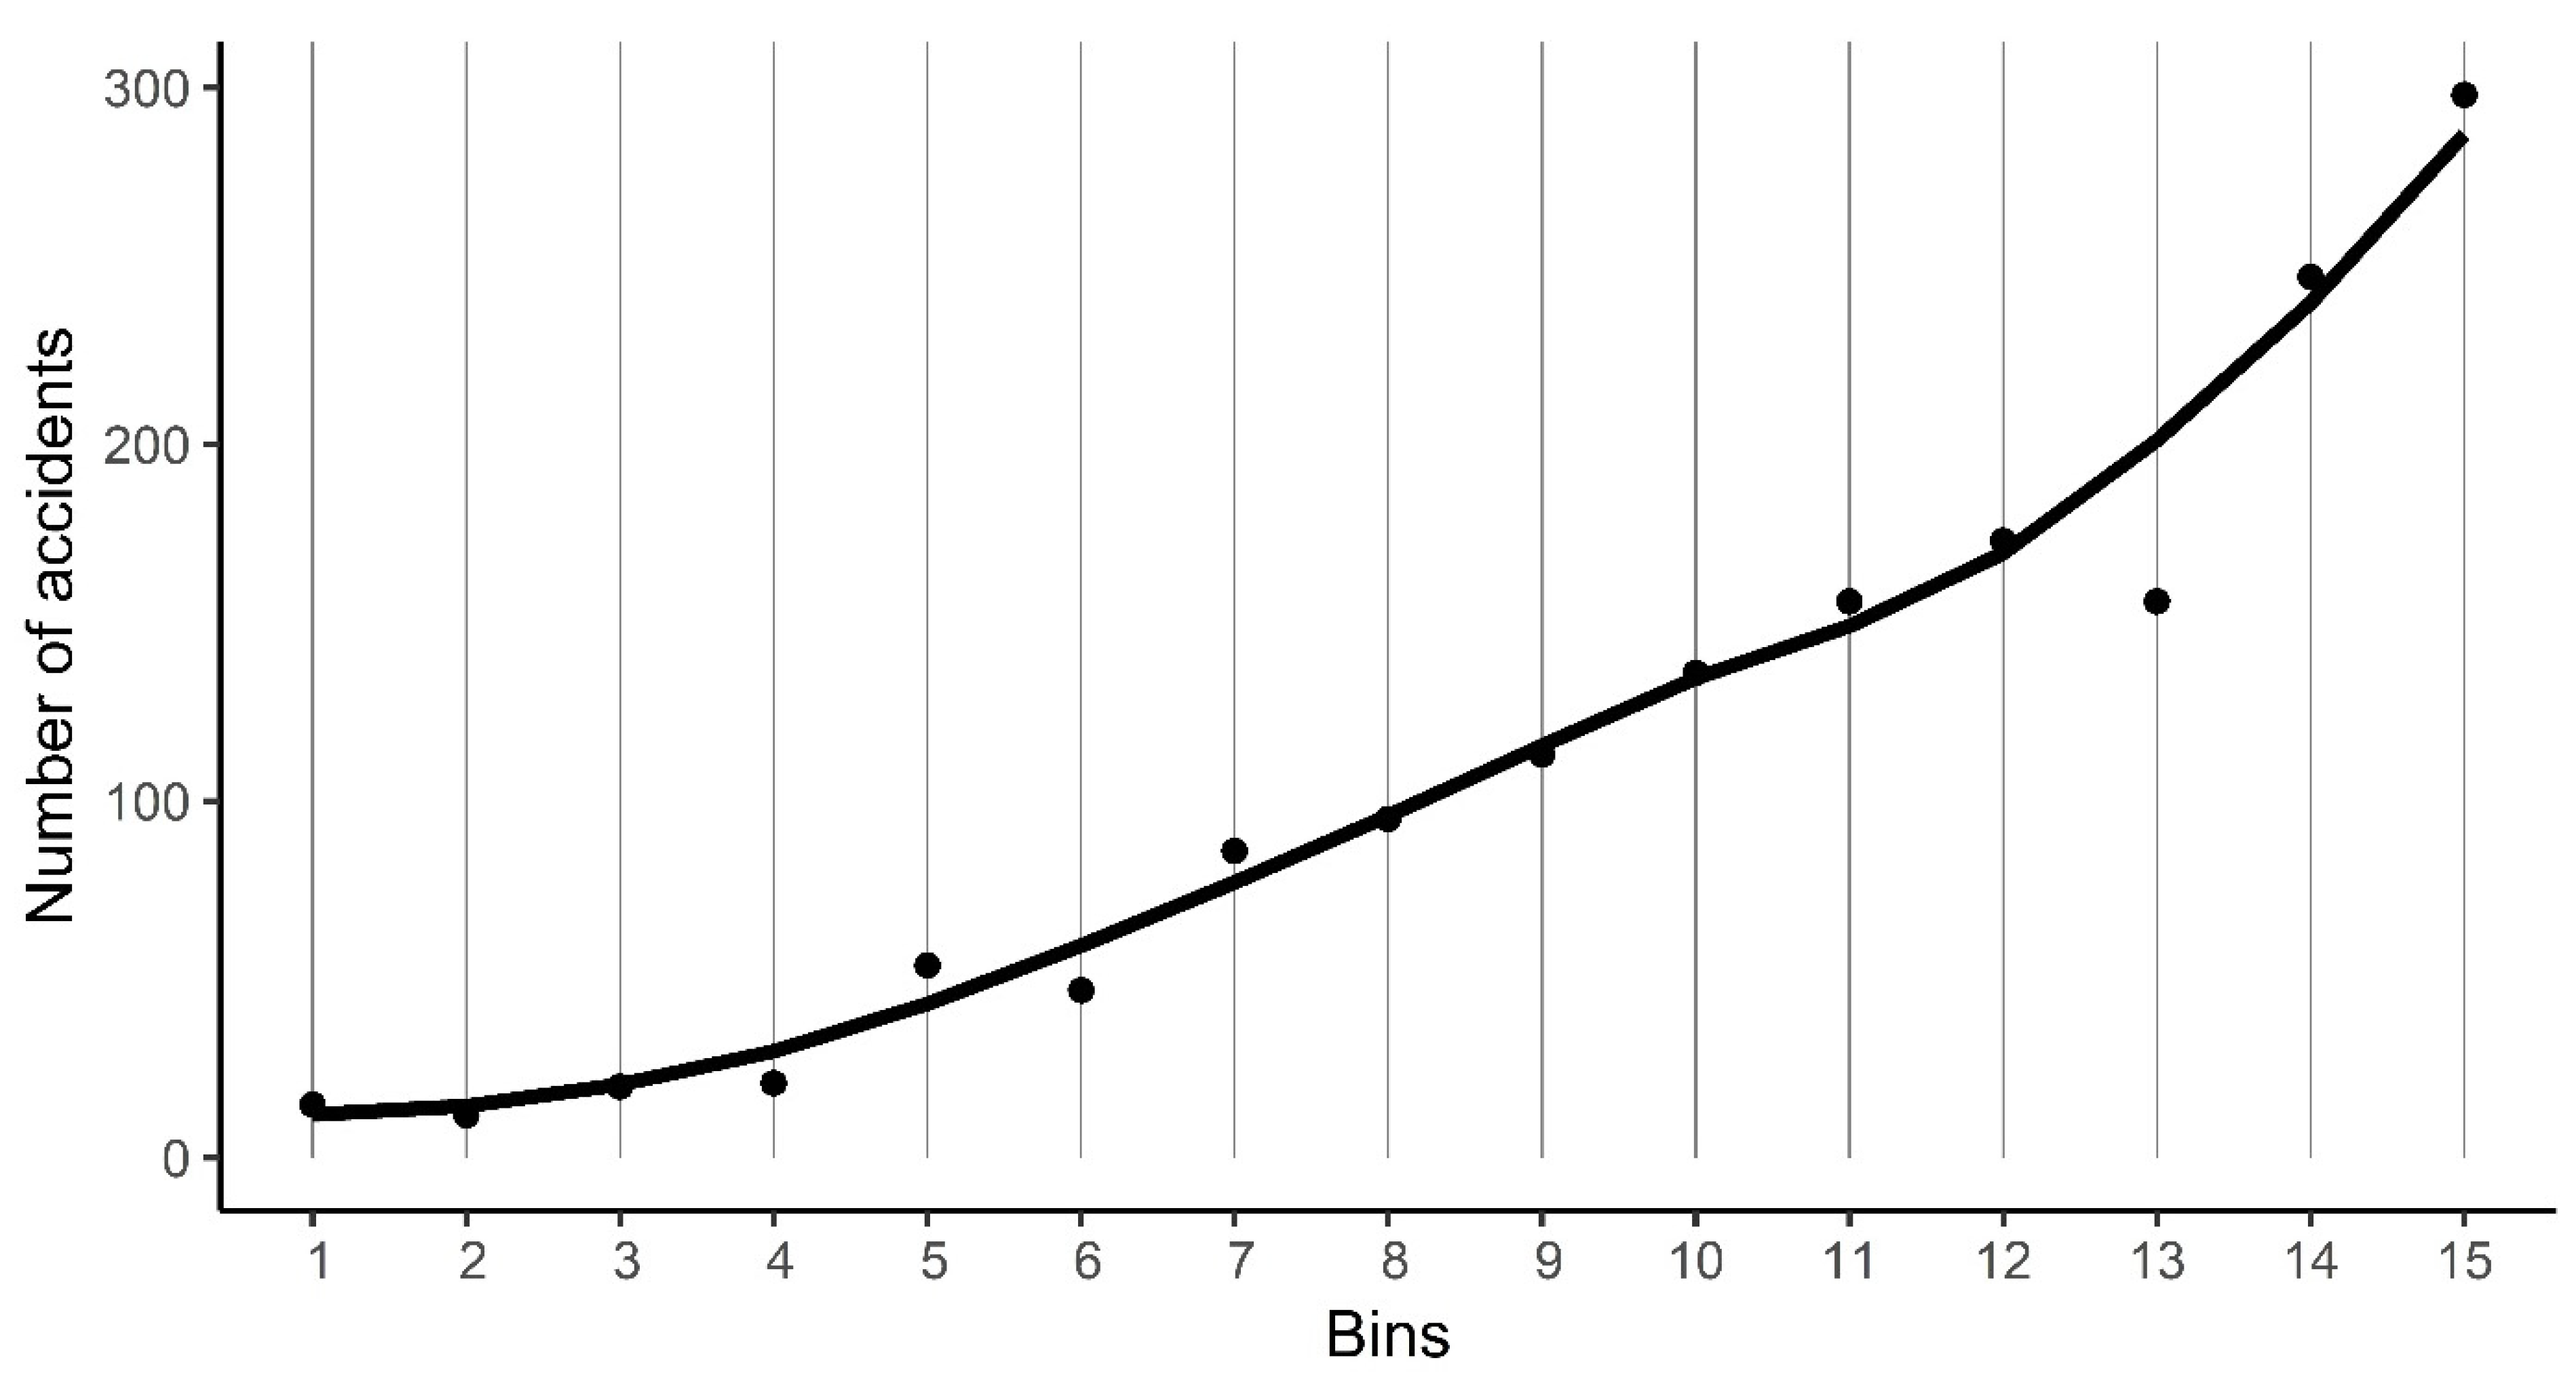
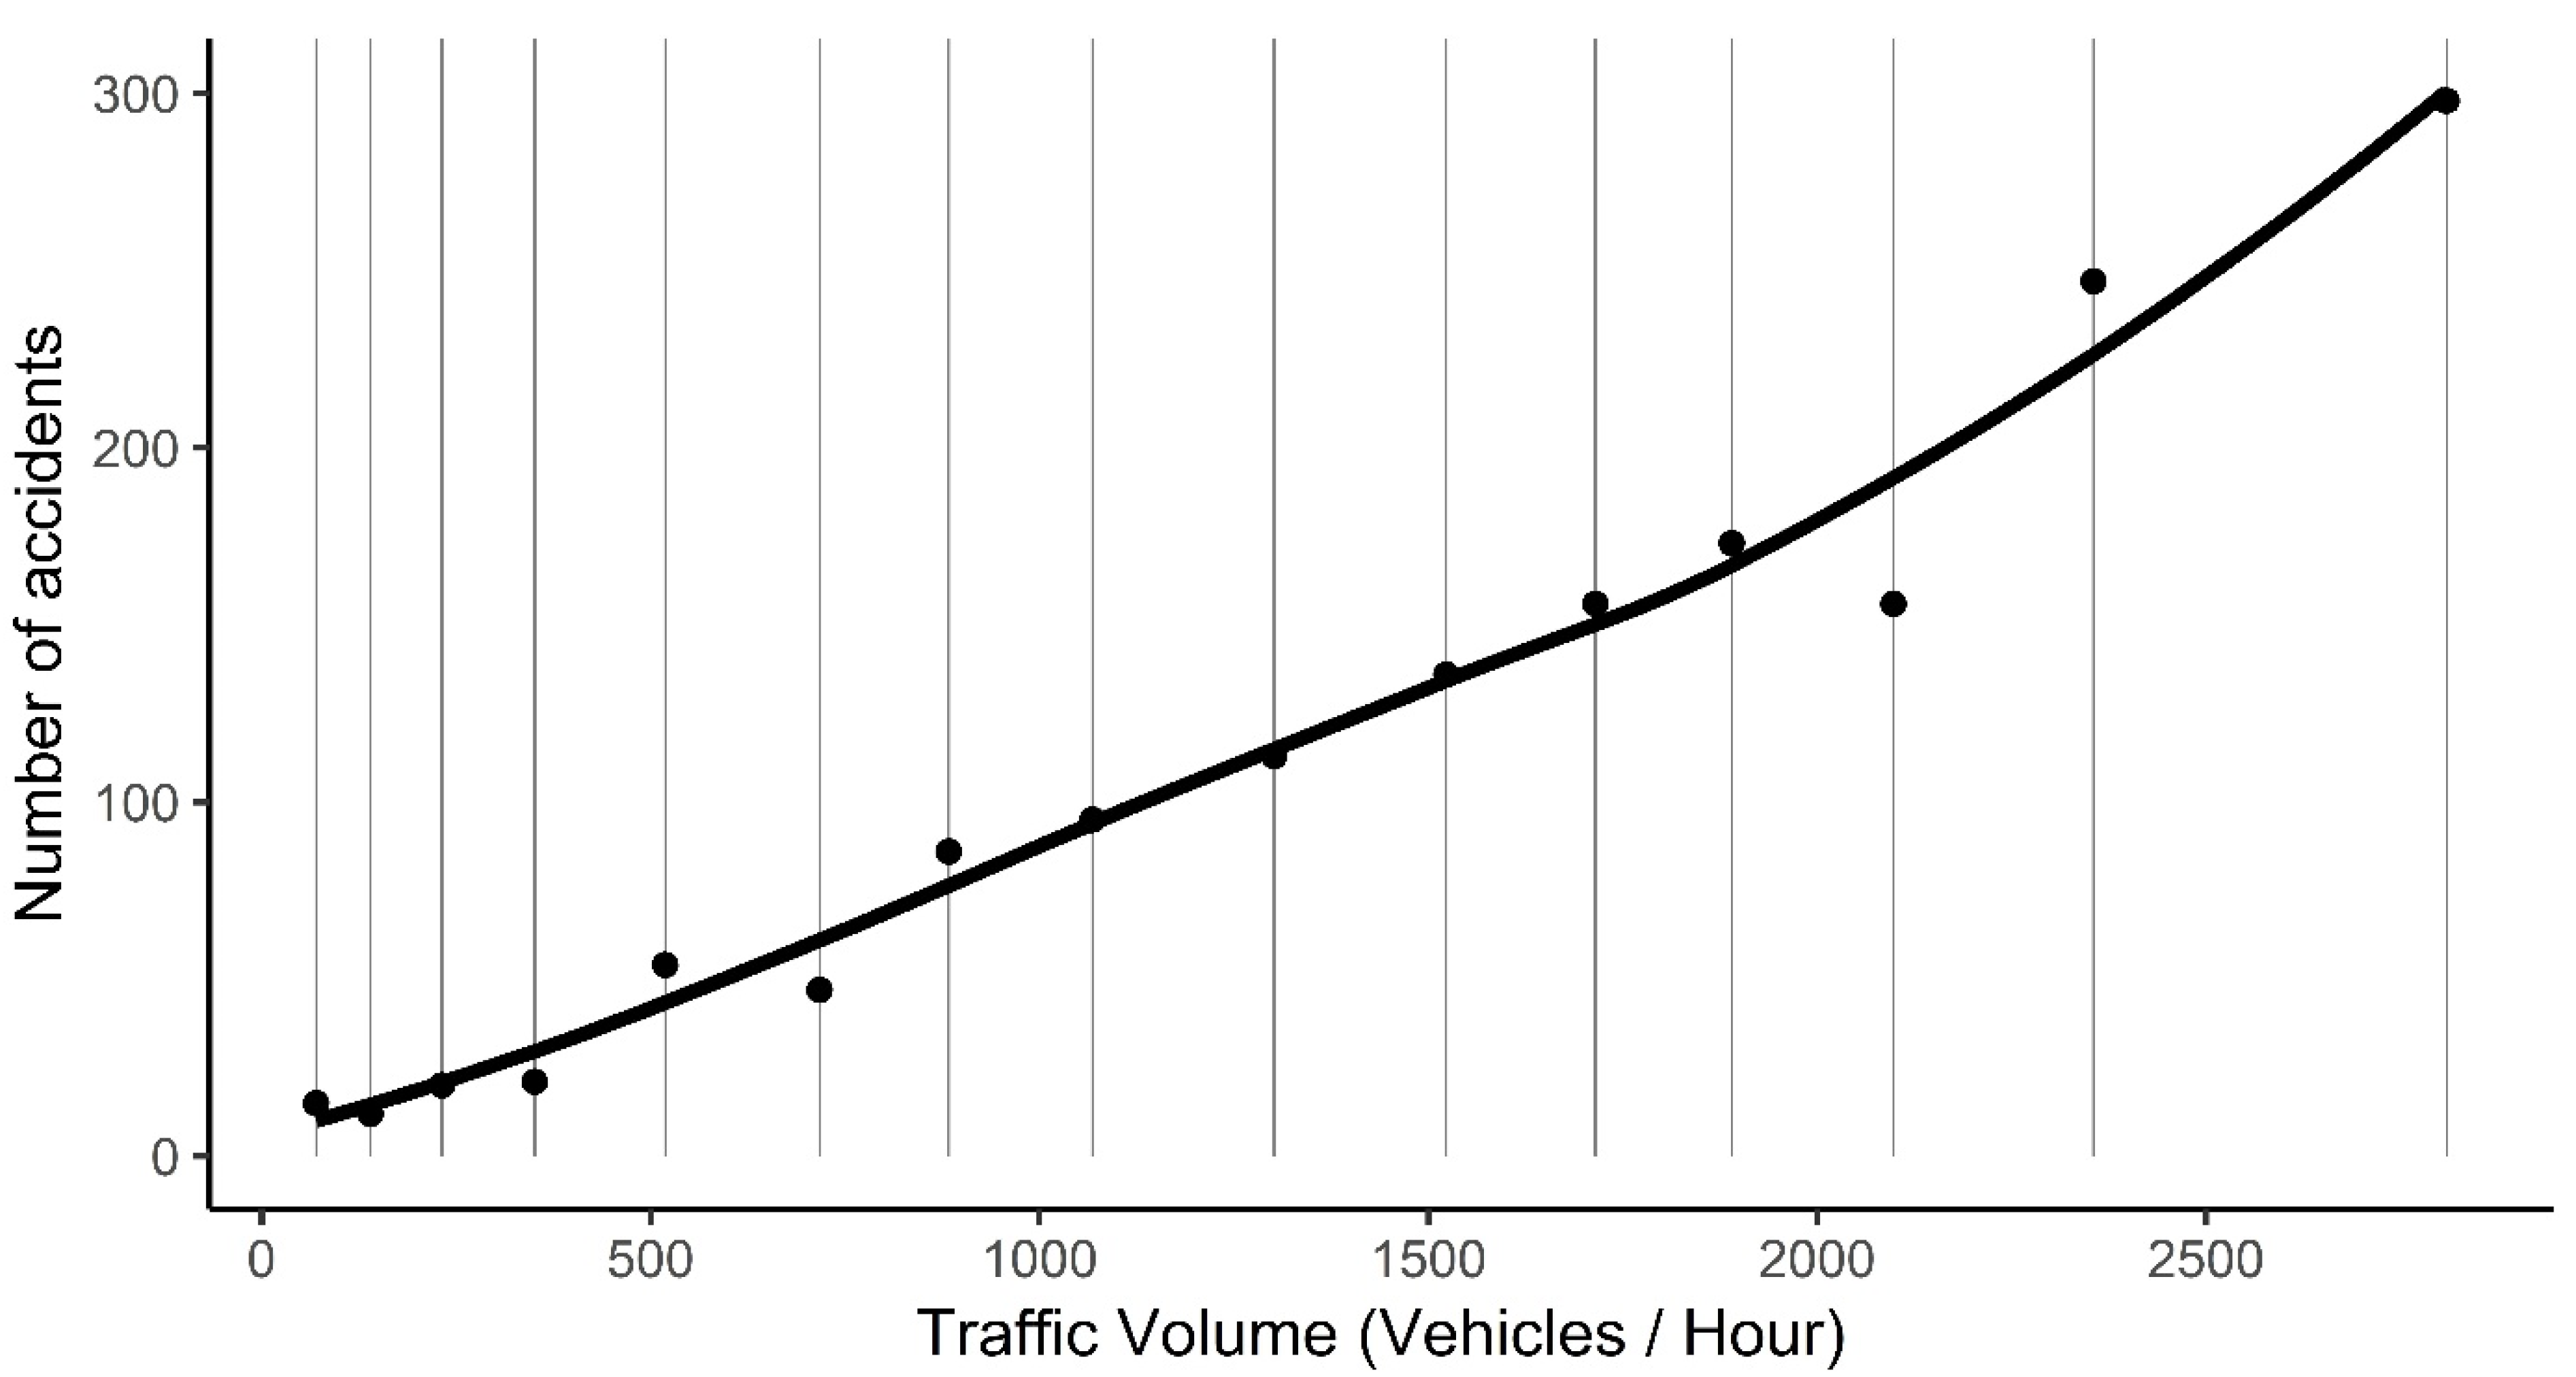
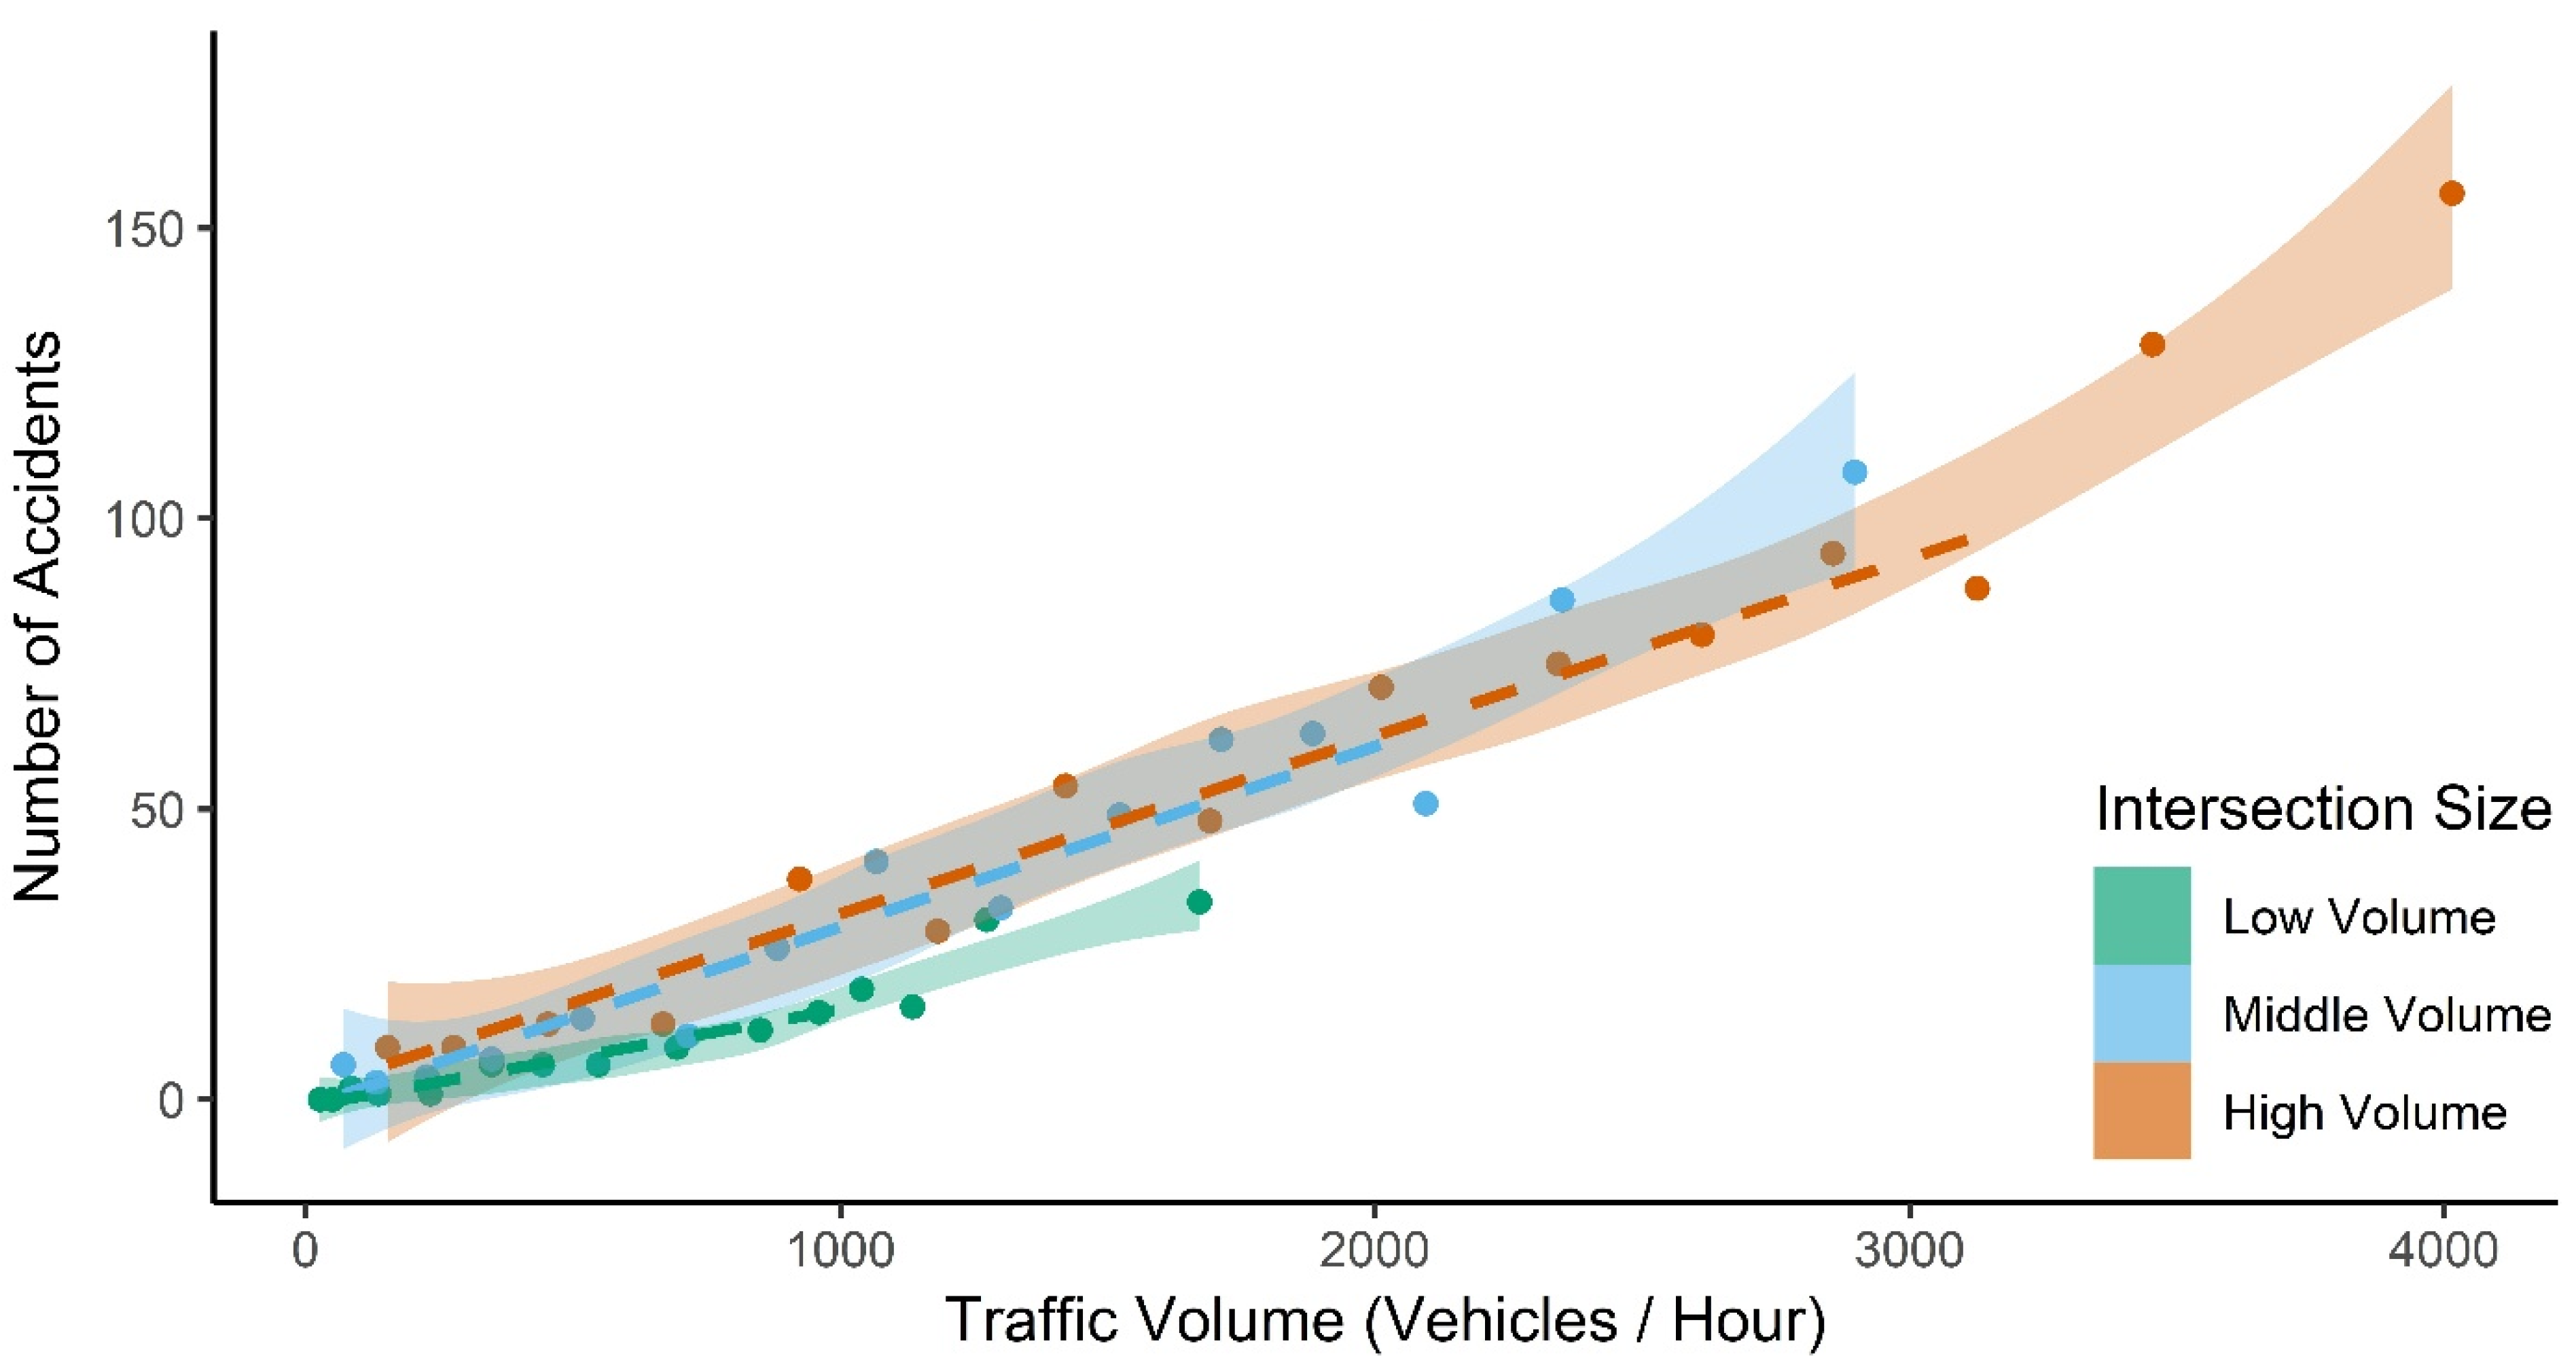
3.1. Relationship Between Traffic Volume and Accident Frequency
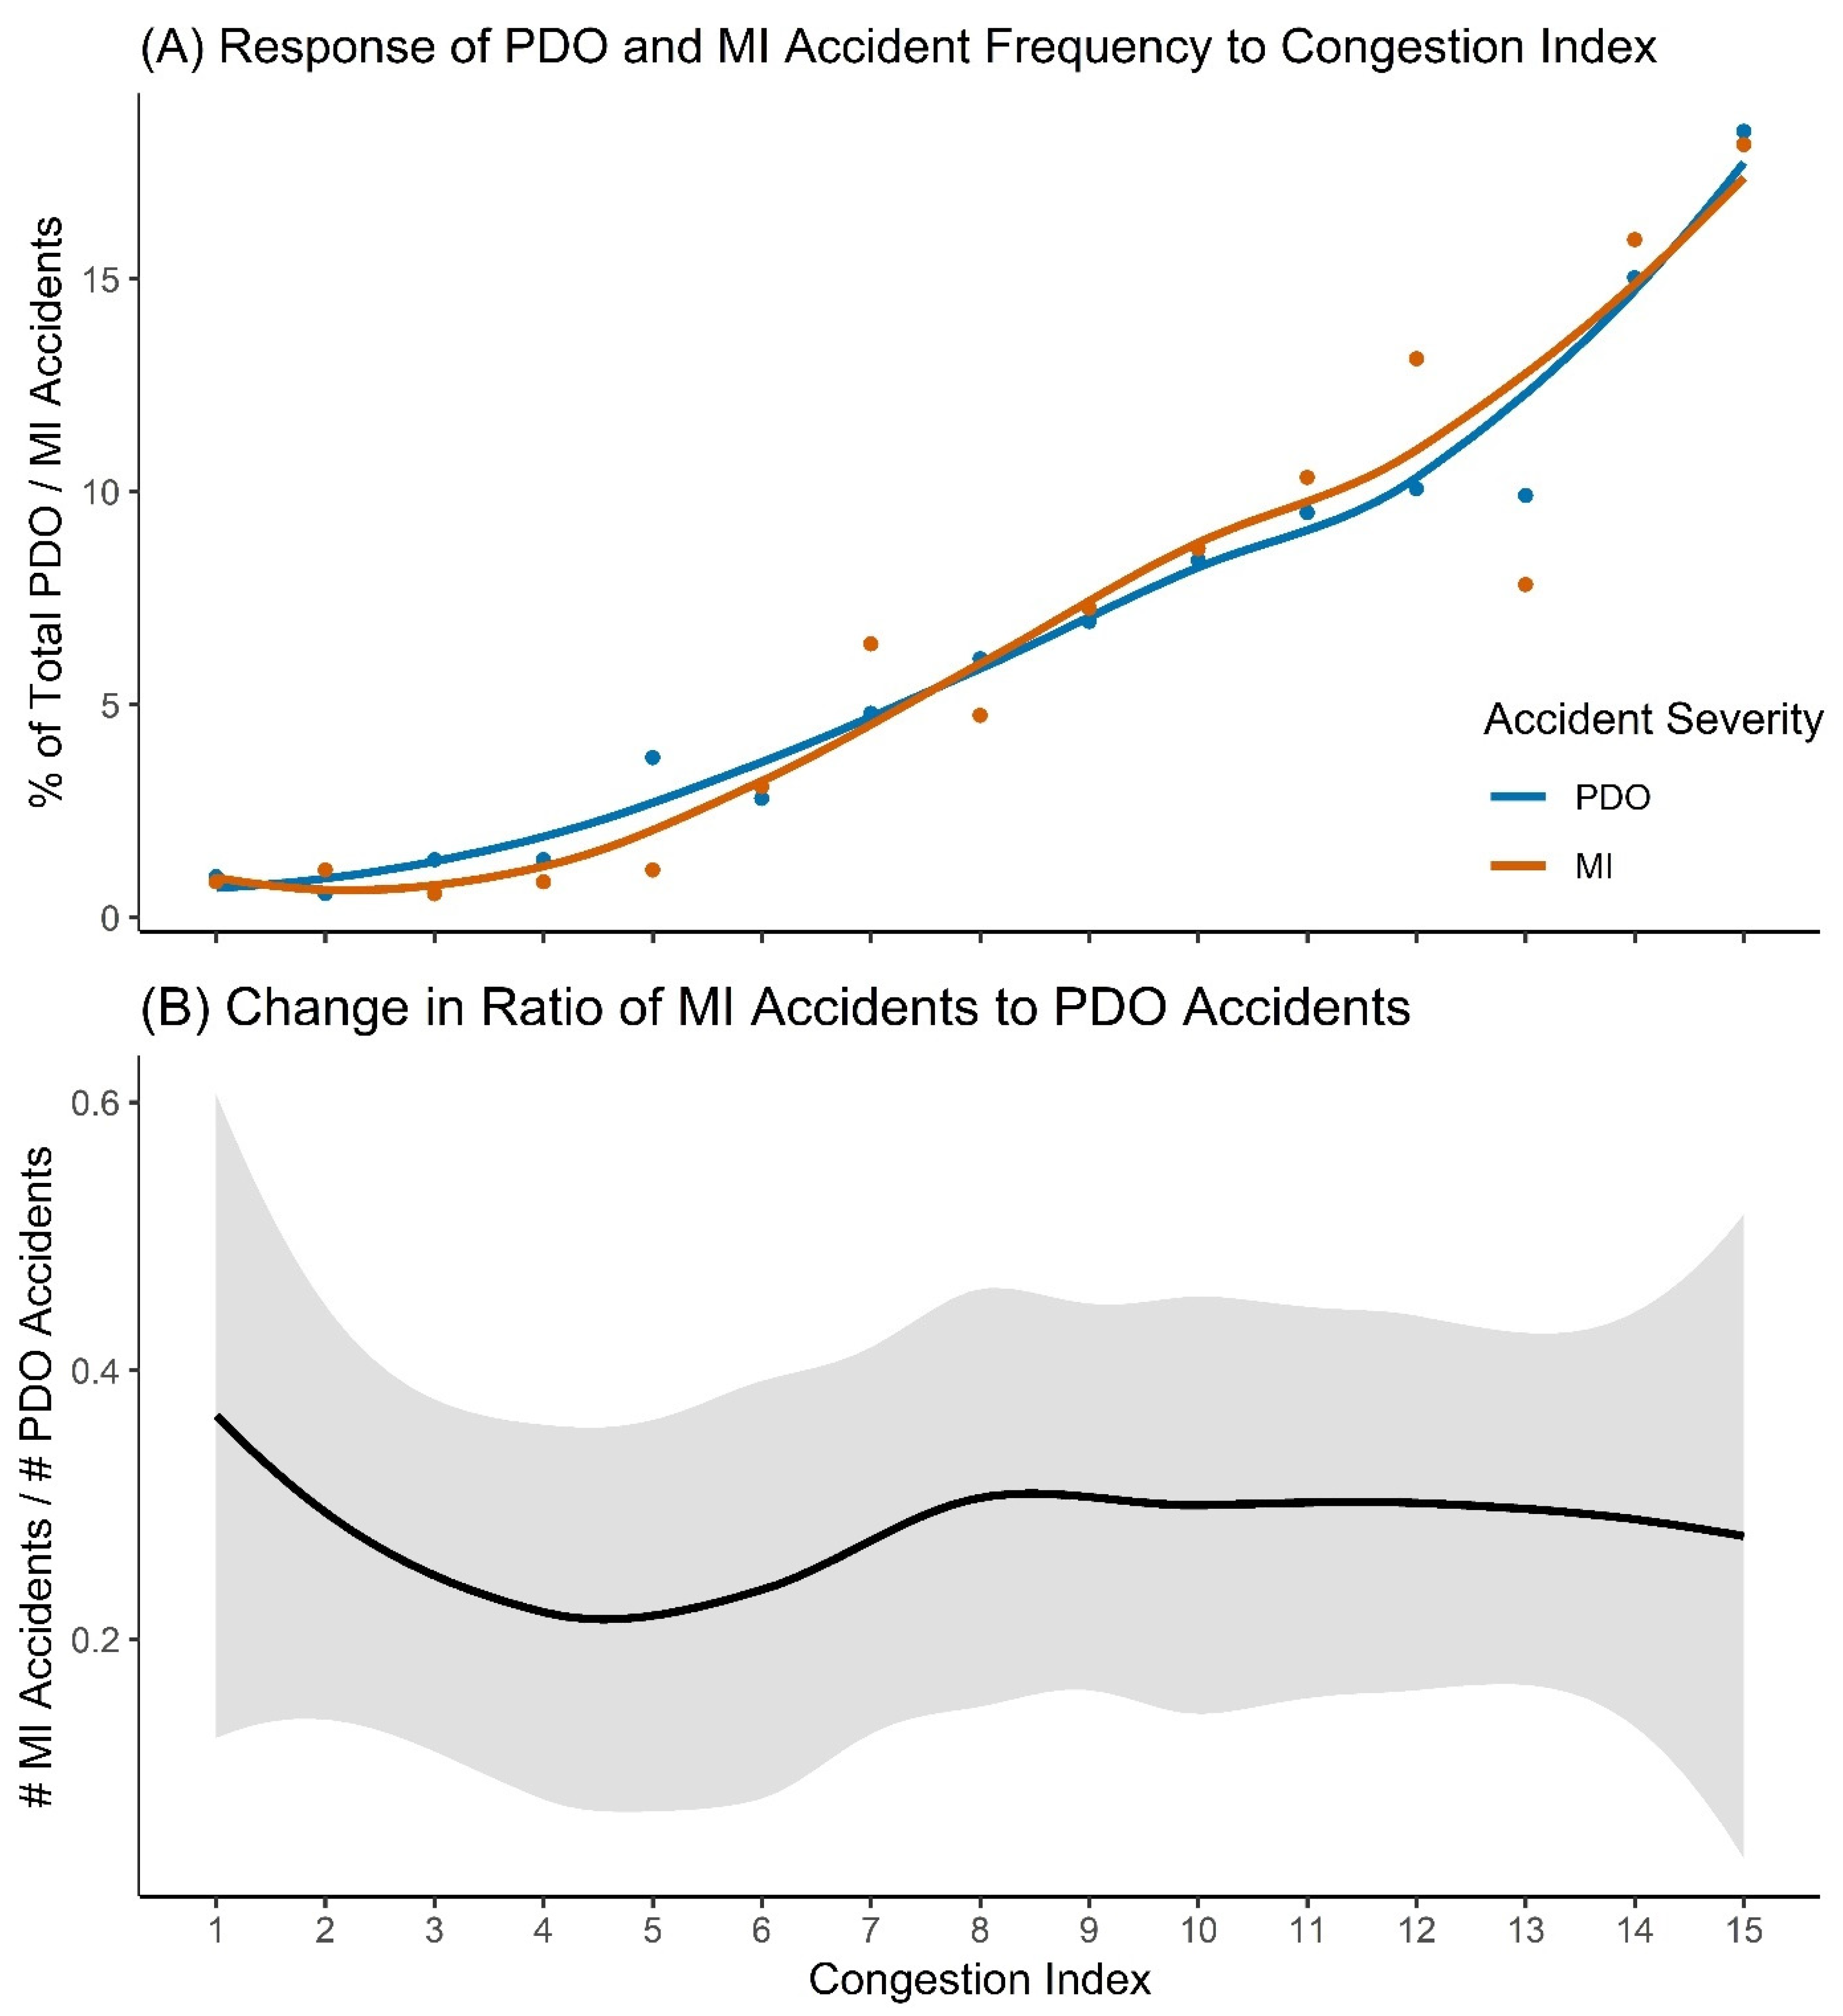
3.2. Accident Severity
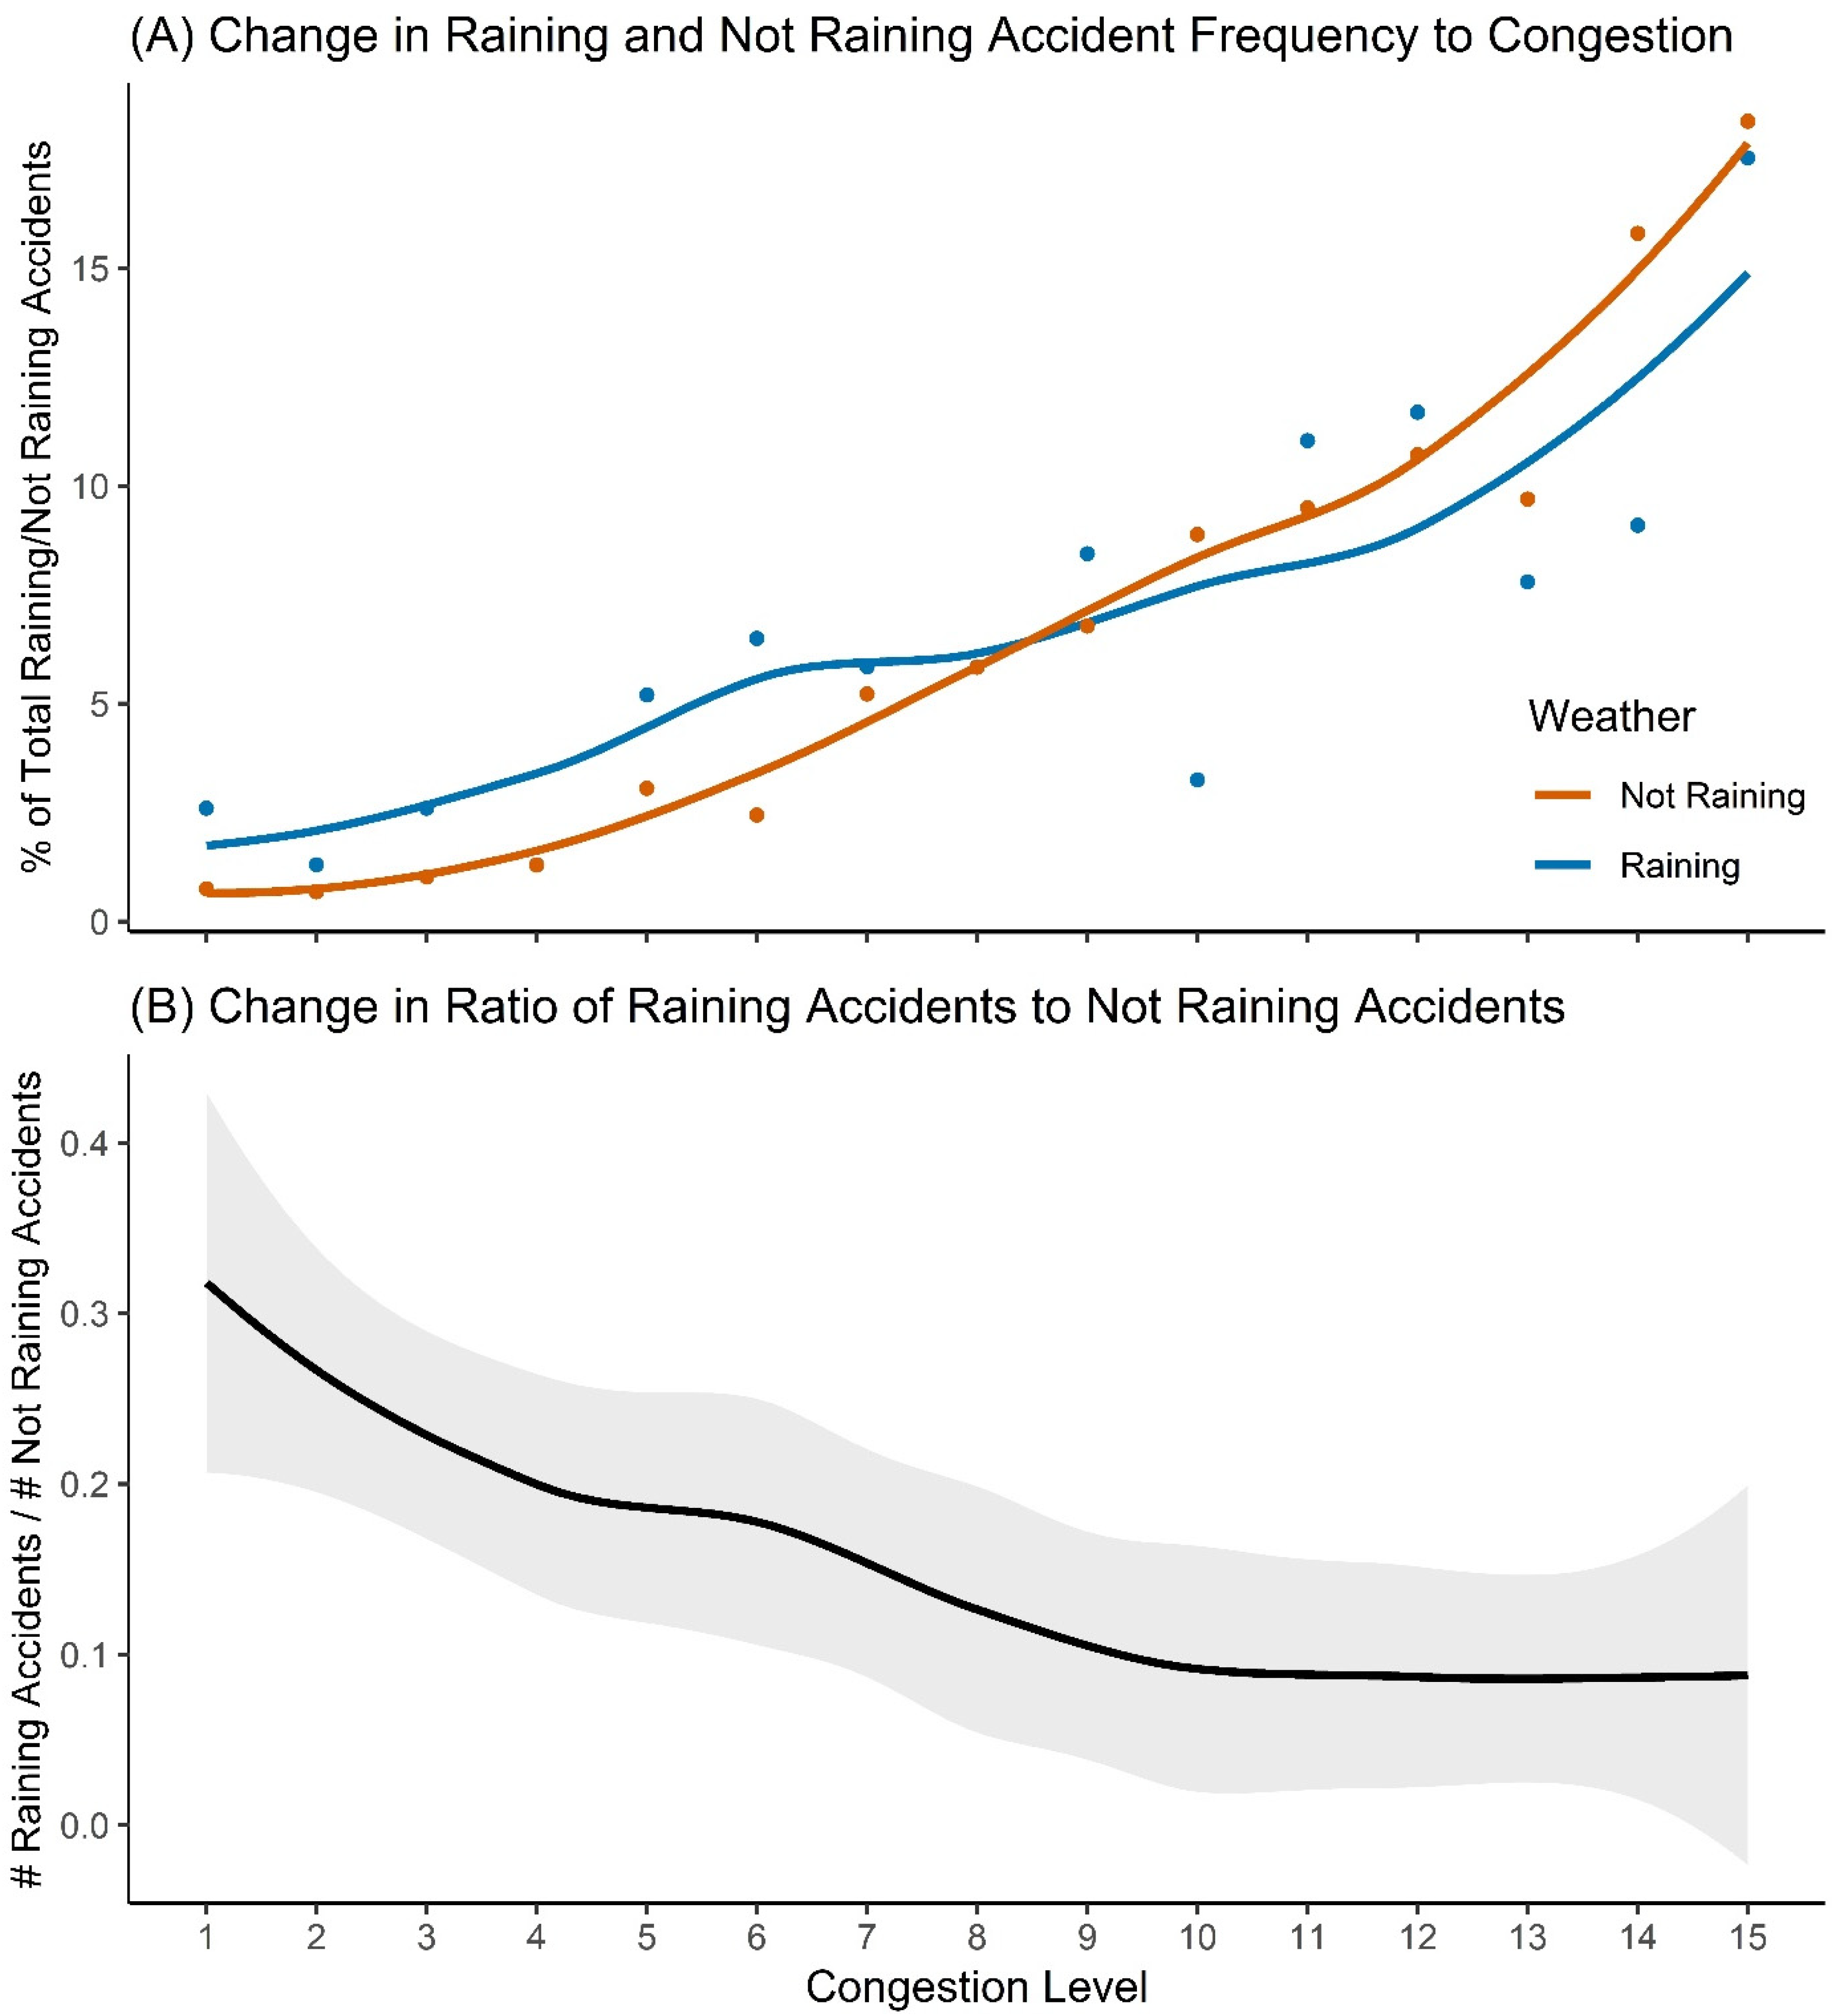
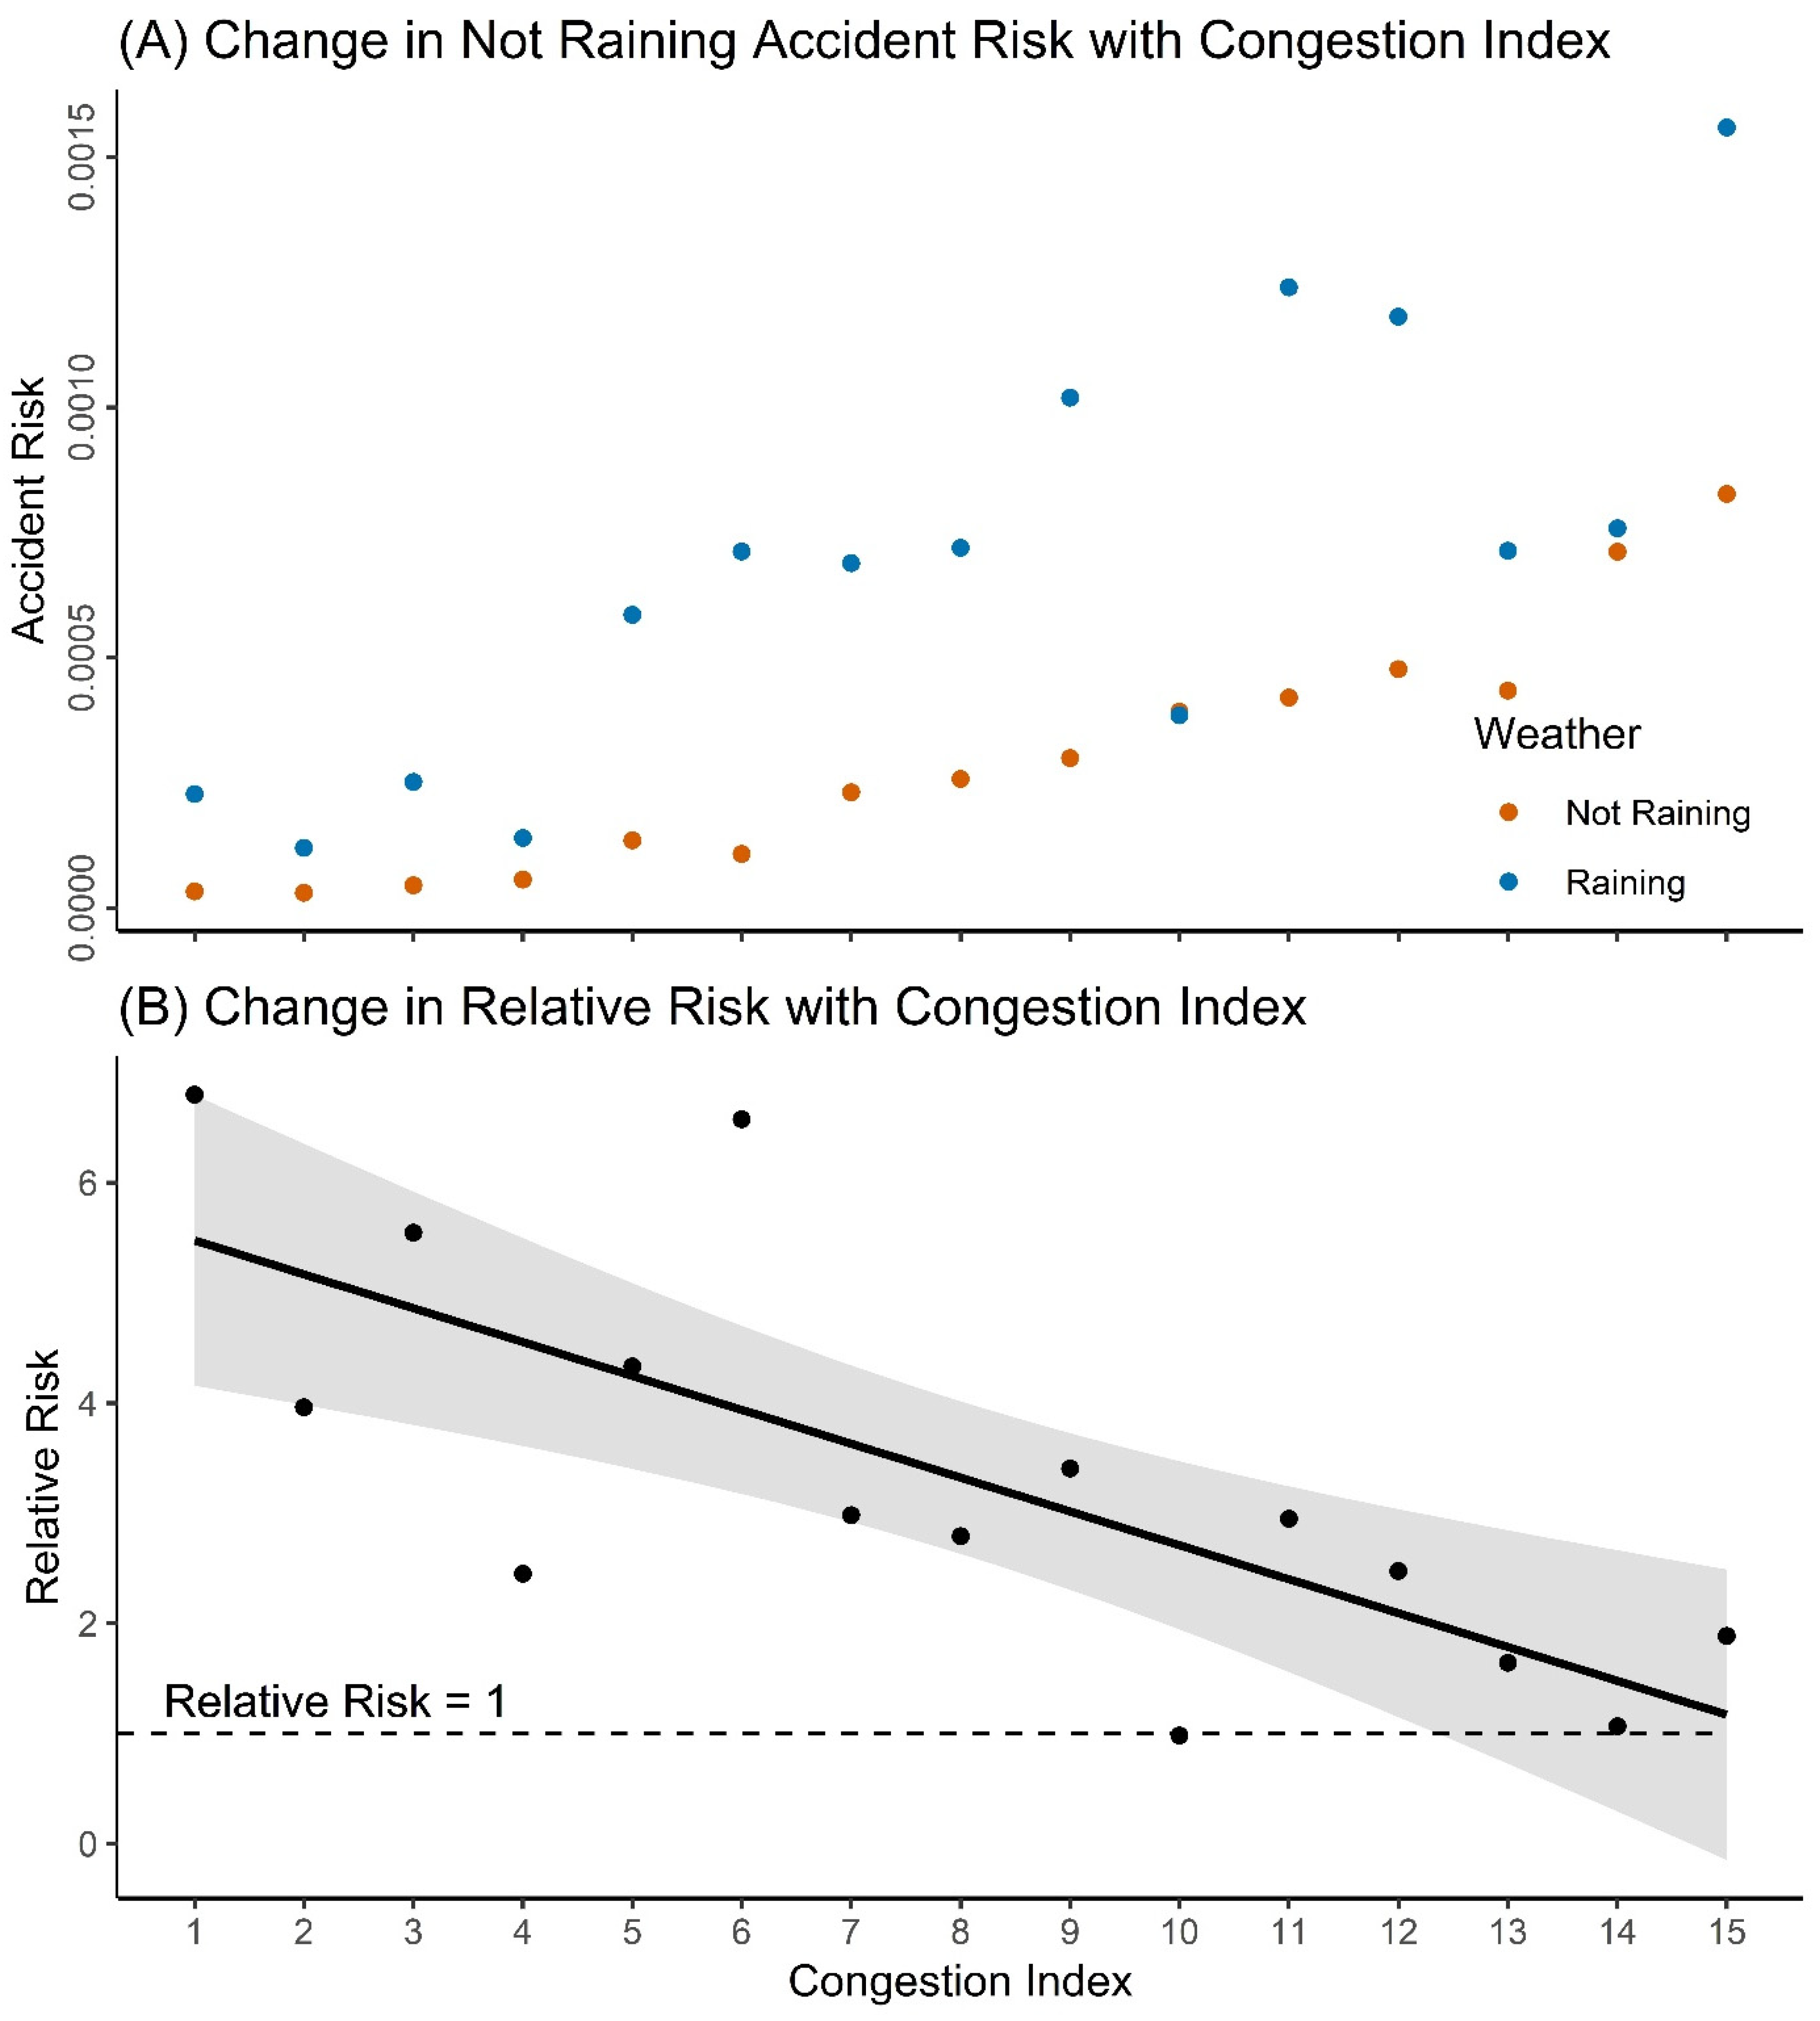
3.3. Rainfall Risk
4. Discussion
4.1. Relationship Between Traffic Volume and Accident Frequency
4.2. Accident Severity
4.3. Rainfall Risk
5. Conclusions
Author Contributions
Funding
Acknowledgments
Conflicts of Interest
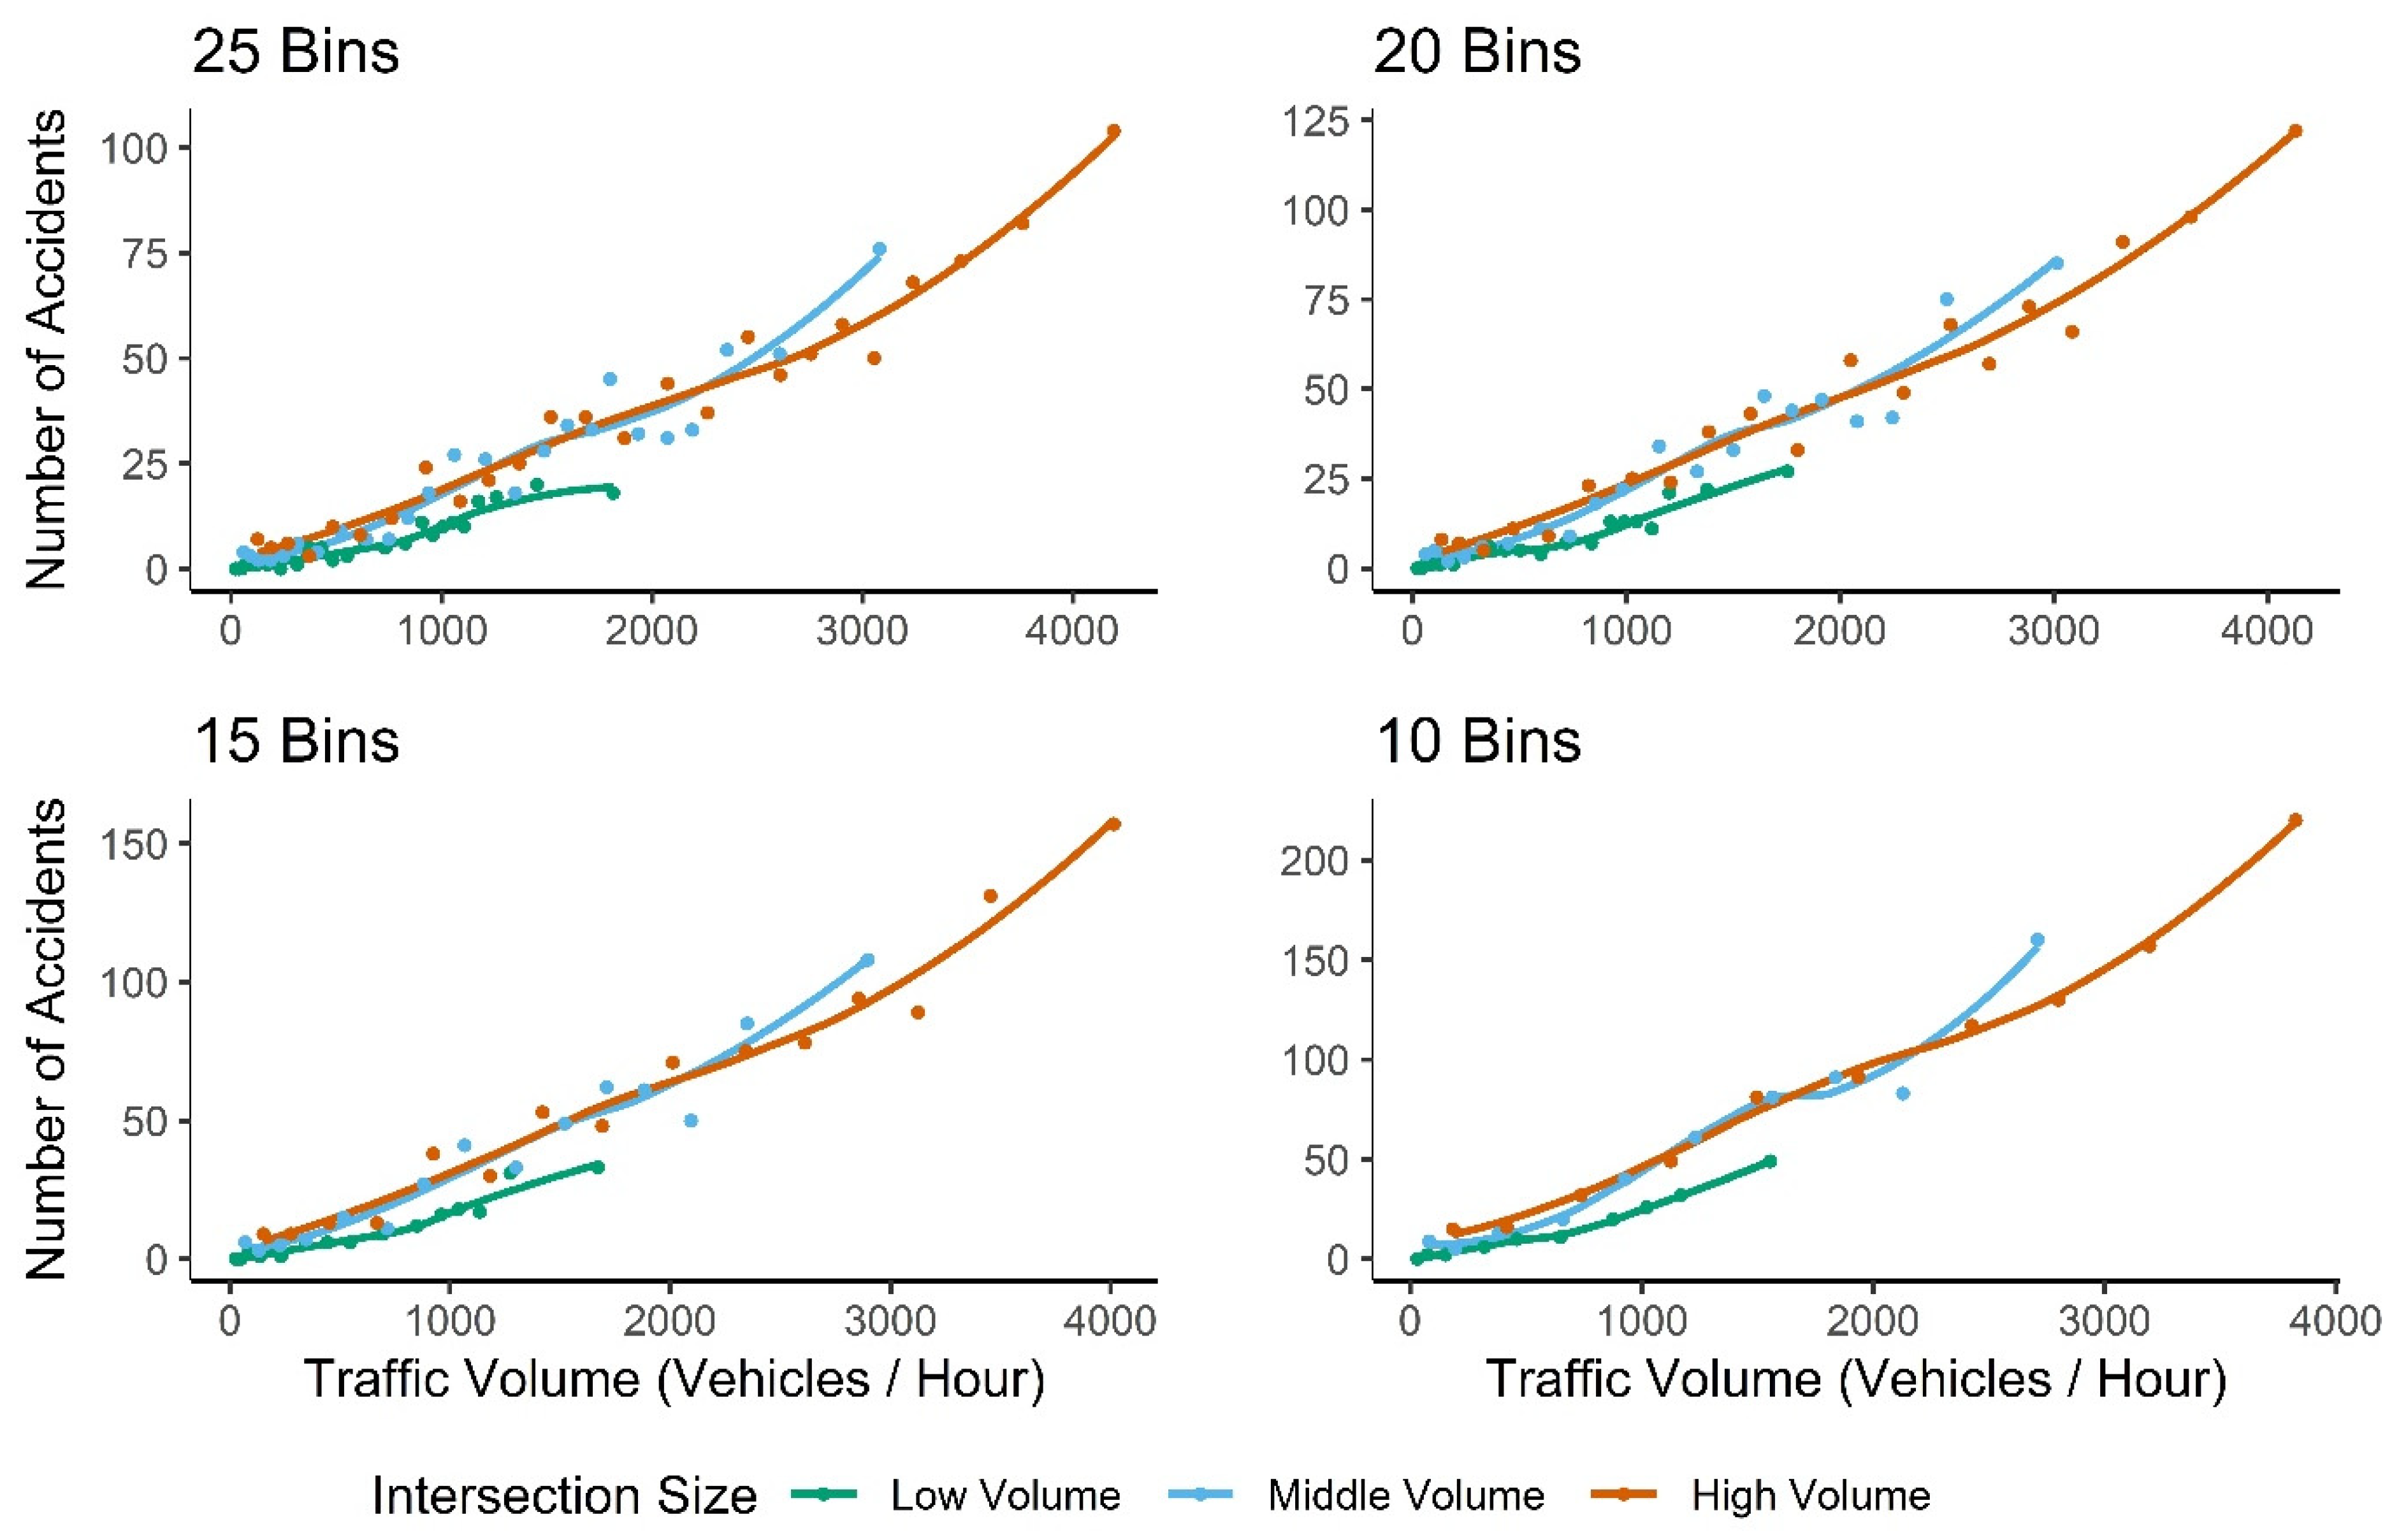
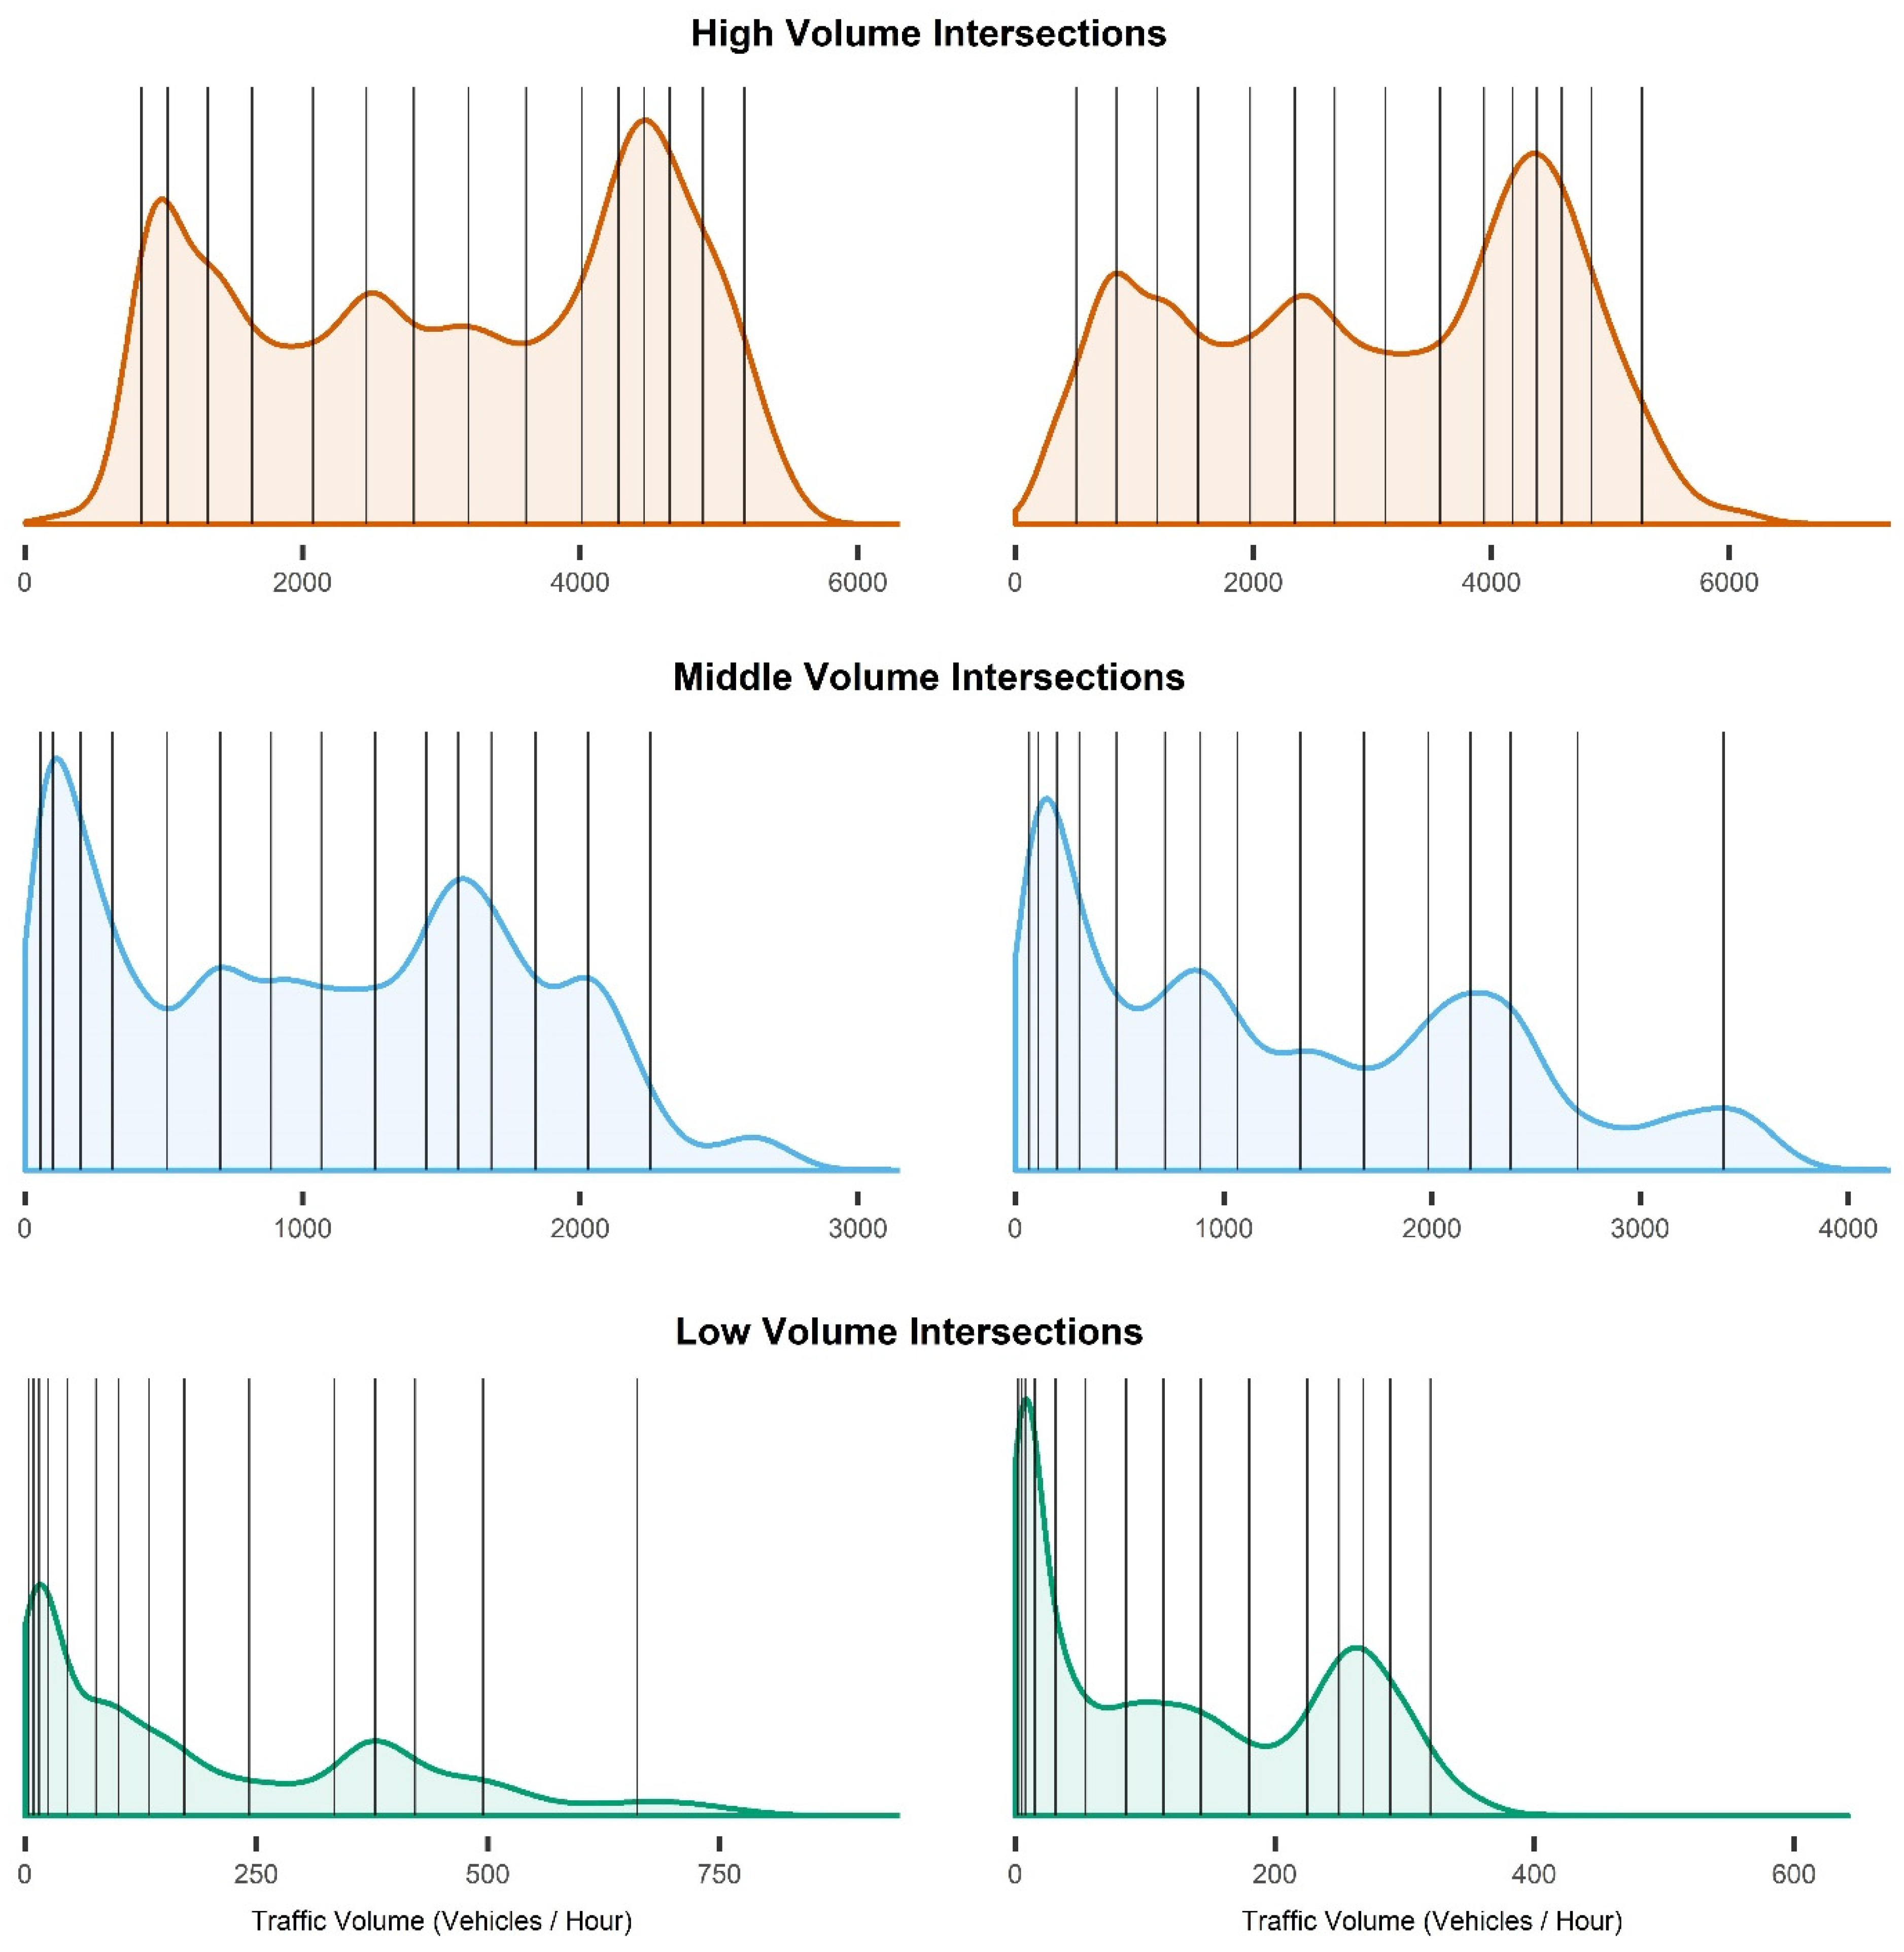
Appendix A. Determining the Ideal Number of Traffic Volume Bins

| Intersection Rank | Ideal Bin Width | Ideal number of Bins |
|---|---|---|
| Low-volume | 281.995 | 9.71 |
| Middle-volume | 299.131 | 16.69 |
| High-volume | 426.830 | 17.62 |
| All | 320.916 | 23.46 |

Appendix B. Calculating the Median Traffic Volumes of Congestion Levels
Appendix C. Effect of Traffic Volume on Accident Frequency

Appendix D. Normalised Not-Raining and Raining Accident Frequencies

References
- Litchfield, F. The Cost of Road Crashes in Australia 2016: An Overview of Safety Strategies; The Australian National University: Canberra, Australia, 2016. [Google Scholar]
- Hensher, D.A.; Rose, J.M.; Ortúzar, J.d.D.; Rizzi, L.I. Estimating the willingness to pay and value of risk reduction for car occupants in the road environment. Transp. Res. Part A Policy Pract. 2009, 43, 692–707. [Google Scholar] [CrossRef] [Green Version]
- BITRE. Road Crash Costs in Australia 2006; Bureau of Infrastructure, Transport and Regional Economics: Canberra, Australia, 2009; pp. 1–110.
- Evans, L. Traffic Safety and the Driver; Van Nostrand Reinhold: New York, NY, USA, 1991. [Google Scholar]
- BITRE. Impact of Road Trauma and Measures to Improve Outcomes; Department of Infrastructure and Regional Development: Canberra, Australia, 2014.
- BITRE. Road Trauma Australia 2018 Statistical Summary; Bureau of Infrastructure, Transport and Regional Economics: Canberra, Australia, 2019.
- Andreescu, M.-P.; Frost, D.B. Weather and traffic accidents in montreal, canada. Clim. Res. 1998, 9, 225–230. [Google Scholar] [CrossRef] [Green Version]
- Eisenberg, D. The mixed effects of precipitation on traffic crashes. Accid. Anal. Prev. 2004, 36, 637–647. [Google Scholar] [CrossRef]
- Keay, K.; Simmonds, I. Road accidents and rainfall in a large australian city. Accid. Anal. Prev. 2006, 38, 445–454. [Google Scholar] [CrossRef]
- Sherretz, L.A.; Farhar, B.C. An analysis of the relationship between rainfall and the occurrence of traffic accidents. J. Appl. Meteorol. 1978, 17, 711–715. [Google Scholar] [CrossRef] [Green Version]
- Veh, A. Improvements to Reduce Traffic Accidents; Meeting of the Highway Division: New York, NY, USA, 1937; pp. 1775–1785. [Google Scholar]
- Ivan, J.N.; Wang, C.Y.; Bernardo, N.R. Explaining two-lane highway crash rates using land use and hourly exposure. Accid. Anal. Prev. 2000, 32, 787–795. [Google Scholar] [CrossRef]
- Shefer, D.; Rietveld, P. Congestion and safety on highways: Towards an analytical model. Urban Stud. 1997, 34, 679–692. [Google Scholar] [CrossRef]
- Lie, A.; Tingvall, C.; Krafft, M.; Kullgren, A. The effectiveness of electronic stability control (esc) in reducing real life crashes and injuries. Traffic Inj. Prev. 2006, 7, 38–43. [Google Scholar] [CrossRef]
- Iversen, H.; Rundmo, T. Personality, risky driving and accident involvement among norwegian drivers. Personal. Ind. Differ. 2002, 33, 1251–1263. [Google Scholar] [CrossRef]
- Horwood, L.J.; Fergusson, D.M. Drink driving and traffic accidents in young people. Accid. Anal. Prev. 2000, 32, 805–814. [Google Scholar] [CrossRef]
- Washington, S.; Metarko, J.; Fomunung, I.; Ross, R.; Julian, F.; Moran, E. An inter-regional comparison: Fatal crashes in the southeastern and non-southeastern united states: Preliminary findings. Accid. Anal. Prev. 1999, 31, 135–146. [Google Scholar] [CrossRef]
- O’donnell, C.; Connor, D. Predicting the severity of motor vehicle accident injuries using models of ordered multiple choice. Accid. Anal. Prev. 1996, 28, 739–753. [Google Scholar] [CrossRef]
- Shankar, V.; Mannering, F.; Barfield, W. Effect of roadway geometrics and environmental-factors on rural freeway accident frequencies. Accid. Anal. Prev. 1995, 27, 371–389. [Google Scholar] [CrossRef]
- Milton, J.; Mannering, F. The relationship among highway geometrics, traffic-related elements and motor-vehicle accident frequencies. Transportation 1998, 25, 395–413. [Google Scholar] [CrossRef]
- Wang, C.; Quddus, M.; Ison, S. A spatio-temporal analysis of the impact of congestion on traffic safety on major roads in the uk. Transp. A Transp. Sci. 2013, 9, 124–148. [Google Scholar] [CrossRef] [Green Version]
- Retallack, A.E.; Ostendorf, B. Current understanding of the effects of congestion on traffic accidents. Int. J. Environ. Res. Public Health 2019, 16, 3400. [Google Scholar] [CrossRef] [Green Version]
- Raff, M.S. Interstate highway—Accident study. Highw. Res. Board Bull. 1953, 74, 18–45. [Google Scholar]
- Woo, J.C. Correlation of Accident Rates and Roadway Factors; Purdue University: Lafaytette, IN, USA, 1957; pp. 2326–6325. [Google Scholar]
- Schoppert, D.W. Predicting traffic accidents from roadway elements of rural two-lane highways with gravel shoulders. Highw. Res. Board Bull. 1957, 158, 4–26. [Google Scholar]
- Head, J.A. Predicting traffic accidents from roadway elements on urban extensions of state highways. Highw. Res. Board Bull. 1959, 208, 45–63. [Google Scholar]
- Cadar, R.D.; Boitor, M.R.; Dumitrescu, M. Effects of traffic volumes on accidents: The case of romania’s national roads. Geogr. Tech. 2017, 12, 20–29. [Google Scholar]
- Vitaliano, D.F.; Held, J. Road accident external effects: An empirical assessment. Appl. Econ. 1991, 23, 373–378. [Google Scholar] [CrossRef]
- Gwynn, D.W. Relationship of accident rates and accident involvements with hourly volumes. Traffic Q. 1967, 21, 407–418. [Google Scholar]
- Ceder, A. Relationships between road accidents and hourly traffic flow—ii: Probabilistic approach. Accid. Anal. Prev. 1982, 14, 35–44. [Google Scholar] [CrossRef]
- Martin, J.-L. Relationship between crash rate and hourly traffic flow on interurban motorways. Accid. Anal. Prev. 2002, 34, 619–629. [Google Scholar] [CrossRef]
- Frantzeskakis, J.M.; Iordanis, D.I. Volume-to-capacity ratio and traffic accidents on interurban four-lane highways in greece. Transp. Res. Rec. 1987, 1112, 29–38. [Google Scholar]
- Shefer, D. Congestion, air-pollution, and road fatalities in urban areas. Accid. Anal. Prev. 1994, 26, 501–509. [Google Scholar] [CrossRef]
- Theofilatos, A. Incorporating real-time traffic and weather data to explore road accident likelihood and severity in urban arterials. J. Saf. Res. 2017, 61, 9–21. [Google Scholar] [CrossRef]
- Mannering, F.; Bhat, C.R. Analytic methods in accident research: Methodological frontier and future directions. Anal. Methods Accid. Res. 2014, 1, 1–22. [Google Scholar] [CrossRef]
- Transportation Research Board. Highway Capacity Manual—A Guide for Multimodal Mobility Analysis, 6th ed.; Transportation Research Board: Washington, DC, USA, 2016. [Google Scholar]
- R Core Team. R: A Language and Environment for Statistical Computing; R Foundation for Statistical Computing: Vienna, Austria, 2019. [Google Scholar]
- RStudio Team. Rstudio: Integrated Development for r; RStudio, Inc.: Boston, MA, USA, 2018. [Google Scholar]
- DPTI. Road Crash Data; DPTI: Adelaide, South Australia, 2019. [Google Scholar]
- Yuan, J.; Abdel-Aty, M. Approach-level real-time crash risk analysis for signalized intersections. Accid. Anal. Prev. 2018, 119, 274–289. [Google Scholar] [CrossRef] [Green Version]
- Ahmed, M.M.; Abdel-Aty, M.A. A data fusion framework for real-time risk assessment on freeways. Transp. Res. Part C Emerg. Technol. 2013, 26, 203–213. [Google Scholar] [CrossRef]
- City of Adelaide. Traffic Intersection Volumes; City of Adelaide: Adelaide, Australia, 2017. [Google Scholar]
- ISO. Date and Time—Representations for Information Interchange—Part 1: Basic Rules. Available online: https://www.iso.org/obp/ui#iso:std:iso:8601:-1:ed-1:v1:en (accessed on 9 September 2019).
- Bureau of Meteorology. Rainfall—Total Reported on Half Hourly: Adelaide (Kent Town); Bureau of Meteorology: Adelaide, South Australia, 2019.
- Akaike, H. Information theory and an extension of the maximum likelihood principle. In Selected Papers of Hirotugu Akaike; Parzen, E., Tanabe, K., Kitagawa, G., Eds.; Springer: New York, NY, USA, 1998; pp. 199–213. [Google Scholar]
- Tenny, S.; Hoffman, M.R. Relative risk. In Statpearls [Internet]; StatPearls Publishing: Treasure Island, FL, USA, 2019. [Google Scholar]
- Burnham, K.P.; Anderson, D.R. Multimodel inference: Understanding aic and bic in model selection. Sociol. Methods Res. 2004, 33, 261–304. [Google Scholar] [CrossRef]
- Dickerson, A.; Peirson, J.; Vickerman, R. Road accidents and traffic flows: An econometric investigation. Economica 2000, 67, 101–121. [Google Scholar] [CrossRef] [Green Version]
- Zhou, M.; Sisiopiku, V.P. Relationship between volume-to-capacity ratios and accident rates. Transp. Res. Rec. 1997, 1581, 47–52. [Google Scholar] [CrossRef]
- Hossain, M.; Abdel-Aty, M.; Quddus, M.A.; Muromachi, Y.; Sadeek, S.N. Real-time crash prediction models: State-of-the-art, design pathways and ubiquitous requirements. Accid. Anal. Prev. 2019, 124, 66–84. [Google Scholar] [CrossRef] [PubMed] [Green Version]
- Sullivan, E.C. Estimating accident benefits of reduced freeway congestion. J. Transp. Eng. 1990, 116, 167–180. [Google Scholar] [CrossRef]
- Rao, A.M.; Rao, K.R. Measuring urban traffic congestion-a review. Int. J. Traffic Transp. Eng. 2012, 2, 286–305. [Google Scholar]
- Mussone, L.; Bassani, M.; Masci, P. Analysis of factors affecting the severity of crashes in urban road intersections. Accid. Anal. Prev. 2017, 103, 112–122. [Google Scholar] [CrossRef]
- Abdel-Aty, M.; Keller, J. Exploring the overall and specific crash severity levels at signalized intersections. Accid. Anal. Prev. 2005, 37, 417–425. [Google Scholar] [CrossRef]
- Andrey, J.; Mills, B.; Leahy, M.; Suggett, J. Weather as a chronic hazard for road transportation in canadian cities. Nat. Hazards 2003, 28, 319–343. [Google Scholar] [CrossRef]
- Andrey, J. Long-term trends in weather-related crash risks. J. Transp. Geogr. 2010, 18, 247–258. [Google Scholar] [CrossRef]
- Dai, C. Exploration of Weather Impacts on Freeway Traffic Operations and Safety Using High-Resolution Weather Data; Portland State University: Portland, OR, USA, 2011. [Google Scholar]
- Hambly, D.; Andrey, J.; Mills, B.; Fletcher, C. Projected implications of climate change for road safety in greater vancouver, canada. Clim. Chang. 2013, 116, 613–629. [Google Scholar] [CrossRef]
- Sun, X.; Hu, H.; Habib, E.; Magri, D. Quantifying crash risk under inclement weather with radar rainfall data and matched-pair method. J. Transp. Saf. Secur. 2011, 3, 1–14. [Google Scholar] [CrossRef]
- Jaroszweski, D.; McNamara, T. The influence of rainfall on road accidents in urban areas: A weather radar approach. Travel Behav. Soc. 2014, 1, 15–21. [Google Scholar] [CrossRef] [Green Version]
- Freedman, D.; Diaconis, P. On the histogram as a density estimator: L2 theory. Probab. Theory Relat. Fields 1981, 57, 453–476. [Google Scholar]


| Raw | Processed | |
|---|---|---|
| Spatial Extent | South Australia | ACC |
| Temporal Extent | 2010–2017 | 2010–2014 |
| n | 146,718 | 2336 |
| Raw | Processed | |
|---|---|---|
| Spatial extent | ACC intersections | |
| Temporal extent | 2010–2014 | |
| Temporal resolution | 60 minutes | |
| Measurement resolution | 1 vehicle | |
| Number of intersections | 122 | 120 |
| n | 5,369,323 | 5,213,580 |
| Accident volumes | |
|---|---|
| Spatial extent | ACC intersections |
| Temporal extent | 2010–2014 |
| n | 1629 |
| Intersection Rank | Dispersion Ratio | Pearson’s Chi2 | p-Value | Overdispersed |
|---|---|---|---|---|
| Low-volume | 1.37 | 17.82 | 0.164 | No |
| Middle-volume | 3.77 | 48.99 | <0.001 | Yes |
| High-volume | 3.25 | 42.25 | <0.001 | Yes |
| Model | d.f. | Log Lik. | AICc | Delta AICc | Weight | Evidence Ratio |
|---|---|---|---|---|---|---|
| Low-volume intersections | ||||||
| Quadratic | 3 | −30.57 | 69.3 | - | 0.938 | 17.7 |
| Natural spline | 5 | −29.21 | 75.1 | 5.8 | 0.053 | - |
| Linear | 2 | −36.82 | 78.6 | 9.3 | 0.009 | - |
| Middle-volume intersections | ||||||
| Quadratic | 4 | −48.05 | 108.1 | - | 0.912 | 11.5 |
| Natural spline | 6 | −45.25 | 113.0 | 4.9 | 0.079 | - |
| Linear | 3 | −54.57 | 117.3 | 9.2 | 0.009 | - |
| High-volume intersections | ||||||
| Quadratic | 4 | −53.55 | 119.1 | - | 0.634 | 1.80 |
| Natural spline | 6 | −48.89 | 120.3 | 1.2 | 0.352 | - |
| Linear | 3 | −59.34 | 126.9 | 7.8 | 0.013 | - |
© 2020 by the authors. Licensee MDPI, Basel, Switzerland. This article is an open access article distributed under the terms and conditions of the Creative Commons Attribution (CC BY) license (http://creativecommons.org/licenses/by/4.0/).
Share and Cite
Retallack, A.E.; Ostendorf, B. Relationship Between Traffic Volume and Accident Frequency at Intersections. Int. J. Environ. Res. Public Health 2020, 17, 1393. https://doi.org/10.3390/ijerph17041393
Retallack AE, Ostendorf B. Relationship Between Traffic Volume and Accident Frequency at Intersections. International Journal of Environmental Research and Public Health. 2020; 17(4):1393. https://doi.org/10.3390/ijerph17041393
Chicago/Turabian StyleRetallack, Angus Eugene, and Bertram Ostendorf. 2020. "Relationship Between Traffic Volume and Accident Frequency at Intersections" International Journal of Environmental Research and Public Health 17, no. 4: 1393. https://doi.org/10.3390/ijerph17041393
APA StyleRetallack, A. E., & Ostendorf, B. (2020). Relationship Between Traffic Volume and Accident Frequency at Intersections. International Journal of Environmental Research and Public Health, 17(4), 1393. https://doi.org/10.3390/ijerph17041393