The Association between Metabolically Healthy Obesity, Cardiovascular Disease, and All-Cause Mortality Risk in Asia: A Systematic Review and Meta-Analysis

 , , , ,
  , , and
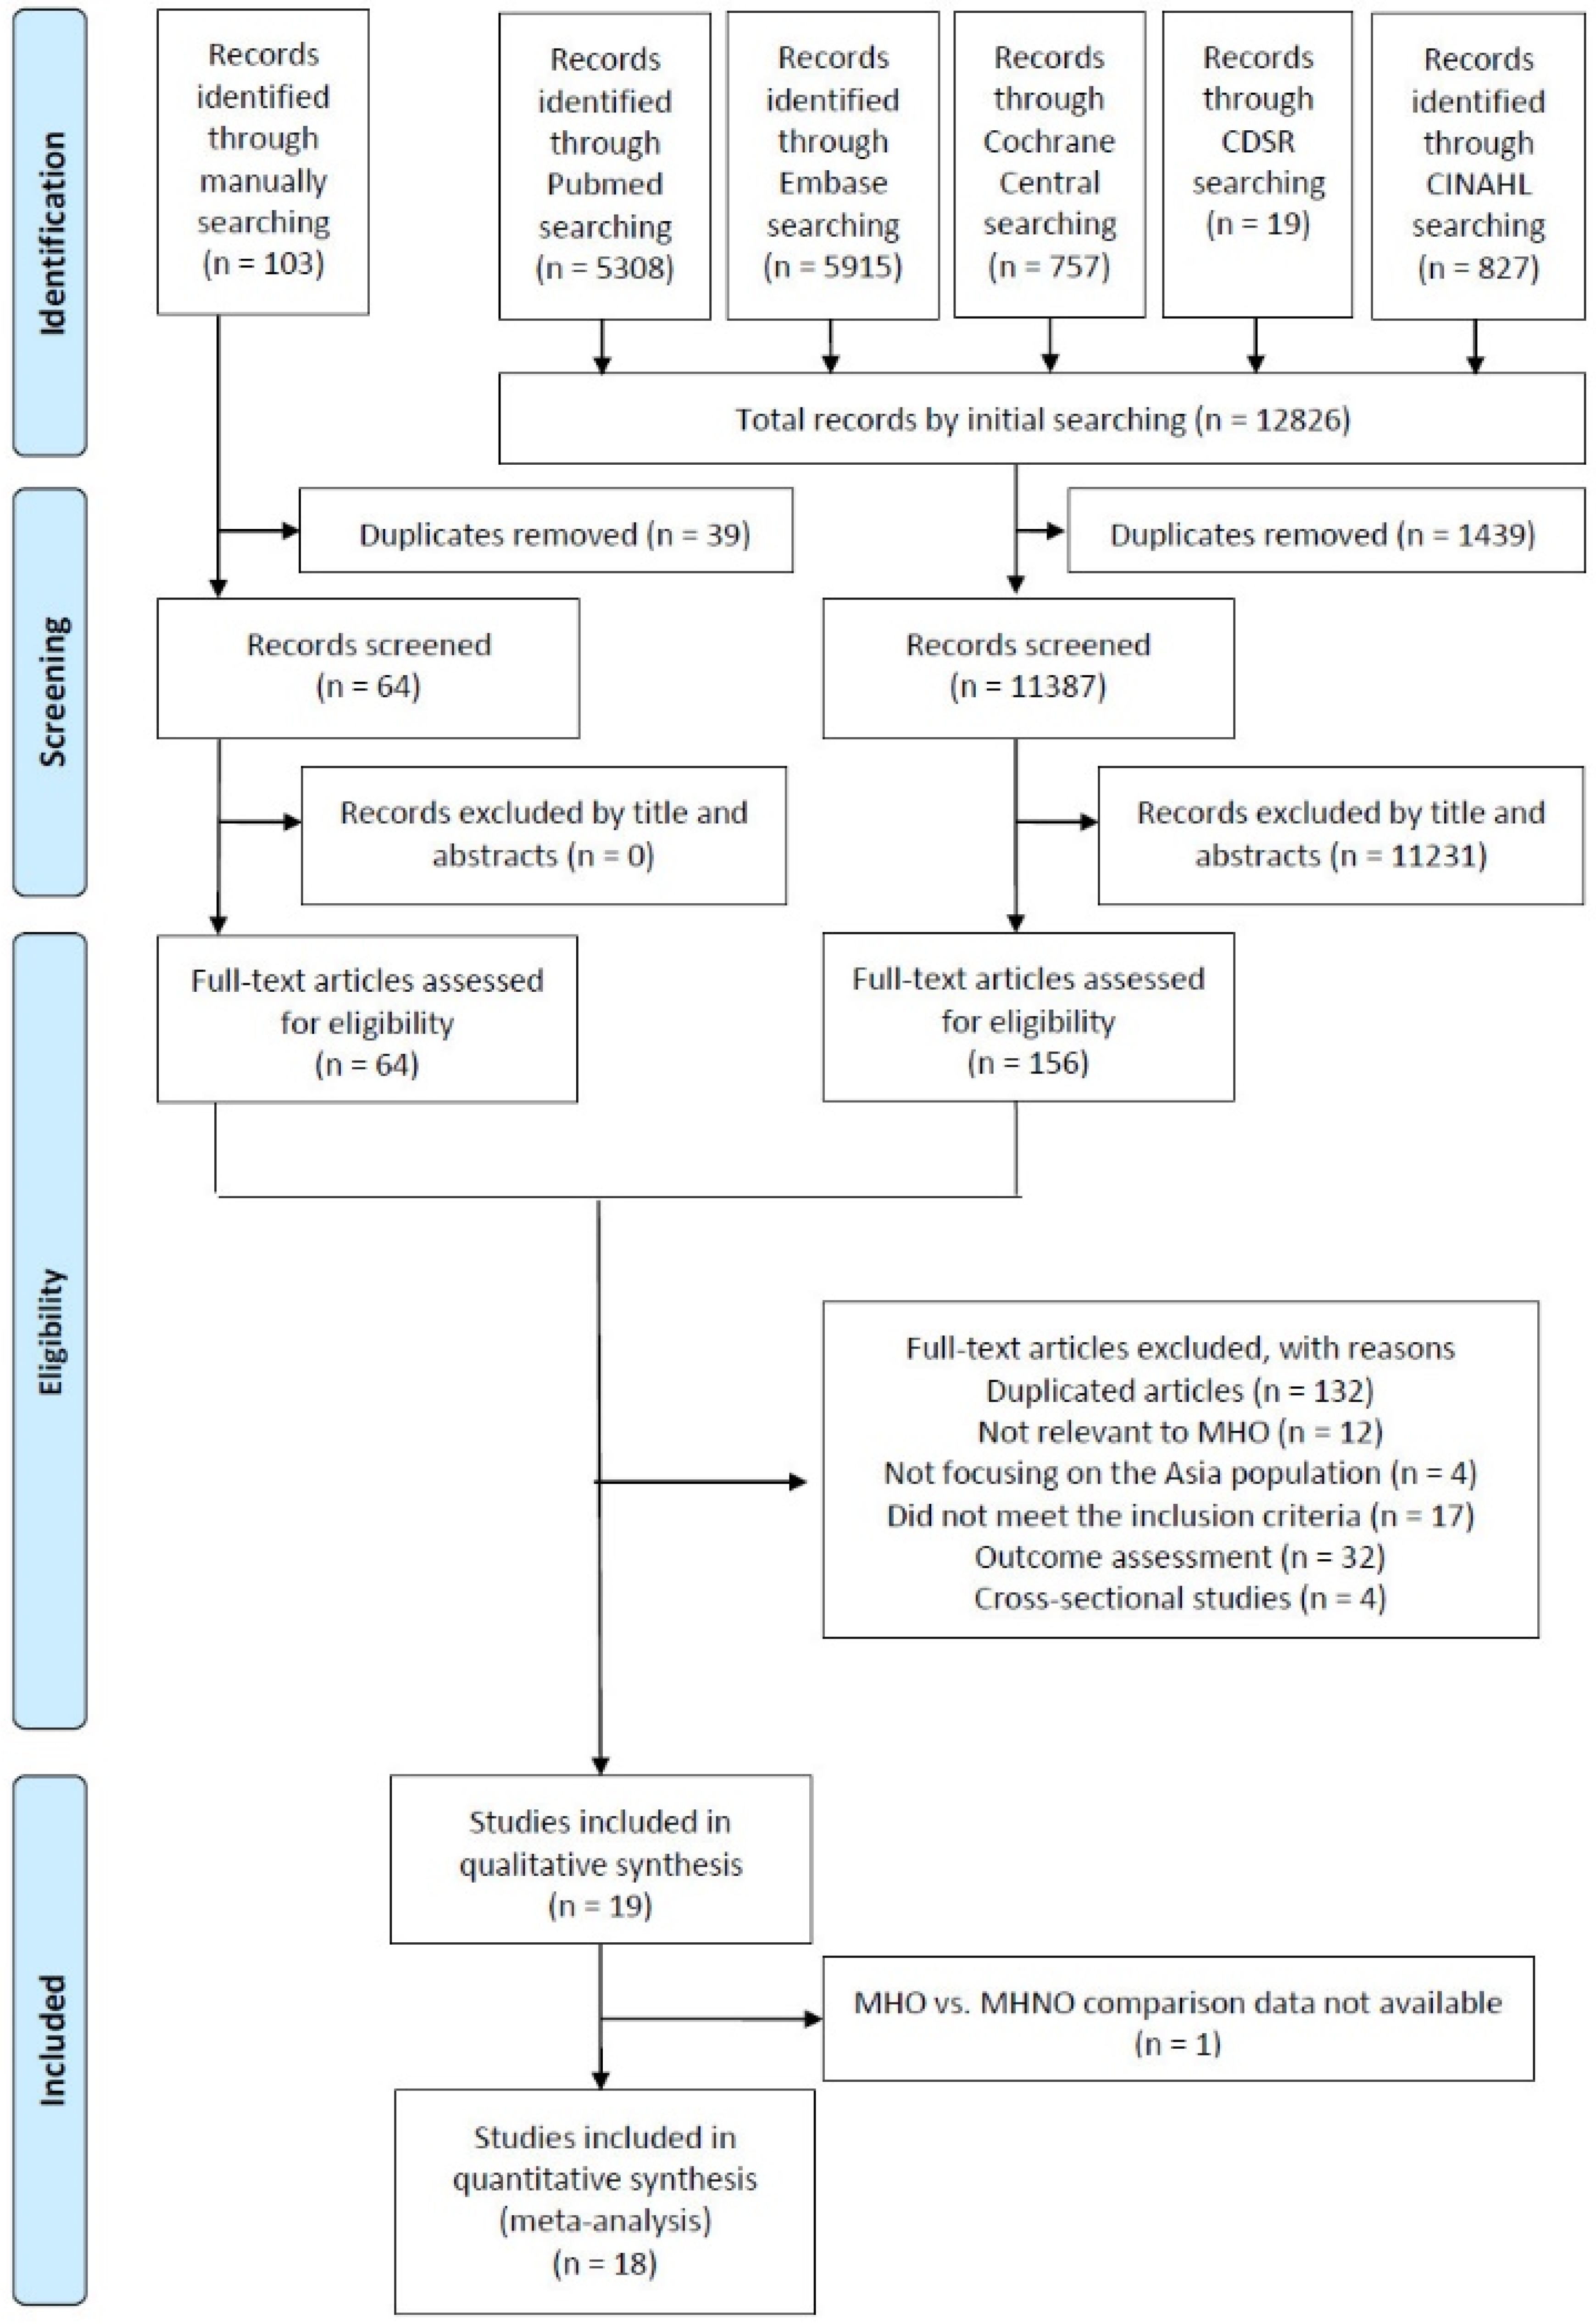
Abstract
:1. Introduction
2. Methods
2.1. Search Strategy and Study Eligibility
2.2. Data Extraction and Quality Assessment
3. Results
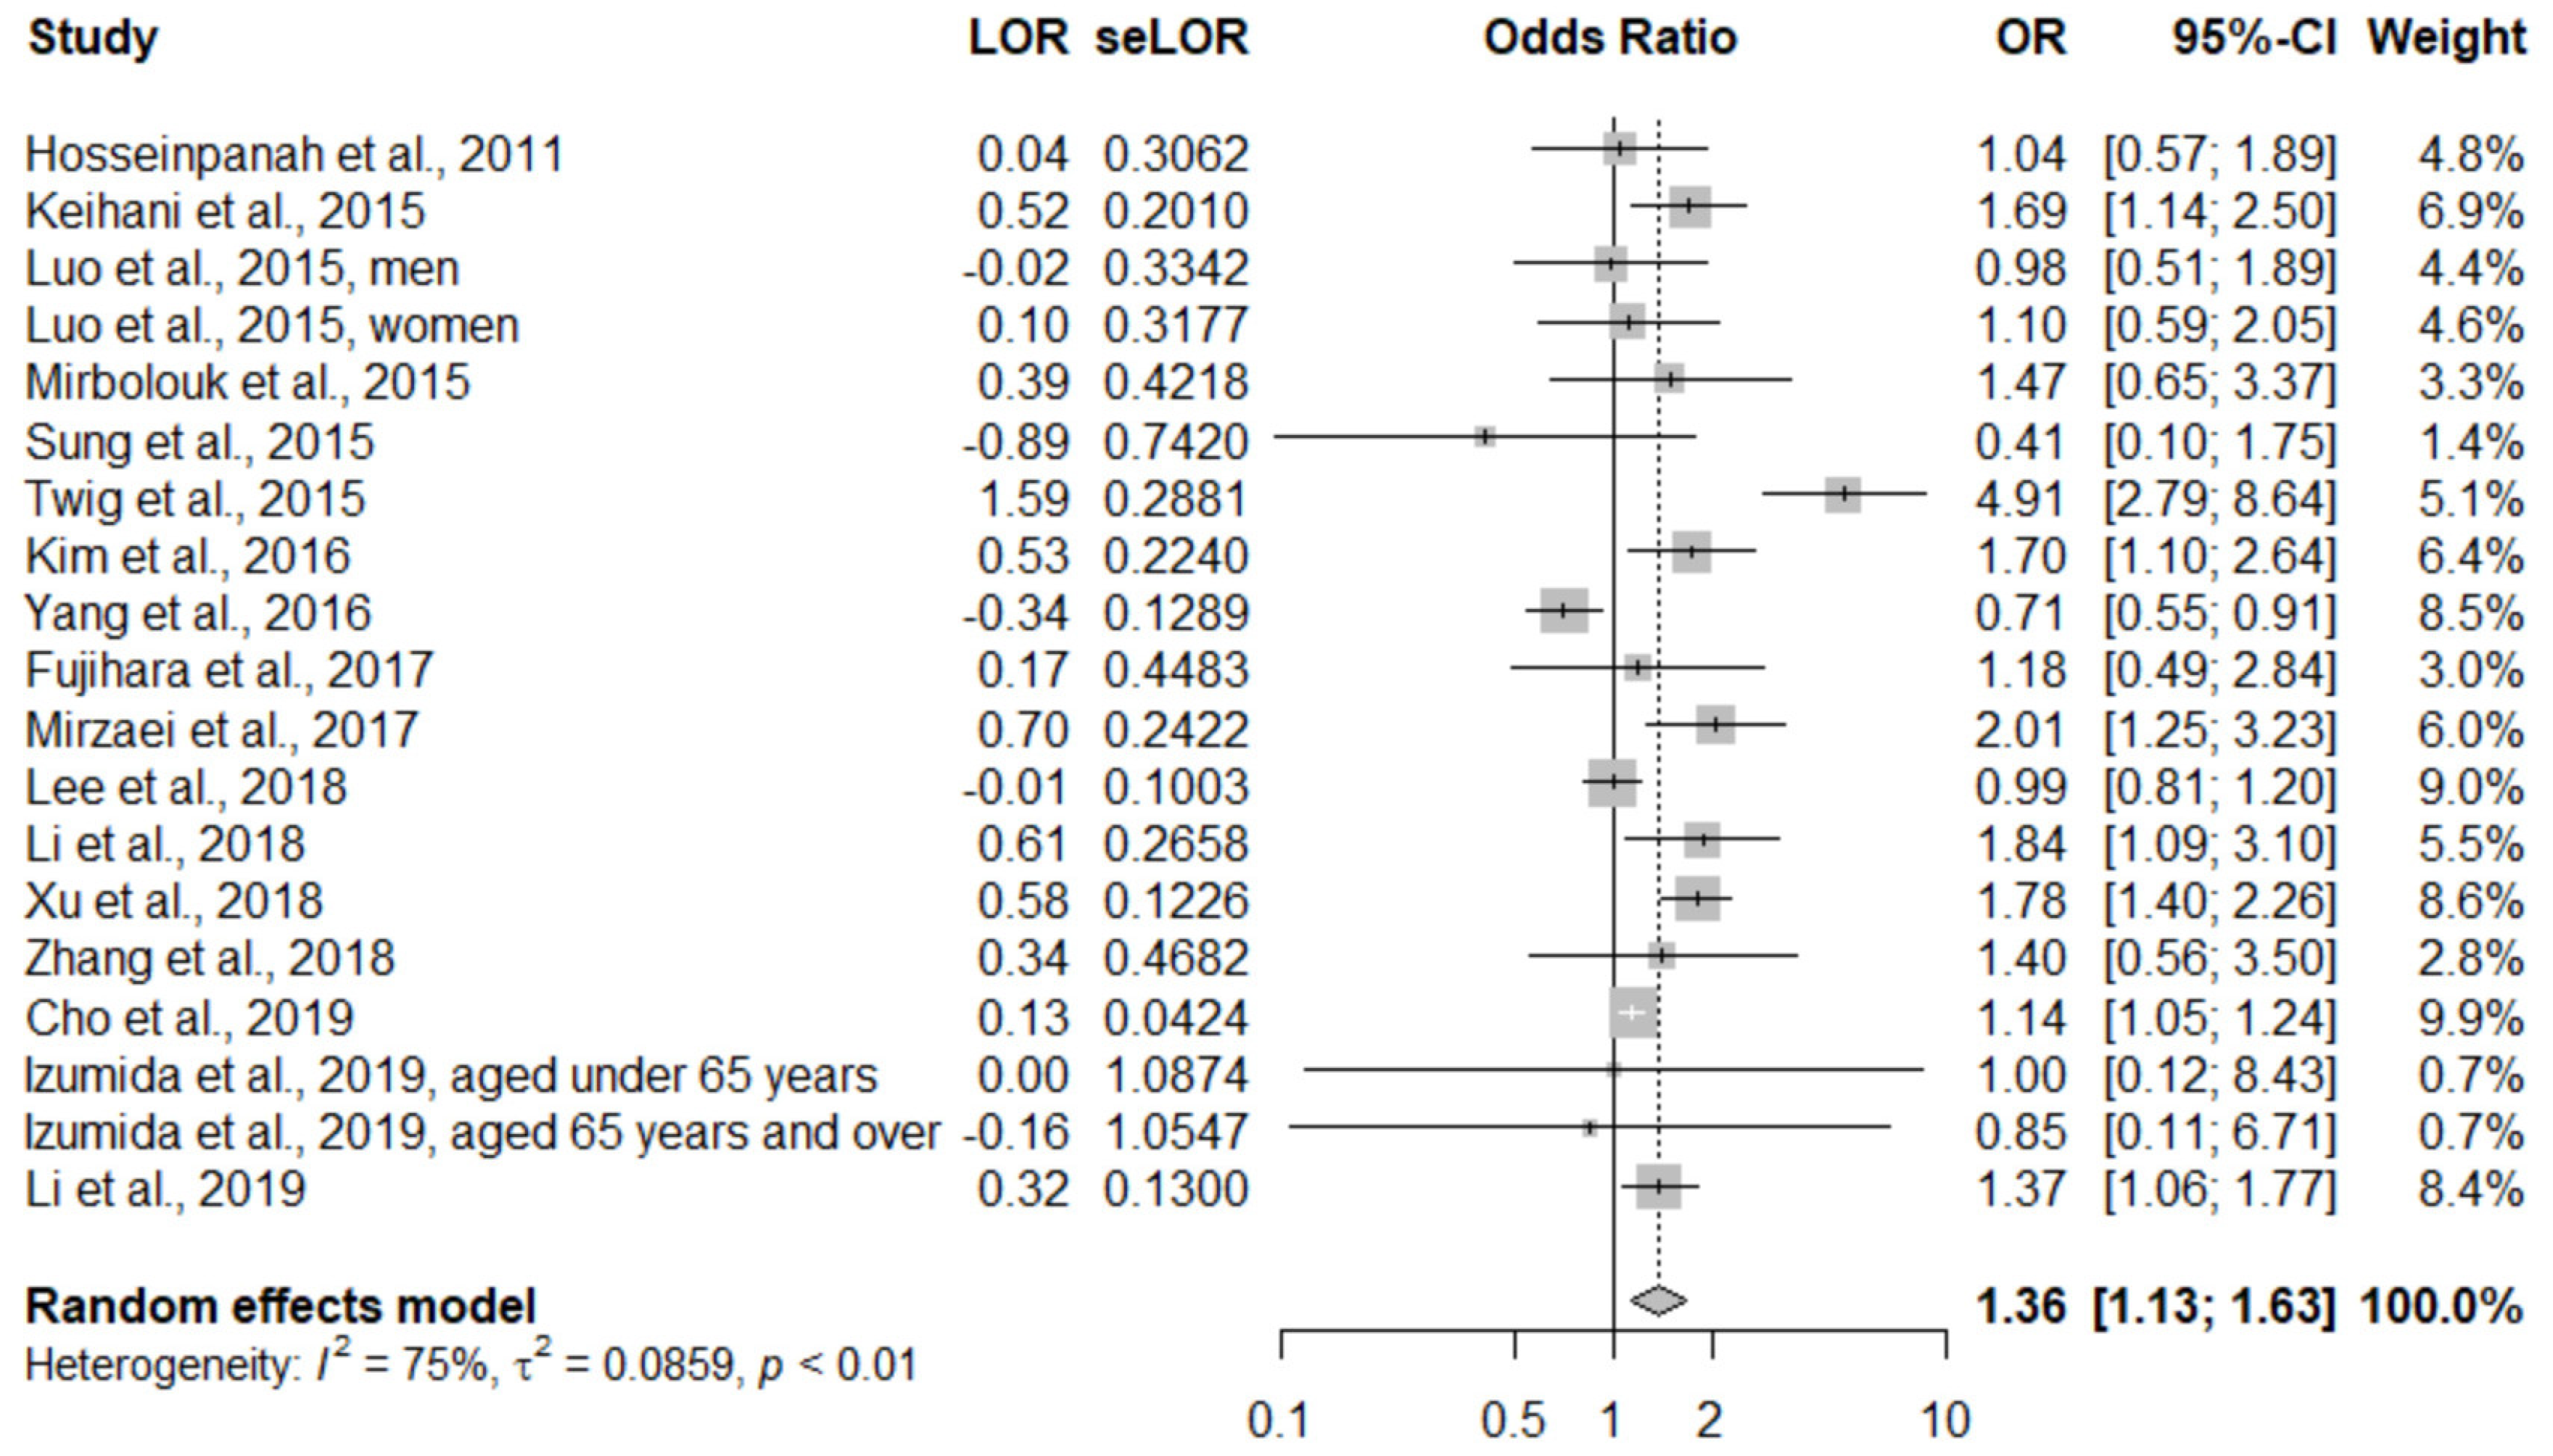
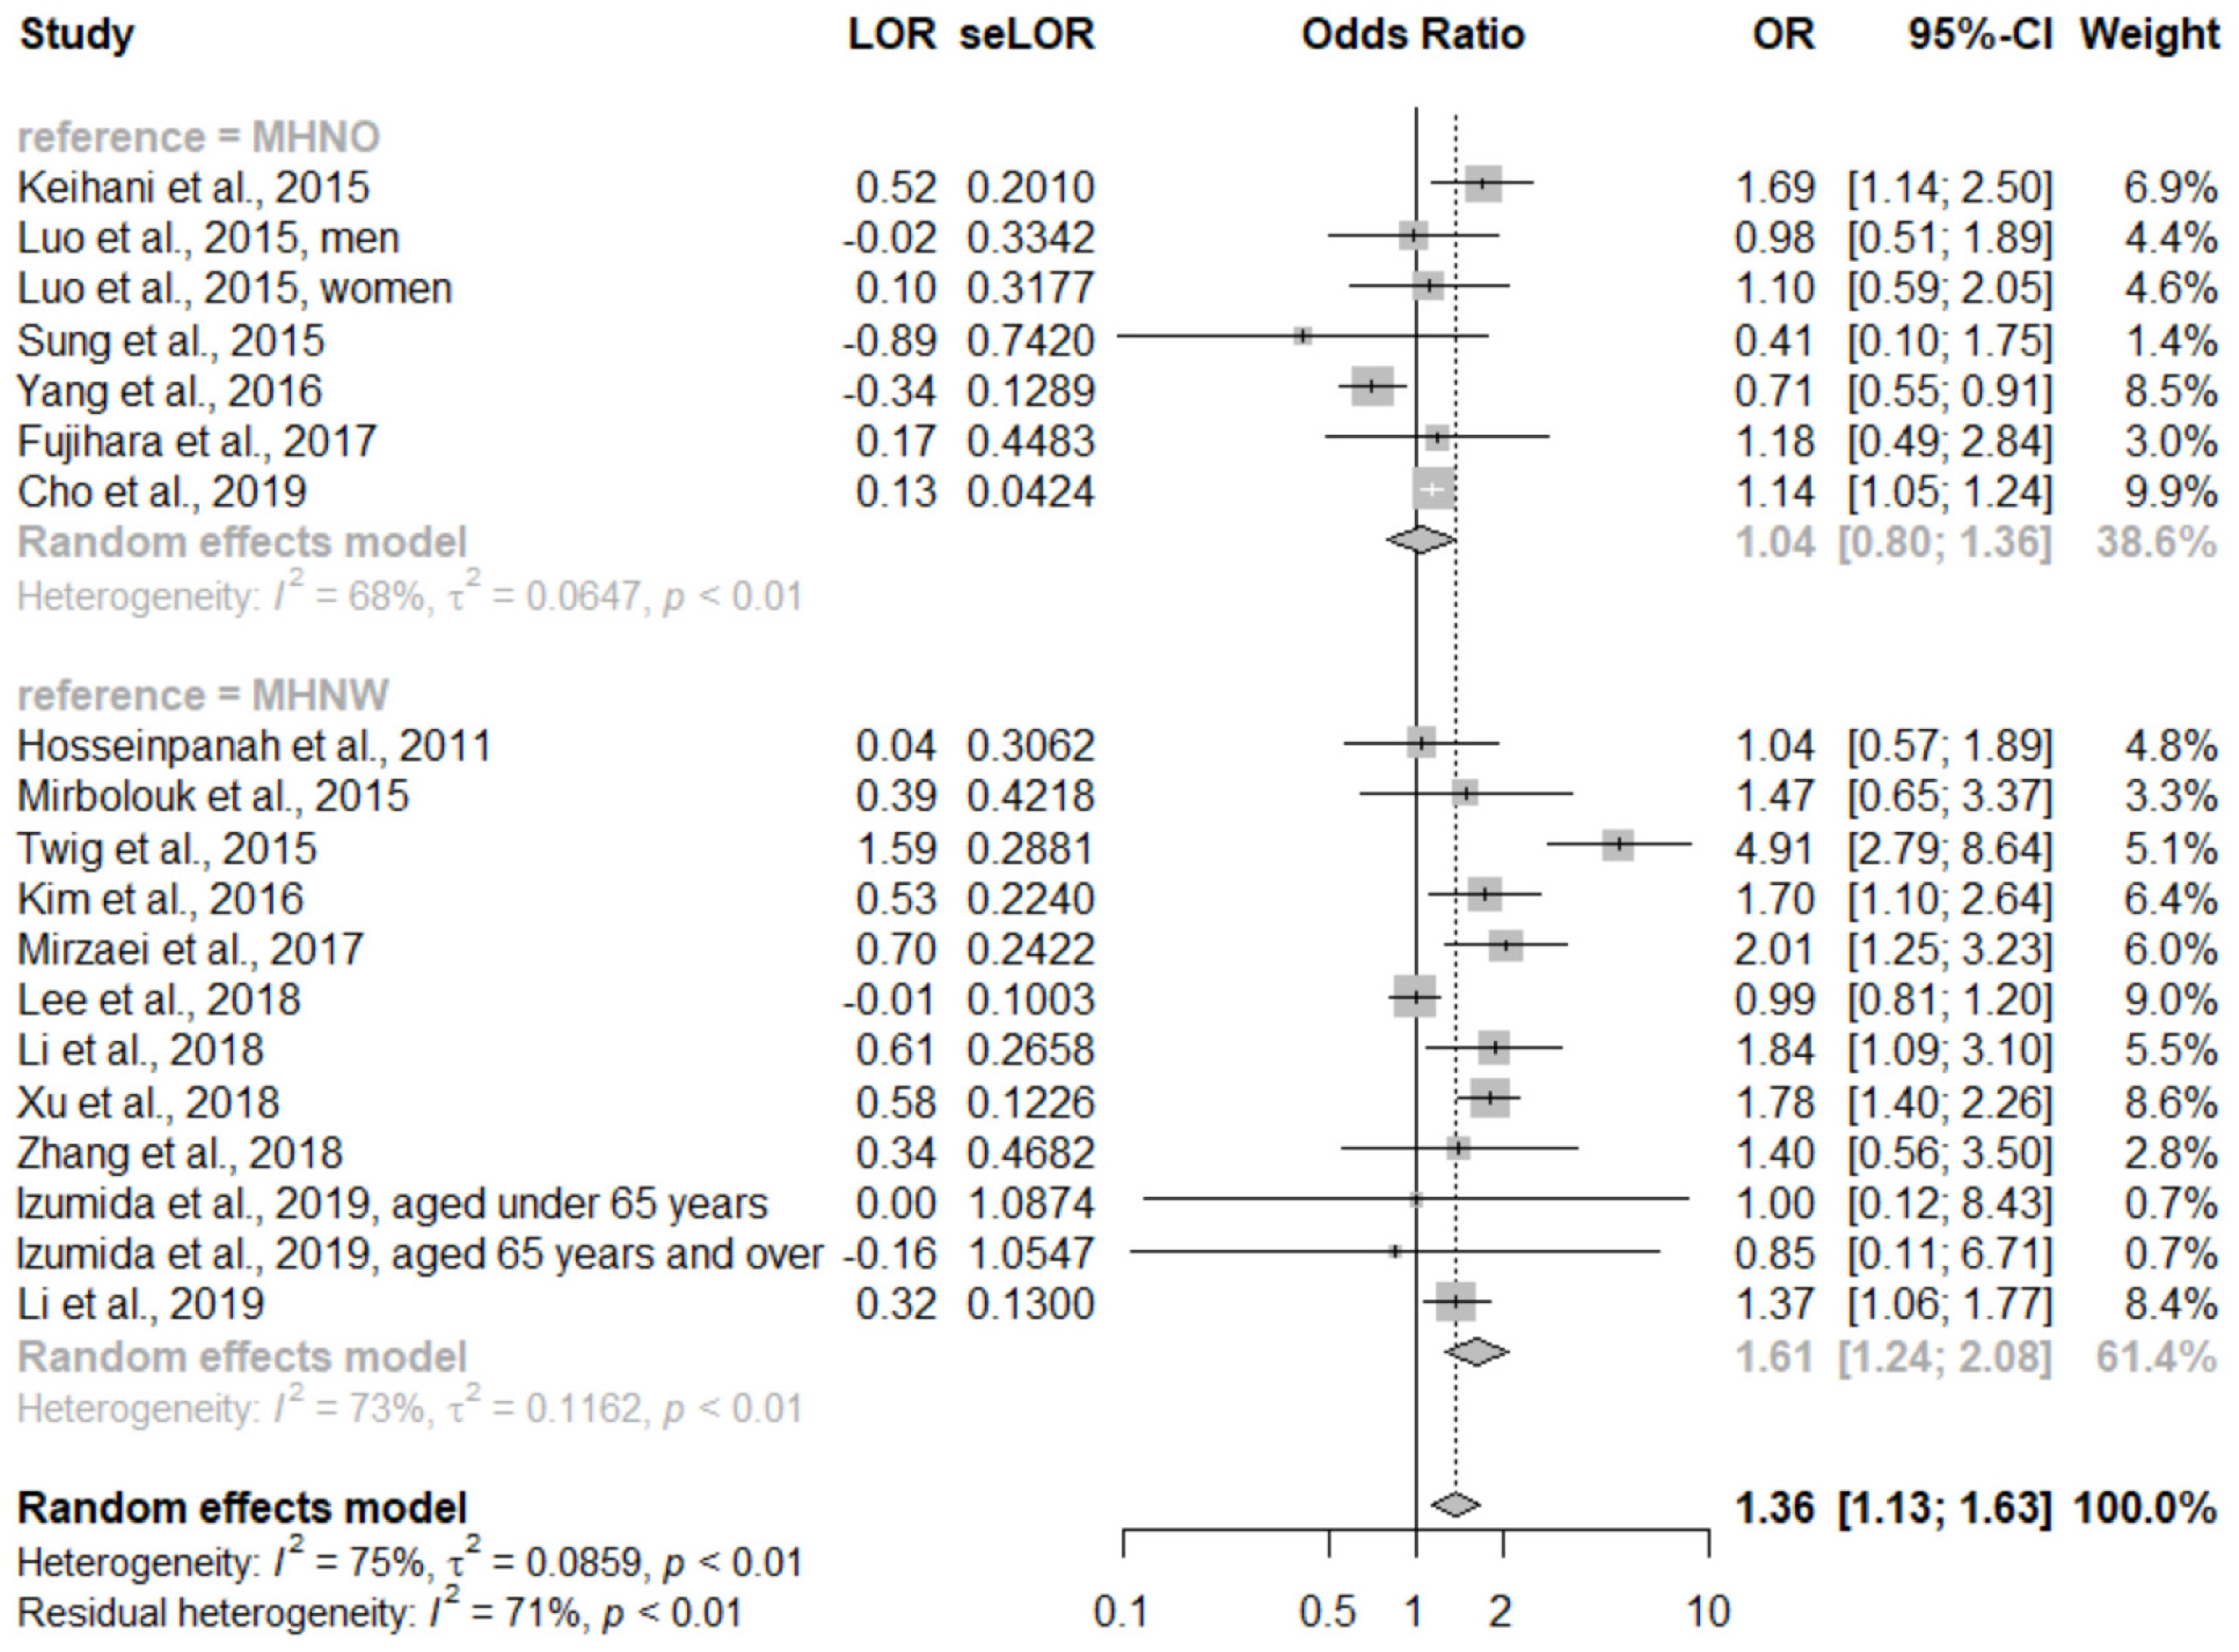
3.1. Primary Outcome
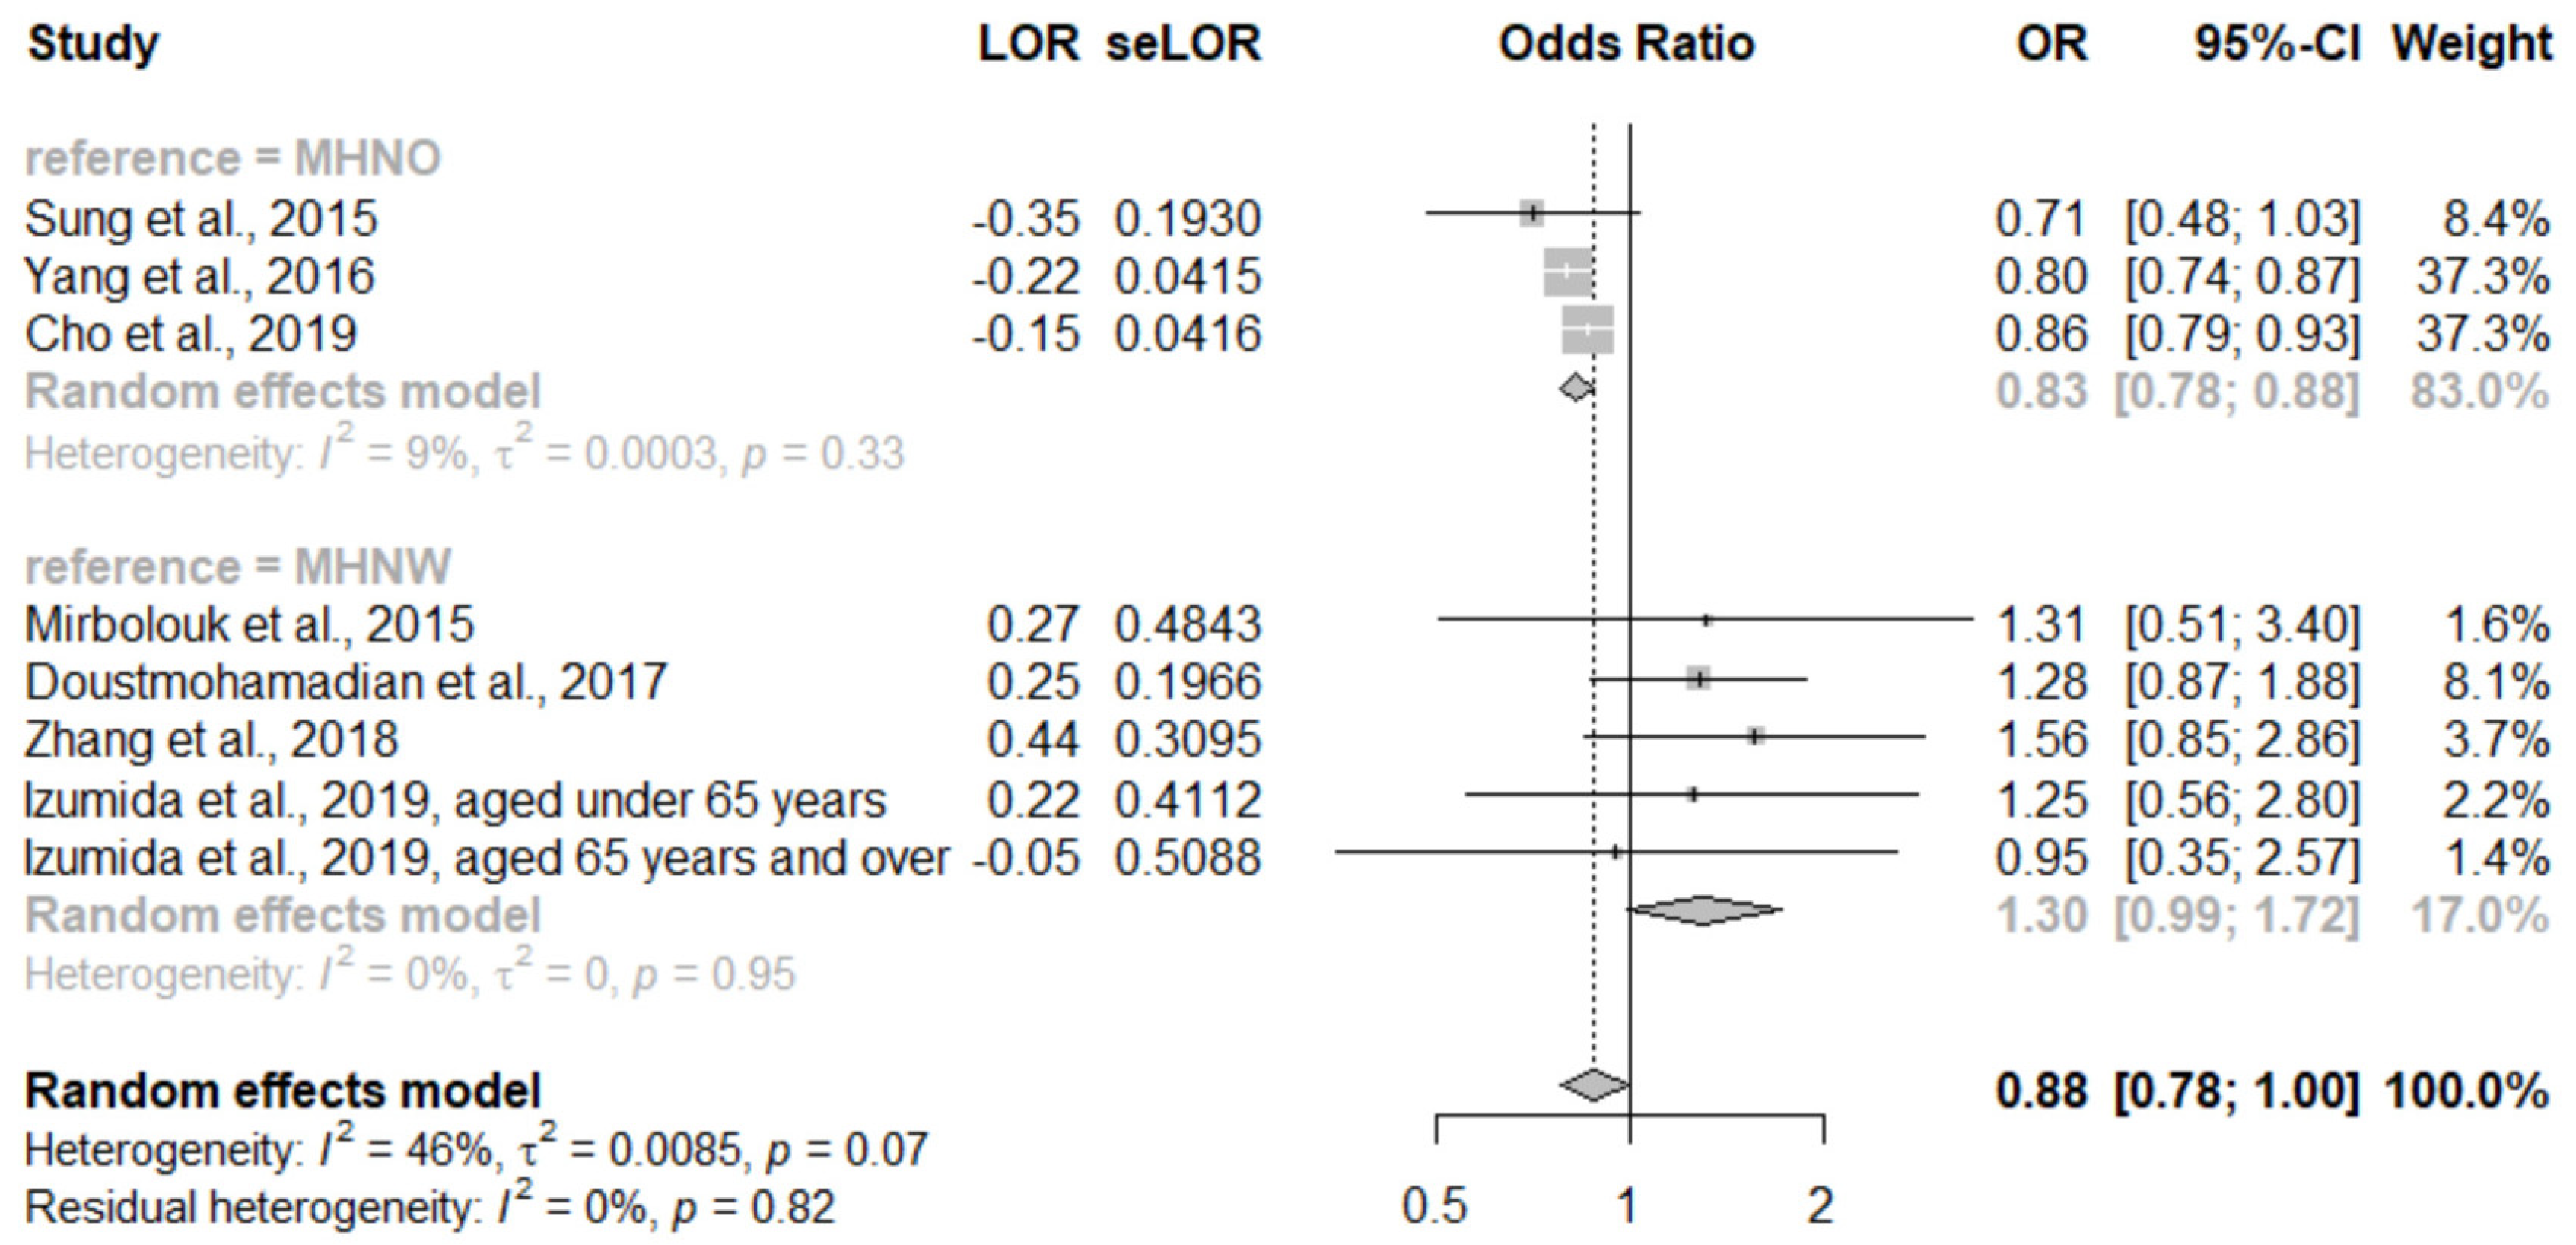
3.2. Secondary Outcome
4. Discussion
5. Conclusions
Supplementary Materials
Author Contributions
Funding
Conflicts of Interest
References
- Cardiovascular Diseases. Available online: https://www.who.int/news-room/fact-sheets/detail/cardiovascular-diseases-(cvds) (accessed on 22 October 2019).
- WHO. Comparative Country Studies. Available online: http://www.searo.who.int/entity/asia_pacific_observatory/about/APO_about_us_ccs_home/en (accessed on 27 November 2019).
- Ohira, T.; Iso, H. Cardiovascular disease epidemiology in Asia: An overview. Circ. J. 2013, 77, 1646–1652. [Google Scholar] [CrossRef] [PubMed] [Green Version]
- Boonchaya-anant, P.; Apovian, C.M. Metabolically healthy obesity—Does it exist? Curr. Atheroscler. Rep. 2014, 16, 441. [Google Scholar] [CrossRef] [PubMed]
- Kim, N.H.; Seo, J.A.; Cho, H.; Seo, J.H.; Yu, J.H.; Yoo, H.J.; Kim, S.G.; Choi, K.M.; Baik, S.H.; Choi, D.S.; et al. Risk of the Development of Diabetes and Cardiovascular Disease in Metabolically Healthy Obese People: The Korean Genome and Epidemiology Study. Medicine 2016, 95, e3384. [Google Scholar] [CrossRef] [PubMed]
- Wildman, R.P.; Muntner, P.; Reynolds, K.; McGinn, A.P.; Rajpathak, S.; Wylie-Rosett, J.; Sowers, M.R. The Obese Without Cardiometabolic Risk Factor Clustering and the Normal Weight with Cardiometabolic Risk Factor Clustering. Arch. Intern. Med. 2008, 168, 1617. [Google Scholar] [CrossRef] [PubMed] [Green Version]
- Yeh, T.-L.; Chen, H.-H.; Tsai, S.-Y.; Lin, C.-Y.; Liu, S.J.; Chien, K.-L. The Relationship between Metabolically Healthy Obesity and the Risk of Cardiovascular Disease: A Systematic Review and Meta-Analysis. J. Clin. Med. 2019, 8, 1228. [Google Scholar] [CrossRef] [PubMed] [Green Version]
- Zheng, R.; Zhou, D.; Zhu, Y. The long-term prognosis of cardiovascular disease and all-cause mortality for metabolically healthy obesity: A systematic review and meta-analysis. J. Epidemiol. Community Health 2016, 70, 1024–1031. [Google Scholar] [CrossRef] [PubMed]
- Choi, K.M.; Cho, H.J.; Choi, H.Y.; Yang, S.J.; Yoo, H.J.; Seo, J.A.; Kim, S.G.; Baik, S.H.; Choi, D.S.; Kim, N.H. Higher mortality in metabolically obese normal-weight people than in metabolically healthy obese subjects in elderly Koreans. Clin. Endocrinol. 2013, 79, 364–370. [Google Scholar] [CrossRef]
- Anjana, R.; Vittinghoff, E.; Mongraw-Chaffin, M.; Vaidya, D.; Kandula, N.R.; Allison, M.; Carr, J.; Liu, K.; Narayan, K.V.; Kanaya, A.M. Cardiometabolic Abnormalities Among Normal-Weight Persons from Five Racial/Ethnic Groups in the United States: A Cross-sectional Analysis of Two Cohort Studies. Ann. Intern. Med. 2017, 166, 628–636. [Google Scholar]
- Shamseer, L.; Moher, D.; Clarke, M.; Ghersi, D.; Liberati, A.; Petticrew, M.; Shekelle, P.; Stewart, L.A.; the PRISMA-P Group. Preferred reporting items for systematic review and meta-analysis protocols (PRISMA-P) 2015: Elaboration and explanation. BMJ 2015, 349, g7647. [Google Scholar] [CrossRef] [Green Version]
- Wells, G.A.; Shea, B.; O’Connell, D.L.; Peterson, J.; Welch, V.; Losos, M.; Tugwell, P. The Newcastle-Ottawa Scale (NOS) for Assessing the Quality of Nonrandomised Studies in Meta-Analyses. Available online: http://www.ohri.ca/programs/clinical_epidemiology/oxford.asp (accessed on 22 October 2019).
- Higgins, J.; Thompson, S.G.; Deeks, J.J.; Altman, U.G. Measuring inconsistency in meta-analyses. BMJ 2003, 327, 557–560. [Google Scholar] [CrossRef] [Green Version]
- Egger, M.; Smith, G.D.; Schneider, M.; Minder, C. Bias in meta-analysis detected by a simple, graphical test. BMJ 1997, 315, 629–634. [Google Scholar] [CrossRef] [PubMed] [Green Version]
- Luo, D.; Liu, F.; Li, X.; Yin, D.; Lin, Z.; Liu, H.; Hou, X.; Wang, C.; Jia, W. Comparison of the effect of ’metabolically healthy but obese’ and ’metabolically abnormal but not obese’ phenotypes on development of diabetes and cardiovascular disease in Chinese. Endocrine 2015, 49, 130–138. [Google Scholar] [CrossRef] [PubMed]
- Doustmohamadian, S.; Serahati, S.; Barzin, M.; Keihani, S.; Azizi, F.; Hosseinpanah, F. Risk of all-cause mortality in abdominal obesity phenotypes: Tehran Lipid and Glucose Study. Nutr. Metab. Cardiovasc. Dis. 2017, 27, 241–248. [Google Scholar] [CrossRef] [PubMed]
- Mirzaei, B.; Abdi, H.; Serahati, S.; Barzin, M.; Niroomand, M.; Azizi, F.; Hosseinpanah, F. Cardiovascular risk in different obesity phenotypes over a decade follow-up: Tehran Lipid and Glucose Study. Atherosclerosis 2017, 258, 65–71. [Google Scholar] [CrossRef] [PubMed]
- Yang, H.K.; Han, K.; Kwon, H.-S.; Park, Y.-M.; Cho, J.-H.; Yoon, K.-H.; Kang, M.-I.; Cha, B.-Y.; Lee, S.-H. Obesity, metabolic health, and mortality in adults: A nationwide population-based study in Korea. Sci. Rep. 2016, 6, 30329. [Google Scholar] [CrossRef] [PubMed]
- Keihani, S.; Hosseinpanah, F.; Barzin, M.; Serahati, S.; Doustmohamadian, S.; Azizi, F. Abdominal obesity phenotypes and risk of cardiovascular disease in a decade of follow-up: The Tehran Lipid and Glucose Study. Atherosclerosis 2015, 238, 256–263. [Google Scholar] [CrossRef]
- Phillips, C.M. Metabolically healthy obesity across the life course: Epidemiology, determinants, and implications. Ann. N. Y. Acad. Sci. 2017, 1391, 85–100. [Google Scholar] [CrossRef] [Green Version]
- Chrysant, S.G.; Chrysant, G.S. The single use of body mass index for the obesity paradox is misleading and should be used in conjunction with other obesity indices. Postgrad. Med. 2019, 131, 96–102. [Google Scholar] [CrossRef]
- Fujihara, K.; Matsubayashi, Y.; Yamamoto, M.; Osawa, T.; Ishizawa, M.; Kaneko, M.; Matsunaga, S.; Kato, K.; Seida, H.; Yamanaka, N.; et al. Impact of body mass index and metabolic phenotypes on coronary artery disease according to glucose tolerance status. Diabetes Metab. 2017, 43, 543–546. [Google Scholar] [CrossRef]
- Sung, K.C.; Ryu, S.; Cheong, E.S.; Kim, B.S.; Kim, B.J.; Kim, Y.B.; Chung, P.W.; Wild, S.H.; Byrne, C.D. All-Cause and Cardiovascular Mortality among Koreans: Effects of Obesity and Metabolic Health. Am. J. Prev. Med. 2015, 49, 62–71. [Google Scholar] [CrossRef]
- Cho, Y.K.; Kang, Y.M.; Yoo, J.H.; Lee, J.; Park, J.-Y.; Lee, W.J.; Kim, Y.-J.; Jung, C.H. Implications of the dynamic nature of metabolic health status and obesity on risk of incident cardiovascular events and mortality: A nationwide population-based cohort study. Metabolis 2019, 97, 50–56. [Google Scholar] [CrossRef] [PubMed]
- Elagizi, A.; Kachur, S.; Lavie, C.J.; Carbone, S.; Pandey, A.; Ortega, F.B.; Milani, R.V. An overview and update on obesity and the obesity paradox in cardiovascular diseases. Prog. Cardiovasc. Dis. 2018, 61, 142–150. [Google Scholar] [CrossRef] [PubMed] [Green Version]
- Lee, N.H.; Keum, N.; Hu, F.B.; Orav, E.J.; Rimm, E.B.; Willett, W.C.; Giovannucci, E.L. Predicted lean body mass, fat mass, and all cause and cause specific mortality in men: Prospective US cohort study. BMJ 2018, 362, k2575. [Google Scholar] [CrossRef] [PubMed] [Green Version]
- Mohan, V.; Unnikrishnan, R.; Shobana, S.; Malavika, M.; Anjana, R.M.; Sudha, V. Are excess carbohydrates the main link to diabetes & its complications in Asians? Indian J. Med. Res. 2018, 148, 531–538. [Google Scholar] [CrossRef] [PubMed]
- Kelley, D.E.; Thaete, F.L.; Troost, F.; Huwe, T.; Goodpaster, B.H. Subdivisions of subcutaneous abdominal adipose tissue and insulin resistance. Am. J. Physiol. Metab. 2000, 278, E941–E948. [Google Scholar] [CrossRef]
- Lim, U.; Ernst, T.; Buchthal, S.D.; Latch, M.; Albright, C.L.; Wilkens, L.R.; Kolonel, L.N.; Murphy, S.P.; Chang, L.; Novotny, R.; et al. Asian women have greater abdominal and visceral adiposity than Caucasian women with similar body mass index. Nutr. Diabetes 2011, 1, e6. [Google Scholar] [CrossRef]
- Kohli, S.; Lear, S.A. Differences in subcutaneous abdominal adiposity regions in four ethnic groups. Obesity 2013, 21, 2288–2295. [Google Scholar] [CrossRef]
- Perry, A.C.; Martin, L. Race differences in obesity and its relationship to the sex hormone milieu. Horm. Mol. Boil. Clin. Investig. 2014, 19, 151–161. [Google Scholar] [CrossRef]
- Ueshima, H.; Sekikawa, A.; Miura, K.; Turin, T.C.; Takashima, N.; Kita, Y.; Watanabe, M.; Kadota, A.; Okuda, N.; Kadowaki, T.; et al. Cardiovascular disease and risk factors in Asia: A selected review. Circulation 2008, 118, 2702–2709. [Google Scholar] [CrossRef] [Green Version]
- Smith, G.I.; Mittendorfer, B.; Klein, S. Metabolically healthy obesity: Facts and fantasies. J. Clin. Investig. 2019, 129, 3978–3989. [Google Scholar] [CrossRef] [Green Version]
- Moran, A.; Vedanthan, R. Cardiovascular disease prevention in South Asia: Gathering the evidence. Glob. Hear. 2013, 8, 139–140. [Google Scholar] [CrossRef] [PubMed] [Green Version]


© 2020 by the authors. Licensee MDPI, Basel, Switzerland. This article is an open access article distributed under the terms and conditions of the Creative Commons Attribution (CC BY) license (http://creativecommons.org/licenses/by/4.0/).
Share and Cite
Huang, M.-Y.; Wang, M.-Y.; Lin, Y.-S.; Lin, C.-J.; Lo, K.; Chang, I.-J.; Cheng, T.-Y.; Tsai, S.-Y.; Chen, H.-H.; Lin, C.-Y.; et al. The Association between Metabolically Healthy Obesity, Cardiovascular Disease, and All-Cause Mortality Risk in Asia: A Systematic Review and Meta-Analysis. Int. J. Environ. Res. Public Health 2020, 17, 1320. https://doi.org/10.3390/ijerph17041320
Huang M-Y, Wang M-Y, Lin Y-S, Lin C-J, Lo K, Chang I-J, Cheng T-Y, Tsai S-Y, Chen H-H, Lin C-Y, et al. The Association between Metabolically Healthy Obesity, Cardiovascular Disease, and All-Cause Mortality Risk in Asia: A Systematic Review and Meta-Analysis. International Journal of Environmental Research and Public Health. 2020; 17(4):1320. https://doi.org/10.3390/ijerph17041320
Chicago/Turabian StyleHuang, Ming-Yuan, Mu-Yi Wang, Yu-Sheng Lin, Chien-Ju Lin, Kai Lo, I-Jen Chang, Ting-Yao Cheng, Szu-Ying Tsai, Hsin-Hao Chen, Chien-Yu Lin, and et al. 2020. "The Association between Metabolically Healthy Obesity, Cardiovascular Disease, and All-Cause Mortality Risk in Asia: A Systematic Review and Meta-Analysis" International Journal of Environmental Research and Public Health 17, no. 4: 1320. https://doi.org/10.3390/ijerph17041320
APA StyleHuang, M.-Y., Wang, M.-Y., Lin, Y.-S., Lin, C.-J., Lo, K., Chang, I.-J., Cheng, T.-Y., Tsai, S.-Y., Chen, H.-H., Lin, C.-Y., Liu, S. J., Chien, K.-L., & Yeh, T.-L. (2020). The Association between Metabolically Healthy Obesity, Cardiovascular Disease, and All-Cause Mortality Risk in Asia: A Systematic Review and Meta-Analysis. International Journal of Environmental Research and Public Health, 17(4), 1320. https://doi.org/10.3390/ijerph17041320