Seasonal Fluctuation of Polycyclic Aromatic Hydrocarbons and Aerosol Genotoxicity in Long-Range Transported Air Mass Observed at the Western End of Japan

Abstract
1. Introduction
2. Materials and Methods
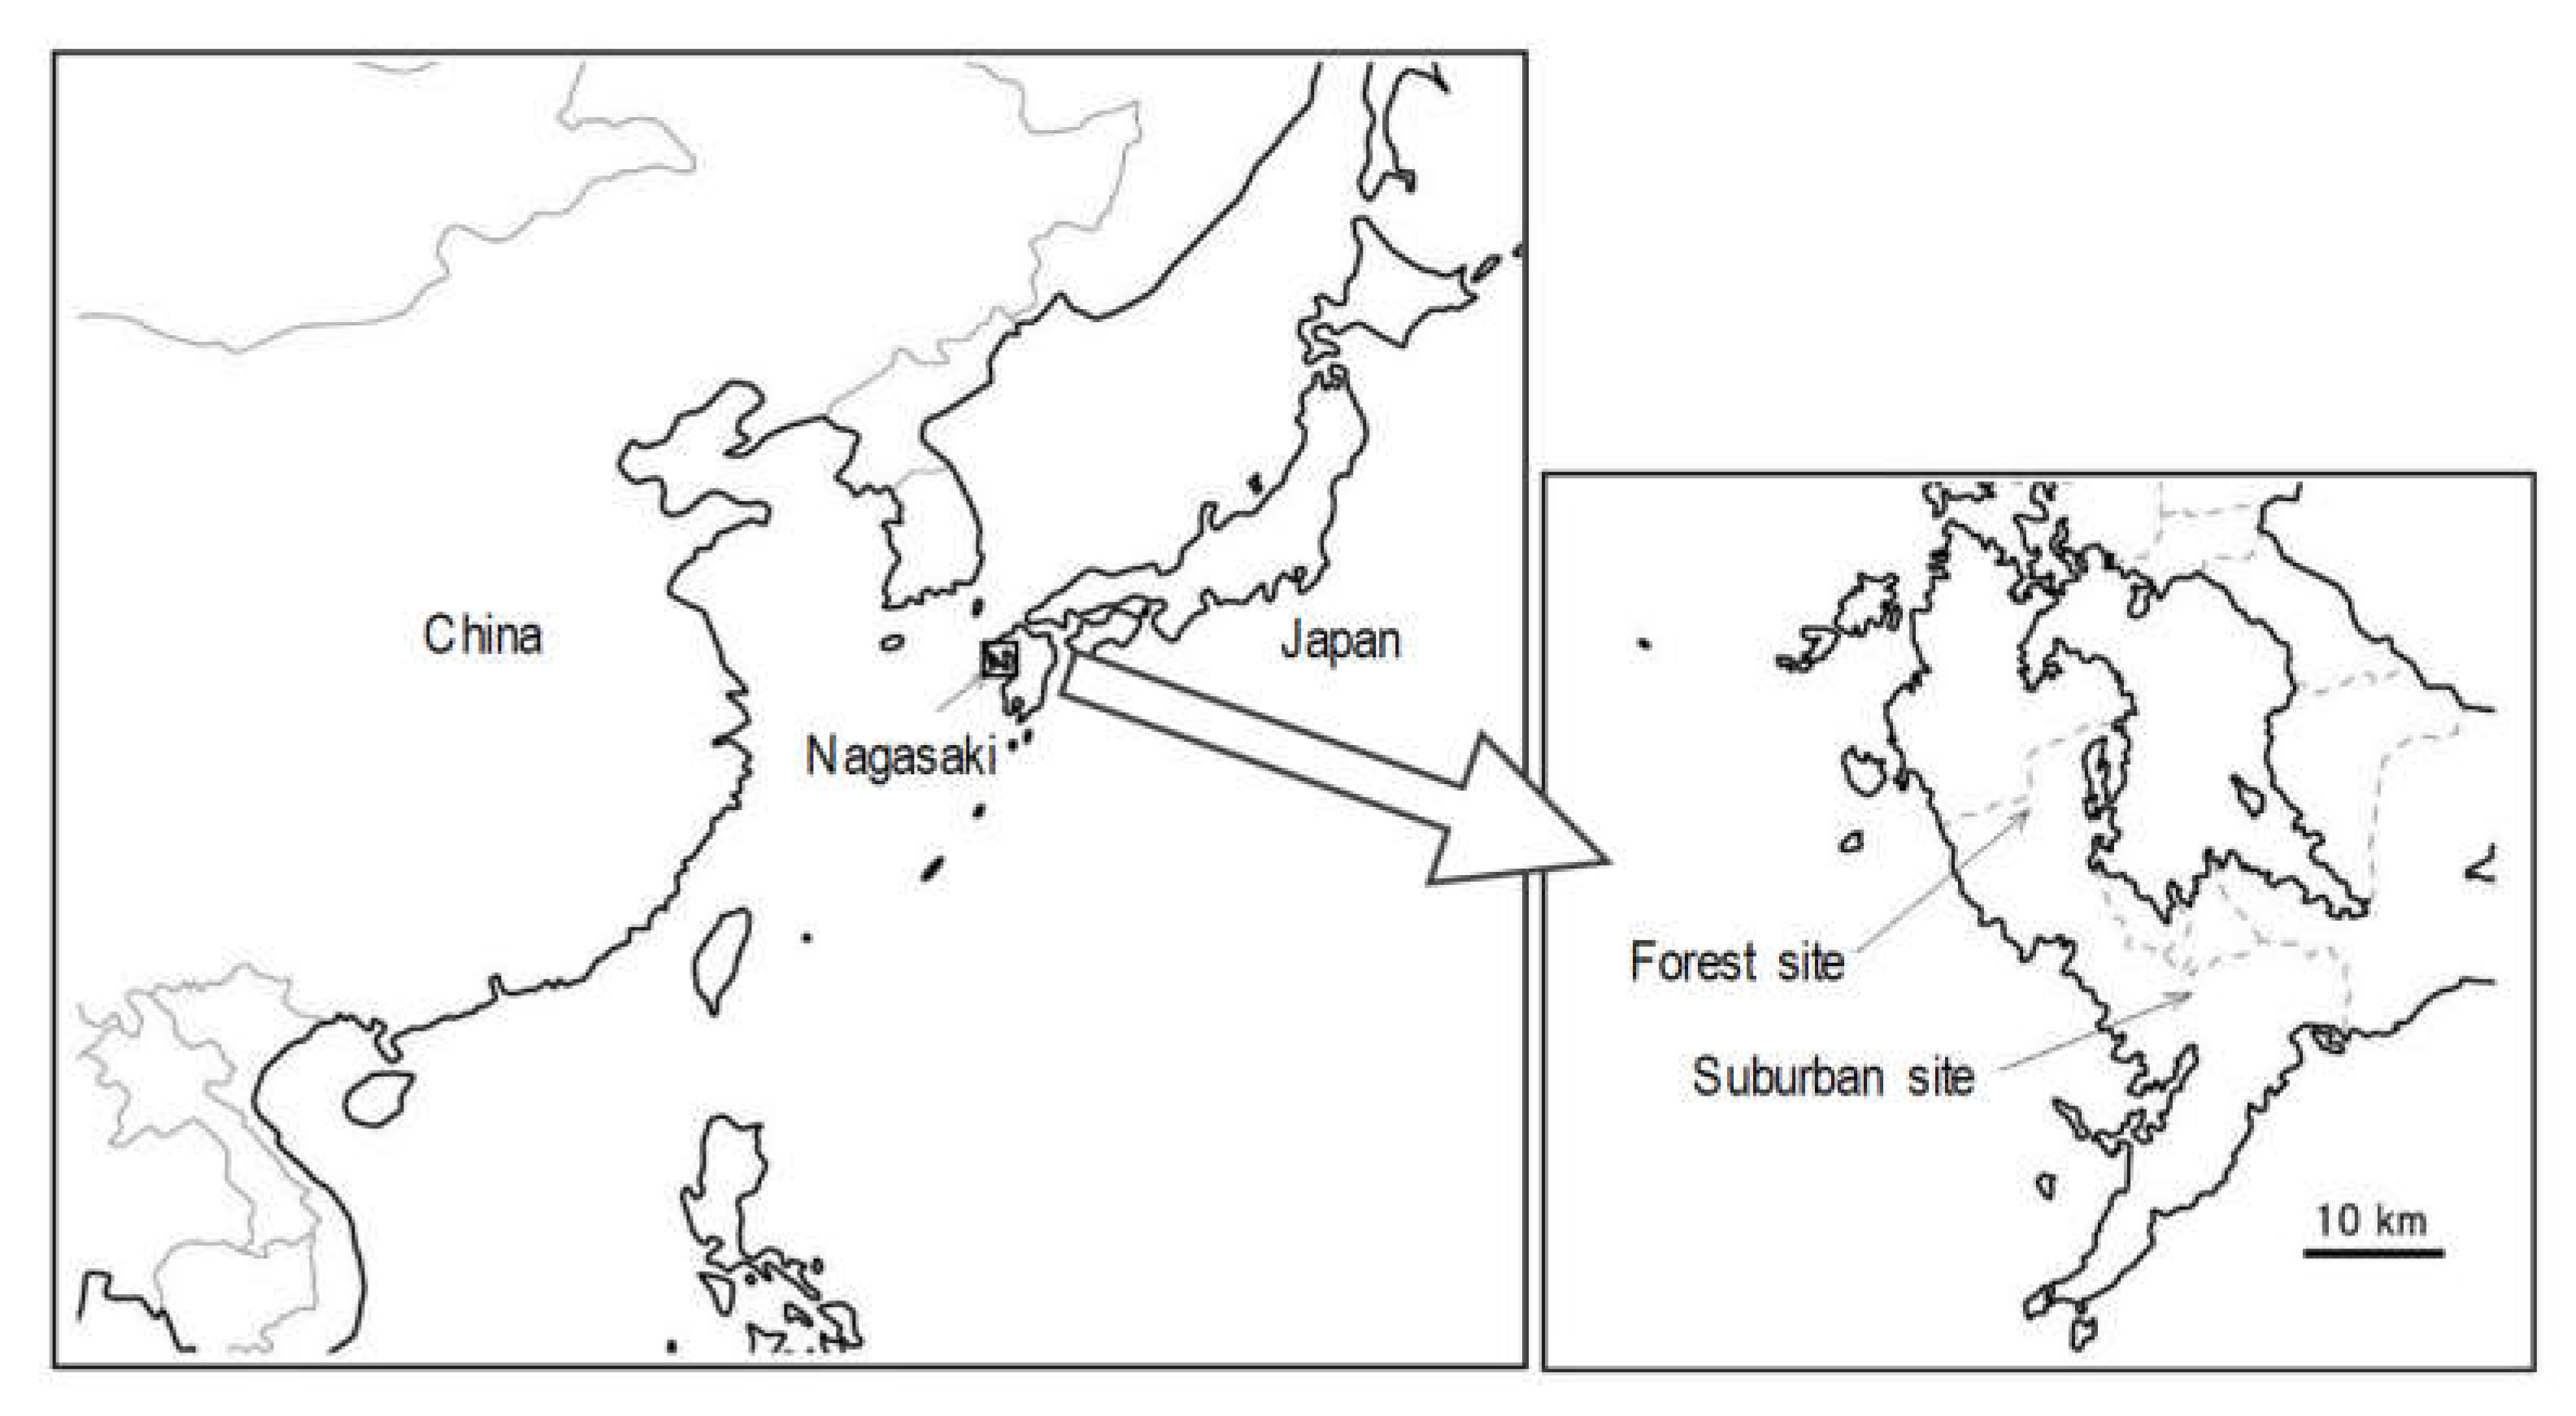
2.1. Sample Collection
2.2. PAHs Analysis
2.3. Umu Test
2.4. Data Analysis
2.4.1. Back Trajectory Analysis
2.4.2. PAH Source Identification
3. Results and Discussion
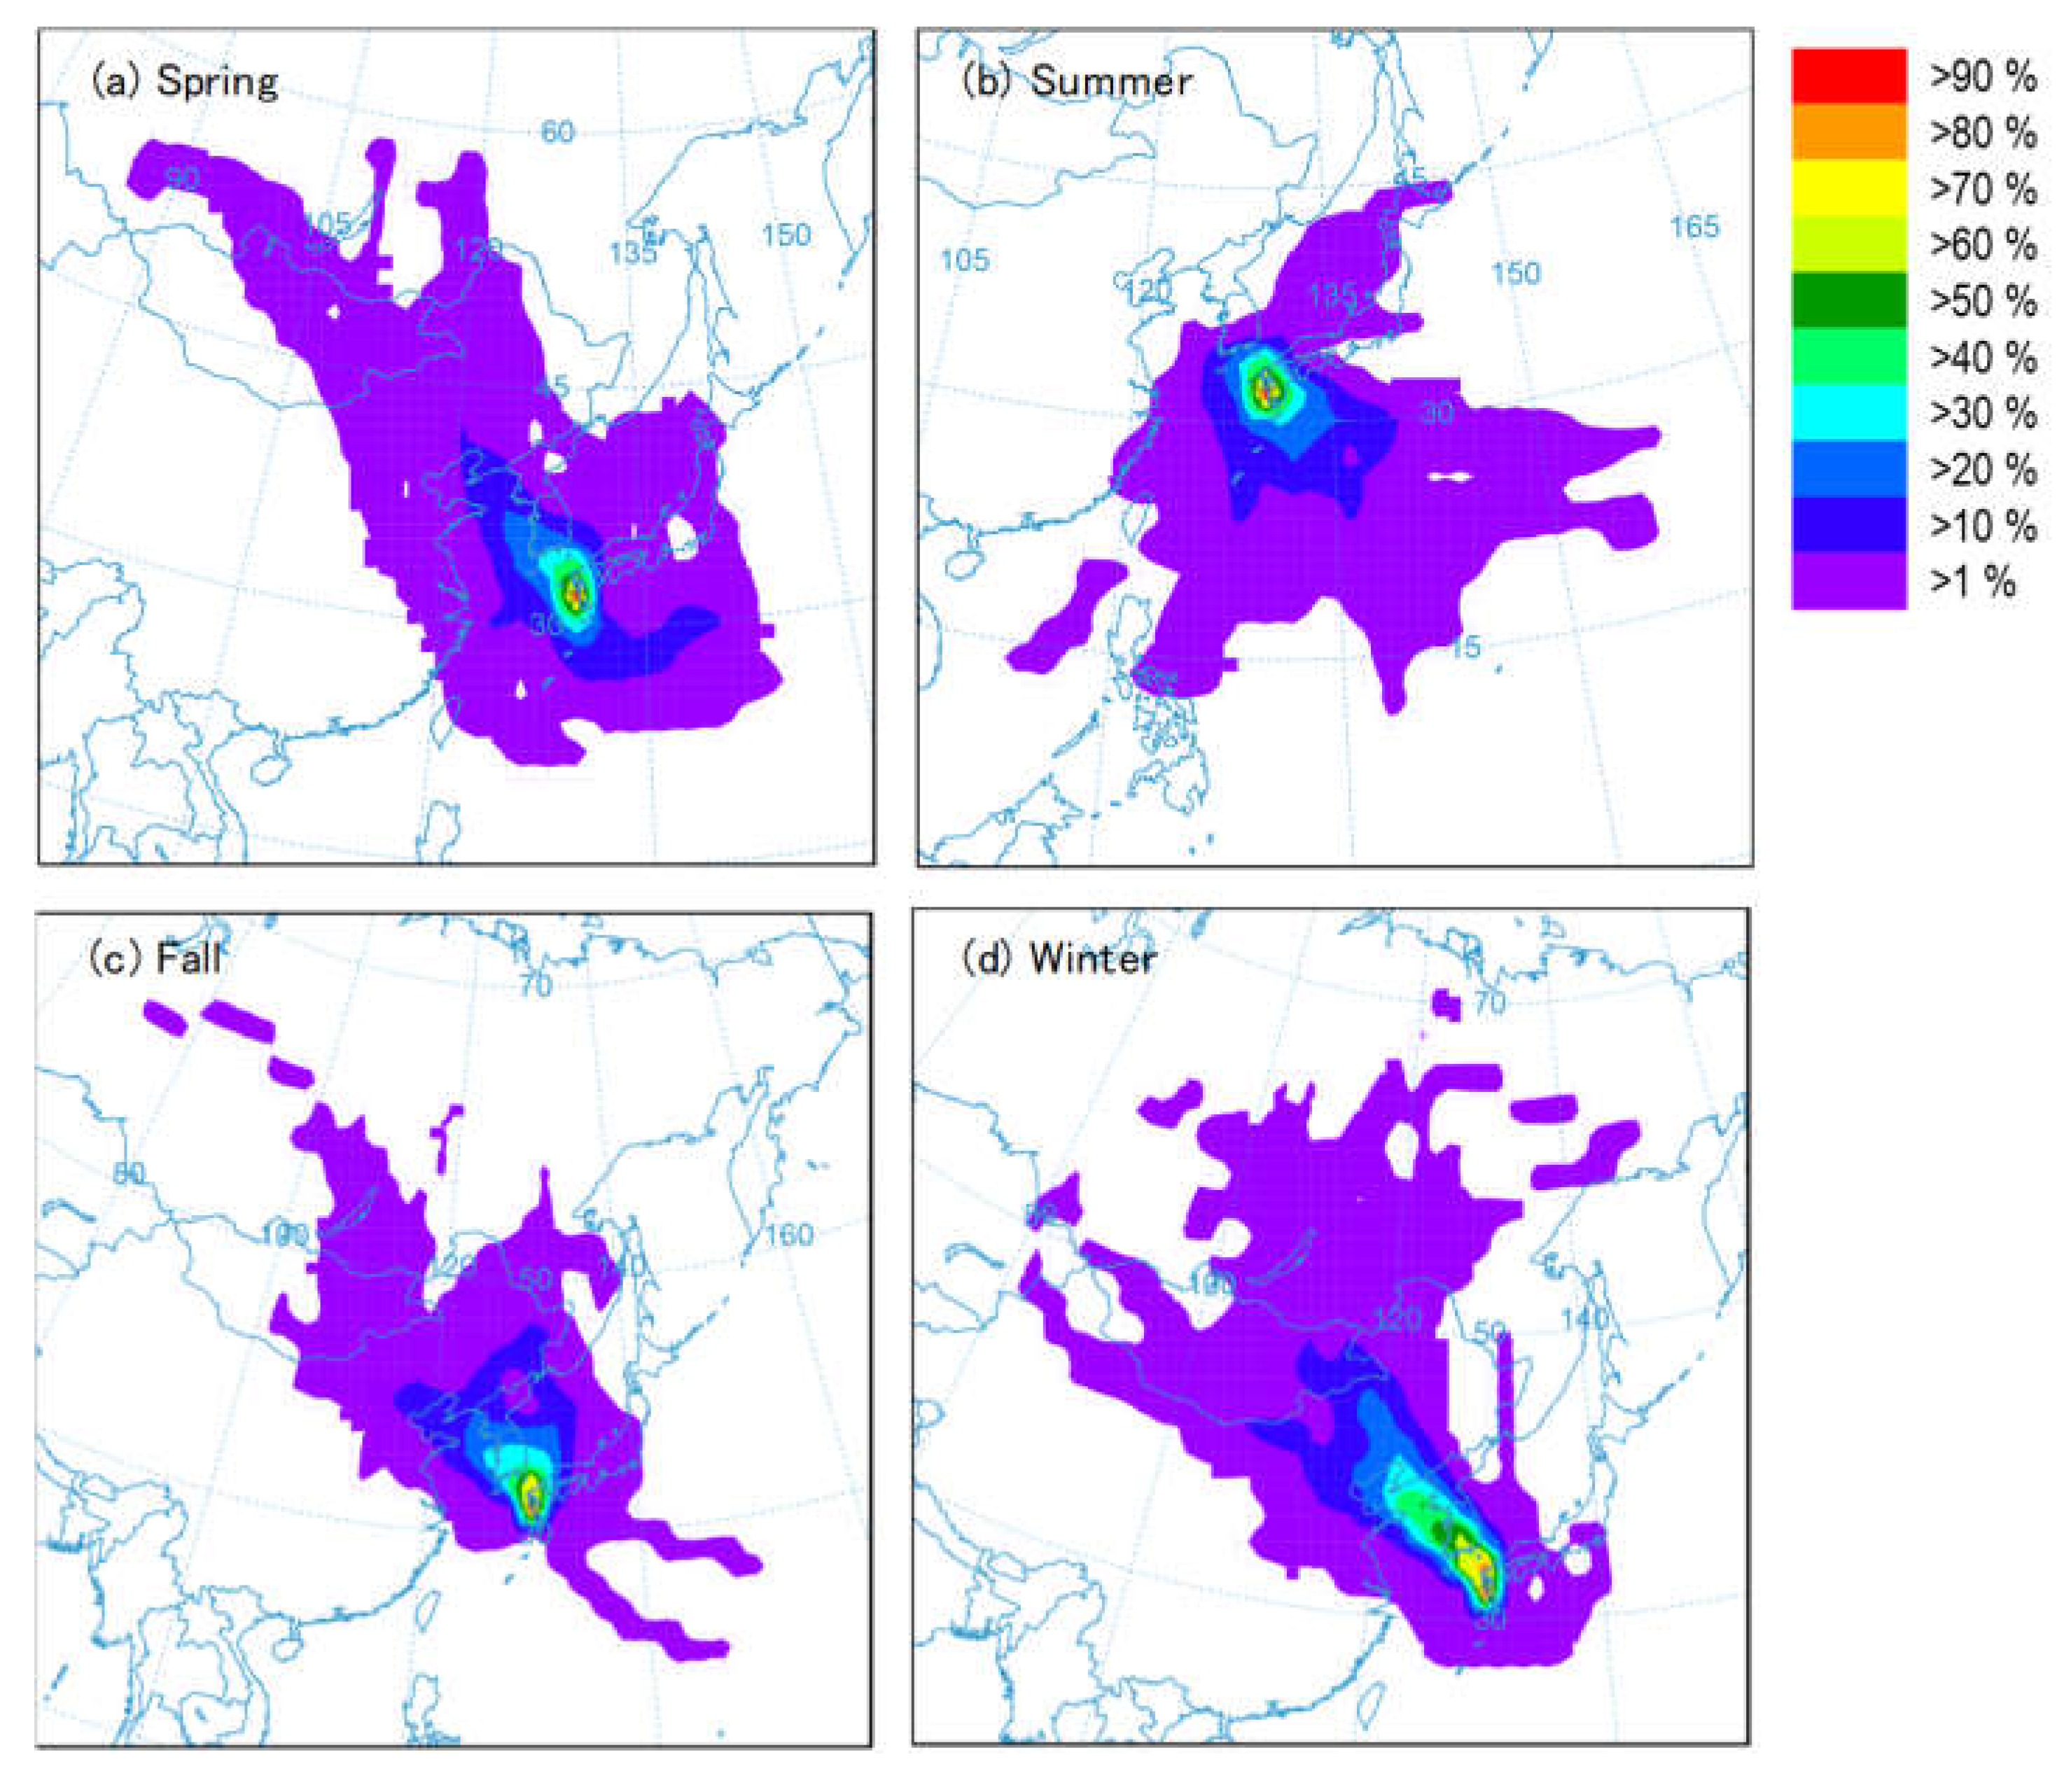
3.1. Back Trajectory Analysis
3.2. Concentration of PAHs and Genotoxicity
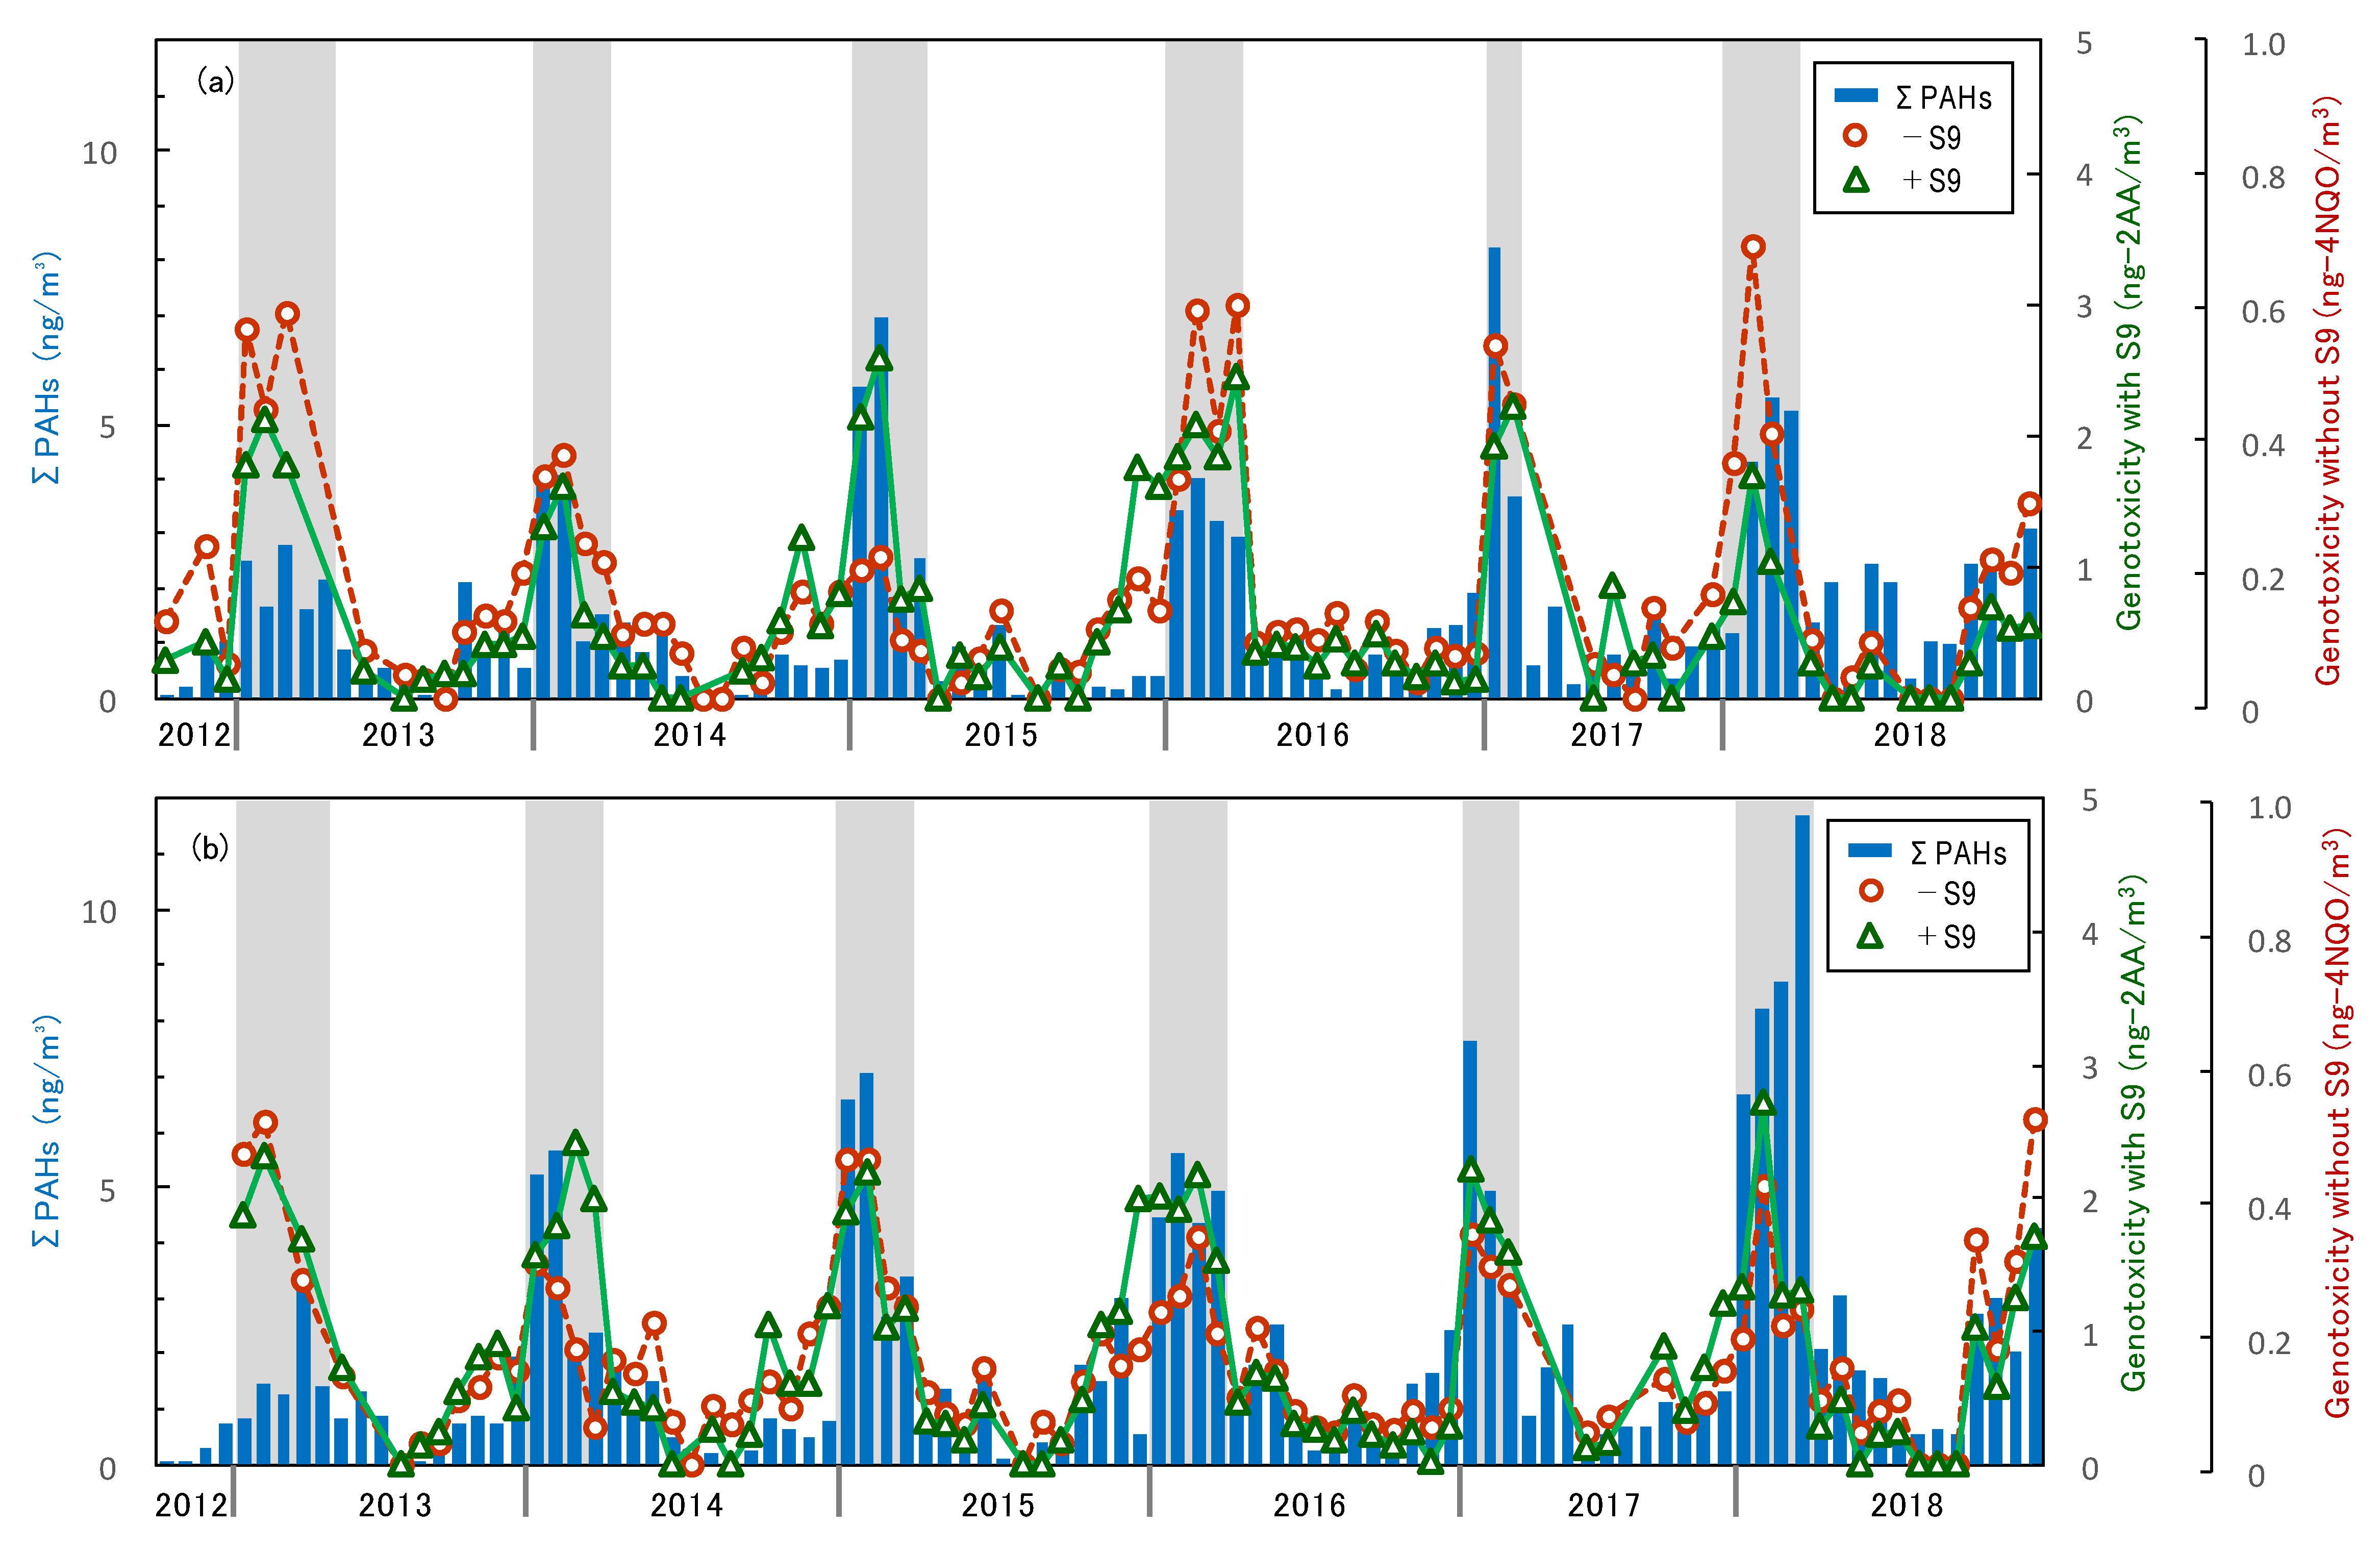
3.3. Seasonal Fluctuation
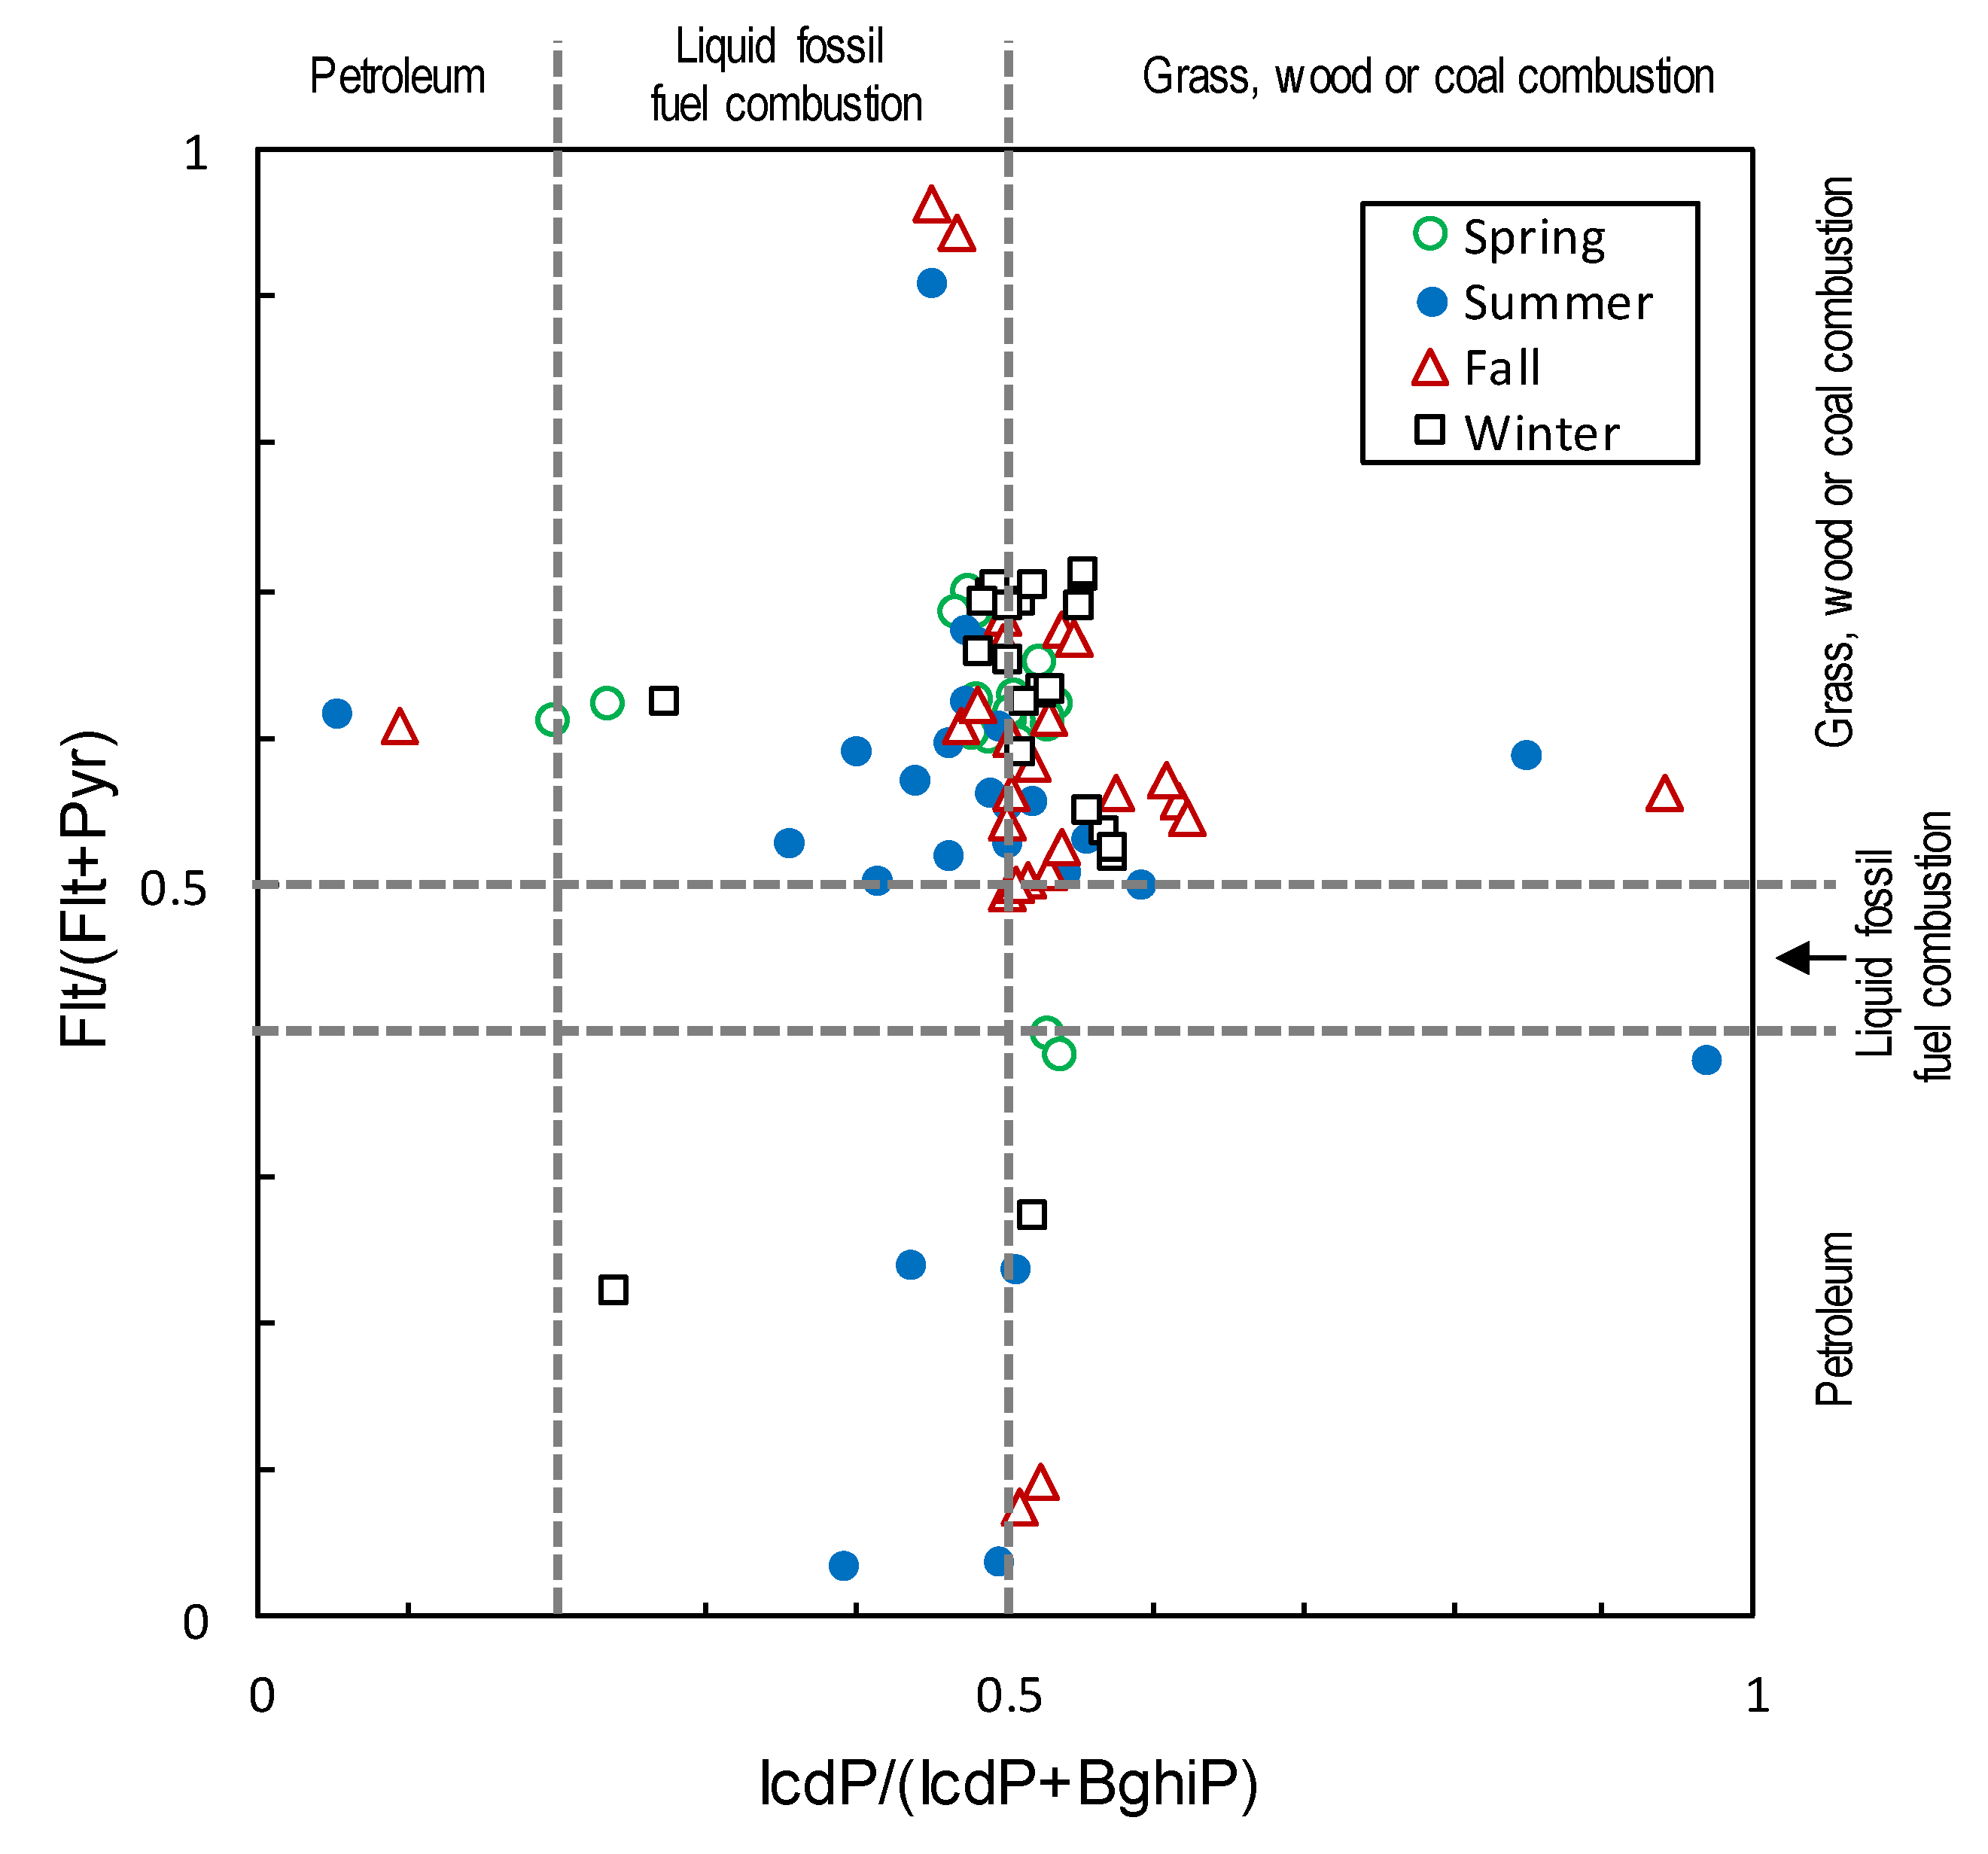
3.4. PAH Source Identification
3.5. Contribution of Transboundary Pollution
4. Conclusions
- Throughout the 6 years studied, there was no notable increase or decrease in PAH concentration or genotoxicity at either the forest or suburban sites. This indicated that the air pollution around these sites caused by PAHs or genotoxic substances did not improve or worsen during this period.
- In terms of PAH concentration and genotoxicity, the suburban and forest sites shared similar seasonal fluctuation patterns and quantitative values, suggesting that the western end of Japan might be affected by long-range transported pollutants, especially in winter.
- Back trajectory analysis results strongly suggested the influence of transboundary pollution from continental regions, such as northern China and the Korean peninsula, especially in winter. Combined with analysis of the diagnostic ratios of PAHs, coal or biomass combustion in the continental region was considered one of the main sources of atmospheric PAHs at the sampling site.
- PAH concentration and genotoxicity were correlated, showing the same seasonal patterns of increased levels in winter and lower levels in summer throughout the 6-year study period. It was considered that PAHs and genotoxic substances share common sources. This suggested that transboundary pollutants caused by coal and biomass combustion from the continental region were major sources of genotoxicity.
- It was estimated that the contribution of the transboundary PAH pollution at the suburban site could reach up to 70%.
Author Contributions
Funding
Acknowledgments
Conflicts of Interest
References
- IARC Working Group on the Evaluation of Carcinogenic Risks to Humans. IARC Monographs on the Evaluation of Carcinogenic Risks to Humans; International Agency for Research on Cancer: Lyon, France, 2010; Volume 92. [Google Scholar]
- Kubo, T.; Urano, K.; Utsumi, H. Mutagenicity characteristics of 255 environmental chemicals. J. Health Sci. 2002, 48, 545–554. [Google Scholar] [CrossRef]
- Fernandes, M.B.; Sicre, M.A.; Boireau, A.; Tronczynski, J. Polyaromatic hydrocarbon (PAH) distributions in the Seine River and its estuary. Mar. Pollut. Bull. 1997, 34, 857–867. [Google Scholar] [CrossRef]
- Shi, Z.; Tao, S.; Pan, B.; Fan, W.; He, X.C.; Zuo, Q.; Wu, S.P.; Li, B.G.; Cao, J.; Liu, W.X.; et al. Contamination of rivers in Tianjin, China by polycyclic aromatic hydrocarbons. Environ. Pollut. 2005, 134, 97–111. [Google Scholar] [CrossRef] [PubMed]
- Wang, Y.; Zhang, S.; Cui, W.; Meng, X.; Tang, X. Polycyclic aromatic hydrocarbons and organochlorine pesticides in surface water from the Yongding River basin, China: Seasonal distribution, source apportionment, and potential risk assessment. Sci. Total Environ. 2018, 618, 419–429. [Google Scholar] [CrossRef]
- Zakaria, M.P.; Takada, H.; Tsutsumi, S.; Ohno, K.; Yamada, J.; Kouno, E.; Kumata, H. Distribution of polycyclic aromatic hydrocarbons (PAHs) in rivers and estuaries in Malaysia: A widespread input of petrogenic PAHs. Environ. Sci. Technol. 2002, 36, 1907–1918. [Google Scholar] [CrossRef]
- Mai, B.X.; Fu, J.M.; Sheng, G.Y.; Kang, Y.H.; Lin, Z.; Zhang, G.; Min, Y.S.; Zeng, E.Y. Chlorinated and polycyclic aromatic hydrocarbons in riverine and estuarine sediments from Pearl River Delta, China. Environ. Pollut. 2002, 117, 457–474. [Google Scholar] [CrossRef]
- Edokpayi, J.; Odiyo, J.; Popoola, O.; Msagati, T. Determination and distribution of polycyclic aromatic hydrocarbons in rivers, sediments and wastewater effluents in Vhembe District, South Africa. Int. J. Environ. Res. Public Health 2016, 13, 387. [Google Scholar] [CrossRef]
- Bucheli, T.D.; Blum, F.; Desaules, A.; Gustafsson, Ö. Polycyclic aromatic hydrocarbons, black carbon, and molecular markers in soils of Switzerland. Chemosphere 2004, 56, 1061–1076. [Google Scholar] [CrossRef]
- Peng, C.; Chen, W.; Liao, X.; Wang, M.; Ouyang, Z.; Jiao, W.; Bai, Y. Polycyclic aromatic hydrocarbons in urban soils of Beijing: Status, sources, distribution and potential risk. Environ. Pollut. 2011, 159, 802–808. [Google Scholar] [CrossRef]
- Gereslassie, T.; Workineh, A.; Liu, X.; Yan, X.; Wang, J. Occurrence and ecological and human health risk assessment of polycyclic aromatic hydrocarbons in soils from Wuhan, central China. Int. J. Environ. Res. Public Health 2018, 15, 2751. [Google Scholar] [CrossRef]
- Guo, H.; Lee, S.C.; Ho, K.F.; Wang, X.M.; Zou, S.C. Particle-associated polycyclic aromatic hydrocarbons in urban air of Hong Kong. Atmos. Environ. 2003, 37, 5307–5317. [Google Scholar] [CrossRef]
- Albinet, A.; Leoz-Garziandia, E.; Budzinski, H.; Villenave, E. Polycyclic aromatic hydrocarbons (PAHs), nitrated PAHs and oxygenated PAHs in ambient air of the Marseilles area (south of France): Concentrations and sources. Sci. Total Environ. 2007, 384, 280–292. [Google Scholar] [CrossRef]
- Yang, L.; Suzuki, G.; Zhang, L.; Zhou, Q.; Zhang, X.; Xing, W.; Shima, M.; Yoda, Y.; Nakatsubo, R.; Hiraki, T.; et al. The characteristics of polycyclic aromatic hydrocarbons in different emission source areas in Shenyang, China. Int. J. Environ. Res. Public Health 2019, 16, 2817. [Google Scholar] [CrossRef] [PubMed]
- Crisafully, R.; Milhome, M.A.L.; Cavalcante, R.M.; Silveira, E.R.; De Keukeleire, D.; Nascimento, R.F. Removal of some polycyclic aromatic hydrocarbons from petrochemical wastewater using low-cost adsorbents of natural origin. Bioresour. Technol. 2008, 99, 4515–4519. [Google Scholar] [CrossRef] [PubMed]
- Qi, W.; Liu, H.; Qu, J.; Hu, C.; Lan, H.; Berg, M.; Ren, H.; Xu, W. Polycyclic aromatic hydrocarbons in effluents from wastewater treatment plants and receiving streams in Tianjin, China. Environ. Monit. Assess. 2011, 177, 467–480. [Google Scholar] [CrossRef] [PubMed]
- Qi, W.; Liu, H.; Pernet-Coudrier, B.; Qu, J. Polycyclic aromatic hydrocarbons in wastewater, WWTPs effluents and in the recipient waters of Beijing, China. Environ. Sci. Pollut. Res. 2013, 20, 4254–4260. [Google Scholar] [CrossRef] [PubMed]
- Lee, W.J.; Liow, M.C.; Tsai, P.J.; Hsieh, L.T. Emission of polycyclic aromatic hydrocarbons from medical waste incinerators. Atmos. Environ. 2002, 36, 781–790. [Google Scholar] [CrossRef]
- Yang, H.H.; Hsieh, L.T.; Liu, H.C.; Mi, H.H. Polycyclic aromatic hydrocarbon emissions from motorcycles. Atmos. Environ. 2005, 39, 17–25. [Google Scholar] [CrossRef]
- Borrás, E.; Tortajada-Genaro, L.A.; Vázquez, M.; Zielinska, B. Polycyclic aromatic hydrocarbon exhaust emissions from different reformulated diesel fuels and engine operating conditions. Atmos. Environ. 2009, 43, 5944–5952. [Google Scholar] [CrossRef]
- Pham, C.T.; Boongla, Y.; Nghiem, T.D.; Le, H.T.; Tang, N.; Toriba, A.; Hayakawa, K. Emission characteristics of polycyclic aromatic hydrocarbons and nitro-polycyclic aromatic hydrocarbons from open burning of rice straw in the north of vietnam. Int. J. Environ. Res. Public Health 2019, 16, 2343. [Google Scholar] [CrossRef]
- Cattaneo, A.; Fermo, P.; Urso, P.; Perrone, M.G.; Piazzalunga, A.; Tarlassi, J.; Carrer, P.; Cavallo, D.M. Particulate-bound polycyclic aromatic hydrocarbon sources and determinants in residential homes. Environ. Pollut. 2016, 218, 16–25. [Google Scholar] [CrossRef] [PubMed]
- Piazzalunga, A.; Anzano, M.; Collina, E.; Lasagni, M.; Lollobrigida, F.; Pannocchia, A.; Fermo, P.; Pitea, D. Contribution of wood combustion to PAH and PCDD/F concentrations in two urban sites in Northern Italy. J. Aerosol Sci. 2013, 56, 30–40. [Google Scholar] [CrossRef][Green Version]
- Marr, L.C.; Kirchstetter, T.W.; Harley, R.A.; Miguel, A.H.; Hering, S.V.; Hammond, S.K. Characterization of polycyclic aromatic hydrocarbons in motor vehicle fuels and exhaust emissions. Environ. Sci. Technol. 1999, 33, 3091–3099. [Google Scholar] [CrossRef]
- Zoccolillo, L.; Babi, D.; Felli, M. Evaluation of polycyclic aromatic hydrocarbons in gasoline by HPLC and GC-MS. Chromatographia 2000, 52, 373–376. [Google Scholar] [CrossRef]
- Zhao, Y.; Hong, B.; Fan, Y.; Wen, M.; Han, X. Accurate analysis of polycyclic aromatic hydrocarbons (PAHs) and alkylated PAHs homologs in crude oil for improving the gas chromatography/mass spectrometry performance. Ecotoxicol. Environ. Saf. 2014, 100, 242–250. [Google Scholar] [CrossRef]
- Yunker, M.B.; Macdonald, R.W.; Vingarzan, R.; Mitchell, R.H.; Goyette, D.; Sylvestre, S. PAHs in the Fraser River basin: A critical appraisal of PAH ratios as indicators of PAH source and composition. Org. Geochem. 2002, 33, 489–515. [Google Scholar] [CrossRef]
- Zhang, X.L.; Tao, S.; Liu, W.X.; Yang, Y.; Zuo, Q.; Liu, S.Z. Source diagnostics of polycyclic aromatic hydrocarbons based on species ratios: A multimedia approach. Environ. Sci. Technol. 2005, 39, 9109–9114. [Google Scholar] [CrossRef]
- De La Torre-Roche, R.J.; Lee, W.Y.; Campos-Díaz, S.I. Soil-borne polycyclic aromatic hydrocarbons in El Paso, Texas: Analysis of a potential problem in the United States/Mexico border region. J. Hazard. Mater. 2009, 163, 946–958. [Google Scholar] [CrossRef]
- Wirth, J.D. The Trail Smelter Dispute: Canadians and Americans Confront Transboundary Pollution, 1927–41. In Environmental History; Oxford University Press: Oxford, UK, 1996; Volume 1, pp. 34–51. [Google Scholar]
- REPORT OF THE UNITED NATIONS CONFERENCE ON ENVIRONMENT AND DEVELOPMENT. Available online: https://sustainabledevelopment.un.org/content/documents/1709riodeclarationeng.pdf (accessed on 21 December 2019).
- UNITED NATIONS FRAMEWORK CONVENTIONON CLIMATE CHANGE. Available online: https://unfccc.int/files/essential_background/background_publications_htmlpdf/application/pdf/conveng.pdf (accessed on 21 December 2019).
- Johnson, A.; Norton, D.; Yake, B.; Twiss, S. Transboundary metal pollution of the Columbia River (Franklin D. Roosevelt Lake). Bull. Environ. Contam. Toxicol. 1990, 45, 703–710. [Google Scholar] [CrossRef]
- Suleymanov, B.; Ahmedov, M.; Safarova, K.; Steinnes, E. Metals in main rivers of Azerbaijan: Influence of transboundary pollution. Water Air Soil Pollut. 2010, 213, 301–310. [Google Scholar] [CrossRef]
- Schudel, G.; Miserendino, R.A.; Veiga, M.M.; Velasquez-López, P.C.; Lees, P.S.J.; Winland-Gaetz, S.; Davée Guimarães, J.R.; Bergquist, B.A. An investigation of mercury sources in the Puyango-Tumbes River: Using stable Hg isotopes to characterize transboundary Hg pollution. Chemosphere 2018, 202, 777–787. [Google Scholar] [CrossRef] [PubMed]
- Berge, E.; Bartnicki, J.; Olendrzynski, K.; Tsyro, S.G. Long-term trends in emissions and transboundary transport of acidifying air pollution in Europe. J. Environ. Manag. 1999, 57, 31–50. [Google Scholar] [CrossRef]
- Chang, K.H.; Jeng, F.T.; Tsai, Y.L.; Lin, P.L. Modeling of long-range transport on Taiwan’s acid deposition under different weather conditions. Atmos. Environ. 2000, 34, 3281–3295. [Google Scholar] [CrossRef]
- Murano, K.; Mukai, H.; Hatakeyama, S.; Suk Jang, E.; Uno, I. Trans-boundary air pollution over remote islands in Japan: Observed data and estimates from a numerical model. Atmos. Environ. 2000, 34, 5139–5149. [Google Scholar] [CrossRef]
- Moreno, T.; Kojima, T.; Amato, F.; Lucarelli, F.; De La Rosa, J.; Calzolai, G.; Nava, S.; Chiari, M.; Alastuey, A.; Querol, X.; et al. Daily and hourly chemical impact of springtime transboundary aerosols on Japanese air quality. Atmos. Chem. Phys. 2013, 13, 1411–1424. [Google Scholar] [CrossRef]
- Masiol, M.; Benetello, F.; Harrison, R.M.; Formenton, G.; De Gaspari, F.; Pavoni, B. Spatial, seasonal trends and transboundary transport of PM2.5 inorganic ions in the Veneto region (Northeastern Italy). Atmos. Environ. 2015, 117, 19–31. [Google Scholar] [CrossRef]
- Itahashi, S.; Uno, I.; Osada, K.; Kamiguchi, Y.; Yamamoto, S.; Tamura, K.; Wang, Z.; Kurosaki, Y.; Kanaya, Y. Nitrate transboundary heavy pollution over East Asia in winter. Atmos. Chem. Phys. 2017, 17, 3823–3843. [Google Scholar] [CrossRef]
- Lunde, G.; Bjorseth, A. Polycyclic aromatic hydrocarbons in long-range transported aerosols. Nature 1977, 268, 518–519. [Google Scholar] [CrossRef]
- Yagishita, M.; Kageyama, S.; Ohshima, S.; Matsumoto, M.; Aoki, Y.; Goto, S.; Nakajima, D. Atmospheric concentration and carcinogenic risk of polycyclic aromatic hydrocarbons including benzo[c]fluorene, cyclopenta[c,d]pyrene, and benzo[j]fluoranthene in Japan. Atmos. Environ. 2015, 115, 263–268. [Google Scholar] [CrossRef]
- Odabasi, M.; Vardar, N.; Sofuoglu, A.; Tasdemir, Y.; Holsen, T.M. Polycyclic aromatic hydrocarbons (PAHs) in Chicago air. Sci. Total Environ. 1999, 227, 57–67. [Google Scholar] [CrossRef]
- Bari, M.A.; Baumbach, G.; Kuch, B.; Scheffknecht, G. Particle-phase concentrations of polycyclic aromatic hydrocarbons in ambient air of rural residential areas in southern Germany. Air Qual. Atmos. Health 2010, 3, 103–116. [Google Scholar] [CrossRef] [PubMed]
- Singh, D.P.; Gadi, R.; Mandal, T.K. Characterization of particulate-bound polycyclic aromatic hydrocarbons and trace metals composition of urban air in Delhi, India. Atmos. Environ. 2011, 45, 7653–7663. [Google Scholar] [CrossRef]
- Vestenius, M.; Leppänen, S.; Anttila, P.; Kyllönen, K.; Hatakka, J.; Hellén, H.; Hyvärinen, A.P.; Hakola, H. Background concentrations and source apportionment of polycyclic aromatic hydrocarbons in south-eastern Finland. Atmos. Environ. 2011, 45, 3391–3399. [Google Scholar] [CrossRef]
- Chen, Y.C.; Chiang, H.C.; Hsu, C.Y.; Yang, T.T.; Lin, T.Y.; Chen, M.J.; Chen, N.T.; Wu, Y.S. Ambient PM2.5-bound polycyclic aromatic hydrocarbons (PAHs) in Changhua county, central Taiwan: Seasonal variation, source apportionment and cancer risk assessment. Environ. Pollut. 2016, 218, 372–382. [Google Scholar] [CrossRef] [PubMed]
- Yang, L.; Tang, N.; Matsuki, A.; Takami, A.; Hatakeyama, S.; Kaneyasu, N.; Nagato, E.G.; Sato, K.; Yoshino, A.; Hayakawa, K. A comparison of particulate-bound polycyclic aromatic hydrocarbons long-range transported from the Asian continent to the Noto Peninsula and Fukue Island, Japan. Asian J. Atmos. Environ. 2018, 12, 369–376. [Google Scholar] [CrossRef]
- Kakimoto, H.; Kitamura, M.; Matsumoto, Y.; Sakai, S.; Kanoh, F.; Murahashi, T.; Akutsu, K.; Kizu, R.; Hayakawa, K. Comparison of atmospheric polycyclic aromatic hydrocarbons and nitropolycyclic aromatic hydrocarbons in Kanazawa, Sapporo and Tokyo. J. Health Sci. 2000, 46, 5–15. [Google Scholar] [CrossRef][Green Version]
- Tang, N.; Hattori, T.; Taga, R.; Igarashi, K.; Yang, X.; Tamura, K.; Kakimoto, H.; Mishukov, V.F.; Toriba, A.; Kizu, R.; et al. Polycyclic aromatic hydrocarbons and nitropolycyclic aromatic hydrocarbons in urban air particulates and their relationship to emission sources in the Pan-Japan Sea countries. Atmos. Environ. 2005, 39, 5817–5826. [Google Scholar] [CrossRef]
- Hayakawa, K.; Tang, N.; Nagato, E.G.; Toriba, A.; Sakai, S.; Kano, F.; Goto, S.; Endo, O.; Arashidani, K.; Kakimoto, H. Long term trends in atmospheric concentrations of polycyclic aromatic hydrocarbons and nitropolycyclic aromatic hydrocarbons: A study of Japanese cities from 1997 to 2014. Environ. Pollut. 2018, 233, 474–482. [Google Scholar] [CrossRef]
- Nassar, H.F.; Tang, N.; Kameda, T.; Toriba, A.; Khoder, M.I.; Hayakawa, K. Atmospheric concentrations of polycyclic aromatic hydrocarbons and selected nitrated derivatives in Greater Cairo, Egypt. Atmos. Environ. 2011, 45, 7352–7359. [Google Scholar] [CrossRef]
- Chuesaard, T.; Chetiyanukornkul, T.; Kameda, T.; Hayakawa, K.; Toriba, A. Influence of biomass burning on the levels of atmospheric polycyclic aromatic hydrocarbons and their nitro derivatives in Chiang Mai, Thailand. Aerosol Air Qual. Res. 2014, 14, 1247–1257. [Google Scholar] [CrossRef]
- Tang, N.; Suzuki, G.; Morisaki, H.; Tokuda, T.; Yang, X.; Zhao, L.; Lin, J.; Kameda, T.; Toriba, A.; Hayakawa, K. Atmospheric behaviors of particulate-bound polycyclic aromatic hydrocarbons and nitropolycyclic aromatic hydrocarbons in Beijing, China from 2004 to 2010. Atmos. Environ. 2017, 152, 354–361. [Google Scholar] [CrossRef]
- Manoli, E.; Kouras, A.; Samara, C. Profile analysis of ambient and source emitted particle-bound polycyclic aromatic hydrocarbons from three sites in northern Greece. Chemosphere 2004, 56, 867–878. [Google Scholar] [CrossRef]
- Li, Z.; Porter, E.N.; Sjödin, A.; Needham, L.L.; Lee, S.; Russell, A.G.; Mulholland, J.A. Characterization of PM2.5-bound polycyclic aromatic hydrocarbons in Atlanta–Seasonal variations at urban, suburban, and rural ambient air monitoring sites. Atmos. Environ. 2009, 43, 4187–4193. [Google Scholar] [CrossRef]
- Rehwagen, M.; Müller, A.; Massolo, L.; Herbarth, O.; Ronco, A. Polycyclic aromatic hydrocarbons associated with particles in ambient air from urban and industrial areas. Sci. Total Environ. 2005, 348, 199–210. [Google Scholar] [CrossRef]
- Matsushita, H.; Endo, O.; Goto, S.; Shimizu, H.; Matsumoto, H.; Tamakawa, K.; Endo, T.; Sakabe, Y.; Tokiwa, H.; Ando, M. Collaborative study using the preincubation Salmonella typhimurium mutation assay for airborne particulate matter in Japan. A trial to minimize interlaboratory variation. Mutat. Res. Environ. Mutagen. Relat. Subj. 1992, 271, 1–12. [Google Scholar] [CrossRef]
- De Aragão Umbuzeiro, G.; Roubicek, D.A.; Rech, C.M.; Sato, M.I.Z.; Claxton, L.D. Investigating the sources of the mutagenic activity found in a river using the Salmonella assay and different water extraction procedures. Chemosphere 2004, 54, 1589–1597. [Google Scholar] [CrossRef]
- Traversi, D.; Degan, R.; De Marco, R.; Gilli, G.; Pignata, C.; Villani, S.; Bono, R. Mutagenic properties of PM2.5 urban pollution in the Northern Italy: The nitro-compounds contribution. Environ. Int. 2009, 35, 905–910. [Google Scholar] [CrossRef]
- Wang, L.S.; Hu, H.Y.; Wang, C. Effect of ammonia nitrogen and dissolved organic matter fractions on the genotoxicity of wastewater effluent during chlorine disinfection. Environ. Sci. Technol. 2007, 41, 160–165. [Google Scholar] [CrossRef]
- Kubo, T.; Wang, L.; Kameya, T.; Kobayashi, T.; Hu, H.; Urano, K.; Shigeoka, T. Quantitative evaluation of the genotoxic activity of Japanese tap water using the umu test. J. Water Environ. Technol. 2015, 13, 291–300. [Google Scholar] [CrossRef][Green Version]
- Chai, Q.; Hu, A.; Qian, Y.; Ao, X.; Liu, W.; Yang, H.; Xie, Y.F. A comparison of genotoxicity change in reclaimed wastewater from different disinfection processes. Chemosphere 2018, 191, 335–341. [Google Scholar] [CrossRef]
- International Standard Organisation. Water quality—Determination of the Genotoxicity of Water and Waste Water Using the Umu-Test, 1st ed.; ISO 13829; International Standard Organisation: Geneva, Switzerland, 2000; pp. 1–18. [Google Scholar]
- Sugimura, Y.; Kubo, T.; Murata, N.; Urano, K.; Shigeoka, T. Development of the efficient umu-test system for evaluation of genotoxicity of water samples. Jpn. J. Environ. Toxicol. 2008, 11, 21–32. [Google Scholar]
- Kameya, T.; Nagato, T.; Nakagawa, K.; Yamashita, D.; Kobayashi, T.; Fujie, K. Quantification of umu genotoxicity level of urban river water. Water Sci. Technol. 2011, 63, 410–415. [Google Scholar] [CrossRef]
- Bai, W.; Takao, Y.; Kubo, T. Evaluation of genotoxicity potential of household effluents from onsite wastewater treatment systems using umu test. J. Toxicol. Environ. Health Part A 2020. [Google Scholar] [CrossRef]
- Stein, A.F.; Draxler, R.R.; Rolph, G.D.; Stunder, B.J.B.; Cohen, M.D.; Ngan, F. Noaa’s hysplit atmospheric transport and dispersion modeling system. Bull. Am. Meteorol. Soc. 2015, 96, 2059–2077. [Google Scholar] [CrossRef]
- Rolph, G.; Stein, A.; Stunder, B. Real-time Environmental Applications and Display sYstem: READY. Environ. Model. Softw. 2017, 95, 210–228. [Google Scholar] [CrossRef]
- Tobiszewski, M.; Namieśnik, J. PAH diagnostic ratios for the identification of pollution emission sources. Environ. Pollut. 2012, 162, 110–119. [Google Scholar] [CrossRef]
- Huang, L.; Chernyak, S.M.; Batterman, S.A. PAHs (polycyclic aromatic hydrocarbons), nitro-PAHs, and hopane and sterane biomarkers in sediments of southern Lake Michigan, USA. Sci. Total Environ. 2014, 487, 173–186. [Google Scholar] [CrossRef]
- Shi, G.L.; Feng, Y.C.; Wu, J.H.; Li, X.; Wang, Y.Q.; Xue, Y.H.; Zhu, T. Source identification of polycyclic aromatic hydrocarbons in urban particulate matter of Tangshan, China. Aerosol Air Qual. Res. 2009, 9, 309–315. [Google Scholar] [CrossRef]
- Byambaa, B.; Yang, L.; Matsuki, A.; Nagato, E.G.; Gankhuyag, K.; Chuluunpurev, B.; Banzragch, L.; Chonokhuu, S.; Tang, N.; Hayakawa, K. Sources and characteristics of polycyclic aromatic hydrocarbons in ambient total suspended particles in Ulaanbaatar City, Mongolia. Int. J. Environ. Res. Public Health 2019, 16, 442. [Google Scholar] [CrossRef]
- Matsumoto, Y.; Sakai, S.; Kato, T.; Nakajima, T.; Satoh, H. Long-term trends of particulate mutagenic activity in atmosphere of Sapporo. 1. Determination of mutagenic activity by the conventional tester strains TA98 and TA100 during an 18-year period (1974-1992). Environ. Sci. Technol. 1998, 32, 2665–2671. [Google Scholar] [CrossRef]
- Zwodziak, J.; Jadczyk, P.; Kucharczyk, J. Seasonal variability of the mutagenicity of airborne particles in the town center. J. Aerosol Sci. 2001, 32, 409–423. [Google Scholar] [CrossRef]
- Coulibaly, S.; Minami, H.; Abe, M.; Hasei, T.; Sera, N.; Yamamoto, S.; Funasaka, K.; Asakawa, D.; Watanabe, M.; Honda, N.; et al. Seasonal fluctuations in air pollution in Dazaifu, Japan, and effect of long-range transport from mainland East Asia. Biol. Pharm. Bull. 2015, 38, 1395–1403. [Google Scholar] [CrossRef]
- Yang, X.Y.; Okada, Y.; Tang, N.; Matsunaga, S.; Tamura, K.; Lin, J.M.; Kameda, T.; Toriba, A.; Hayakawa, K. Long-range transport of polycyclic aromatic hydrocarbons from China to Japan. Atmos. Environ. 2007, 41, 2710–2718. [Google Scholar] [CrossRef]
- Ikeda, K.; Yamaji, K.; Kanaya, Y.; Taketani, F.; Pan, X.; Komazaki, Y.; Kurokawa, J.; Ohara, T. Sensitivity analysis of source regions to PM2.5 concentration at Fukue Island, Japan. J. Air Waste Manag. Assoc. 2014, 64, 445–452. [Google Scholar] [CrossRef]


| Parameters | Forest Site | Suburban Site | ||||||||
|---|---|---|---|---|---|---|---|---|---|---|
| Total Average | Spring | Summer | Fall | Winter | Total Average | Spring | Summer | Fall | Winter | |
| Concentration of | ||||||||||
| PAHs (ng/m³) | (n = 95) | (n = 21) | (n = 25) | (n = 26) | (n = 23) | (n = 97) | (n = 22) | (n = 25) | (n = 26) | (n = 24) |
| Acy | 0.012 ± 0.021 | 0.004 ± 0.002 | 0.005 ± 0.008 | 0.007 ± 0.007 | 0.034 ± 0.034 | 0.024 ± 0.105 | 0.005 ± 0.003 | 0.003 ± 0.003 | 0.010 ± 0.012 | 0.079 ± 0.203 |
| Ace | 0.003 ± 0.005 | 0.001 ± 0.001 | 0.004 ± 0.007 | 0.004 ± 0.006 | 0.002 ± 0.002 | 0.004 ± 0.006 | 0.001 ± 0.001 | 0.005 ± 0.008 | 0.004 ± 0.008 | 0.003 ± 0.003 |
| Flu | 0.032 ± 0.086 | 0.006 ± 0.005 | 0.024 ± 0.082 | 0.009 ± 0.008 | 0.090 ± 0.140 | 0.046 ± 0.119 | 0.042 ± 0.151 | 0.005 ± 0.007 | 0.017 ± 0.036 | 0.125 ± 0.165 |
| Phe | 0.182 ± 0.257 | 0.101 ± 0.063 | 0.027 ± 0.037 | 0.081 ± 0.077 | 0.538 ± 0.302 | 0.198 ± 0.301 | 0.135 ± 0.082 | 0.046 ± 0.045 | 0.095 ± 0.070 | 0.526 ± 0.459 |
| Ant | 0.035 ± 0.162 | 0.015 ± 0.039 | 0.005 ± 0.008 | 0.018 ± 0.023 | 0.104 ± 0.321 | 0.047 ± 0.170 | 0.032 ± 0.074 | 0.013 ± 0.023 | 0.018 ± 0.025 | 0.129 ± 0.324 |
| Flt | 0.273 ± 0.322 | 0.204 ± 0.127 | 0.053 ± 0.053 | 0.198 ± 0.194 | 0.662 ± 0.399 | 0.342 ± 0.413 | 0.275 ± 0.155 | 0.047 ± 0.041 | 0.203 ± 0.157 | 0.861 ± 0.508 |
| Pyr | 0.177 ± 0.194 | 0.125 ± 0.063 | 0.054 ± 0.095 | 0.133 ± 0.127 | 0.409 ± 0.225 | 0.211 ± 0.229 | 0.173 ± 0.079 | 0.049 ± 0.047 | 0.141 ± 0.123 | 0.489 ± 0.281 |
| BaA | 0.065 ± 0.076 | 0.045 ± 0.025 | 0.021 ± 0.031 | 0.061 ± 0.061 | 0.136 ± 0.103 | 0.124 ± 0.368 | 0.093 ± 0.087 | 0.017 ± 0.014 | 0.061 ± 0.061 | 0.333 ± 0.700 |
| Chr | 0.168 ± 0.194 | 0.122 ± 0.084 | 0.034 ± 0.038 | 0.148 ± 0.134 | 0.378 ± 0.252 | 0.245 ± 0.296 | 0.178 ± 0.135 | 0.036 ± 0.031 | 0.248 ± 0.209 | 0.521 ± 0.412 |
| BbF * | 0.268 ± 0.390 | 0.161 ± 0.125 | 0.081 ± 0.063 | 0.167 ± 0.182 | 0.705 ± 0.600 | 0.467 ± 0.647 | 0.260 ± 0.248 | 0.081 ± 0.073 | 0.387 ± 0.429 | 1.173 ± 0.895 |
| BkF * | 0.051 ± 0.069 | 0.047 ± 0.063 | 0.026 ± 0.037 | 0.055 ± 0.037 | 0.079 ± 0.113 | 0.068 ± 0.081 | 0.054 ± 0.046 | 0.018 ± 0.016 | 0.065 ± 0.057 | 0.140 ± 0.119 |
| BaP | 0.097 ± 0.097 | 0.088 ± 0.086 | 0.035 ± 0.043 | 0.098 ± 0.090 | 0.173 ± 0.108 | 0.094 ± 0.098 | 0.087 ± 0.052 | 0.035 ± 0.053 | 0.095 ± 0.074 | 0.159 ± 0.144 |
| DahA | 0.023 ± 0.054 | 0.023 ± 0.058 | 0.017 ± 0.037 | 0.014 ± 0.011 | 0.038 ± 0.085 | 0.019 ± 0.025 | 0.015 ± 0.014 | 0.005 ± 0.007 | 0.022 ± 0.019 | 0.035 ± 0.038 |
| IcdP | 0.092 ± 0.109 | 0.069 ± 0.058 | 0.044 ± 0.057 | 0.095 ± 0.154 | 0.163 ± 0.094 | 0.117 ± 0.128 | 0.084 ± 0.069 | 0.025 ± 0.034 | 0.108 ± 0.085 | 0.251 ± 0.162 |
| BghiP | 0.094 ± 0.135 | 0.083 ± 0.087 | 0.040 ± 0.052 | 0.065 ± 0.049 | 0.194 ± 0.224 | 0.140 ± 0.190 | 0.109 ± 0.119 | 0.035 ± 0.035 | 0.109 ± 0.089 | 0.313 ± 0.286 |
| ΣPAHs | 1.495 ± 1.570 | 1.039 ± 0.587 | 0.439 ± 0.471 | 1.117 ± 0.795 | 3.485 ± 1.864 | 1.996 ± 2.209 | 1.469 ± 0.662 | 0.388 ± 0.283 | 1.436 ± 0.991 | 4.761 ± 2.721 |
| Genotoxicity | (n = 81) | (n = 17) | (n = 19) | (n = 25) | (n = 20) | (n = 82) | (n = 17) | (n = 19) | (n = 24) | (n = 22) |
| -S9 (ng-4NQO/m3) | 0.16 ± 0.16 | 0.076 ± 0.040 | 0.040 ± 0.043 | 0.14 ± 0.062 | 0.39 ± 0.18 | 0.16 ± 0.12 | 0.12 ± 0.048 | 0.046 ± 0.037 | 0.16 ± 0.11 | 0.30 ± 0.11 |
| +S9 (ng-2AA/m3) | 0.65 ± 0.70 | 0.21 ± 0.15 | 0.21 ± 0.22 | 0.53 ± 0.44 | 1.6 ± 0.64 | 0.84 ± 0.74 | 0.39 ± 0.21 | 0.14 ± 0.13 | 0.81 ± 0.48 | 1.8 ± 0.44 |
© 2020 by the authors. Licensee MDPI, Basel, Switzerland. This article is an open access article distributed under the terms and conditions of the Creative Commons Attribution (CC BY) license (http://creativecommons.org/licenses/by/4.0/).
Share and Cite
Kubo, T.; Bai, W.; Nagae, M.; Takao, Y. Seasonal Fluctuation of Polycyclic Aromatic Hydrocarbons and Aerosol Genotoxicity in Long-Range Transported Air Mass Observed at the Western End of Japan. Int. J. Environ. Res. Public Health 2020, 17, 1210. https://doi.org/10.3390/ijerph17041210
Kubo T, Bai W, Nagae M, Takao Y. Seasonal Fluctuation of Polycyclic Aromatic Hydrocarbons and Aerosol Genotoxicity in Long-Range Transported Air Mass Observed at the Western End of Japan. International Journal of Environmental Research and Public Health. 2020; 17(4):1210. https://doi.org/10.3390/ijerph17041210
Chicago/Turabian StyleKubo, Takashi, Wenzhi Bai, Masaki Nagae, and Yuji Takao. 2020. "Seasonal Fluctuation of Polycyclic Aromatic Hydrocarbons and Aerosol Genotoxicity in Long-Range Transported Air Mass Observed at the Western End of Japan" International Journal of Environmental Research and Public Health 17, no. 4: 1210. https://doi.org/10.3390/ijerph17041210
APA StyleKubo, T., Bai, W., Nagae, M., & Takao, Y. (2020). Seasonal Fluctuation of Polycyclic Aromatic Hydrocarbons and Aerosol Genotoxicity in Long-Range Transported Air Mass Observed at the Western End of Japan. International Journal of Environmental Research and Public Health, 17(4), 1210. https://doi.org/10.3390/ijerph17041210