Urban Form, Air Quality, and Cardiorespiratory Mortality: A Path Analysis


Abstract
1. Introduction
2. Prior Research
3. Data and Methods
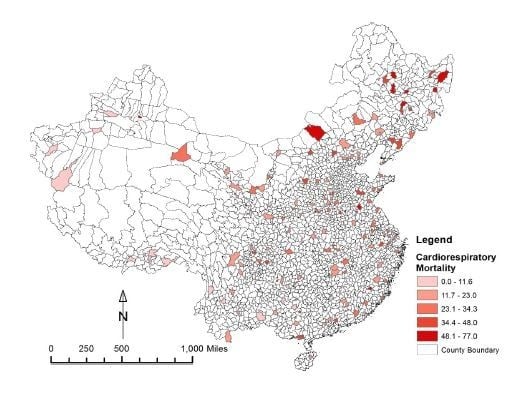
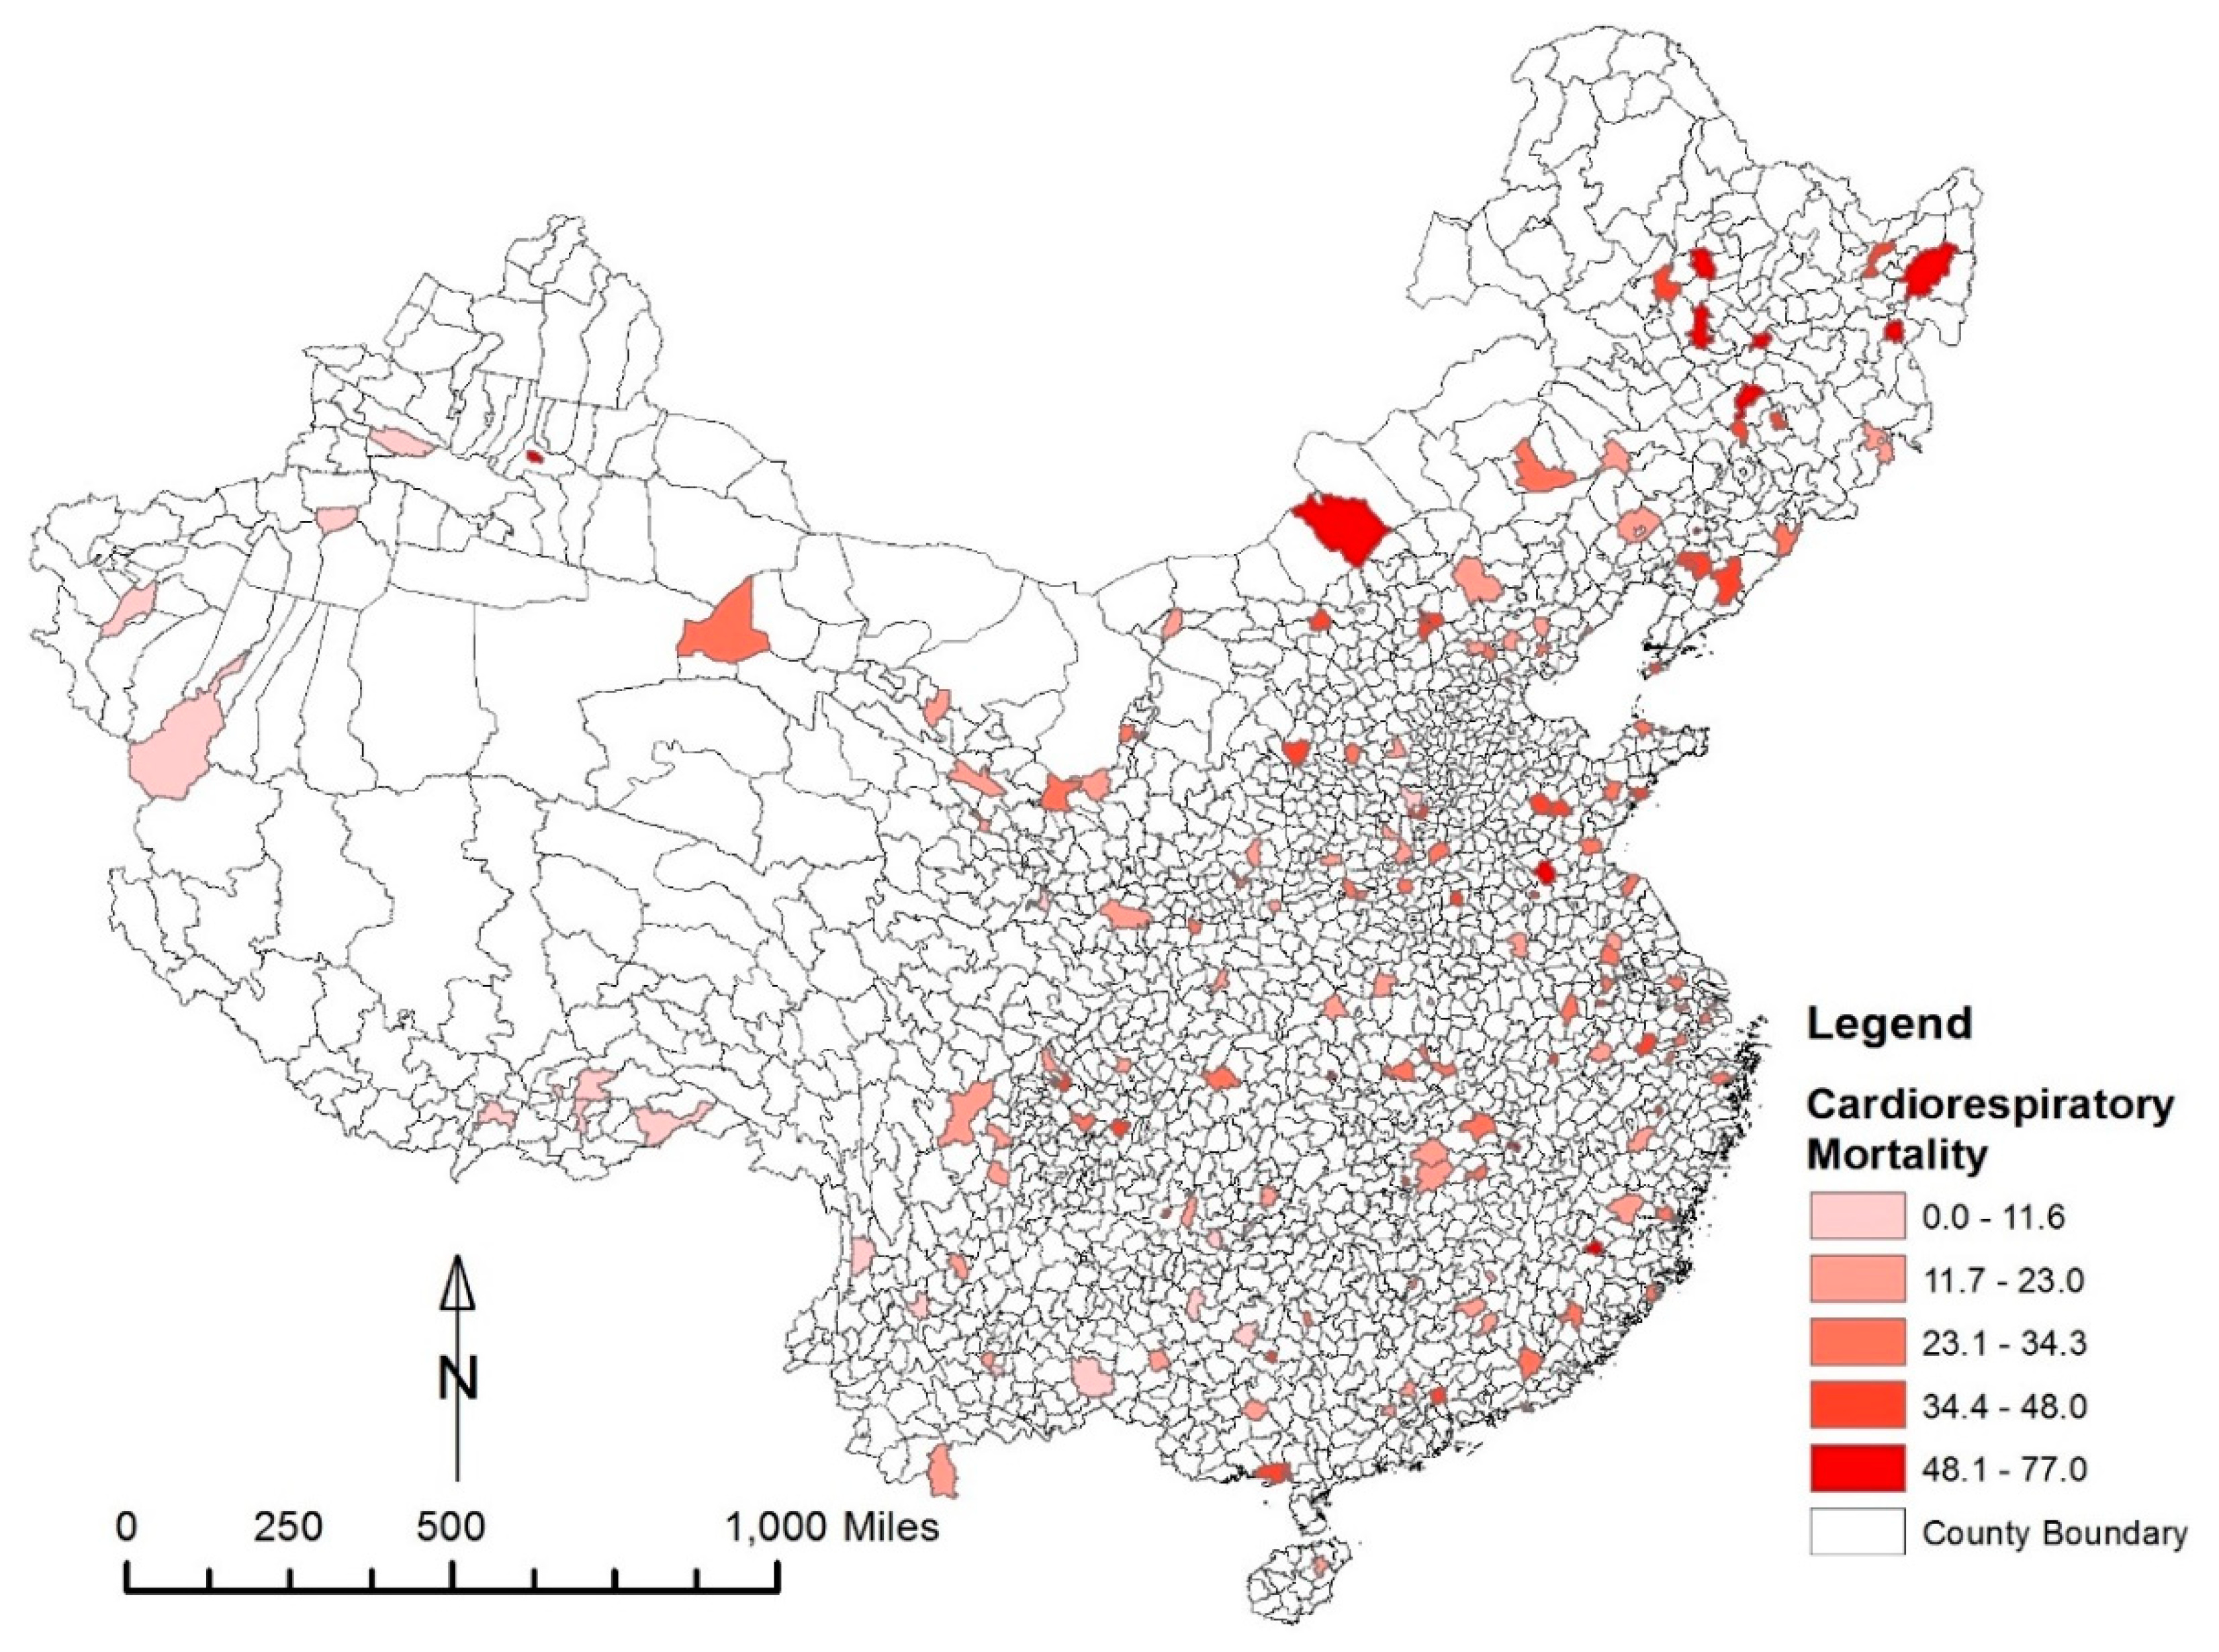
3.1. Mortality Data
3.2. Urban Form Measures
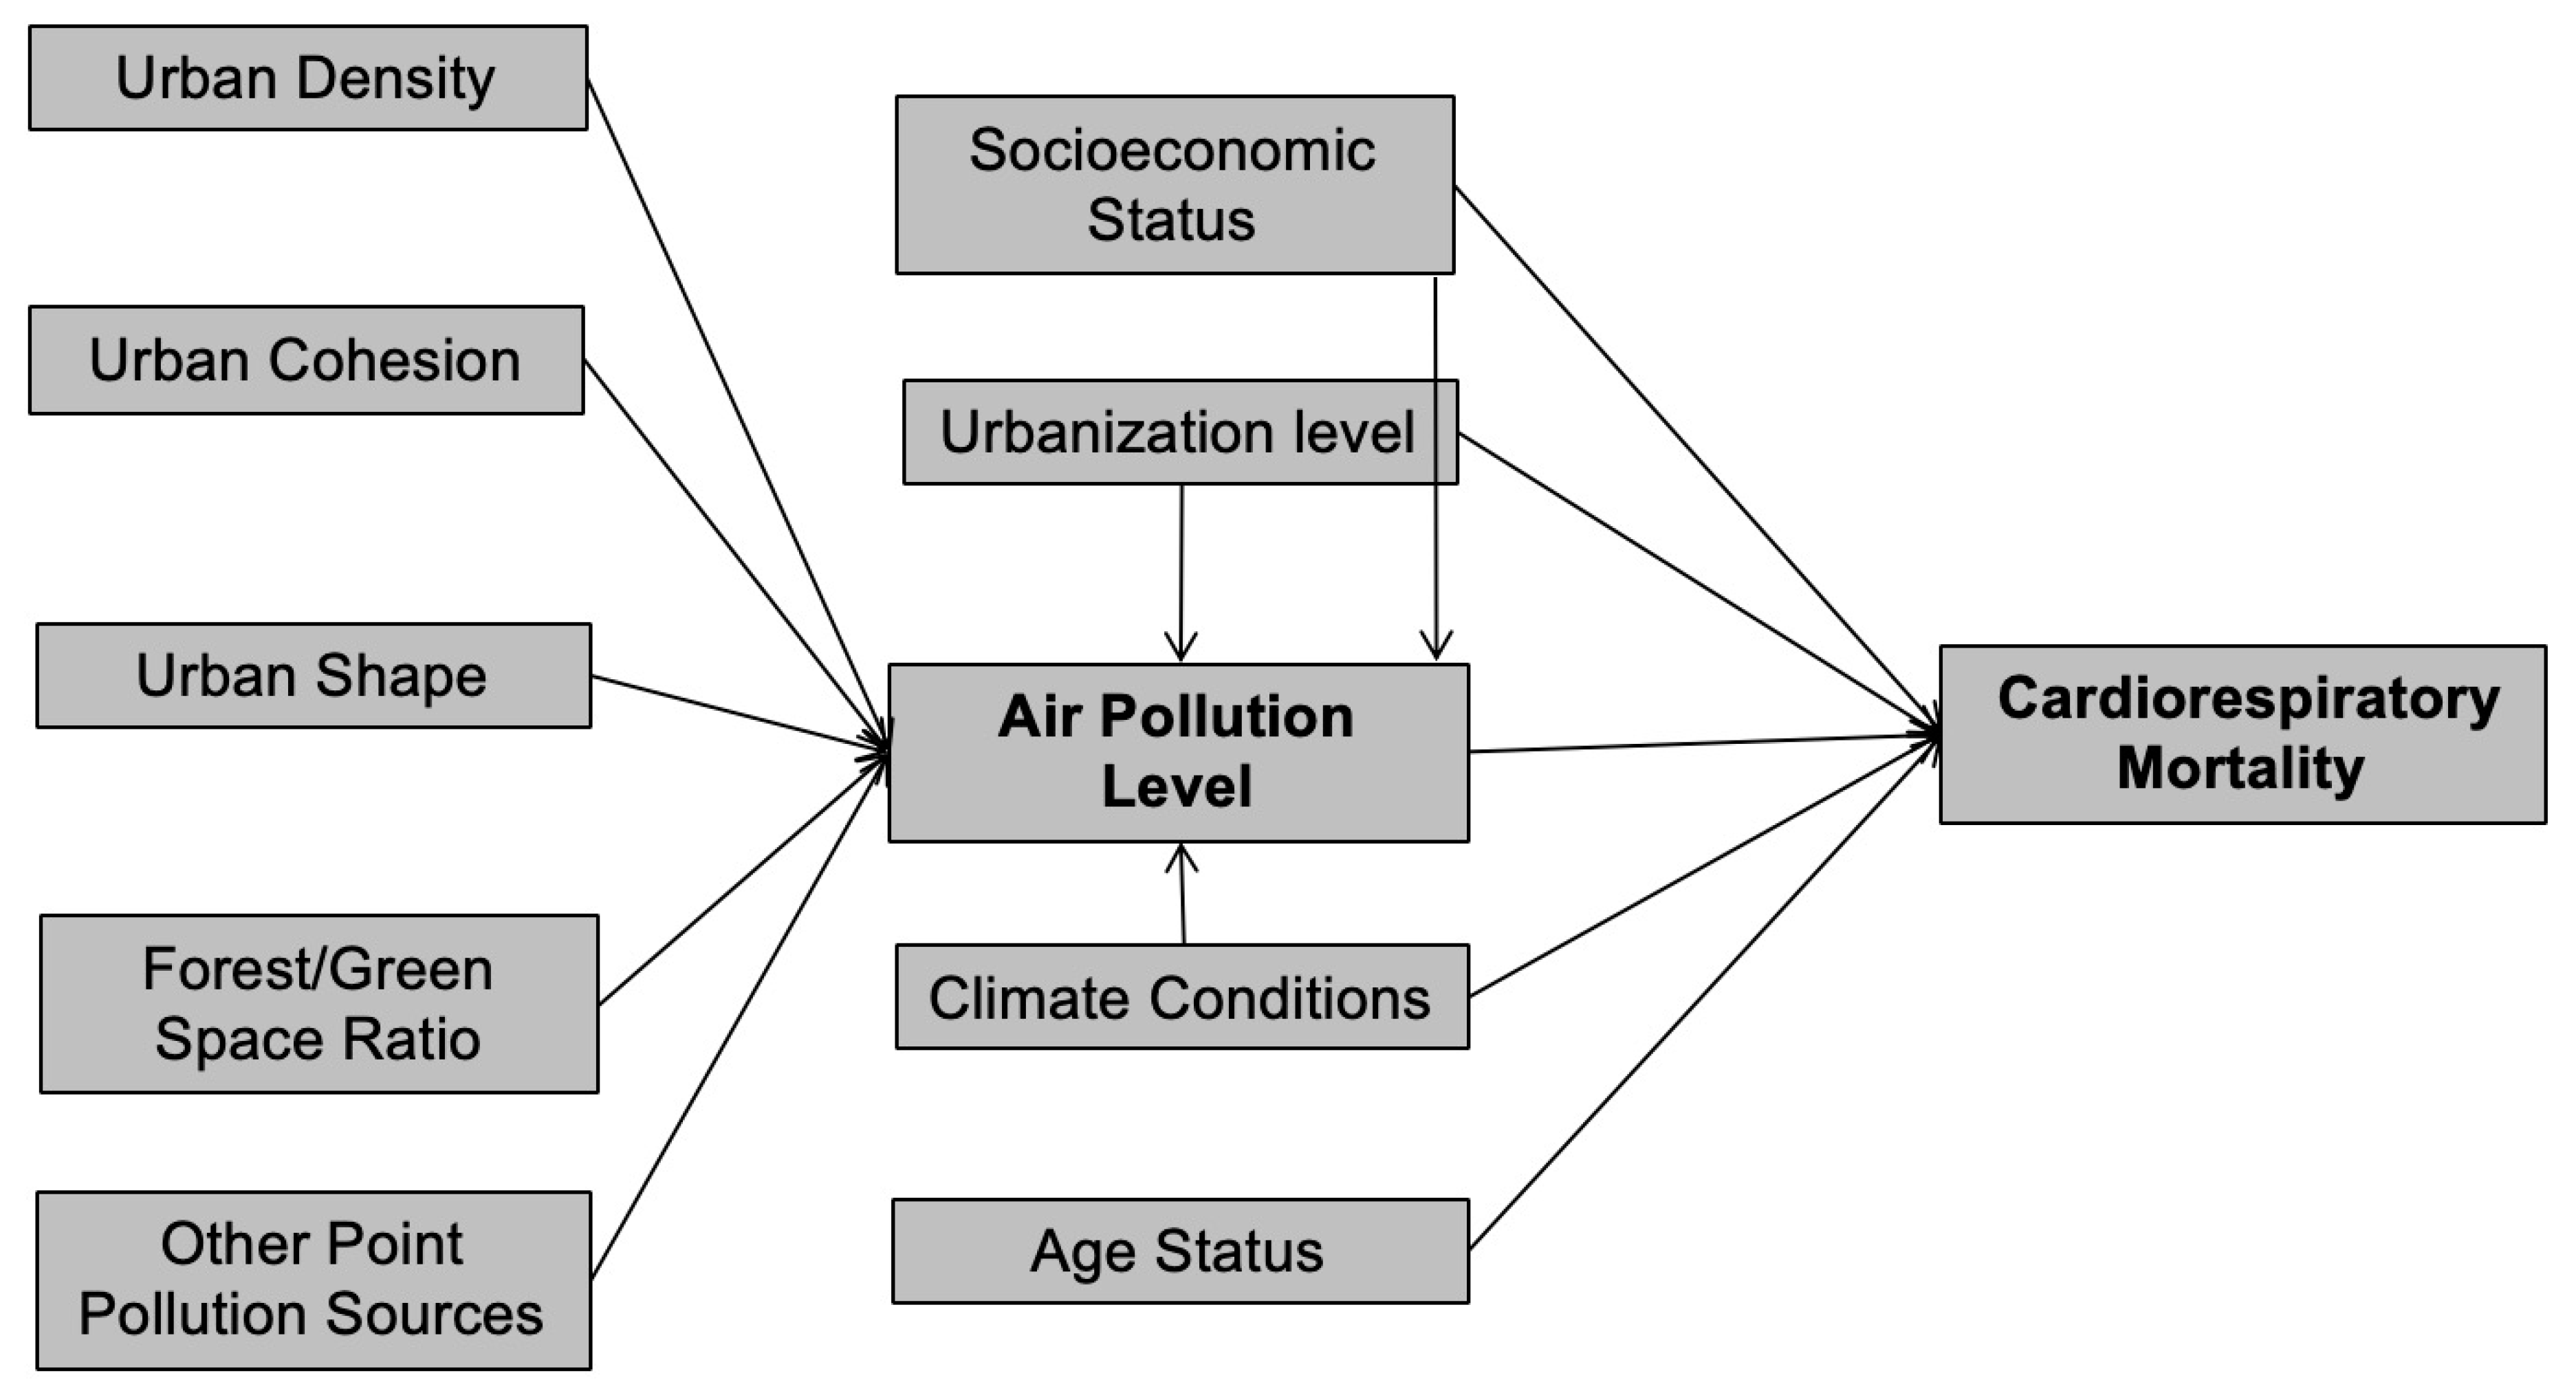
3.3. Conceptual Framework
3.4. Variable Coding and Descriptive Statistics
3.5. Model Specification
- CardioR = Cardiorespiratory mortality ratio within the county
- GDP = Gross domestic product per capita of the county
- UrbanC = Dummy variable indicating if the county is an urban county or not
- PM = Population-weighted annual average PM2.5 within the county
- HDD = Annual heating degree days of the nearest temperature station
- EldR = Percentage of elderly residents within the county
- PopD = Population density within the urban area of the county
- CohenI = Urban Cohesion Index
- PerimeR = Perimeter-Area Ratio
- ForestR = Total forest/green space divided by total area within the county boundary
- PollD = Total number of pollution companies divided by total area within the county boundary
- ε = error coefficients
- β = robust maximum likelihood estimates of independent variables.
4. Findings
5. Discussions
6. Conclusions and Policy Implications
Author Contributions
Funding
Acknowledgments
Conflicts of Interest
References
- Chan, C.K.; Yao, X. Air pollution in mega cities in China. Atmos. Environ. 2008, 42, 1–42. [Google Scholar] [CrossRef]
- Chen, Y.; Ebenstein, A.; Greenstone, M.; Li, H. Evidence on the impact of sustained exposure to air pollution on life expectancy from China’s Huai River policy. Proc. Natl. Acad. Sci. USA 2013, 110, 12936–12941. [Google Scholar] [CrossRef] [PubMed]
- Ebenstein, A.; Fan, M.; Greenstone, M.; He, G.; Zhou, M. New evidence on the impact of sustained exposure to air pollution on life expectancy from China’s Huai River Policy. Proc. Natl. Acad. Sci. USA 2017, 114, 10384–10389. [Google Scholar] [CrossRef] [PubMed]
- Xuemei, B.; Peijun, S.; Yansui, L. Realizing China’s urban dream. Nature 2014, 509, 158–160. [Google Scholar]
- HEI. State of Global Air 2017: A Special Report on Global Exposure to Air Pollution and Its Disease Burden; Health Effects Institute: Boston, MA, USA, 2017. [Google Scholar]
- Gauderman, W.J.; Avol, E.; Lurmann, F.; Kuenzli, N.; Gilliland, F.; Peters, J.; McConnell, R. Childhood asthma and exposure to traffic and nitrogen dioxide. Epidemiology 2005, 16, 737–743. [Google Scholar] [CrossRef] [PubMed]
- Brauer, M.; Lencar, C.; Tamburic, L.; Koehoorn, M.; Demers, P.; Karr, C. A cohort study of traffic-related air pollution impacts on birth outcomes. Environ. Health Perspect. 2008, 116, 680–686. [Google Scholar] [CrossRef]
- Hoek, G.; Beelen, R.; De Hoogh, K.; Vienneau, D.; Gulliver, J.; Fischer, P.; Briggs, D. A review of land-use regression models to assess spatial variation of outdoor air pollution. Atmos. Environ. 2008, 42, 7561–7578. [Google Scholar] [CrossRef]
- Raaschou-Nielsen, O.; Andersen, Z.J.; Beelen, R.; Samoli, E.; Stafoggia, M.; Weinmayr, G.; Hoffmann, B.; Fischer, P.; Nieuwenhuijsen, M.J.; Brunekreef, B. Air pollution and lung cancer incidence in 17 European cohorts: Prospective analyses from the European Study of Cohorts for Air Pollution Effects (ESCAPE). Lancet Oncol. 2013, 14, 813–822. [Google Scholar] [CrossRef]
- NCCR. Chinese Cancer Registry Annual Report; Military Medical Science Press: Beijing, China, 2014; Volume 17, pp. 44–47. [Google Scholar]
- Lim, Y.-H.; Kim, H.; Kim, J.H.; Bae, S.; Park, H.Y.; Hong, Y.-C. Air pollution and symptoms of depression in elderly adults. Environ. Health Perspect. 2012, 120, 1023–1028. [Google Scholar] [CrossRef]
- Dadvand, P.; Nieuwenhuijsen, M.J.; Esnaola, M.; Forns, J.; Basagaña, X.; Alvarez-Pedrerol, M.; Rivas, I.; López-Vicente, M.; Pascual, M.D.C.; Su, J. Green spaces and cognitive development in primary schoolchildren. Proc. Natl. Acad. Sci. USA 2015, 112, 7937–7942. [Google Scholar] [CrossRef]
- Zheng, S.; Wang, J.; Sun, C.; Zhang, X.; Kahn, M.E. Air pollution lowers Chinese urbanites’ expressed happiness on social media. Nat. Hum. Behav. 2019, 3, 237. [Google Scholar] [CrossRef]
- Li, C. Essays on Climate Change Mitigation, Building Energy Efficiency, and Urban Form; The University of North Carolina at Chapel Hill: Chapel Hill, NC, USA, 2018. [Google Scholar]
- Holden, E.; Norland, I.T. Three challenges for the compact city as a sustainable urban form: Household consumption of energy and transport in eight residential areas in the greater Oslo region. Urban Stud. 2005, 42, 2145–2166. [Google Scholar] [CrossRef]
- Glaeser, E.L.; Kahn, M.E. The greenness of cities: Carbon dioxide emissions and urban development. J. Urban Econ. 2010, 67, 404–418. [Google Scholar] [CrossRef]
- Hankey, S.; Marshall, J.D. Impacts of urban form on future US passenger-vehicle greenhouse gas emissions. Energy Policy 2010, 38, 4880–4887. [Google Scholar] [CrossRef]
- Lee, S.; Lee, B. The influence of urban form on GHG emissions in the US household sector. Energy Policy 2014, 68, 534–549. [Google Scholar] [CrossRef]
- Borrego, C.; Martins, H.; Tchepel, O.; Salmim, L.; Monteiro, A.; Miranda, A.I. How urban structure can affect city sustainability from an air quality perspective. Environ. Model. Softw. 2006, 21, 461–467. [Google Scholar] [CrossRef]
- Zhou, Y.; Levy, J.I. The impact of urban street canyons on population exposure to traffic-related primary pollutants. Atmos. Environ. 2008, 42, 3087–3098. [Google Scholar] [CrossRef]
- Kahyaoğlu-Koračin, J.; Bassett, S.D.; Mouat, D.A.; Gertler, A.W. Application of a scenario-based modeling system to evaluate the air quality impacts of future growth. Atmos. Environ. 2009, 43, 1021–1028. [Google Scholar] [CrossRef]
- Bereitschaft, B.; Debbage, K. Urban form, air pollution, and CO2 emissions in large US metropolitan areas. Prof. Geogr. 2013, 65, 612–635. [Google Scholar] [CrossRef]
- Requia, W.J.; Roig, H.L.; Koutrakis, P.; Rossi, M.S. Mapping alternatives for public policy decision making related to human exposures from air pollution sources in the Federal District, Brazil. Land Use Policy 2016, 59, 375–385. [Google Scholar] [CrossRef]
- Yuan, M.; Song, Y.; Huang, Y.; Hong, S.; Huang, L. Exploring the association between urban form and air quality in China. J. Plan. Educ. Res. 2018, 38, 413–426. [Google Scholar] [CrossRef]
- Liu, Y.; Fang, F.; Li, Y. Key issues of land use in China and implications for policy making. Land Use Policy 2014, 40, 6–12. [Google Scholar] [CrossRef]
- Su, S.; Zhang, Q.; Pi, J.; Wan, C.; Weng, M. Public health in linkage to land use: Theoretical framework, empirical evidence, and critical implications for reconnecting health promotion to land use policy. Land Use Policy 2016, 57, 605–618. [Google Scholar] [CrossRef]
- Hankey, S.; Marshall, J.D. Urban form, air pollution, and health. Curr. Environ. Health Rep. 2017, 4, 491–503. [Google Scholar] [CrossRef] [PubMed]
- Martins, H. Urban compaction or dispersion? An air quality modelling study. Atmos. Environ. 2012, 54, 60–72. [Google Scholar] [CrossRef]
- Mansfield, T.J.; Rodriguez, D.A.; Huegy, J.; MacDonald Gibson, J. The effects of urban form on ambient air pollution and public health risk: A case study in Raleigh, North Carolina. Risk Anal. 2015, 35, 901–918. [Google Scholar] [CrossRef]
- Nowak, D.J.; Crane, D.E.; Stevens, J.C. Air pollution removal by urban trees and shrubs in the United States. Urban For. Urban Green. 2006, 4, 115–123. [Google Scholar] [CrossRef]
- Bechle, M.J.; Millet, D.B.; Marshall, J.D. Effects of income and urban form on urban NO2: Global evidence from satellites. Environ. Sci. Technol. 2011, 45, 4914–4919. [Google Scholar] [CrossRef]
- McCarty, J.; Kaza, N. Urban form and air quality in the United States. Landsc. Urban Plan. 2015, 139, 168–179. [Google Scholar] [CrossRef]
- Rodríguez, M.C.; Dupont-Courtade, L.; Oueslati, W. Air pollution and urban structure linkages: Evidence from European cities. Renew. Sustain. Energy Rev. 2016, 53, 1–9. [Google Scholar] [CrossRef]
- Fan, C.; Tian, L.; Zhou, L.; Hou, D.; Song, Y.; Qiao, X.; Li, J. Examining the impacts of urban form on air pollutant emissions: Evidence from China. J. Environ. Manag. 2018, 212, 405. [Google Scholar] [CrossRef] [PubMed]
- Yuan, M.; Huang, Y.; Shen, H.; Li, T. Effects of urban form on haze pollution in China: Spatial regression analysis based on PM2. 5 remote sensing data. Appl. Geogr. 2018, 98, 215–223. [Google Scholar] [CrossRef]
- Yuan, M.; Song, Y.; Guo, L. Exploring Determinants of Urban Form in China through an Empirical Study among 115 Cities. Sustainability 2018, 10, 3648. [Google Scholar] [CrossRef]
- Zhou, C.; Li, S.; Wang, S. Examining the Impacts of Urban Form on Air Pollution in Developing Countries: A Case Study of China’s Megacities. Int. J. Environ. Res. Public Health 2018, 15, 1565. [Google Scholar] [CrossRef] [PubMed]
- Clark, L.P.; Millet, D.B.; Marshall, J.D. Air quality and urban form in US urban areas: Evidence from regulatory monitors. Environ. Sci. Technol. 2011, 45, 7028–7035. [Google Scholar] [CrossRef]
- Han, S.; Sun, B. Impact of Population Density on PM2. 5 Concentrations: A Case Study in Shanghai, China. Sustainability 2019, 11, 1968. [Google Scholar] [CrossRef]
- Evans, G.W. The built environment and mental health. J. Urban Health 2003, 80, 536–555. [Google Scholar] [CrossRef]
- Gascon, M.; Zijlema, W.; Vert, C.; White, M.P.; Nieuwenhuijsen, M.J. Outdoor blue spaces, human health and well-being: A systematic review of quantitative studies. Int. J. Hyg. Environ. Health 2017, 220, 1207–1221. [Google Scholar] [CrossRef]
- Chen, R.; Kan, H.; Chen, B.; Huang, W.; Bai, Z.; Song, G.; Pan, G. Association of particulate air pollution with daily mortality: The China Air Pollution and Health Effects Study. Am. J. Epidemiol. 2012, 175, 1173–1181. [Google Scholar] [CrossRef]
- Zhou, M.; Liu, Y.; Wang, L.; Kuang, X.; Xu, X.; Kan, H. Particulate air pollution and mortality in a cohort of Chinese men. Environ. Pollut. 2014, 186, 1–6. [Google Scholar] [CrossRef]
- Zhong, S.; Yu, Z.; Zhu, W. Study of the Effects of Air Pollutants on Human Health Based on Baidu Indices of Disease Symptoms and Air Quality Monitoring Data in Beijing, China. Int. J. Environ. Res. Public Health 2019, 16, 1014. [Google Scholar] [CrossRef] [PubMed]
- Chen, R.; Yin, P.; Meng, X.; Wang, L.; Liu, C.; Niu, Y.; Lin, Z.; Liu, Y.; Liu, J.; Qi, J. Associations between ambient nitrogen dioxide and daily cause-specific mortality: Evidence from 272 Chinese cities. Epidemiology 2018, 29, 482–489. [Google Scholar] [CrossRef] [PubMed]
- Wu, R.; Zhong, L.; Huang, X.; Xu, H.; Liu, S.; Feng, B.; Wang, T.; Song, X.; Bai, Y.; Wu, F. Temporal variations in ambient particulate matter reduction associated short-term mortality risks in Guangzhou, China: A time-series analysis (2006–2016). Sci. Total Environ. 2018, 645, 491–498. [Google Scholar] [CrossRef] [PubMed]
- Wu, R.; Song, X.; Chen, D.; Zhong, L.; Huang, X.; Bai, Y.; Hu, W.; Ye, S.; Xu, H.; Feng, B. Health benefit of air quality improvement in Guangzhou, China: Results from a long time-series analysis (2006–2016). Environ. Int. 2019, 126, 552–559. [Google Scholar] [CrossRef]
- Schweitzer, L.; Zhou, J. Neighborhood air quality, respiratory health, and vulnerable populations in compact and sprawled regions. J. Am. Plan. Assoc. 2010, 76, 363–371. [Google Scholar] [CrossRef]
- Stone, B., Jr. Urban sprawl and air quality in large US cities. J. Environ. Manag. 2008, 86, 688–698. [Google Scholar] [CrossRef]
- Higgins, C.D.; Adams, M.D.; Réquia, W.J.; Mohamed, M. Accessibility, air pollution, and congestion: Capturing spatial trade-offs from agglomeration in the property market. Land Use Policy 2019, 84, 177–191. [Google Scholar] [CrossRef]
- Gustafson, E.J. Quantifying landscape spatial pattern: What is the state of the art? Ecosystems 1998, 1, 143–156. [Google Scholar] [CrossRef]
- Pinto, A.J.; Remesar, A.B. Urban cohesion: A public space network assessment. W@ Terfront Public Art Urban Des. Civ. Particip. Urban Regen. 2015, 39, 7–25. [Google Scholar]
- Mertes, C.M.; Schneider, A.; Sulla-Menashe, D.; Tatem, A.; Tan, B. Detecting change in urban areas at continental scales with MODIS data. Remote Sens. Environ. 2015, 158, 331–347. [Google Scholar] [CrossRef]
- Dillon, W.R.; Goldstein, M. Multivariate Analysismethods and Applications; Wiley: Hoboken, NJ, USA, 1984. [Google Scholar]
- Finney, S.J.; DiStefano, C. Non-normal and categorical data in structural equation modeling. Struct. Equ. Model. A Second Course 2006, 10, 269–314. [Google Scholar]
- Satorra, A.; Bentler, P.M. Ensuring positiveness of the scaled difference chi-square test statistic. Psychometrika 2010, 75, 243–248. [Google Scholar] [CrossRef] [PubMed]
- Han, S.S.; Green, R.; Wang, M.Y. Towards Low Carbon Cities in China: Urban form and Greenhouse Gas Emissions; Routledge: Abingdon upon Thames, UK, 2014. [Google Scholar]
- She, Q.; Peng, X.; Xu, Q.; Long, L.; Wei, N.; Liu, M.; Jia, W.; Zhou, T.; Han, J.; Xiang, W. Air quality and its response to satellite-derived urban form in the Yangtze River Delta, China. Ecol. Indic. 2017, 75, 297–306. [Google Scholar] [CrossRef]
- Selden, T.M.; Song, D. Environmental quality and development: Is there a Kuznets curve for air pollution emissions? J. Environ. Econ. Manag. 1994, 27, 147–162. [Google Scholar] [CrossRef]
- Knowles, R.D. Transit oriented development in Copenhagen, Denmark: From the finger plan to Ørestad. J. Transp. Geogr. 2012, 22, 251–261. [Google Scholar] [CrossRef]


| Variables | Definition | Source |
|---|---|---|
| Cardiorespiratory Mortality Rate | Cardiorespiratory mortality incidence per 100,000 population | China’s Disease Surveillance Points (DSP) system, which forms a nationally representative sample of mortality for the year 2005. |
| Annual PM2.5 1 | Population-weighted annual average PM2.5 | Global Annual PM2.5 Grids from MODIS 2, MISR 3 and SeaWiFS 4 Aerosol Optical Depth (AOD) with GWR 5, v1 (2005); 1 km Grid Population Dataset of China |
| Population Density | Total population divided by total area within the county boundary | 1 km Grid Population Dataset of China; County boundary shapefile of China |
| Urban Cohesion Index | Patch cohesion index measures the physical connectedness of the urban patch | National Land Use/Cover Database of China 2005 (30 m × 30 m); Calculated from GIS and Fragstats |
| Perimeter-Area Ratio | Area-weighted Perimeter-Area Ratio measures the shape complexity of urban landscape | National Land Use/Cover Database of China 2005 (30 m × 30 m); Calculated from GIS 6 and Fragstats |
| Forest/Green Space Ratio | Forest/green space area divided by total area within the county boundary | National Land Use/Cover Database of China 2005 (30 m × 30 m); Calculated from GIS and Fragstats |
| Heating Degree Days | Annual Heating Degree Days of the nearest temperature station | Calculated from 2005 daily temperature data From nationwide monitoring stations |
| Urban County | Dummy variable indicating if the county is urban or not | China Urban Statistical Yearbook 2005 |
| Percentage of Elderly Residents (Age > 65) | Percentage of elderly residents with age >65 | China Census Data 2000 |
| Pollution Company Density | Total number of pollution companies divided by total area within the county boundary | Calculated from GIS; Nationwide Pollution Companies Data with geo information |
| GDP 7 Per Capita | GDP Per Capita | 1 km Grid GDP dataset of China in 2005; County boundary shapefile of China |
| Variables | M | SD | Min | Max |
|---|---|---|---|---|
| Cardiorespiratory Mortality Rate (per 10,000) | 27.89 | 14.94 | 0.00 | 77.04 |
| Annual PM2.5 1 (μg/m3) | 36.94 | 17.27 | 2.17 | 78.36 |
| Population Density (/km2) | 360.02 | 324.83 | 0.16 | 2132.77 |
| Urban Cohesion Index | 53.67 | 29.74 | 0.00 | 100.00 |
| Perimeter-Area Ratio | 28.33 | 9.08 | 0.00 | 40.00 |
| Forest/Green Space Ratio (%) | 28.37 | 26.52 | 0.00 | 89.96 |
| Heating Degree Days | 2530.61 | 1402.21 | 93.80 | 5893.20 |
| Urban County | 0.51 | - | 0.00 | 1.00 |
| Percentage of Elderly Residents (Age > 65) | 6.97 | 1.91 | 2.73 | 17.31 |
| Pollution Company Density (/100 km2) | 3.44 | 6.68 | 0.00 | 56.17 |
| GDP 2 Per Capita (10,000 RMB 3) | 4.50 | 10.49 | 0.02 | 89.44 |
| Exogenous | ||||||||||
|---|---|---|---|---|---|---|---|---|---|---|
| Endogenous | PopD | CohenI | PerimeR | ForestR | PollD | EldR | UrbanC | HDD | GDP | PM |
| PM | ||||||||||
| β | 0.021 | −0.093 | 0.210 | −0.091 | 3.637 | −0.561 | 0.001 | −0.075 | ||
| St. β | 0.396 | −0.162 | 0.11 | −0.192 | 0.450 | −0.016 | 0.116 | −0.043 | ||
| z | 3.07 | −1.72 | 1.28 | −2.63 | 4.81 | −0.25 | 2.03 | −0.69 | ||
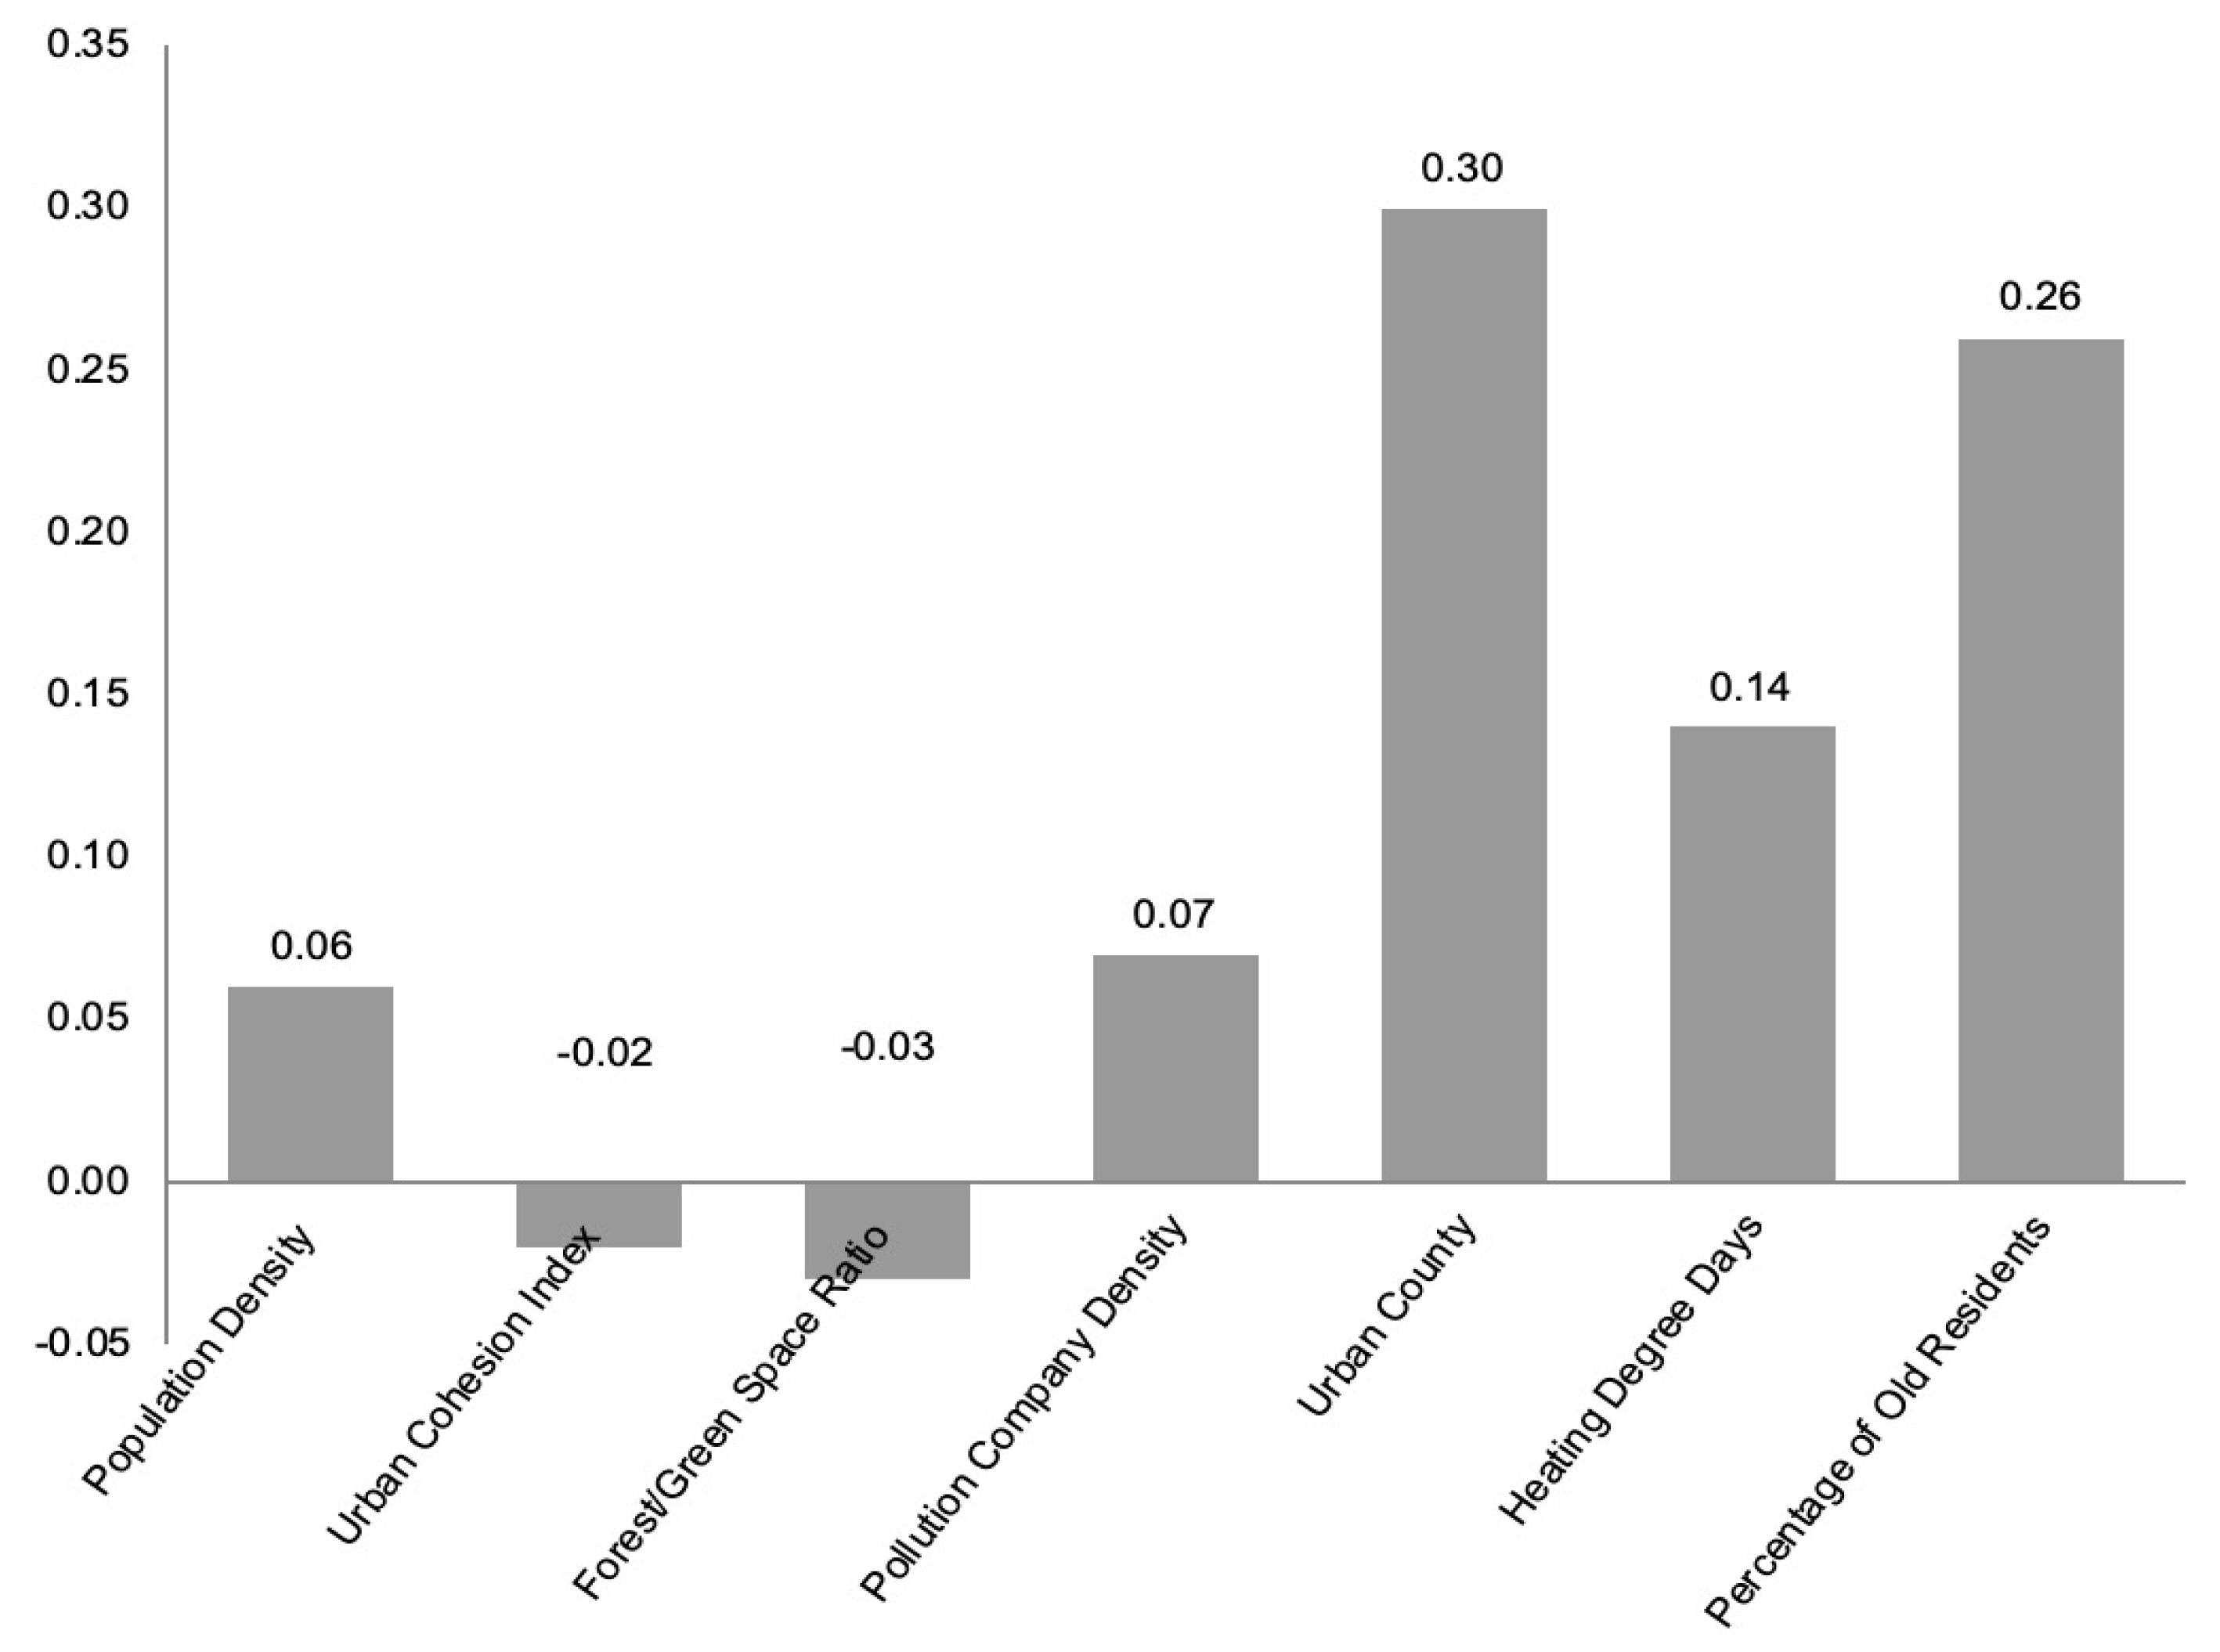
| CardioR | ||||||||||
| β | 2.199 | 9.845 | 0.001 | 0.160 | 0.129 | |||||
| St. β | 0.259 | 0.303 | 0.115 | 0.103 | 0.136 | |||||
| z | 3.97 | 4.58 | 1.72 | 0.97 | 2.00 | |||||
© 2020 by the authors. Licensee MDPI, Basel, Switzerland. This article is an open access article distributed under the terms and conditions of the Creative Commons Attribution (CC BY) license (http://creativecommons.org/licenses/by/4.0/).
Share and Cite
Li, C.; Song, Y.; Tian, L.; Ouyang, W. Urban Form, Air Quality, and Cardiorespiratory Mortality: A Path Analysis. Int. J. Environ. Res. Public Health 2020, 17, 1202. https://doi.org/10.3390/ijerph17041202
Li C, Song Y, Tian L, Ouyang W. Urban Form, Air Quality, and Cardiorespiratory Mortality: A Path Analysis. International Journal of Environmental Research and Public Health. 2020; 17(4):1202. https://doi.org/10.3390/ijerph17041202
Chicago/Turabian StyleLi, Chaosu, Yan Song, Li Tian, and Wei Ouyang. 2020. "Urban Form, Air Quality, and Cardiorespiratory Mortality: A Path Analysis" International Journal of Environmental Research and Public Health 17, no. 4: 1202. https://doi.org/10.3390/ijerph17041202
APA StyleLi, C., Song, Y., Tian, L., & Ouyang, W. (2020). Urban Form, Air Quality, and Cardiorespiratory Mortality: A Path Analysis. International Journal of Environmental Research and Public Health, 17(4), 1202. https://doi.org/10.3390/ijerph17041202