Cryogenic Aerosol Generation: Airborne Mist Particles Surrounding Liquid Nitrogen


Abstract
1. Introduction
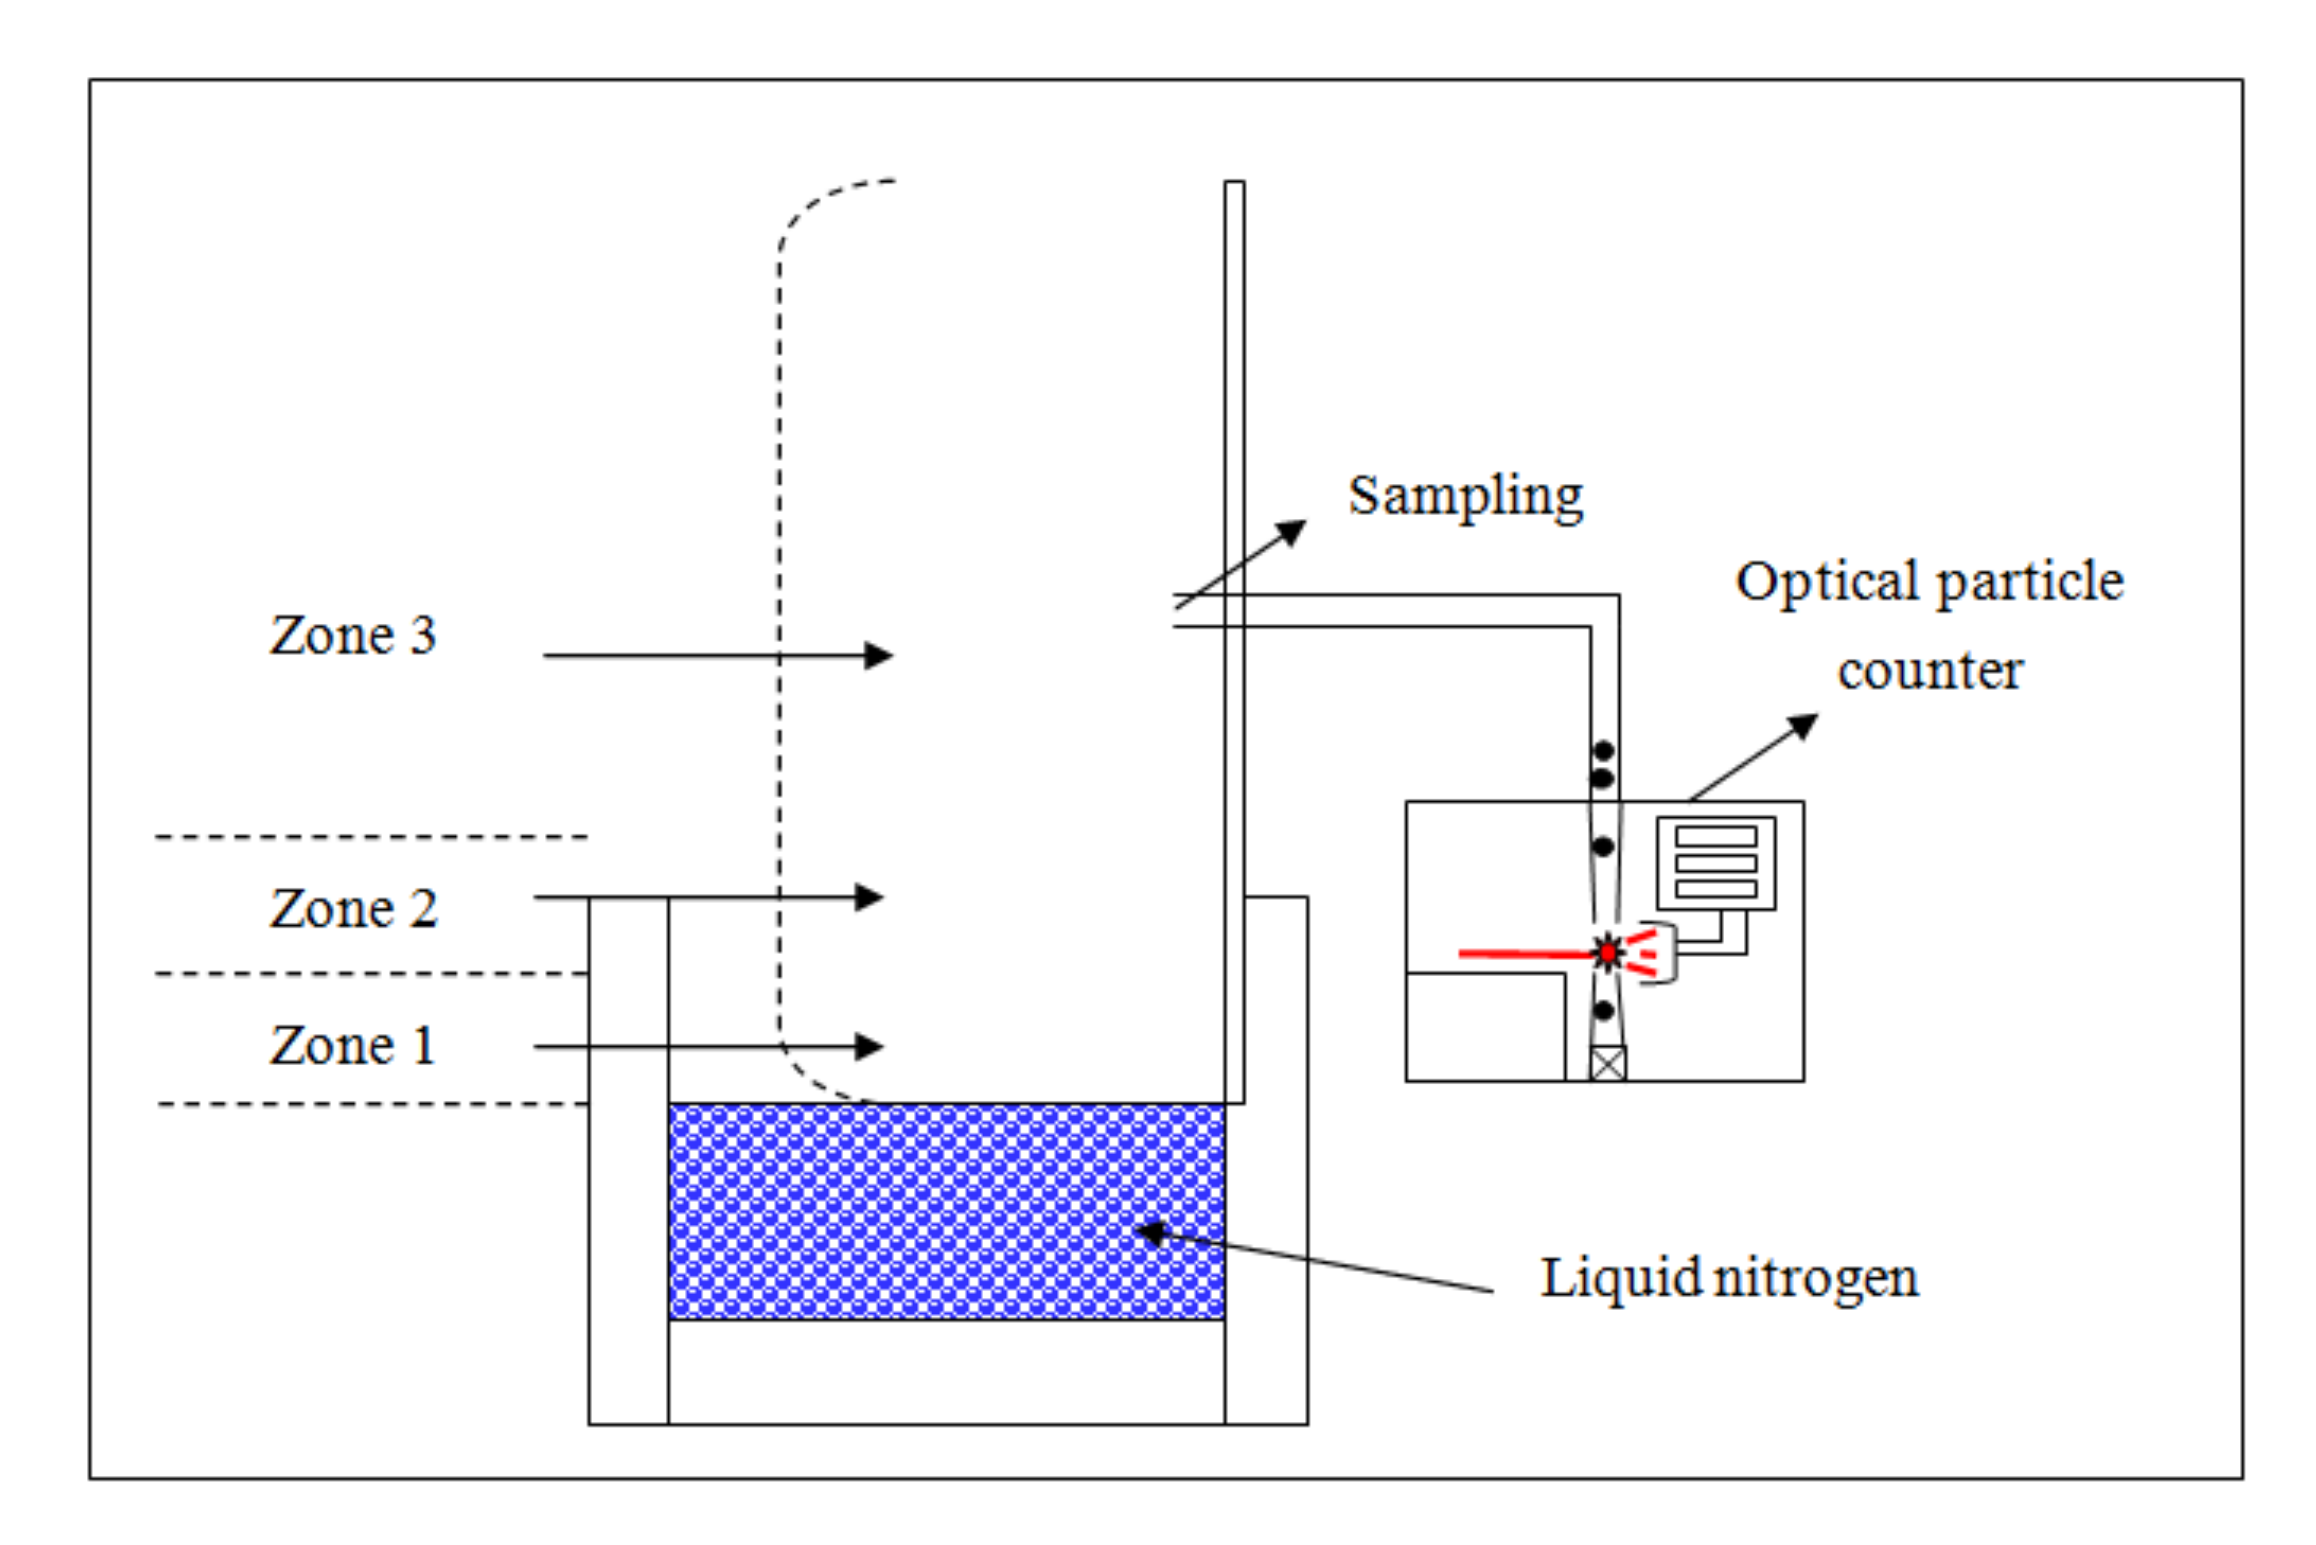
2. Methods
3. Results and Discussion
4. Conclusions
Funding
Conflicts of Interest
References
- Eisner, A.D.; Martonen, T.B. Properties of satellite and primary aerosols from a modified may spinning-top aerosol generator. J. Aerosol Sci. 1988, 19, 307–315. [Google Scholar] [CrossRef]
- Fu, H.; Patel, A.C.; Holtzman, M.J.; Chen, D.R. A New Electrospray Aerosol Generator with High Particle Transmission Efficiency. Aerosol Sci. Technol. 2011, 45, 1176–1183. [Google Scholar] [CrossRef] [PubMed][Green Version]
- Kang, Y.C.; Park, S.B. A high-volume spray aerosol generator producing small droplets for low pressure applications. J. Aerosol Sci. 1995, 26, 1131–1138. [Google Scholar] [CrossRef]
- Ulevicius, V.; Willeke, K.; Grinshpun, S.A.; Donnelly, J.; Lin, X.; Mainelis, G. Aerosolization of Particles from a Bubbling Liquid: Characteristics and Generator Development. Aerosol Sci. Technol. 2007, 26, 175–190. [Google Scholar] [CrossRef][Green Version]
- Ahmad, S.; Laiho, P.; Zhang, Q.; Jiang, H.; Hussain, A.; Liao, Y.; Ding, E.X.; Wei, N.; Kauppinen, E.I. Gas phase synthesis of metallic and bimetallic catalyst nanoparticles by rod-to-tube type spark discharge generator. J. Aerosol Sci. 2018, 123, 208–218. [Google Scholar] [CrossRef]
- Longest, P.W.; Spence, B.M.; Holbrook, L.T.; Mossi, K.M.; Son, Y.J.; Hindle, M. Production of inhalable submicrometer aerosols from concentional mesh nebulizers for improved respiratory drug delivery. J. Aerosol Sci. 2012, 51, 66–80. [Google Scholar] [CrossRef] [PubMed]
- Reist, P.C.; Taylor, L. Development and operation of an improved turntable dust feeder. Powder Technol. 2000, 107, 36–42. [Google Scholar] [CrossRef]
- Kim, K.; Kim, W.; Yun, S.H.; Lee, J.H.; Kim, S.S.; Lee, B.U. Use of an electrospray for the generation of bacterial bioaerosols. J. Aerosol Sci. 2008, 39, 365–372. [Google Scholar] [CrossRef]
- Jeong, S.B.; Chong, E.S.; Heo, K.J.; Lee, G.W.; Kim, H.J.; Lee, B.U. Electrospray patterning of yeast cells for applications in alcoholic fermentation. Sci. Rep. 2019, 9, 18662. [Google Scholar] [CrossRef] [PubMed]
- Friedlander, S.K. Smoke, Dust, and Haze: Fundamentals of Aerosol Dynamics; Oxford University Press: New York, NY, USA, 2000. [Google Scholar]
- Barron, R.F. Cryogenic Systems, 2nd ed.; Oxford University Press: New York, NY, USA, 1985. [Google Scholar]
- Lee, B.U.; Kim, S.S. Thermophoresis in the cryogenic temperature range. J. Aerosol Sci. 2001, 32, 107–119. [Google Scholar] [CrossRef]
- Hu, H.; Pan, J. The risk assessement of the fog disaster. J. Risk Anal. Crisis Response 2011, 1, 59–64. [Google Scholar] [CrossRef][Green Version]
- Cai, D.P.; He, Y.M. Daily lifestyles in the fog and haze weather. J. Thorac. Dis. 2016, 8, E75–E77. [Google Scholar] [PubMed]


| Temperature (°C) | Relative Humidity (%) | |
|---|---|---|
| Without LN2 | 25.2 ± 0 | 64.9 ± 0.1 |
| 10 cm from LN2 | 25.8 ± 0.1 | 62.1 ± 0.2 |
| 20 cm from LN2 | 25.8 ± 0.1 | 63.8 ± 0.1 |
| 30 cm from LN2 | 25.5 ± 0 | 64.6 ± 0.1 |
| 40 cm from LN2 | 25.3 ± 0 | 67.5 ± 0.1 |
| 50 cm from LN2 | 25.3 ± 0 | 66.8 ± 0.1 |
| 100 cm from LN2 | 25.2 ± 0 | 64.9 ± 0.1 |
| 0.3 μm | 0.5 μm | 1 μm | 3 μm | 5 μm | 10 μm | |
|---|---|---|---|---|---|---|
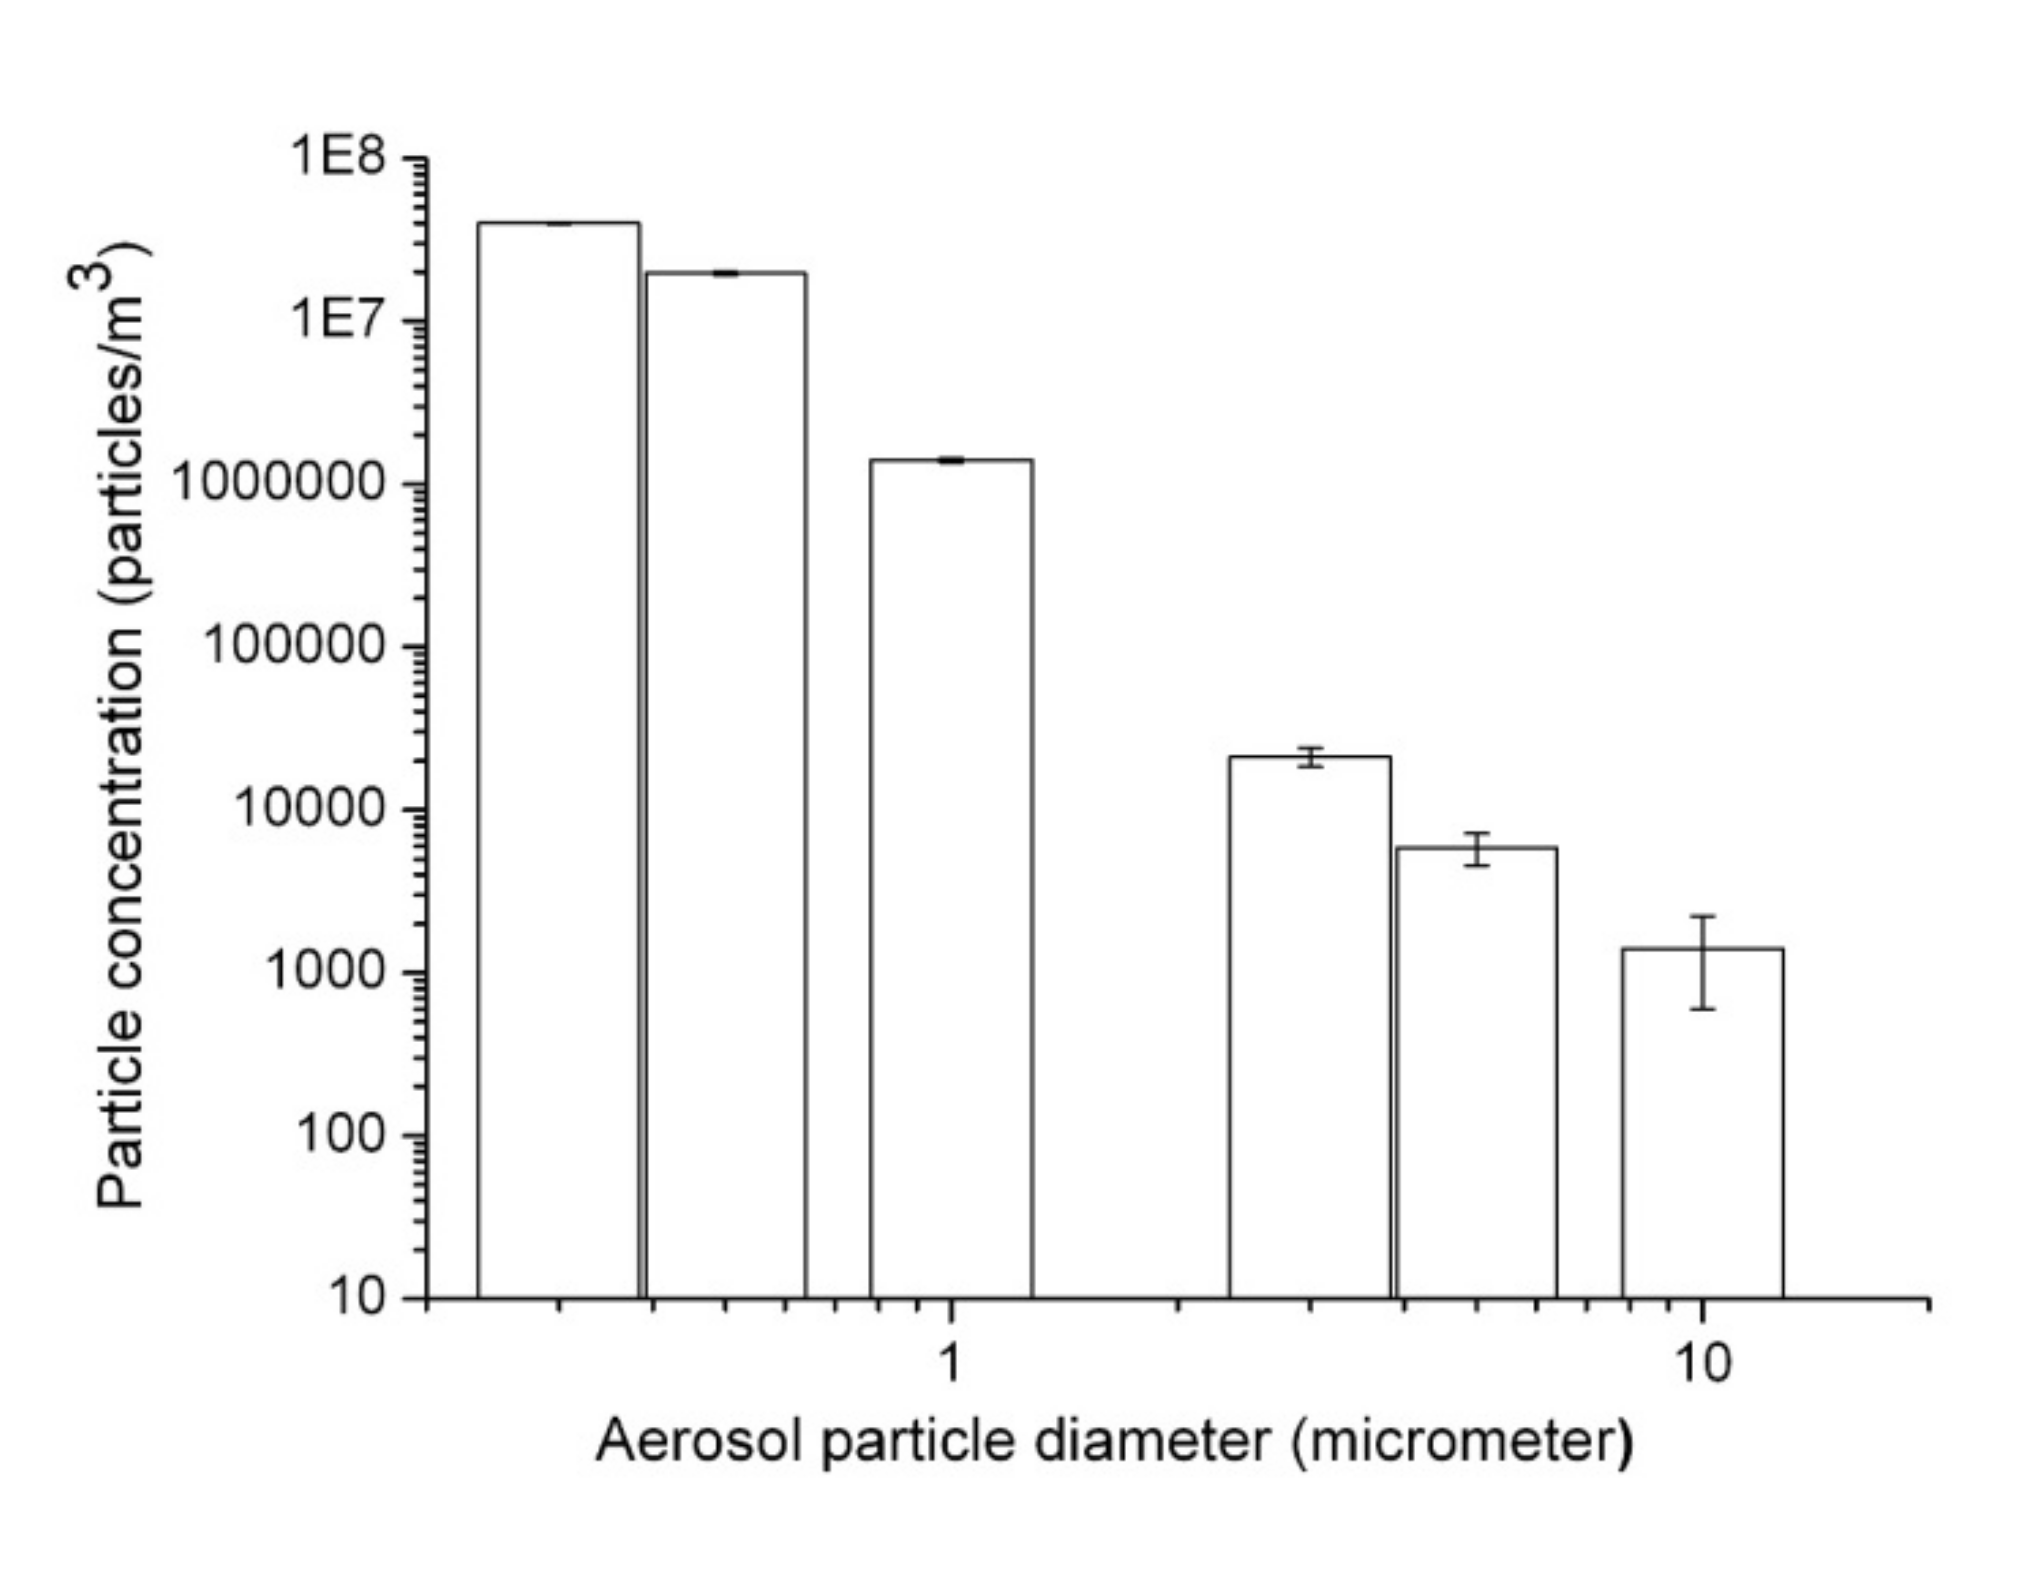
| Without LN2 | 4.0 × 10⁷ ± 3.0 × 10⁵ | 2.0 × 10⁷ ± 4.0 × 10⁵ | 1.4 × 10⁶ ± 4.4 × 10⁴ | 2.1 × 10⁴ ± 2.9 × 10³ | 5.9 × 10³ ± 1.3 × 10³ | 1.4 × 10³ ± 8.1 × 10² |
| 10 cm from LN2 | 8.4 × 10⁶ ± 3.6 × 10⁶ | 8.4 × 10⁶ ± 1.1 × 10⁶ | 3.2 × 10⁷ ± 7.0 × 10⁶ | 3.7 × 10⁶ ± 5.3 × 10⁵ | 1.6 × 10⁵ ± 3.1 × 10⁴ | 3.3 × 10² ± 8.1 × 101 |
| 20 cm from LN2 | 3.9 × 10⁷ ± 6.4 × 10⁵ | 1.8 × 10⁷ ± 8.2 × 10⁵ | 2.0 × 10⁶ ± 1.3 × 10⁵ | 3.2 × 10⁵ ± 1.4 × 10⁵ | 7.3 × 10⁴ ± 6.7 × 10⁴ | 8.2 × 10² ± 5.1 × 10² |
| 30 cm from LN2 | 4.1 × 10⁷ ± 2.6 × 10⁵ | 1.8 × 10⁷ ± 6.5 × 10⁵ | 1.2 × 10⁶ ± 2.6 × 10⁴ | 1.9 × 10⁴ ± 2.8 × 10³ | 3.9 × 10³ ± 1.1 × 10³ | 6.8 × 10² ± 2.9 × 10² |
| 40 cm from LN2 | 4.2 × 10⁷ ± 3.3 × 10⁵ | 1.6 × 10⁷ ± 7.4 × 10⁵ | 1.1 × 10⁶ ± 6.9 × 10⁴ | 1.5 × 10⁴ ± 2.6 × 10³ | 3.5 × 10³ ± 1.8 × 10³ | 1.4 × 10³ ± 1.0 × 10³ |
| 50 cm from LN2 | 4.2 × 10⁷ ± 6.0 × 10⁴ | 1.4 × 10⁷ ± 3.3 × 10⁵ | 9.4 × 10⁵ ± 2.1 × 10⁴ | 1.1 × 10⁴ ± 9.3 × 10² | 3.4 × 10³ ± 1.5 × 10³ | 1.1 × 10³ ± 3.2 × 10² |
| 100 cm from LN2 | 4.2 × 10⁷ ± 1.1 × 10⁵ | 1.2 × 10⁷ ± 2.3 × 10⁵ | 8.1 × 10⁵ ± 2.9 × 10⁴ | 9.6 × 10³ ± 6.0 × 10² | 2.9 × 10³ ± 9.4 × 10² | 5.9 × 10² ± 1.1 × 10² |
© 2020 by the author. Licensee MDPI, Basel, Switzerland. This article is an open access article distributed under the terms and conditions of the Creative Commons Attribution (CC BY) license (http://creativecommons.org/licenses/by/4.0/).
Share and Cite
Lee, B.U. Cryogenic Aerosol Generation: Airborne Mist Particles Surrounding Liquid Nitrogen. Int. J. Environ. Res. Public Health 2020, 17, 1071. https://doi.org/10.3390/ijerph17031071
Lee BU. Cryogenic Aerosol Generation: Airborne Mist Particles Surrounding Liquid Nitrogen. International Journal of Environmental Research and Public Health. 2020; 17(3):1071. https://doi.org/10.3390/ijerph17031071
Chicago/Turabian StyleLee, Byung Uk. 2020. "Cryogenic Aerosol Generation: Airborne Mist Particles Surrounding Liquid Nitrogen" International Journal of Environmental Research and Public Health 17, no. 3: 1071. https://doi.org/10.3390/ijerph17031071
APA StyleLee, B. U. (2020). Cryogenic Aerosol Generation: Airborne Mist Particles Surrounding Liquid Nitrogen. International Journal of Environmental Research and Public Health, 17(3), 1071. https://doi.org/10.3390/ijerph17031071