Distribution of Nitrate Content in Groundwater and Evaluation of Potential Health Risks: A Case Study of Rural Areas in Northern China


Abstract
1. Introduction
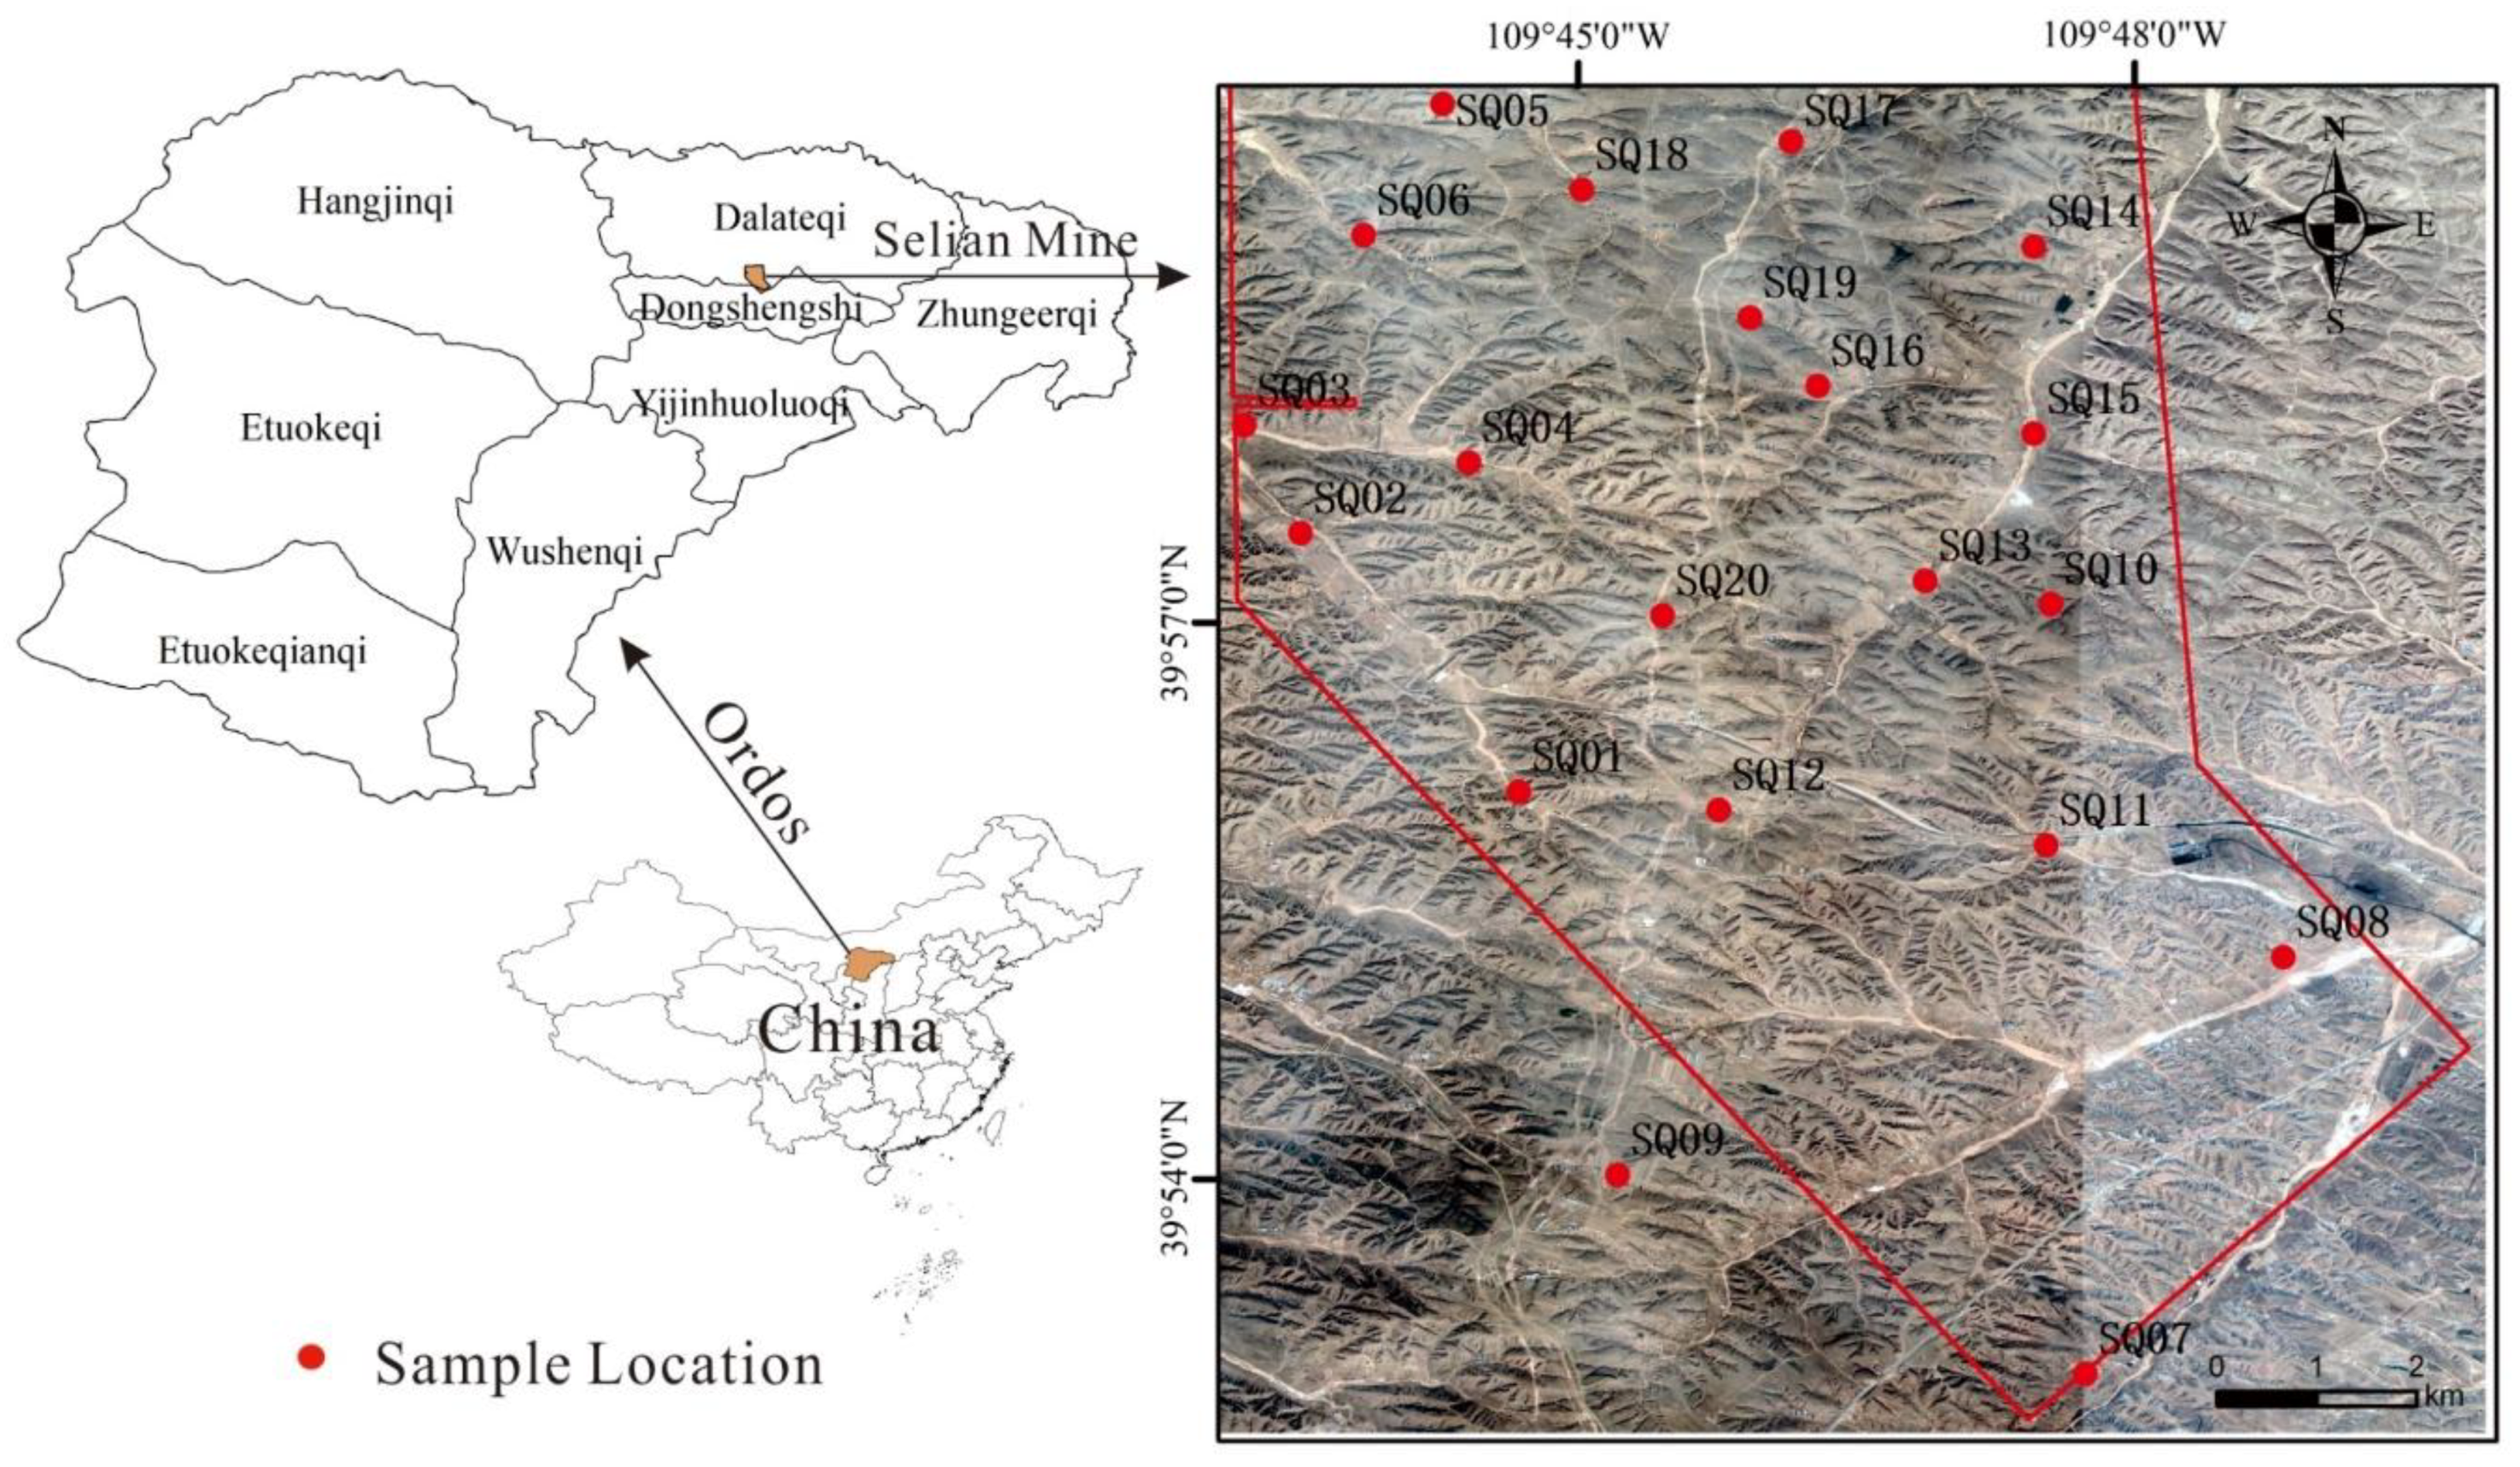
2. Study Area
2.1. Location and Climate
2.2. Hydrogeology
3. Materials and Methods
3.1. Sample Collection and Analysis
3.2. Improved Groundwater Quality Index
3.3. Human health risk assessment
4. Results and Discussion
4.1. Groundwater Geochemistry
4.2. Nitrate Content in Groundwater
4.3. Groundwater Quality Assessment
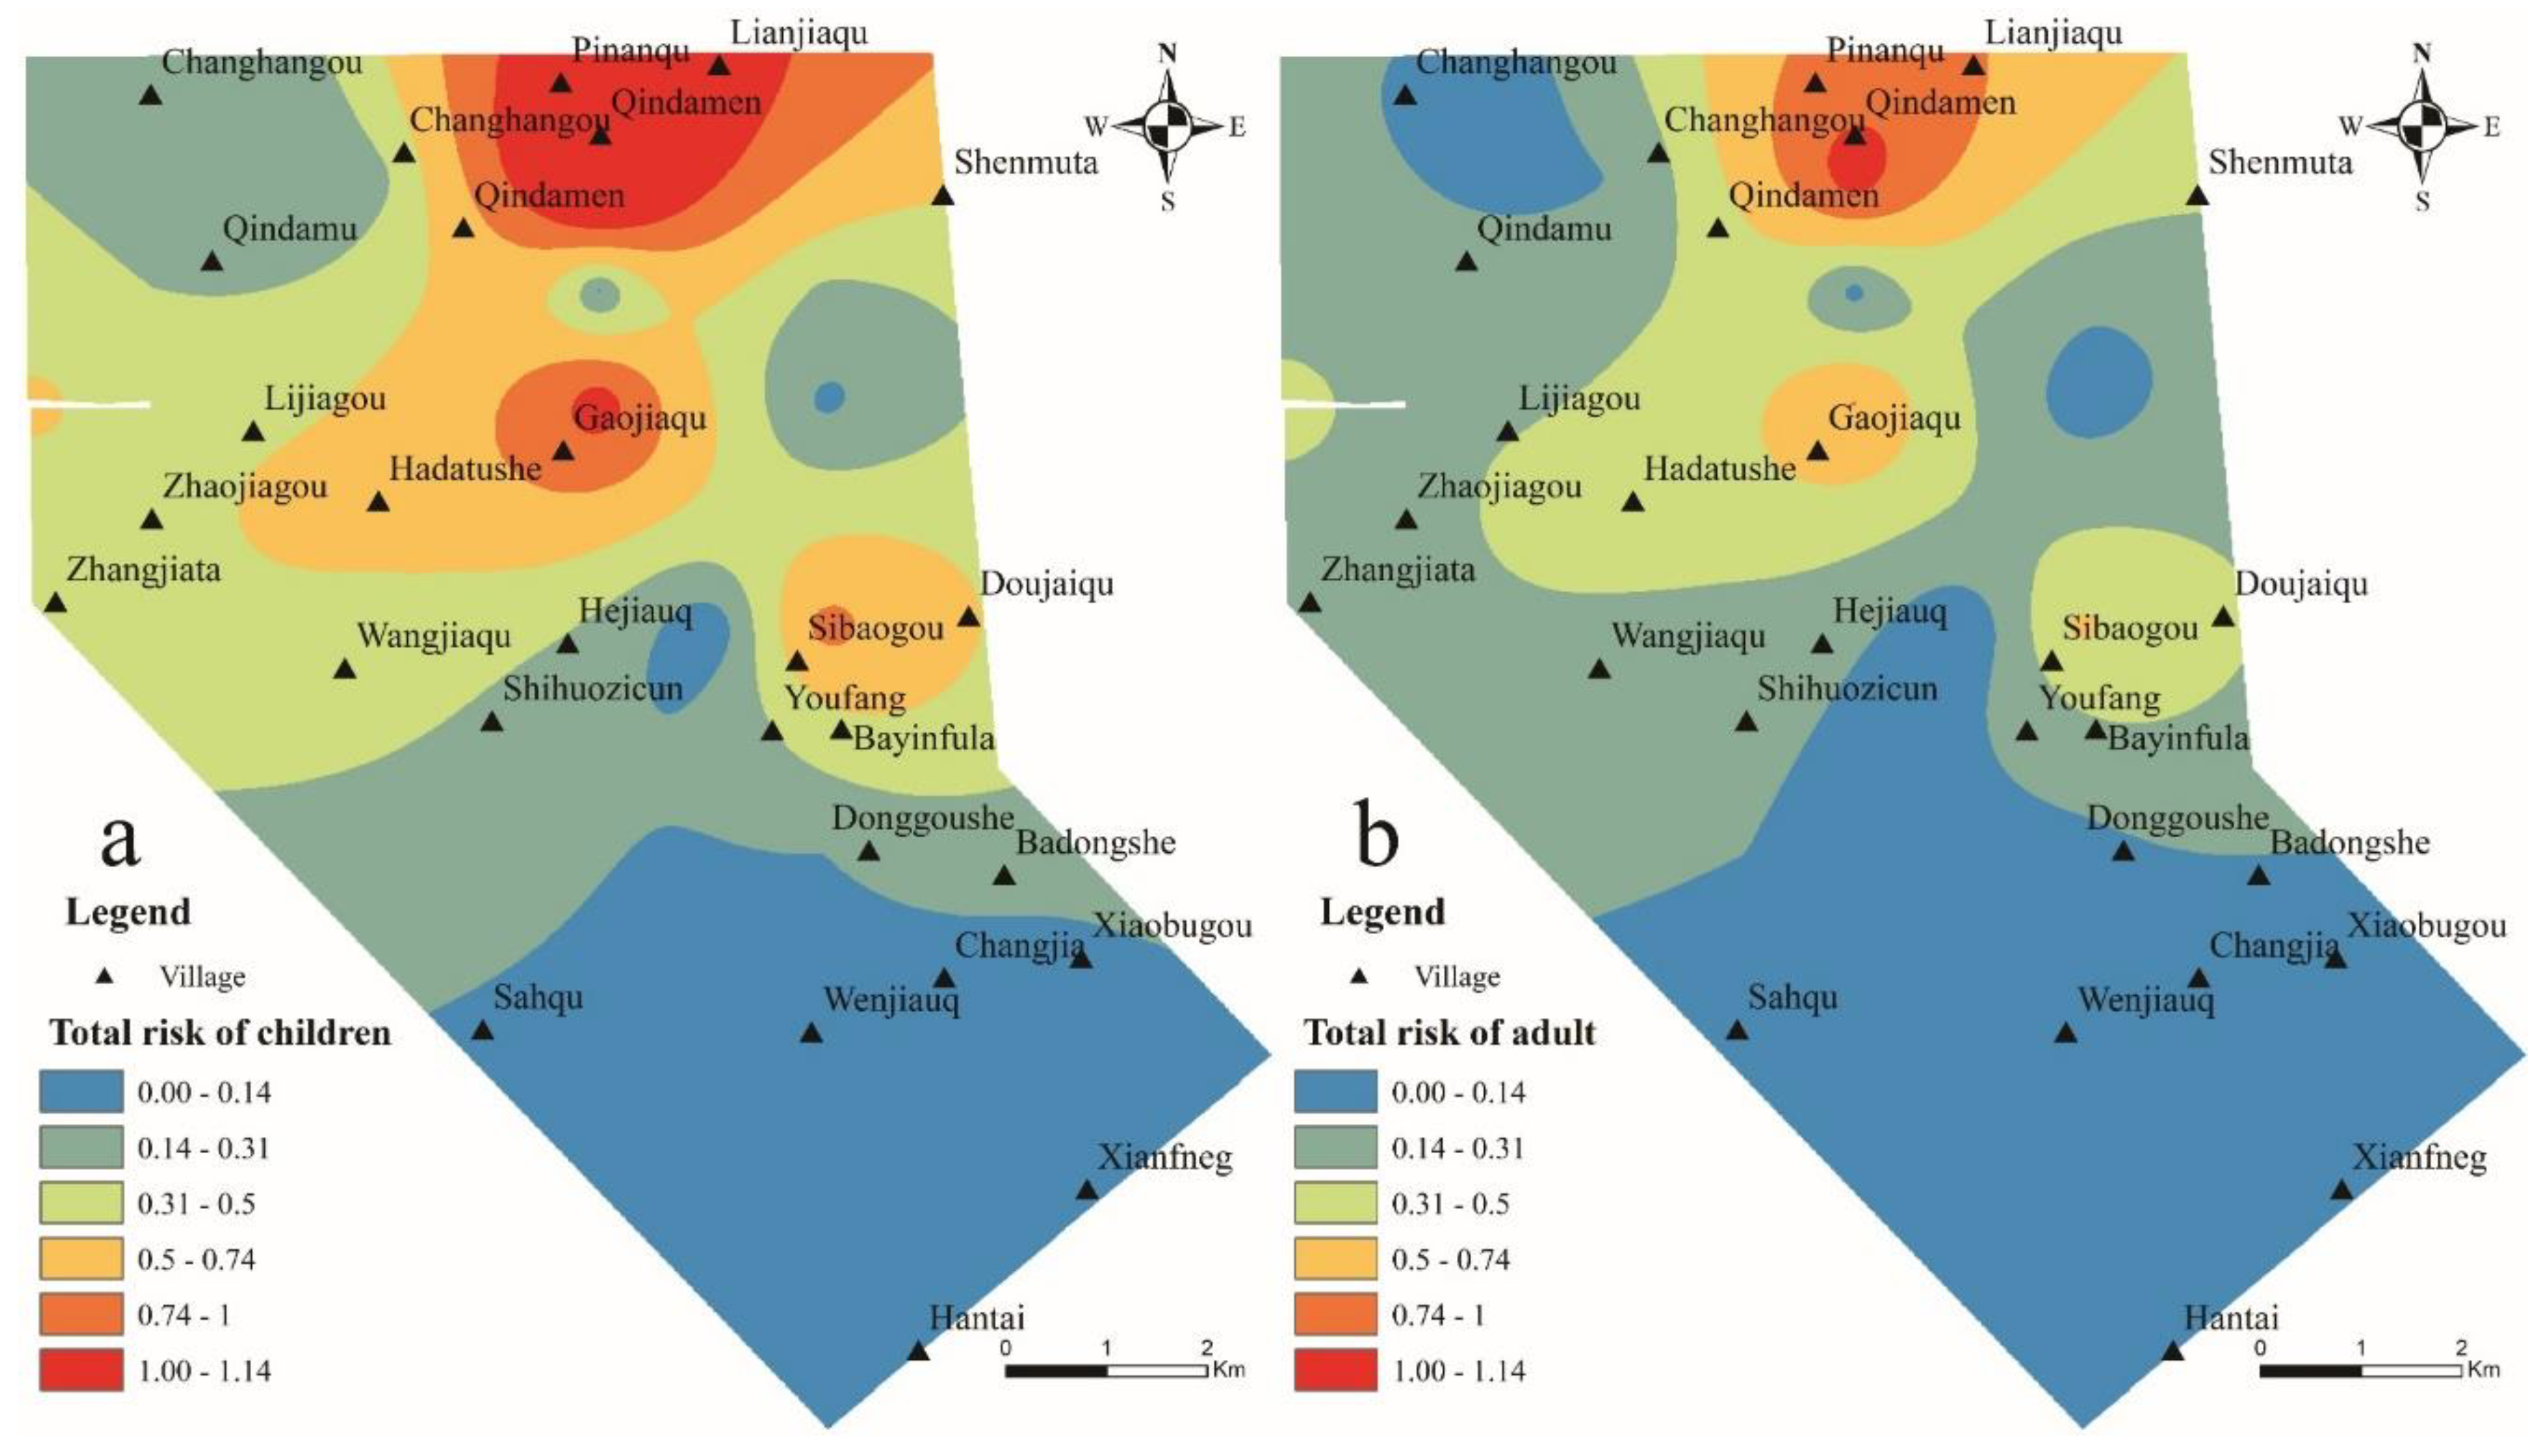
4.4. Health Risk Assessment
5. Conclusions
- (1)
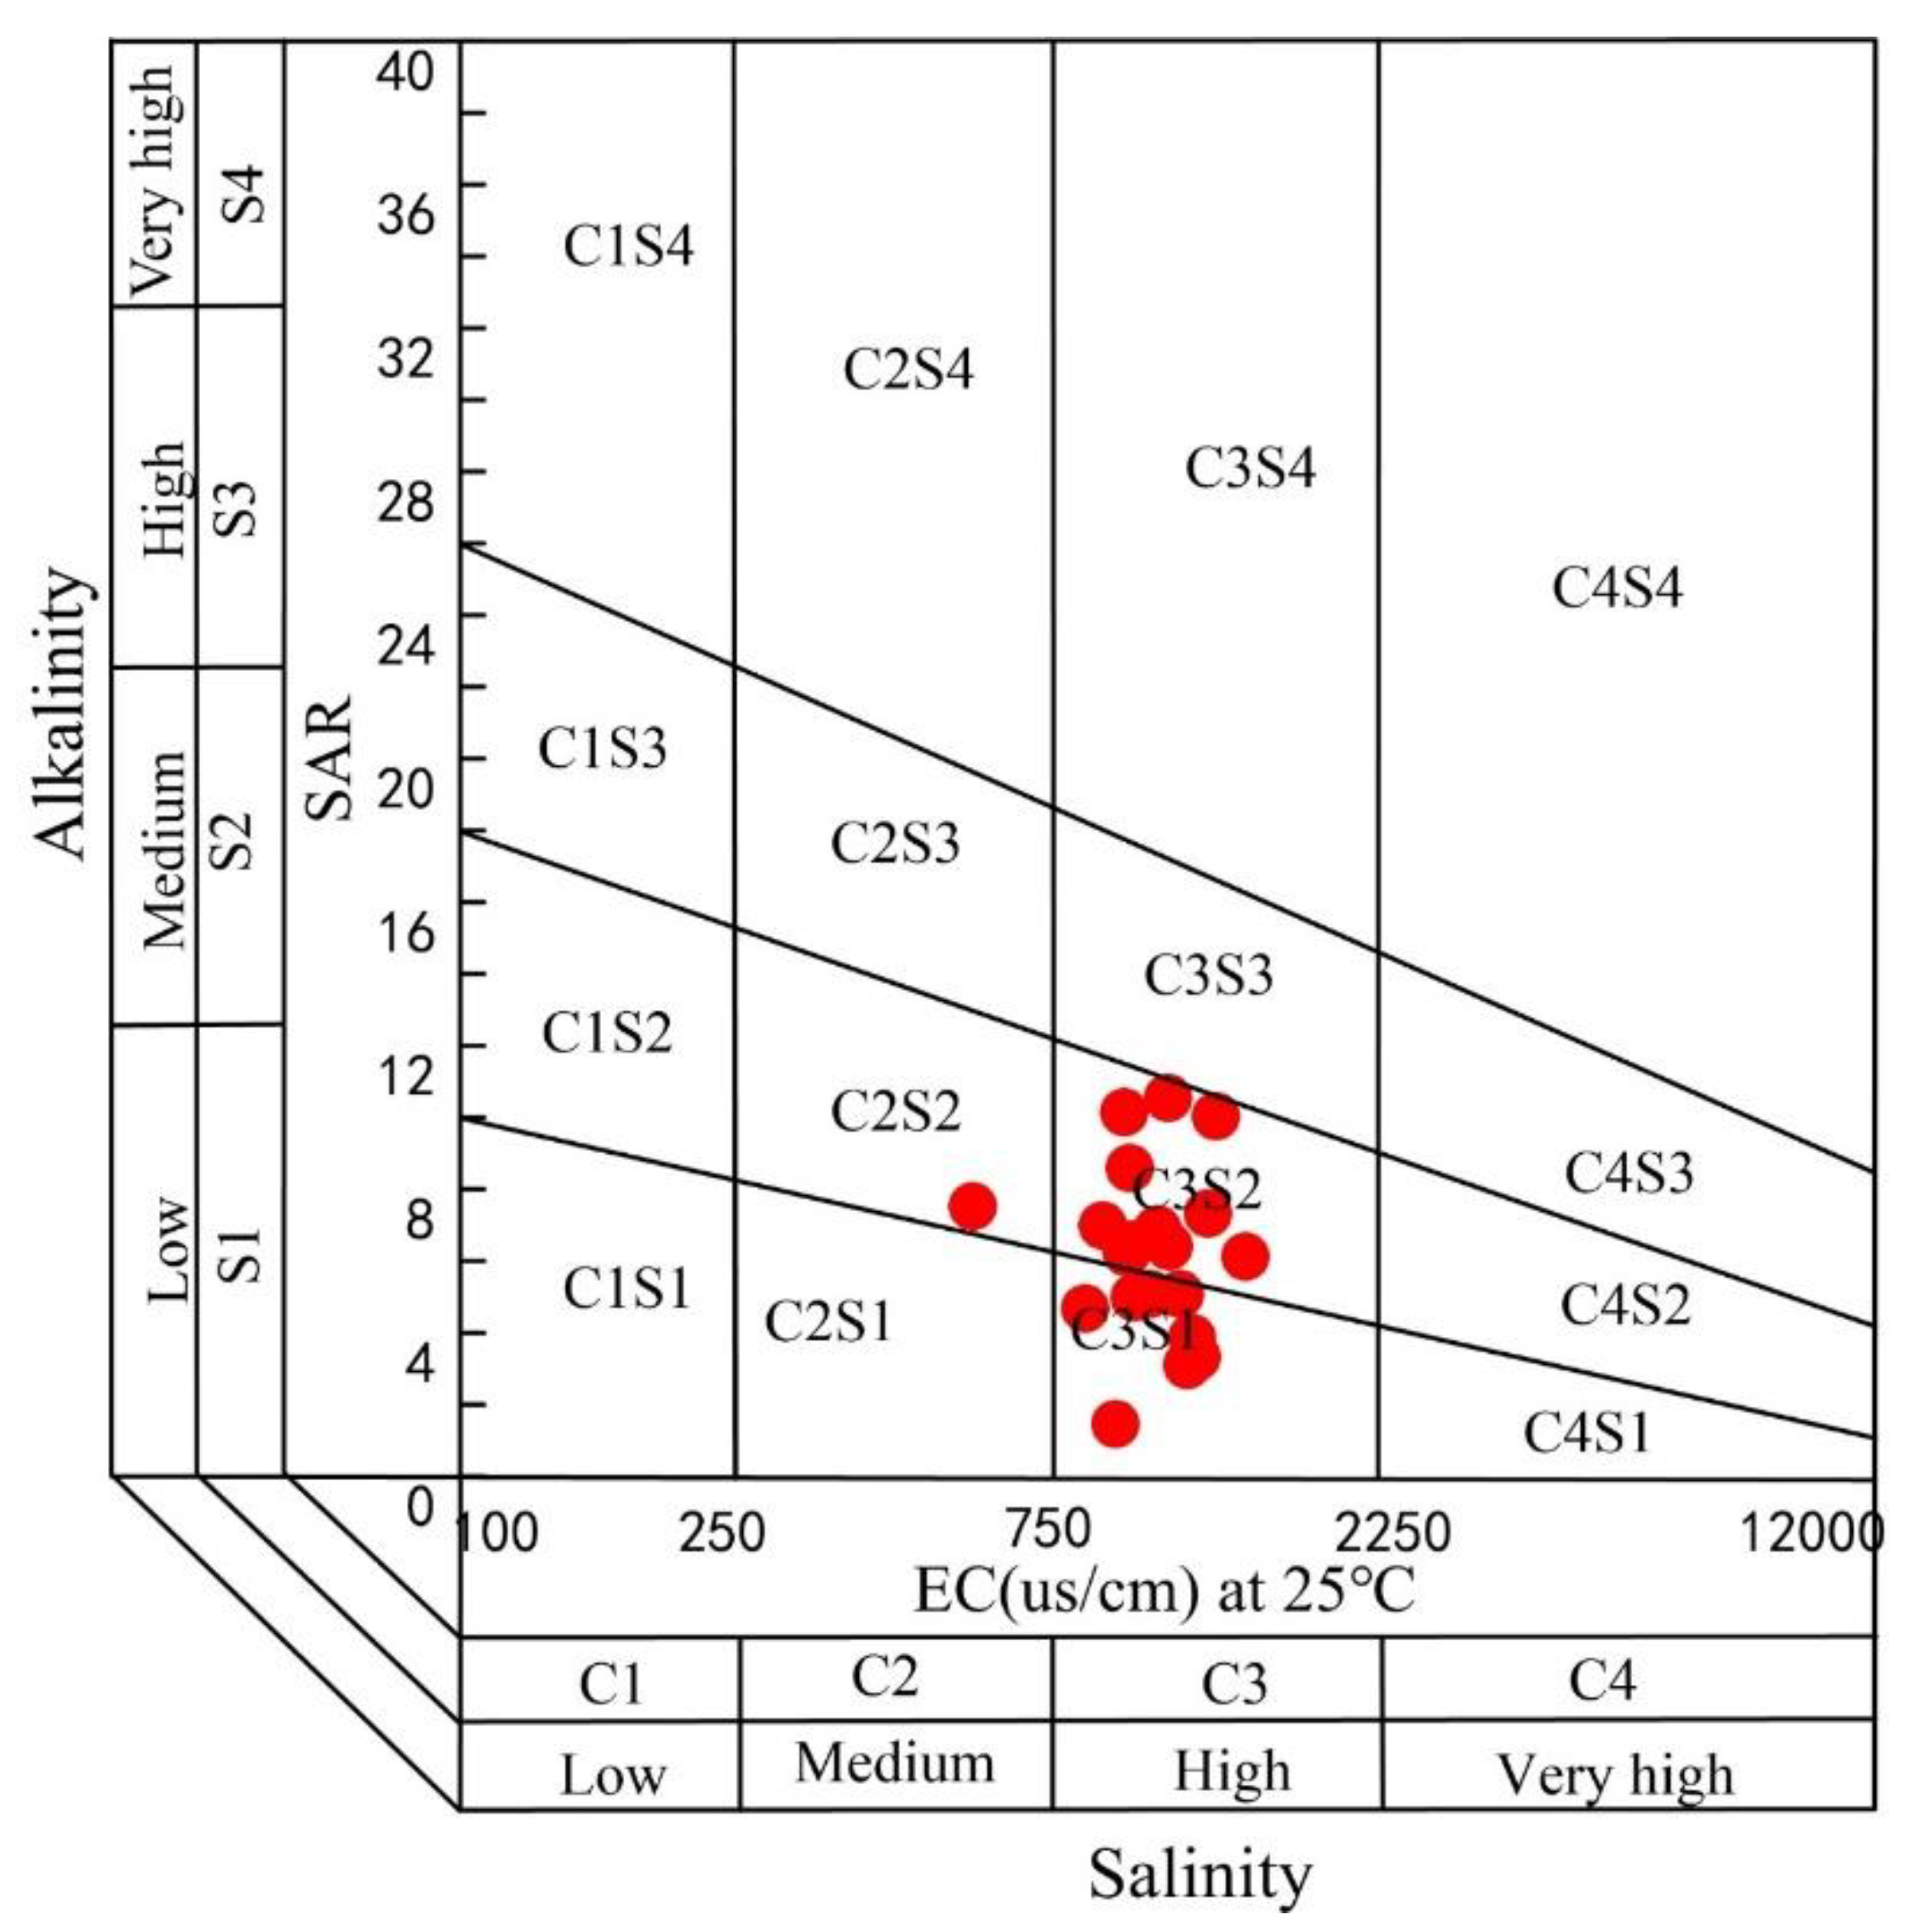
- The groundwater in the Selian mining area is neutral to weakly alkaline, with high salinity and medium hardness, which is more suitable for human consumption. Groundwater quality in this area is affected by weathering of rock formations, coal seams, and evaporation. Most of the samples are HCO3-Ca type water, the order of cations is Ca2+ > Na+ > Mg2+ > K+, and the order of anions is HCO3− > SO42− > Cl− > NO3−.
- (2)
- The concentration of nitrate in groundwater in the study area is between 0.80–109.57 mg/L, with an average of 23.57 mg/L. The largest exceeds China’s national drinking water limit standard by 5.48 times and exceeds the WHO standard by 2.19 times. It shows that nitrate pollution in groundwater needs to be controlled urgently. The input of a large amount of nitrogen fertilizer in human agricultural activities is the main source of pollution, and at the same time, mining activities accelerate the severity and spread of pollution. The groundwater quality assessment based on EWQI shows that the groundwater in this area is not suitable for direct drinking by humans. Nitrate pollution is the main physical and chemical parameter leading to poor water quality. In addition, groundwater is not suitable for direct irrigation. Unless pretreatment is possible, other water sources should be studied for irrigation.
- (3)
- The results of the human health risk assessment model show that about 10% of the groundwater’s non-carcinogenic chronic toxicity effects in this area are at an unacceptable level for children. The nitrate health risks of children through drinking water intake and skin contact are significantly higher than adults, and the highest is 1.54 times. The risk index is between 0.75 and 1 and the proportion is about 15%. It is in a period of dangerous fluctuations and is susceptible to changes in the external environment and endangers human health. Therefore, these health risk points require special attention.
Author Contributions
Funding
Acknowledgments
Conflicts of Interest
References
- Khanoranga; Khalid, S. An assessment of groundwater quality for irrigation and drinking purposes around brick kilns in three districts of Balochistan province, Pakistan, through water quality index and multivariate statistical approaches. J. Geochem. Explor. 2019, 197, 14–26. [Google Scholar] [CrossRef]
- Wang, Y.; Zheng, C.; Ma, R. Review: Safe and sustainable groundwater supply in China. Hydrogeol. J. 2018, 26, 1301–1324. [Google Scholar] [CrossRef]
- Zhang, Q.; Xu, P.; Qian, H. Assessment of groundwater quality and human health risk (HHR) evaluation of nitrate in the central-western Guanzhong basin, China. Int. J. Environ. Res. Public Health 2019, 16, 4246. [Google Scholar] [CrossRef] [PubMed]
- Qiao, W.; Li, W.; Li, T.; Chang, J.; Wang, Q. Effects of Coal Mining on Shallow Water Resources in Semiarid Regions: A Case Study in the Shennan Mining Area, Shaanxi, China. Mine Water Environ. 2017, 36, 104–113. [Google Scholar] [CrossRef]
- Moore, A.P.; Bringolf, R.B. Comparative Toxicity of Nitrate to Common and Imperiled Freshwater Mussel Glochidia and Larval Fishes. Arch. Environ. Contam. Toxicol. 2020, 78, 536–544. [Google Scholar] [CrossRef]
- Odiyo, J.O.; Makungo, R. Chemical and microbial quality of groundwater in Siloam village, implications to human health and sources of contamination. Int. J. Environ. Res. Public Health 2018, 15, 317. [Google Scholar] [CrossRef]
- Feng, W.; Qian, H.; Xu, P.; Hou, K. Hydrochemical characteristic of groundwater and its impact on crop yields in the Baojixia irrigation area, China. Water 2020, 12, 10–13. [Google Scholar] [CrossRef]
- Jebastina, N.; Prince Arulraj, G. Spatial Prediction of Nitrate Concentration Using GIS and ANFIS Modelling in Groundwater. Bull. Environ. Contam. Toxicol. 2018, 101, 403–409. [Google Scholar] [CrossRef]
- Ward, M.H.; Jones, R.R.; Brender, J.D.; de Kok, T.M.; Weyer, P.J.; Nolan, B.T.; Villanueva, C.M.; van Breda, S.G. Drinking water nitrate and human health: An updated review. Int. J. Environ. Res. Public Health 2018, 15, 1557. [Google Scholar] [CrossRef]
- Li, P.; Tian, R.; Xue, C.; Wu, J. Progress, opportunities, and key fields for groundwater quality research under the impacts of human activities in China with a special focus on western China. Environ. Sci. Pollut. Res. 2017, 24, 13224–13234. [Google Scholar] [CrossRef]
- Xue, D.; Yang, M.; Wang, Z.L. Assessing the effects of acidification on N dynamics in Jiyun River system of Tianjin, China. Bull. Environ. Contam. Toxicol. 2015, 95, 822–829. [Google Scholar] [CrossRef] [PubMed]
- Leslie, D.L.; Lyons, W.B. Variations in dissolved nitrate, chloride, and sulfate in precipitation, reservoir, and tap waters, Columbus, Ohio. Int. J. Environ. Res. Public Health 2018, 15, 1752. [Google Scholar] [CrossRef] [PubMed]
- Su, H.; Kang, W.; Xu, Y.; Wang, J. Assessing Groundwater Quality and Health Risks of Nitrogen Pollution in the Shenfu Mining Area of Shaanxi Province, Northwest China. Expo. Health 2018, 10, 77–97. [Google Scholar] [CrossRef]
- Han, K.; Zuo, R.; Ni, P.; Xue, Z.; Xu, D.; Wang, J.; Zhang, D. Application of a genetic algorithm to groundwater pollution source identification. J. Hydrol. 2020, 589, 125343. [Google Scholar] [CrossRef]
- Yu, Q.; Wang, F.; Yan, W.; Zhang, F.; Lv, S.; Li, Y. Carbon and nitrogen burial and response to climate change and anthropogenic disturbance in Chaohu Lake, China. Int. J. Environ. Res. Public Health 2018, 15, 2734. [Google Scholar] [CrossRef]
- Luo, Y.; Wang, H. Modeling the impacts of agricultural management strategies on crop yields and sediment yields using APEX in Guizhou Plateau, southwest China. Agric. Water Manag. 2019, 216, 325–338. [Google Scholar] [CrossRef]
- Wang, X.; Zhang, F.; Ding, J.; Kung, H.T.; Latif, A.; Johnson, V.C. Estimation of soil salt content (SSC) in the Ebinur Lake Wetland National Nature Reserve (ELWNNR), Northwest China, based on a Bootstrap-BP neural network model and optimal spectral indices. Sci. Total Environ. 2018, 615, 918–930. [Google Scholar] [CrossRef]
- Gao, L. Study on sedimentary system of yan ’an Formation in northern Ordos Basin. Prog. Rep. China Nucl. Nucl. Sci. Technol. 2017, 5, 559–566. [Google Scholar]
- Li, P.; Wu, J.; Tian, R.; He, S.; He, X.; Xue, C.; Zhang, K. Geochemistry, Hydraulic Connectivity and Quality Appraisal of Multilayered Groundwater in the Hongdunzi Coal Mine, Northwest China. Mine Water Environ. 2018, 37, 222–237. [Google Scholar] [CrossRef]
- Han, Z.; Zhang, F.; Yao, H. Change of regional water chemistry driven by group coal mining in Changzhi basin, Shanxi, China. E3S Web Conf. 2019, 98, 09001. [Google Scholar] [CrossRef]
- Keqiang, H.; Lu, G.; Yuanyuan, G.; Huilai, L.; Yongping, L. Research on the effects of coal mining on the karst hydrogeological environment in Jiaozuo mining area, China. Environ. Earth Sci. 2019, 78, 434. [Google Scholar] [CrossRef]
- Chen, F.; Lao, Q.; Zhang, S.; Bian, P.; Jin, G.; Zhu, Q.; Chen, C. Nitrate sources and biogeochemical processes identified using nitrogen and oxygen isotopes on the eastern coast of Hainan Island. Cont. Shelf Res. 2020, 207, 104209. [Google Scholar] [CrossRef]
- Saha, P.; Paul, B. Suitability Assessment of Surface Water Quality with Reference to Drinking, Irrigation and Fish Culture: A Human Health Risk Perspective. Bull. Environ. Contam. Toxicol. 2018, 101, 262–271. [Google Scholar] [CrossRef] [PubMed]
- Wu, J.; Li, P.; Qian, H. Hydrochemical characterization of drinking groundwater with special reference to fluoride in an arid area of China and the control of aquifer leakage on its concentrations. Environ. Earth Sci. 2015, 73, 8575–8588. [Google Scholar] [CrossRef]
- Balangoda, A.; Deepananda, K.H.M.A.; Wegiriya, H.C.E. Effects of Environmental Contamination and Acute Toxicity of N-Nitrate on Early Life Stages of Endemic Arboreal Frog, Polypedates cruciger (Blyth, 1852). Bull. Environ. Contam. Toxicol. 2018, 100, 195–201. [Google Scholar] [CrossRef]
- Jia, H.; Qian, H.; Qu, W.; Zheng, L.; Feng, W.; Ren, W. Fluoride occurrence and human health risk in drinkingwaterwells from southern edge of Chinese loess plateau. Int. J. Environ. Res. Public Health 2019, 16, 1683. [Google Scholar] [CrossRef]
- Corey, L.M.; Bell, G.P.; Pleus, R.C. Exposure of the US Population to Nitrate, Thiocyanate, Perchlorate, and Iodine Based on NHANES 2005–2014. Bull. Environ. Contam. Toxicol. 2017, 99, 83–88. [Google Scholar] [CrossRef]
- Sakizadeh, M.; Zhang, C. Health risk assessment of nitrate using a probabilistic approach in groundwater resources of western part of Iran. Environ. Earth Sci. 2020, 79, 43. [Google Scholar] [CrossRef]
- Ministry of Environmental Protection of the People’s Republic of China. GB5749-2006.pdf 2006; MEP: Beijing, China.
- US Environmental Protection Agency. Edition of the Drinking Water Standards and Health Advisories; US EPA: Washington, DC, USA, 2012; pp. 2–6.
- Du, Q. Study on environmental protection and ecological restoration of Zhalainor coal mine in Inner Mongolia. Environ. Ecol. 2020, 2, 92–95. [Google Scholar]
- Hou, Q.; Dong, S.; Zhang, Y. Hydrochemical characteristics and genesis of shallow groundwater in Siziwang Banner, Inner Mongolia. J. Arid Land Resour. Environ. 2020, 4, 1–5. [Google Scholar]
- Liu, B. Seasonal changes of groundwater chemistry in Tumochuan Plain of Inner Mongolia. Geotech. Investig. Surv. 2020, 5, 34–40. [Google Scholar]
- Ministry of Environmental Protection of the People’s Republic of China. Water Quality Sampling—Technical Regulation of the Preservation and Handling of Samples; HJ 493-2009; China Environmental Science Press: Beijing, China, 2009.
- He, X.; Liu, Z.; Qian, J.; Zhao, W.; Liu, Y. Distribution of Nitrate in Different Aquifers in the Urban District of Zhanjiang, China. Bull. Environ. Contam. Toxicol. 2016, 97, 279–285. [Google Scholar] [CrossRef] [PubMed]
- Qasemi, M.; Afsharnia, M.; Farhang, M.; Bakhshizadeh, A.; Allahdadi, M.; Zarei, A. Health risk assessment of nitrate exposure in groundwater of rural areas of Gonabad and Bajestan, Iran. Environ. Earth Sci. 2018, 77, 551. [Google Scholar] [CrossRef]
- Khadim, F.K.; Su, H.; Xu, L.; Tian, J. Soil salinity mapping in Everglades National Park using remote sensing techniques and vegetation salt tolerance. Phys. Chem. Earth 2019, 110, 31–50. [Google Scholar] [CrossRef]
- Li, P.; Qian, H.; Zhou, W. Finding harmony between the environment and humanity: An introduction to the thematic issue of the Silk Road. Environ. Earth Sci. 2017, 76, 105. [Google Scholar] [CrossRef]
- Li, P.; Wu, J.; Qian, H. Hydrochemical appraisal of groundwater quality for drinking and irrigation purposes and the major influencing factors: A case study in and around Hua County, China. Arab. J. Geosci. 2016, 9, 15. [Google Scholar] [CrossRef]
- Lasagna, M.; De Luca, D.A.; Franchino, E. Nitrate contamination of groundwater in the western Po Plain (Italy): The effects of groundwater and surface water interactions. Environ. Earth Sci. 2016, 75, 240. [Google Scholar] [CrossRef]
- Groh, T.A.; Isenhart, T.M.; Schultz, R.C. Long-term nitrate removal in three riparian buffers: 21 years of data from the Bear Creek watershed in central Iowa, USA. Sci. Total Environ. 2020, 740, 140114. [Google Scholar] [CrossRef]
- Yu, G.; Wang, S.; Wang, J.; Liu, L.; Li, Y.; Zhang, Y. The analysis of groundwater nitrate pollution and health risk assessment in Rural Areas of Yantai. BMC Public Health 2020, 20, 437. [Google Scholar] [CrossRef]
- Yang, L.; Zheng, C.; Andrews, C.B.; Wang, C. Applying a Regional Transport Modeling Framework to Manage Nitrate Contamination of Groundwater. Groundwater 2020. [Google Scholar] [CrossRef]
- Su, X.; Wang, H.; Zhang, Y. Health Risk Assessment of Nitrate Contamination in Groundwater: A Case Study of an Agricultural Area in Northeast China. Water Resour. Manag. 2013, 27, 3025–3034. [Google Scholar] [CrossRef]
- Cai, R.; Deng, Y.; Ni, F.; Pu, R.; Tang, Y. Temporal and spatial variation characteristics of health risk assessment of nitrogen in rural drinking water sources-a case of mingshan district. Sichuan Daxue Xuebao Gongcheng Kexue Ban J. Sichuan Univ. Eng. Sci. Ed. 2015, 47, 40–46. [Google Scholar]
- Zhang, Y.; Ma, R.; Li, Z. Human health risk assessment of groundwater in Hetao Plain (Inner Mongolia Autonomous Region, China). Environ. Monit. Assess. 2014, 186, 4669–4684. [Google Scholar] [CrossRef]
- WHO. Guidelines for Drinking Water Quality, Incorporating 1st Addendum, 4th ed.; World Health Organization: Geneva, Switzerland, 2017. [Google Scholar]
- Ezekwe, I.C.; Odu, N.N.; Chima, G.N.; Opigo, A. Assessing regional groundwater quality and its health implications in the Lokpaukwu, Lekwesi and Ishiagu mining areas of southeastern Nigeria using factor analysis. Environ. Earth Sci. 2012, 67, 971–986. [Google Scholar] [CrossRef]
- Sheng, D. Risk assessment of groundwater nitrate pollution and human health in zhangye basin. J. Desert Res. 2019, 5, 37–42. [Google Scholar]


| Parameters | Children | Adult |
|---|---|---|
| (Nitrate reference dose)/(mg·kg−1·d−1) | 1.6 | 1.6 |
| (Nitrate concentration)/(mg·L−1) | Measured | Measured |
| (Drinking rate)/(L·d−1) | 1.8 | 2.0 |
| (Average weight of residents)/kg | 35 | 60 |
| (Bath time)/(h·d−1) | 0.167 | 0.167 |
| (Gastrointestinal absorption coefficient) | 0.5 | 0.5 |
| (Life expectancy)/a | 365 × ED | 365 × ED |
| (Bathing frequency) | 1 | 1 |
| (Skin permeability coefficient)/(cm·h−1) | 0.001 | 0.001 |
| (Volume conversion factor)/(L·cm−2) | 1/1000 | 1/1000 |
| (Exposure duration)/a | 30 | 30 |
| (Exposure frequency)/(d·a−1) | 365 | 365 |
| (Skin contact surface area)/cm2 | 1.0 × 10⁴ | 1.65 × 10⁴ |
| Index | Max | Min | Mean | Standard Deviation | Coefficient of Variation |
|---|---|---|---|---|---|
| pH | 8.48 | 7.80 | 8.11 | 0.19 | 0.02 |
| TH | 570.48 | 205.17 | 421.85 | 92.17 | 0.22 |
| TDS | 922.91 | 365.60 | 678.11 | 120.02 | 0.18 |
| Ca2+ | 118.24 | 42.08 | 78.06 | 21.28 | 0.27 |
| Mg2+ | 71.70 | 24.31 | 55.11 | 11.74 | 0.21 |
| K+ | 4.30 | 0.39 | 1.15 | 0.82 | 0.71 |
| Na+ | 163.01 | 32.65 | 77.71 | 32.42 | 0.42 |
| Cl− | 177.27 | 35.45 | 81.72 | 38.34 | 0.47 |
| HCO3− | 524.67 | 183.02 | 330.36 | 87.87 | 0.27 |
| SO42− | 288.00 | 57.60 | 186.00 | 49.86 | 0.27 |
| NO3− | 109.57 | 0.80 | 23.57 | 26.16 | 1.11 |
| Non-Carcinogenic | Water Intake Risk Index | Skin Contact Risk Index | Total Risk of Two Exposure Routes | |||
|---|---|---|---|---|---|---|
| Range | Average | Range | Average | Range | Average | |
| Children | 0.0129–1.7609 | 0.3789 | 0.0000–0.0033 | 0.0007 | 0.0129–1.7642 | 0.3796 |
| Adult | 0.0083–1.1413 | 0.2456 | 0.0000–0.0031 | 0.0007 | 0.0084–1.1445 | 0.2462 |
Publisher’s Note: MDPI stays neutral with regard to jurisdictional claims in published maps and institutional affiliations. |
© 2020 by the authors. Licensee MDPI, Basel, Switzerland. This article is an open access article distributed under the terms and conditions of the Creative Commons Attribution (CC BY) license (http://creativecommons.org/licenses/by/4.0/).
Share and Cite
Feng, W.; Wang, C.; Lei, X.; Wang, H.; Zhang, X. Distribution of Nitrate Content in Groundwater and Evaluation of Potential Health Risks: A Case Study of Rural Areas in Northern China. Int. J. Environ. Res. Public Health 2020, 17, 9390. https://doi.org/10.3390/ijerph17249390
Feng W, Wang C, Lei X, Wang H, Zhang X. Distribution of Nitrate Content in Groundwater and Evaluation of Potential Health Risks: A Case Study of Rural Areas in Northern China. International Journal of Environmental Research and Public Health. 2020; 17(24):9390. https://doi.org/10.3390/ijerph17249390
Chicago/Turabian StyleFeng, Wenwen, Chao Wang, Xiaohui Lei, Hao Wang, and Xueliang Zhang. 2020. "Distribution of Nitrate Content in Groundwater and Evaluation of Potential Health Risks: A Case Study of Rural Areas in Northern China" International Journal of Environmental Research and Public Health 17, no. 24: 9390. https://doi.org/10.3390/ijerph17249390
APA StyleFeng, W., Wang, C., Lei, X., Wang, H., & Zhang, X. (2020). Distribution of Nitrate Content in Groundwater and Evaluation of Potential Health Risks: A Case Study of Rural Areas in Northern China. International Journal of Environmental Research and Public Health, 17(24), 9390. https://doi.org/10.3390/ijerph17249390