Effectiveness of Psychological Capital Intervention and Its Influence on Work-Related Attitudes: Daily Online Self-Learning Method and Randomized Controlled Trial Design


Abstract
1. Introduction
1.1. Psychological Capital Development
1.1.1. Developing Efficacy
1.1.2. Developing Hope
1.1.3. Developing Resilience
1.1.4. Developing Optimism
1.2. Daily Online Self-Learning Method
1.3. Work-Related Attitudes
1.3.1. Job Satisfaction
1.3.2. Turnover Intention
1.3.3. Job Embeddedness
2. Materials and Methods
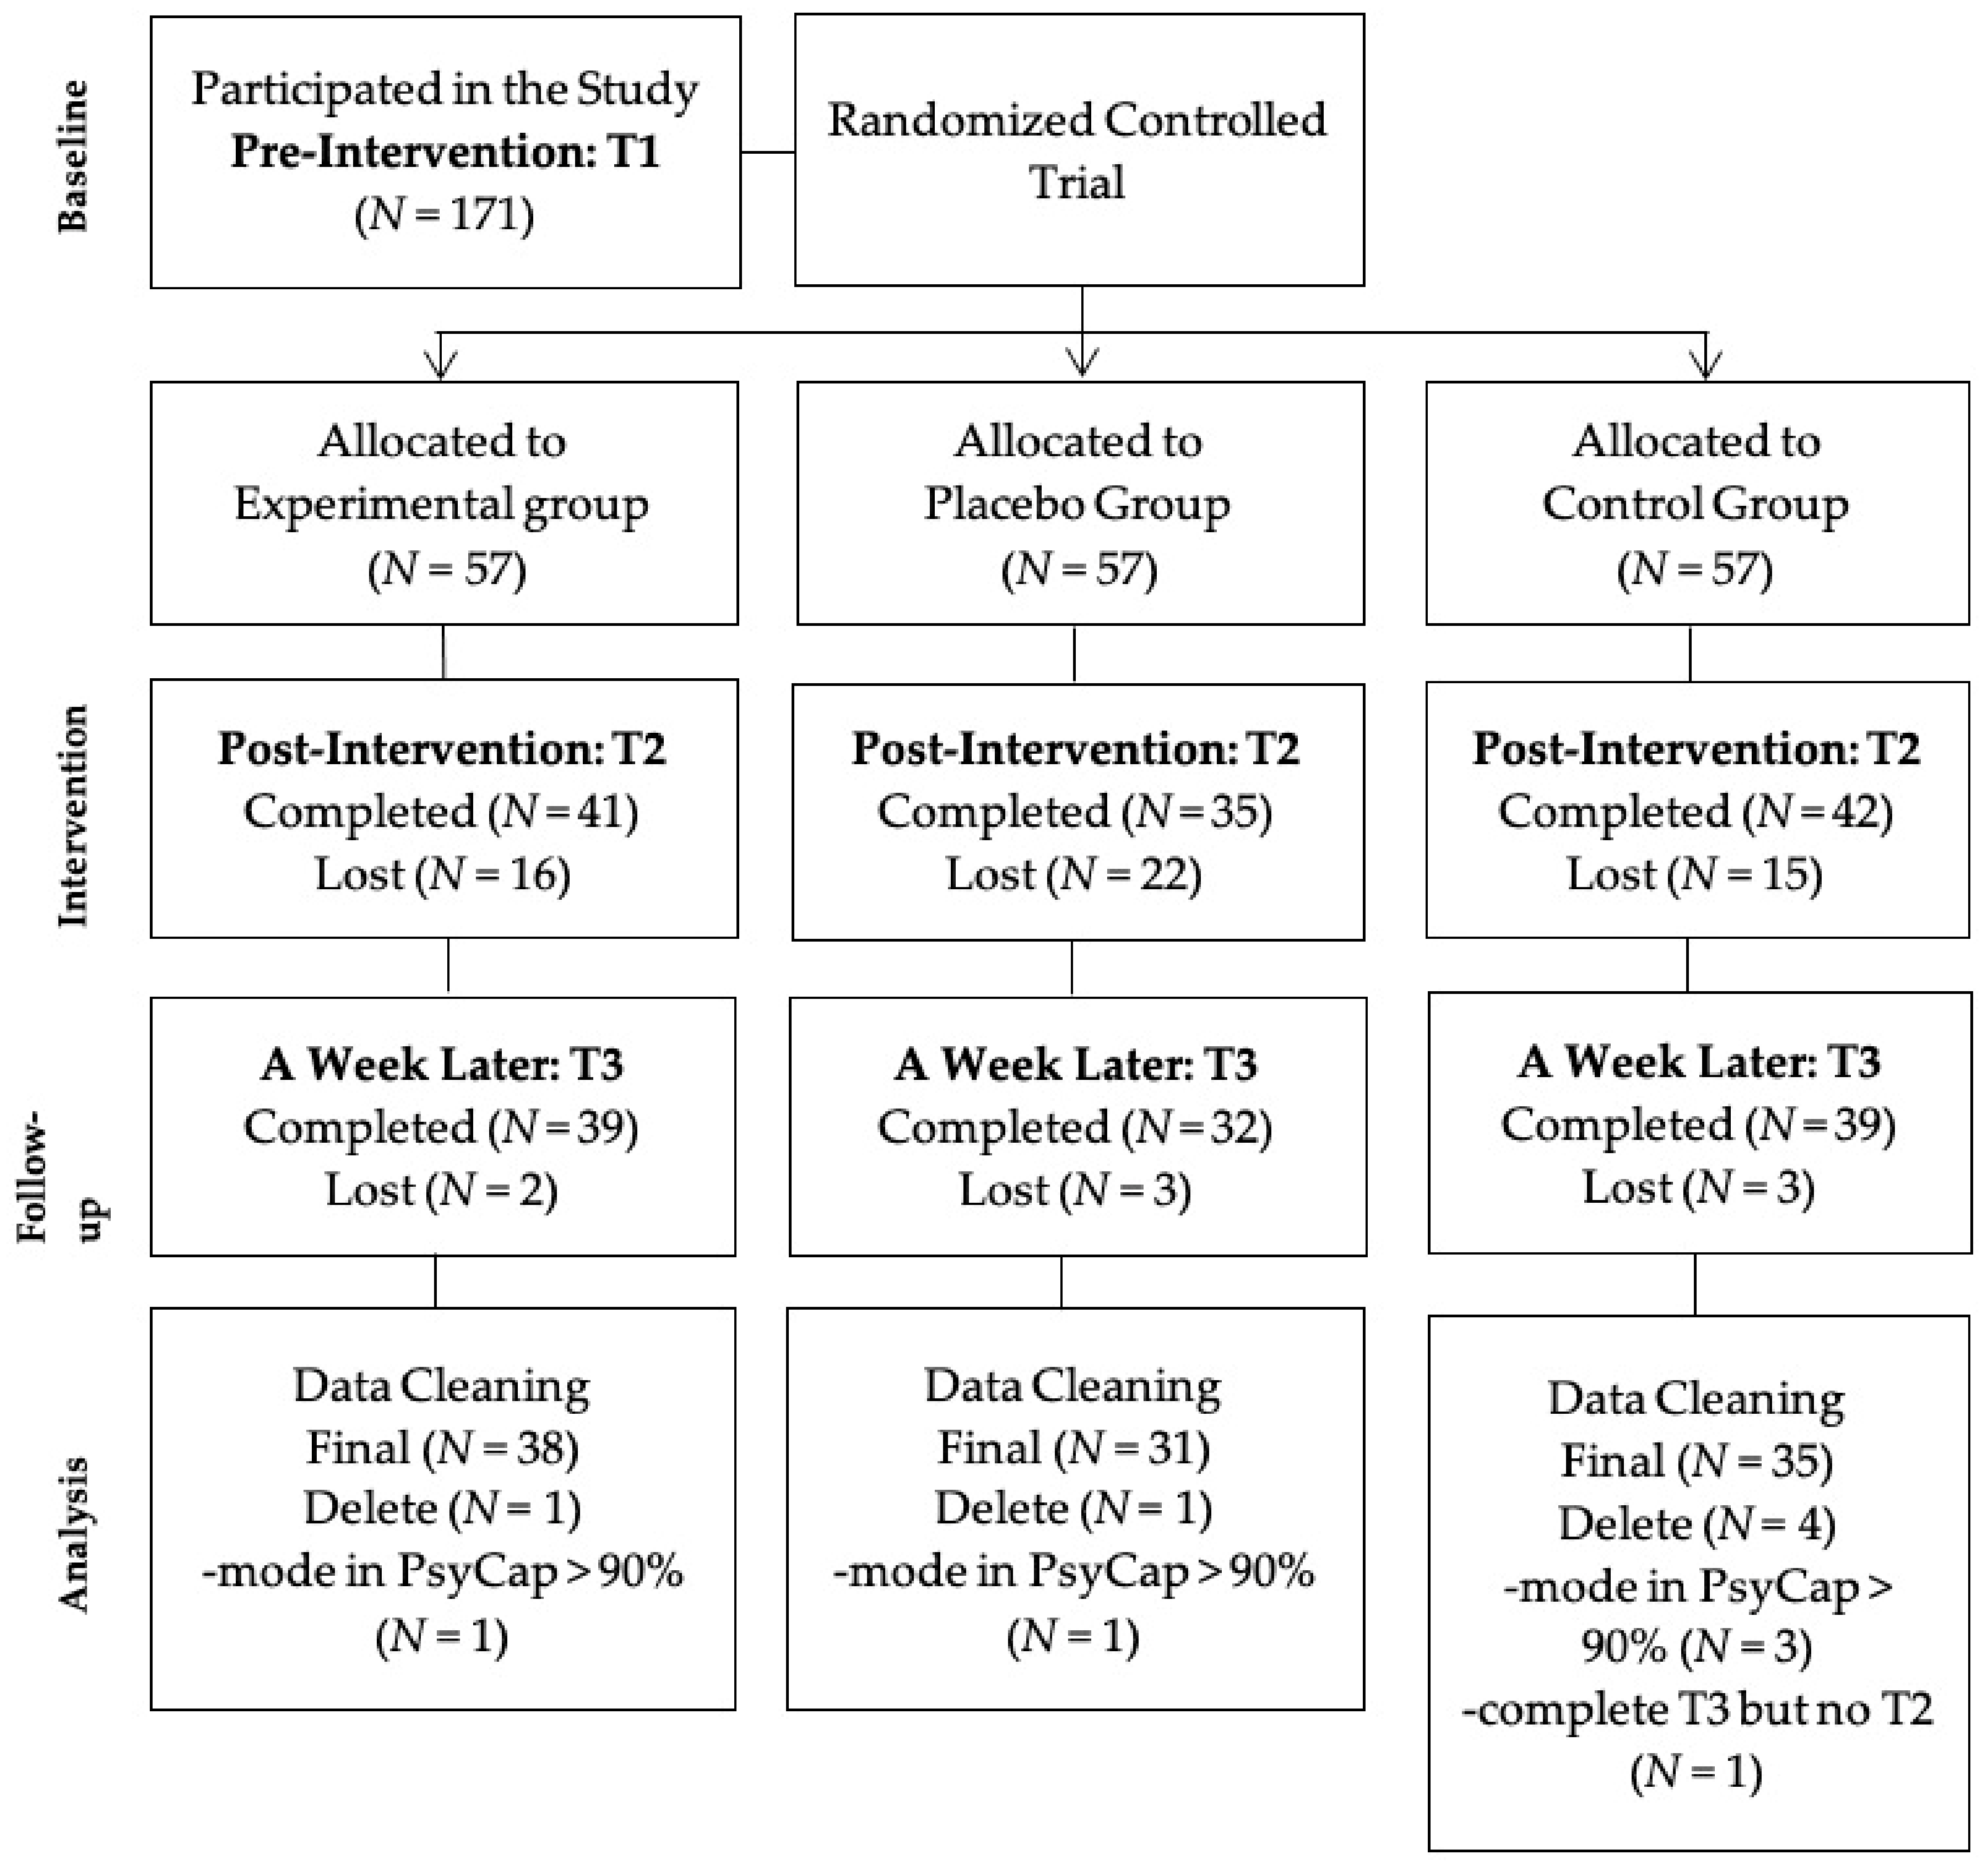
2.1. Participants
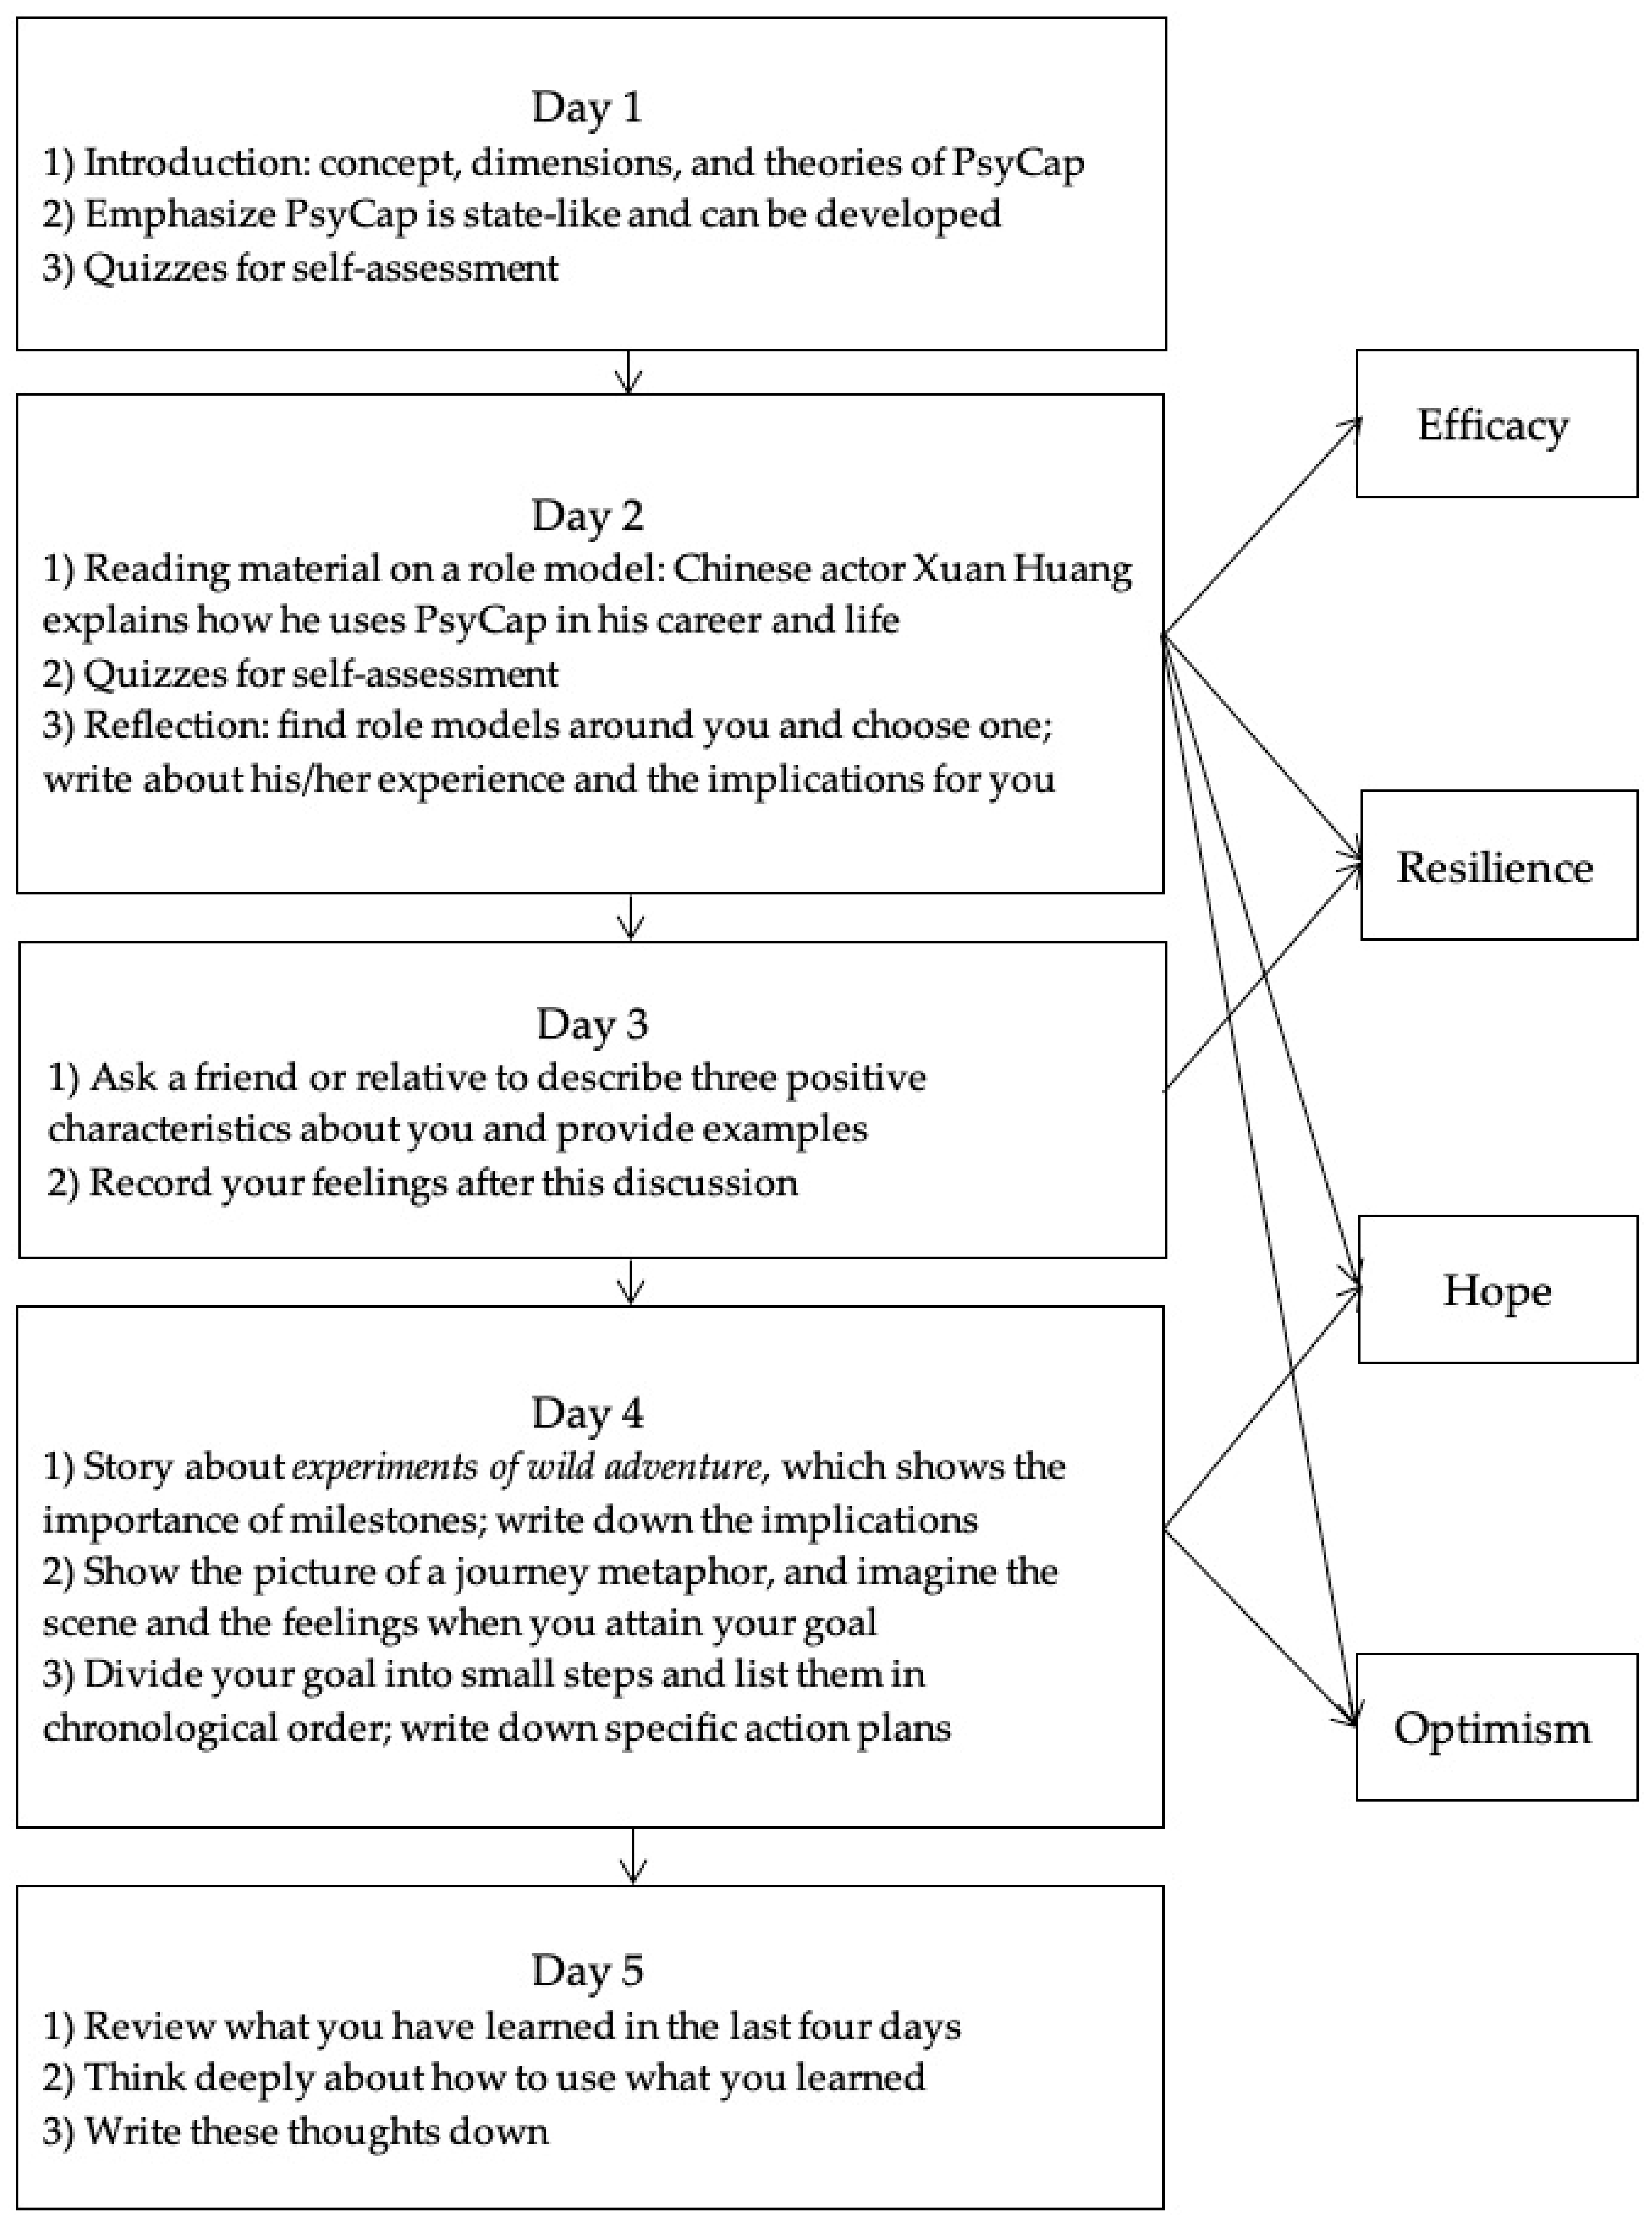
2.2. Procedure
2.3. Measures
2.4. Data Analysis
3. Results
3.1. Preliminary Analysis
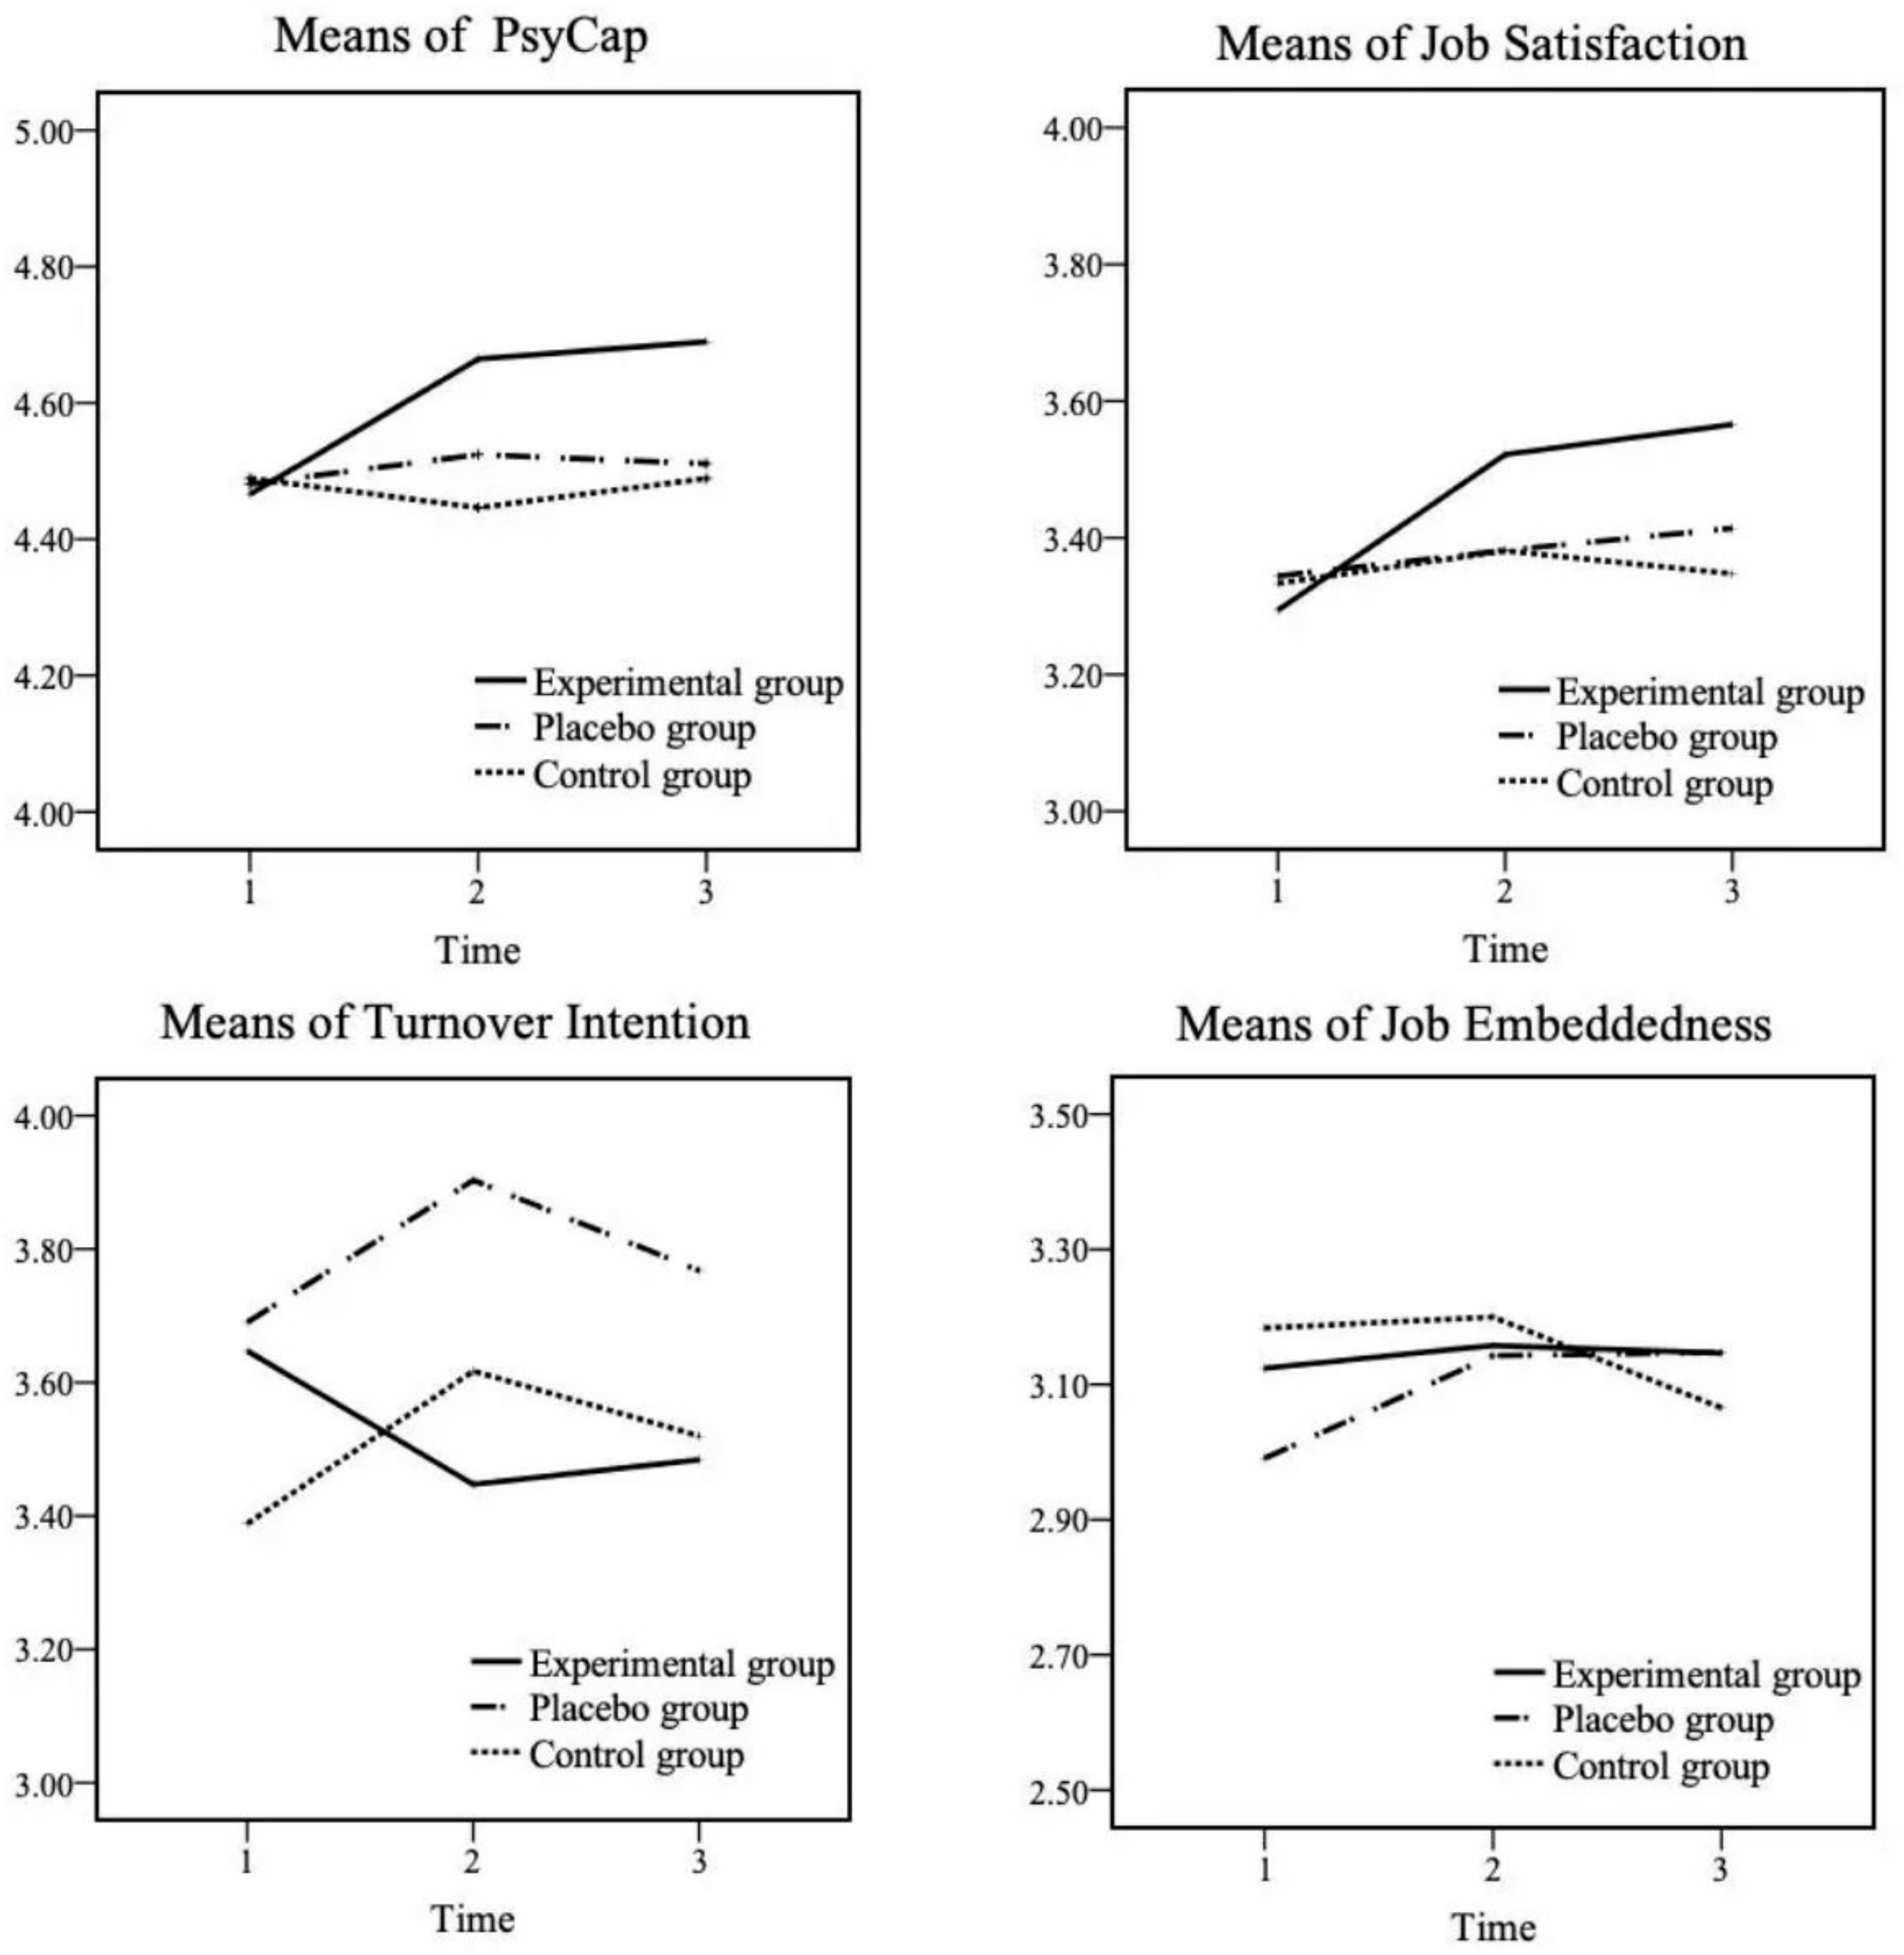
3.2. Intervention Effects on PsyCap
3.3. Intervention Effects on Work-Related Attitudes
4. Discussion
4.1. Limitations and Implications for Future Research
4.2. Practical Implications
5. Conclusions
Author Contributions
Funding
Acknowledgments
Conflicts of Interest
References
- Luthans, F.; Church, A.H. Positive Organizational Behavior: Developing and Managing Psychological Strengths. Acad. Manag. Exec. 2002, 16, 57–75. [Google Scholar] [CrossRef]
- Luthans, F.; Youssef, C.M. Human, Social, and Now Positive Psychological Capital Management: Investing in People for Competitive Advantage. Organ. Dyn. 2004, 33, 143–160. [Google Scholar] [CrossRef]
- Cameron, K.S.; Caza, A. Contributions to the Discipline of Positive Organizational Scholarship. Am. Behav. Sci. 2004, 47, 731–739. [Google Scholar] [CrossRef]
- Meyers, M.C.; Woerkom, M.V.; Bakker, A.B. The Added Value of the Positive: A Literature Review of Positive Psychology Interventions in Organizations. Eur. J. Work Organ. Psychol. 2013, 22, 618–632. [Google Scholar] [CrossRef]
- Cameron, K.S.; Mora, C.; Leutscher, T.; Calarco, M. Effects of Positive Practices on Organizational Effectiveness. J. Appl. Behav. Sci. 2011, 47, 266–308. [Google Scholar] [CrossRef]
- Nolzen, N. The concept of psychological capital: A comprehensive review. Manag. Rev. Q. 2018, 68, 237–277. [Google Scholar] [CrossRef]
- Luthans, F.; Avey, J.B.; Avolio, B.J.; Norman, S.M.; Combs, G.M. Psychological capital development: Toward a micro-intervention. J. Organ. Behav. 2006, 27, 387–393. [Google Scholar] [CrossRef]
- Luthans, F.; Avey, J.B.; Patera, J.L. Experimental Analysis of a Web-Based Training Intervention to Develop Positive Psychological Capital. Acad. Manag. Learn. Educ. 2008, 7, 209–221. [Google Scholar] [CrossRef]
- Luthans, F.; Avey, J.B.; Avolio, B.J.; Peterson, S.J. The Development and Resulting Performance Impact of Positive Psychological Capital. Hum. Resour. Dev. Q. 2010, 21, 41–67. [Google Scholar] [CrossRef]
- Dello Russo, S.; Stoykova, P. Psychological Capital Intervention (PCI): A Replication and Extension. Hum. Resour. Dev. Q. 2015, 26, 329–347. [Google Scholar] [CrossRef]
- Demerouti, E.; van Eeuwijk, E.; Snelder, M.; Wild, U. Assessing the effects of a “personal effectiveness” training on psychological capital, assertiveness and self-awareness using self-other agreement. Career Dev. Int. 2011, 16, 60–81. [Google Scholar] [CrossRef]
- Landau, M.J.; Oyserman, D.; Keefer, L.A.; Smith, G.C. The College Journey and Academic Engagement: How Metaphor Use Enhances Identity-Based Motivation. J. Personal. Soc. Psychol. 2014, 106, 679–698. [Google Scholar] [CrossRef] [PubMed]
- Hobfoll, S.E. Social and psychological resources and adaptation. Rev. Gen. Psychol. 2002, 6, 307. [Google Scholar] [CrossRef]
- Wright, T.A.; Hobfoll, S.E. Commitment, psychological well-being and job performance: An examination of conservation of resources (COR) theory and job burnout. J. Bus. Manag. 2004, 9, 389–406. [Google Scholar]
- Luthans, F.; Youssef, C.M.; Avolio, B.J. Psychological Capital: Developing the Human Competitive Edge; Oxford University Press: Oxford, UK, 2007. [Google Scholar]
- Luthans, F.; Avolio, B.J.; Avey, J.B.; Norman, S.M. Positive Psychological Capital: Measurement and Relationship with Performance and Satisfaction. Pers. Psychol. 2007, 60, 541–572. [Google Scholar] [CrossRef]
- Lomas, T. Positive cross-cultural psychology: Exploring similarityand difference in constructions and experiences of wellbeing. Int. J. Wellbeing 2015, 5, 60–77. [Google Scholar] [CrossRef]
- Reichard, R.J.; Dollwet, M.; Louw-Potgieter, J. Development of Cross-Cultural Psychological Capital and Its Relationship with Cultural Intelligence and Ethnocentrism. J. Leadersh. Org. Stud. 2014, 21, 150–164. [Google Scholar] [CrossRef]
- Tsegaye, W.K.; Su, Q.; Ouyang, Z. Cognitive adjustment and psychological capital influences on expatriate workers’ job performance: An Ethiopian study. J. Psychol. Afr. 2019, 29, 1–6. [Google Scholar] [CrossRef]
- Tatarko, A. Are Individual Value Orientations Related to Socio-Psychological Capital? A Comparative Analysis Data from Three Ethnic Groups in Russia. Glob. Bus. Issues Ejournal 2012. [Google Scholar] [CrossRef]
- Jin, C.-H. The effect of psychological capital on start-up intention among young start-up entrepreneurs: A cross-cultural comparison. Chin. Manag. Stud. 2017, 11, 707–729. [Google Scholar] [CrossRef]
- Chua, R.; Ng, Y.L.; Park, M. Mitigating Academic Distress: The Role of Psychological Capital in a Collectivistic Malaysian University Student Sample. Open Psychol. J. 2018, 11, 171–183. [Google Scholar] [CrossRef]
- Nawaz, M.; Bhatti, G.; Ahmad, S.; Ahmed, Z. How Can the Organizational Commitment of Pakistan Railways’ Employees Be Improved? The Moderating Role of Psychological Capital. J. Entrep. Manag. Innov. 2018, 14, 123–142. [Google Scholar] [CrossRef]
- Shen, X.; Yang, Y.; Wang, Y.; Liu, L.; Wang, S.; Wang, L. The association between occupational stress and depressive symptoms and the mediating role of psychological capital among Chinese university teachers: A cross-sectional study. BMC Psychiatry 2014, 14. [Google Scholar] [CrossRef]
- Li, X.; Kan, D.; Liu, L.; Shi, M.; Wang, Y.; Yang, X.; Wang, J.; Wang, L.; Wu, H. The mediating role of psychological capital on the association between occupational stress and job burnout among bank employees in China. Int. J. Environ. Res. Public Health 2015, 12, 2984–3001. [Google Scholar] [CrossRef] [PubMed]
- Chen, Q.; Kong, Y.; Niu, J.; Gao, W.; Li, J.; Li, M. How Leaders’ Psychological Capital Influence Their Followers’ Psychological Capital: Social Exchange or Emotional Contagion. Front. Psychol. 2019, 10. [Google Scholar] [CrossRef] [PubMed]
- Tian, F.; Shu, Q.; Cui, Q.; Wang, L.-l.; Liu, C.; Wu, H. The Mediating Role of Psychological Capital in the Relationship between Occupational Stress and Fatigue: A Cross-Sectional Study among 1104 Chinese Physicians. Front. Public Health 2020, 8. [Google Scholar] [CrossRef]
- Hendriks, T.; Schotanus-Dijkstra, M.; Hassankhan, A.; Graafsma, T.; Bohlmeijer, E.; Jong, J.D. The efficacy of positive psychology interventions from non-Western countries: A systematic review and meta-analysis. Int. J. Wellbeing 2018, 8, 71–98. [Google Scholar] [CrossRef]
- Hendriks, T.; Warren, M.A.; Schotanus-Dijkstra, M.; Hassankhan, A.; Graafsma, T.; Bohlmeijer, E.; Jong, J.D. How WEIRD are positive psychology interventions? A bibliometric analysis of randomized controlled trials on the science of well-being. J. Posit. Psychol. 2019, 14, 489–501. [Google Scholar] [CrossRef]
- Bandura, A. Self-Efficacy: The Exercise of Control; W.H. Freeman and Company: New York, NY, USA, 1997. [Google Scholar]
- Stajkovic, A.D.; Luthans, F. Social Cognitive Theory and Self-Efficacy: Goin beyond Traditional Motivational and Behavioral Approaches. Organ. Dyn. 1998, 26, 62–74. [Google Scholar] [CrossRef]
- Snyder, C.R. Handbook of Hope; Academic Press: San Diego, CA, USA, 2000. [Google Scholar]
- Lakoff, G.; Johnson, M. Metaphors We Live By; University of Chicago Press: Chicago, IL, USA, 1980. [Google Scholar]
- Oyserman, D. Not just any path: Implications of identity-based motivation for disparities in school outcomes. Econ. Educ. Rev. 2013, 33, 179–190. [Google Scholar] [CrossRef]
- Luthans, F.; Vogelgesang, G.R.; Lester, P.B. Developing the Psychological Capital of Resiliency. Hum. Resour. Dev. Rev. 2006, 5, 25–44. [Google Scholar] [CrossRef]
- Luthans, F. The Need for and Meaning of Positive Organizational Behavior. J. Organ. Behav. 2002, 23, 695–706. [Google Scholar] [CrossRef]
- Masten, A.S. Ordinary Magic: Resilience Processes in Development. Am. Psychol. 2001, 56, 227–238. [Google Scholar] [CrossRef] [PubMed]
- Seligman, M.E.P. Learned Optimism; Pocket Books: New York, NY, USA, 1998. [Google Scholar]
- De Tornyay, R.T.M. Strategies for Teaching Nursing, 3rd ed.; Delmar Publishers: Albany, NY, USA, 1987. [Google Scholar]
- Khalil, M.K.; Nelson, L.D.; Kibble, J.D. The Use of Self-learning Modules to Facilitate Learning of Basic Science Concepts in an Integrated Medical Curriculum. Anat. Sci. Educ. 2010, 3, 219–226. [Google Scholar] [CrossRef]
- Feldman, M.A.; Case, L. Teaching Child-Care and Safety Skills to Parents with Intellectual Disabilities through Self-learning. J. Intellect. Dev. Disabil. 1999, 24, 27–44. [Google Scholar] [CrossRef]
- Kalbfeld, K. Evaluating the Effect of a Self-Learning Packet on Change in Nursing Practice; Southern Connecticut State University: New Haven, CT, USA, 2006. [Google Scholar]
- Dougal, J.; Gonterman, R. A Comparison of Three Teaching Methods on Learning and Retention. J. Nurses Staff Dev. 1999, 15, 205–209. [Google Scholar] [CrossRef]
- Candy, P.C. Self-Direction for Lifelong Learning: A Comprehensive Guide to Theory and Practice; Jossey-Bass: San Francisco, CA, USA, 1991. [Google Scholar]
- Sitzmann, T.; Kraiger, K.; Stewart, D.; Wisher, R. The Comparative Effectiveness of Web-based and Classroom Instruction: A Meta-Analysis. Pers. Psychol. 2006, 59, 623–664. [Google Scholar] [CrossRef]
- Updegraff, J.A.; Taylor, S.E. From Vulnerability to Growth: Positive and Negative Effects of Stressful Life Events. In Loss and Trauma: General and Close Relationship Perspectives; Harvey, J., Miller, E., Eds.; Brunner-Routledge: Philadelphia, PA, USA, 2000; pp. 3–28. [Google Scholar]
- Peterson, S.J.; Luthans, F.; Avolio, B.J.; Walumbwa, F.O.; Zhang, Z. Psychological Capital and Employee Performance: A Latent Growth Modeling Approach. Pers. Psychol. 2011, 64, 427–450. [Google Scholar] [CrossRef]
- Luthans, F.; Norman, S.M.; Avolio, B.J.; Avey, J.B. The Mediating Role of Psychological Capital in the Supportive Organizational Climate-Employee Performance Relationship. J. Organ. Behav. 2008, 29, 219–238. [Google Scholar] [CrossRef]
- Youssef, C.M.; Luthans, F. Positive Organizational Behavior in the Workplace: The Impact of Hope, Optimism, and Resilience. J. Manag. 2007, 33, 774–800. [Google Scholar] [CrossRef]
- Avey, J.B.; Patera, J.L.; West, B.J. The Implications of Positive Psychological Capital on Employee Absenteeism. J. Leadersh. Organ. Stud. 2006, 13, 42–60. [Google Scholar] [CrossRef]
- Locke, E.A. What is Job Satisfaction? Organ. Behav. Hum. Perform. 1969, 4, 309–336. [Google Scholar] [CrossRef]
- Wolf, M.G. Nedd Gratification Theory: A Theoretical Reformulation of Job Satisfaction/Dissatisfaction and Job Motivation. J. Appl. Psychol. 1970, 54, 87–94. [Google Scholar] [CrossRef]
- Spector, P.E. Job Satisfaction; Sage Publications Inc.: New York, NY, USA, 1997. [Google Scholar]
- Avey, J.B.; Reichard, R.J.; Luthans, F.; Mhatre, K.H. Meta-Analysis of the Impact of Positive Psychological Capital on Employee Attitudes, Behaviors, and Performance. Hum. Resour. Dev. Q. 2011, 22, 127–152. [Google Scholar] [CrossRef]
- Hom, P.W.; Griffeth, R.W. Employee Turnover; South-Western College Publishing: Cincinnati, OH, USA, 1995. [Google Scholar]
- Hom, P.W.; Lee, T.W.; Shaw, J.D.; Hausknecht, J.P. One Hundred Years of Employee Turnover Theory and Research. J. Appl. Psychol. 2017, 102, 530–545. [Google Scholar] [CrossRef]
- March, J.G.; Simon, H.A. Organizations; Wiley: New York, NY, USA, 1958. [Google Scholar]
- Ajzen, I. The Theory of Planned Behavior. Organ. Behav. Hum. Decis. Process. 1991, 50, 179–211. [Google Scholar] [CrossRef]
- Avey, J.B.; Luthans, F.; Youssef, C.M. The Additive Value of Positive Psychological Capital in Predicting Work Attitudes and Behaviors. J. Manag. 2010, 36, 430–452. [Google Scholar] [CrossRef]
- Siu, O.L.; Cheung, F.; Lui, S. Linking Positive Emotions to Work Well-Being and Turnover Intention among Hong Kong Police Officers: The Role of Psychological Capital. J. Happiness Stud. 2015, 16, 367–380. [Google Scholar] [CrossRef]
- Mitchell, T.R.; Holtom, B.C.; Wee, T.W.; Sablyskyi, C.J.; Erez, M. Why People Stay: Using Job Embeddedness to Predict Voluntary Turnonver. Acad. Manag. J. 2001, 44, 1102–1121. [Google Scholar] [CrossRef]
- Sun, T.; Zhao, X.W.; Yang, L.B.; Fan, L.H. The Impact of Psychological Capital on Job Embeddedness and Job Performance among Nurses: A Structural Equation Approach. J. Adv. Nurs. 2012, 68, 69–79. [Google Scholar] [CrossRef]
- Lu, Q.; Dong, L.; Wu, I.H.C.; You, J.; Huang, J.; Hu, Y. The impact of an expressive writing intervention on quality of life among Chinese breast cancer patients undergoing chemotherapy. Supportive Care Cancer 2018, 27, 165–173. [Google Scholar] [CrossRef] [PubMed]
- Dolev-Amit, T.; Rubin, A.; Zilcha-Mano, S. Is Awareness of Strengths Intervention Sufficient to Cultivate Wellbeing and Other Positive Outcomes? J. Happiness Stud. 2020, 1–22. [Google Scholar] [CrossRef]
- Smyth, J.M. Written Emotional Expression: Effect Sizes, Outcome Types, and Moderating Variables. J. Consult. Clin. Psych. 1998, 66, 174–184. [Google Scholar] [CrossRef]
- Frattaroli, J. Experimental Disclosure and Its Moderators: A Meta-Analysis. Psychol. Bull. 2006, 132, 823–865. [Google Scholar] [CrossRef] [PubMed]
- Agho, A.O.; Price, J.L.; Mueller, C.W. Discriminant Validity of Measures of Job Satisfaction, Positive Affectivity and Negative Affectivity. J. Occup. Organ. Psychol. 1992, 65, 185–195. [Google Scholar] [CrossRef]
- Bluedom, A.C. A Unified Model of Turnover from Organizations. Hum. Relat. 1982, 35, 135–153. [Google Scholar] [CrossRef]
- Crossley, C.D.; Bennett, R.J.; Jex, S.M.; Burnfield, J.L. Development of a Global Measure of Job Embeddedness and Integration into a Traditional Model of Voluntary Turnover. J. Appl. Psychol. 2007, 92, 1031–1042. [Google Scholar] [CrossRef]
- Cohen, J. Statistical Power Analysis for the Behavioral Sciences, 2nd ed.; Erlbaum: Hillsdale, NJ, USA, 1988. [Google Scholar]
- Innstrand, S.T.; Christensen, M. Healthy Universities. The development and implementation of a holistic health promotion intervention programme especially adapted for staff working in the higher educational sector: The ARK study. Promot. Educ. 2018, 27, 68–76. [Google Scholar] [CrossRef]
- Nielsen, K.; Randall, R. The importance of employee participation and perceptions of changes in procedures in a teamworking intervention. Work Stress 2012, 26, 91–111. [Google Scholar] [CrossRef]
- Abildgaard, J.S.; Saksvik, P.Ø.; Nielsen, K. How to measure the intervention process? An assessment of qualitative and quantitative approaches to data collection in the process evaluation of organizational interventions. Front. Psychol. 2016, 7, 1380. [Google Scholar] [CrossRef]
- Nielsen, K. Organizational occupational health interventions: What works for whom in which circumstances? Occup. Med. Oxf. 2017, 67, 410–412. [Google Scholar] [CrossRef] [PubMed][Green Version]
- Ng, T.W.H.; Feldman, D.C. The Effects of Organizational Embeddedness on Development of Social Capital and Human Capital. J. Appl. Psychol. 2010, 95, 696–712. [Google Scholar] [CrossRef] [PubMed]
- Leykin, Y.; Thekdi, S.M.; Shumay, D.; MuÒoz, R.; Riba, M.; Dunn, L. Internet interventions for improving psychological welå being in psycho oncology: Review and recommendations. Psychè Oncol. 2012, 21. [Google Scholar] [CrossRef]
- Walter, N.; Nikoleizig, L.; Alfermann, D. Effects of Self-Talk Training on Competitive Anxiety, Self-Efficacy, Volitional Skills, and Performance: An Intervention Study with Junior Sub-Elite Athletes. Sports 2019, 7. [Google Scholar] [CrossRef] [PubMed]
- Hertzog, M.A. Considerations in determining sample size for pilot studies. Res. Nurse Health 2008, 31, 180–191. [Google Scholar] [CrossRef]


| 1 | 2 | 3 | 4 | 5 | 6 | 7 | 8 | 9 | 10 | 11 | 12 | |
|---|---|---|---|---|---|---|---|---|---|---|---|---|
| 1. PC T1 | (0.89) | |||||||||||
| 2. PC T2 | 0.77 ** | (0.91) | ||||||||||
| 3. PC T3 | 0.75 ** | 0.89 ** | (0.93) | |||||||||
| 4. JS T1 | 0.61 ** | 0.51 ** | 0.53 ** | (0.83) | ||||||||
| 5. JS T2 | 0.48 ** | 0.55 ** | 0.58 ** | 0.80 ** | (0.89) | |||||||
| 6. JS T3 | 0.49 ** | 0.57 ** | 0.63 ** | 0.77 ** | 0.89 ** | (0.90) | ||||||
| 7. TI T1 | −0.30 ** | −0.27 ** | −0.31 ** | −0.60 ** | −0.53 ** | −0.57 ** | (0.94) | |||||
| 8. TI T2 | −0.30 ** | −0.29 ** | −0.36 ** | −0.59 ** | −0.61 ** | −0.63 ** | 0.90 ** | (0.93) | ||||
| 9. TI T3 | −0.27 ** | −0.28 ** | −0.34 ** | −0.57 ** | −0.59 ** | −0.62 ** | 0.90 ** | 0.95 ** | (0.96) | |||
| 10. JE T1 | 0.21 * | 0.20 * | 0.26 ** | 0.51 ** | 0.58 ** | 0.55 ** | −0.62 ** | −0.65 ** | −0.64 ** | (0.81) | ||
| 11. JE T2 | 0.19 | 0.24 * | 0.27 ** | 0.49 ** | 0.60 ** | 0.59 ** | −0.58 ** | −0.65 ** | −0.66 ** | 0.87 ** | (0.87) | |
| 12. JE T3 | 0.21 * | 0.28 ** | 0.34 ** | 0.47 ** | 0.57 ** | 0.64 ** | −0.62 ** | −0.68 ** | −0.70 ** | 0.83 ** | 0.88 ** | (0.83) |
| Variable | Group | M (SD) | Results of MANOVA | |||||||
|---|---|---|---|---|---|---|---|---|---|---|
| Pre (T1) | Post (T2) | Follow-up (T3) | Pre (T1) | Post (T2) | Follow-up (T3) | |||||
| Univariate F, p-Value | ηp2 | Univariate F, p-Value | ηp2 | Univariate F, p-Value | ηp2 | |||||
| PsyCap | E | 4.47 (0.559) | 4.66 (0.503) | 4.69 (0.513) | 0.020, 0.981 | 0.000 | 1.673, 0.193 | 0.032 | 1.705, 0.187 | 0.033 |
| P | 4.48 (0.434) | 4.52 (0.489) | 4.51 (0.473) | |||||||
| C | 4.49 (0.514) | 4.44 (0.554) | 4.49 (0.532) | |||||||
| Job Satisfaction | E | 3.29 (0.651) | 3.52 (0.632) | 3.57 (0.636) | 0.048, 0.952 | 0.001 | 0.438, 0.646 | 0.009 | 0.852, 0.430 | 0.017 |
| P | 3.34 (0.689) | 3.38 (0.812) | 3.41 (0.785) | |||||||
| C | 3.33 (0.795) | 3.38 (0.774) | 3.35 (0.782) | |||||||
| Turnover Intention | E | 3.65 (1.64) | 3.45 (1.51) | 3.48 (1.59) | 0.314, 0.731 | 0.006 | 0.725, 0.487 | 0.014 | 0.308, 0.736 | 0.006 |
| P | 3.69 (1.80) | 3.90 (1.63) | 3.77 (1.59) | |||||||
| C | 3.39 (1.69) | 3.62 (1.58) | 3.52 (1.59) | |||||||
| Job Embeddedness | E | 3.12 (0.471) | 3.16 (0.618) | 3.15 (0.535) | 0.671, 0.514 | 0.013 | 0.051, 0.950 | 0.001 | 0.172, 0.842 | 0.003 |
| P | 2.99 (0.899) | 3.14 (0.904) | 3.15 (0.861) | |||||||
| C | 3.18 (0.671) | 3.20 (0.763) | 3.07 (0.609) | |||||||
| Dependent Variable | Variables | F Value | p-Value | Dependent Variable | Variables | F Value | p-Value |
|---|---|---|---|---|---|---|---|
| PsyCap at T2 | PsyCap at T1 | 159.629 | <0.001 | JS at T2 | JS at T1 | 176.522 | <0.001 |
| Age | 0.855 | 0.357 | Age | 0.001 | 0.979 | ||
| Gender | 0.131 | 0.719 | Gender | 0.170 | 0.681 | ||
| Job Tenure | 0.144 | 0.705 | Job Tenure | 0.221 | 0.639 | ||
| Education | 0.589 | 0.455 | Education | 0.072 | 0.790 | ||
| Marriage | 0.534 | 0.467 | Marriage | 0.221 | 0.639 | ||
| Group | 4.546 | 0.013 | Group | 1.688 | 0.190 | ||
| PsyCap at T3 | PsyCap at T1 | 129.698 | <0.001 | JS at T3 | JS T1 | 140.703 | <0.001 |
| Age | 0.028 | 0.867 | Age | 0.822 | 0.367 | ||
| Gender | 2.132 | 0.148 | Gender | 0.018 | 0.893 | ||
| Job Tenure | 0.092 | 0.762 | Job Tenure | 0.813 | 0.370 | ||
| Education | 0.663 | 0.417 | Education | 0.298 | 0.587 | ||
| Marriage | 0.102 | 0.750 | Marriage | 0.095 | 0.758 | ||
| Group | 5.018 | 0.008 | Group | 3.089 | 0.050 | ||
| TI at T2 | TI at T1 | 433.628 | <0.001 | JE at T2 | JE at T1 | 314.839 | <0.001 |
| Age | 0.265 | 0.608 | Age | 0.013 | 0.908 | ||
| Gender | 2.175 | 0.144 | Gender | 0.483 | 0.489 | ||
| Job Tenure | 0.125 | 0.724 | Job Tenure | 0.398 | 0.530 | ||
| Education | 2.470 | 0.119 | Education | 0.499 | 0.482 | ||
| Marriage | 0.616 | 0.434 | Marriage | 0.929 | 0.338 | ||
| Group | 5.017 | 0.008 | Group | 1.044 | 0.356 | ||
| TI at T3 | TI at T1 | 419.907 | <0.001 | JE at T3 | JE at T1 | 230.827 | <0.001 |
| Age | 0.182 | 0.670 | Age | 0.037 | 0.848 | ||
| Gender | 0.397 | 0.530 | Gender | 0.701 | 0.405 | ||
| Job Tenure | 0.005 | 0.943 | Job Tenure | 0.923 | 0.339 | ||
| Education | 1.416 | 0.237 | Education | 5.835 | 0.018 | ||
| Marriage | 0.044 | 0.835 | Marriage | 0.405 | 0.526 | ||
| Group | 1.544 | 0.219 | Group | 3.028 | 0.053 |
Publisher’s Note: MDPI stays neutral with regard to jurisdictional claims in published maps and institutional affiliations. |
© 2020 by the authors. Licensee MDPI, Basel, Switzerland. This article is an open access article distributed under the terms and conditions of the Creative Commons Attribution (CC BY) license (http://creativecommons.org/licenses/by/4.0/).
Share and Cite
Da, S.; He, Y.; Zhang, X. Effectiveness of Psychological Capital Intervention and Its Influence on Work-Related Attitudes: Daily Online Self-Learning Method and Randomized Controlled Trial Design. Int. J. Environ. Res. Public Health 2020, 17, 8754. https://doi.org/10.3390/ijerph17238754
Da S, He Y, Zhang X. Effectiveness of Psychological Capital Intervention and Its Influence on Work-Related Attitudes: Daily Online Self-Learning Method and Randomized Controlled Trial Design. International Journal of Environmental Research and Public Health. 2020; 17(23):8754. https://doi.org/10.3390/ijerph17238754
Chicago/Turabian StyleDa, Shu, Yue He, and Xichao Zhang. 2020. "Effectiveness of Psychological Capital Intervention and Its Influence on Work-Related Attitudes: Daily Online Self-Learning Method and Randomized Controlled Trial Design" International Journal of Environmental Research and Public Health 17, no. 23: 8754. https://doi.org/10.3390/ijerph17238754
APA StyleDa, S., He, Y., & Zhang, X. (2020). Effectiveness of Psychological Capital Intervention and Its Influence on Work-Related Attitudes: Daily Online Self-Learning Method and Randomized Controlled Trial Design. International Journal of Environmental Research and Public Health, 17(23), 8754. https://doi.org/10.3390/ijerph17238754