Livestock Wastewater Treatment in Constructed Wetlands for Agriculture Reuse

 , ,
, , 
Abstract
1. Introduction
2. Materials and Methods
2.1. Sampling
2.2. Microcosms Assembly
2.3. Microcosms Operation
2.3.1. Phragmites Australis
2.3.2. Typha Latifolia
2.4. Samples Analysis
2.5. Statistical Analysis
3. Results
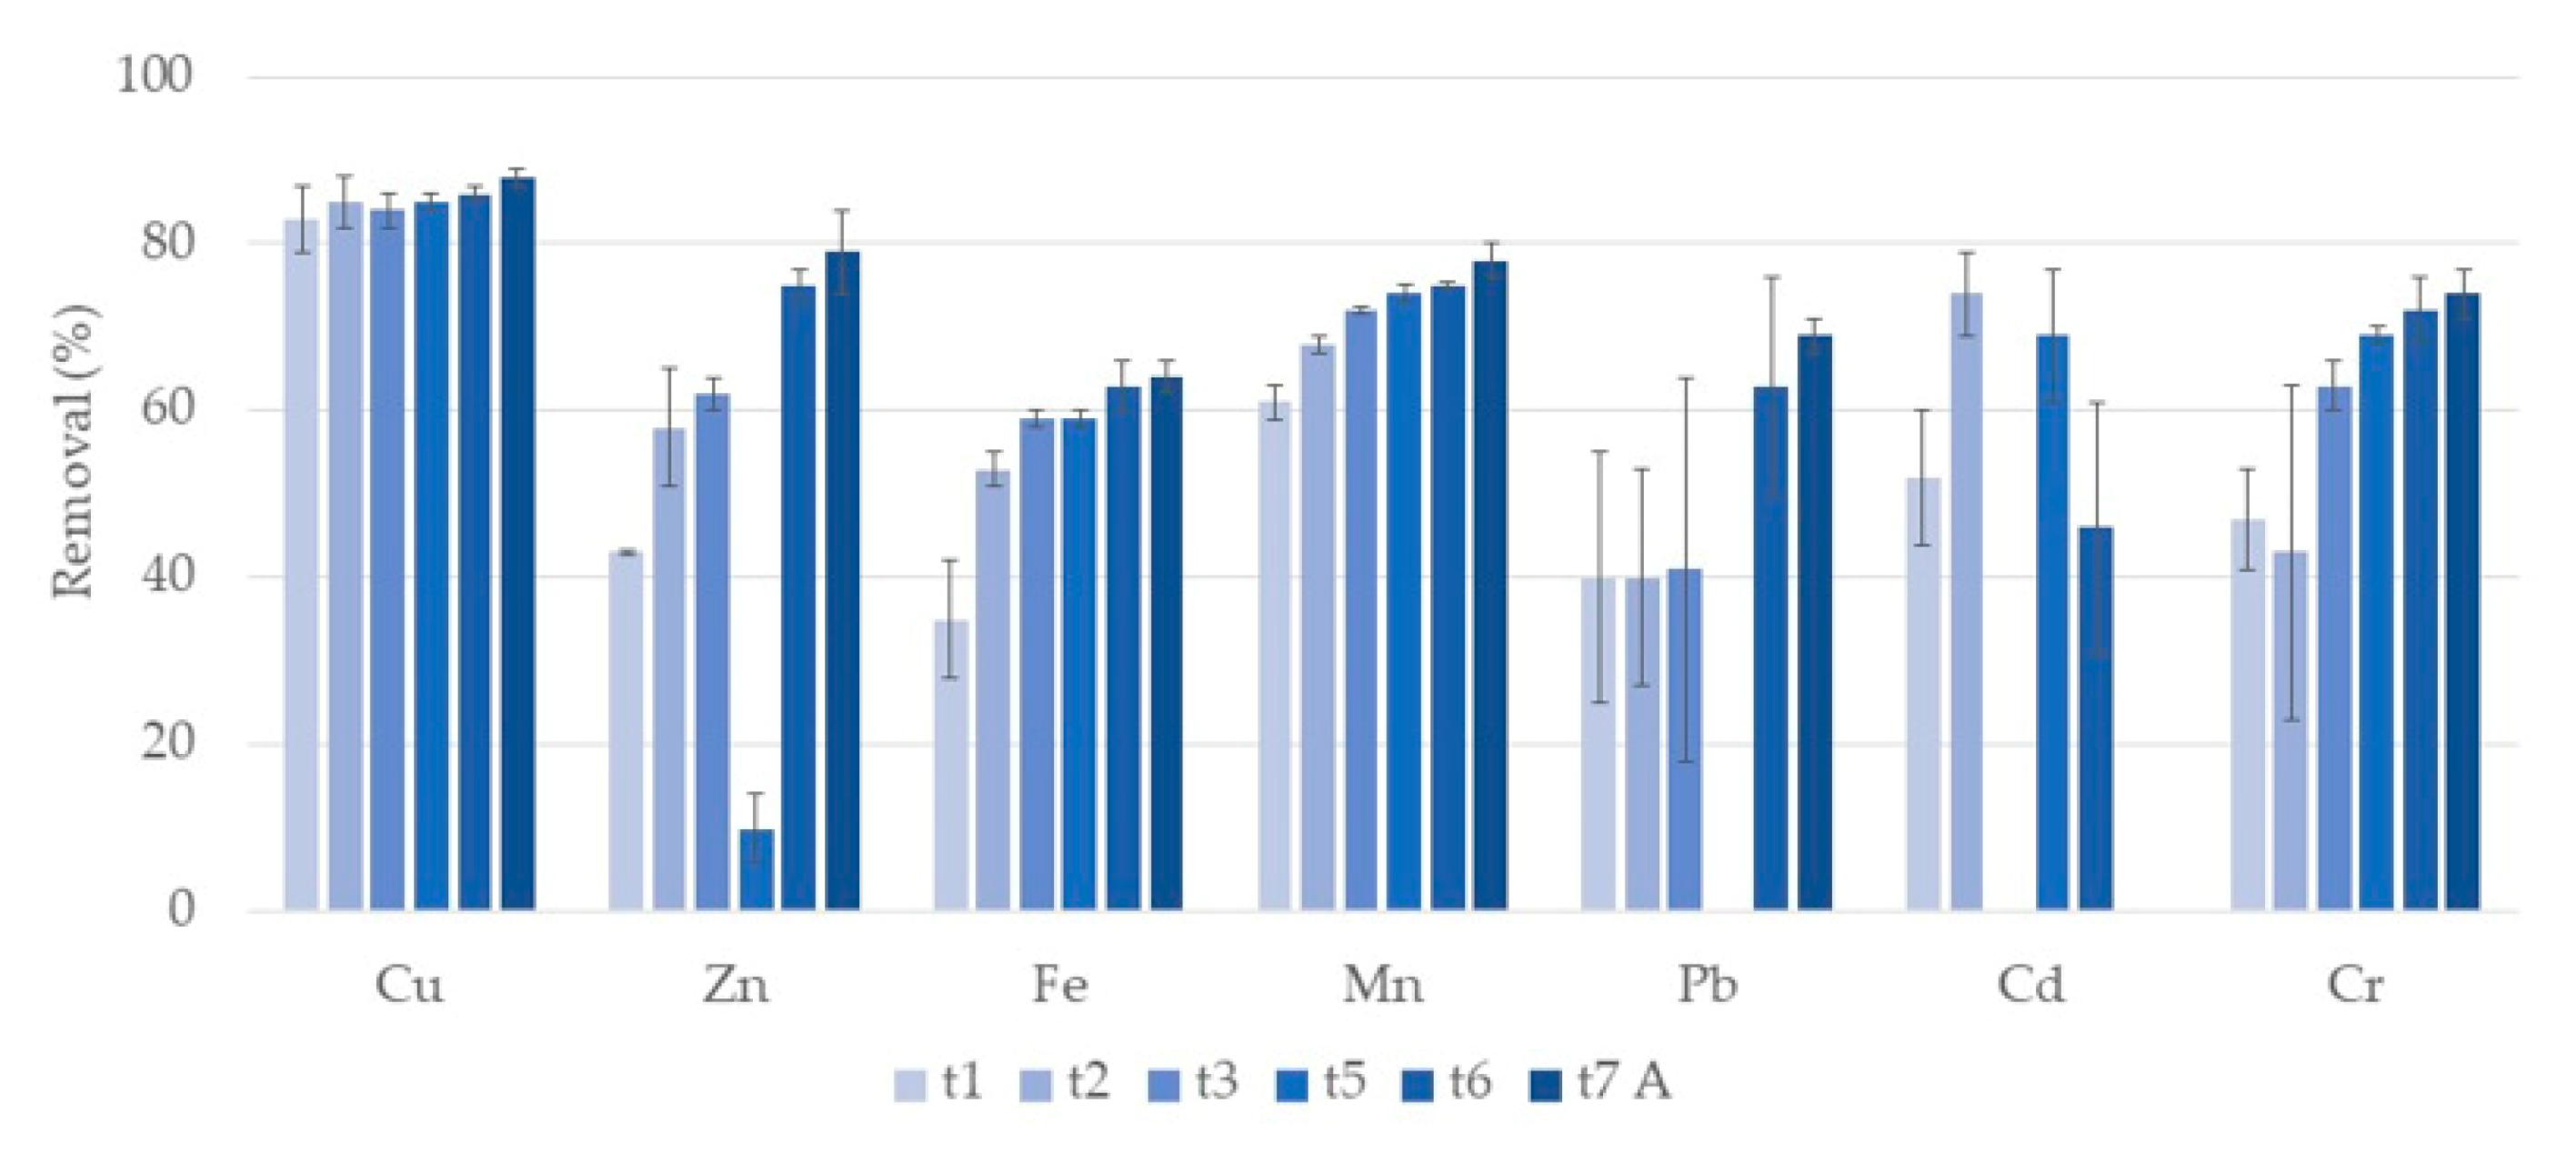
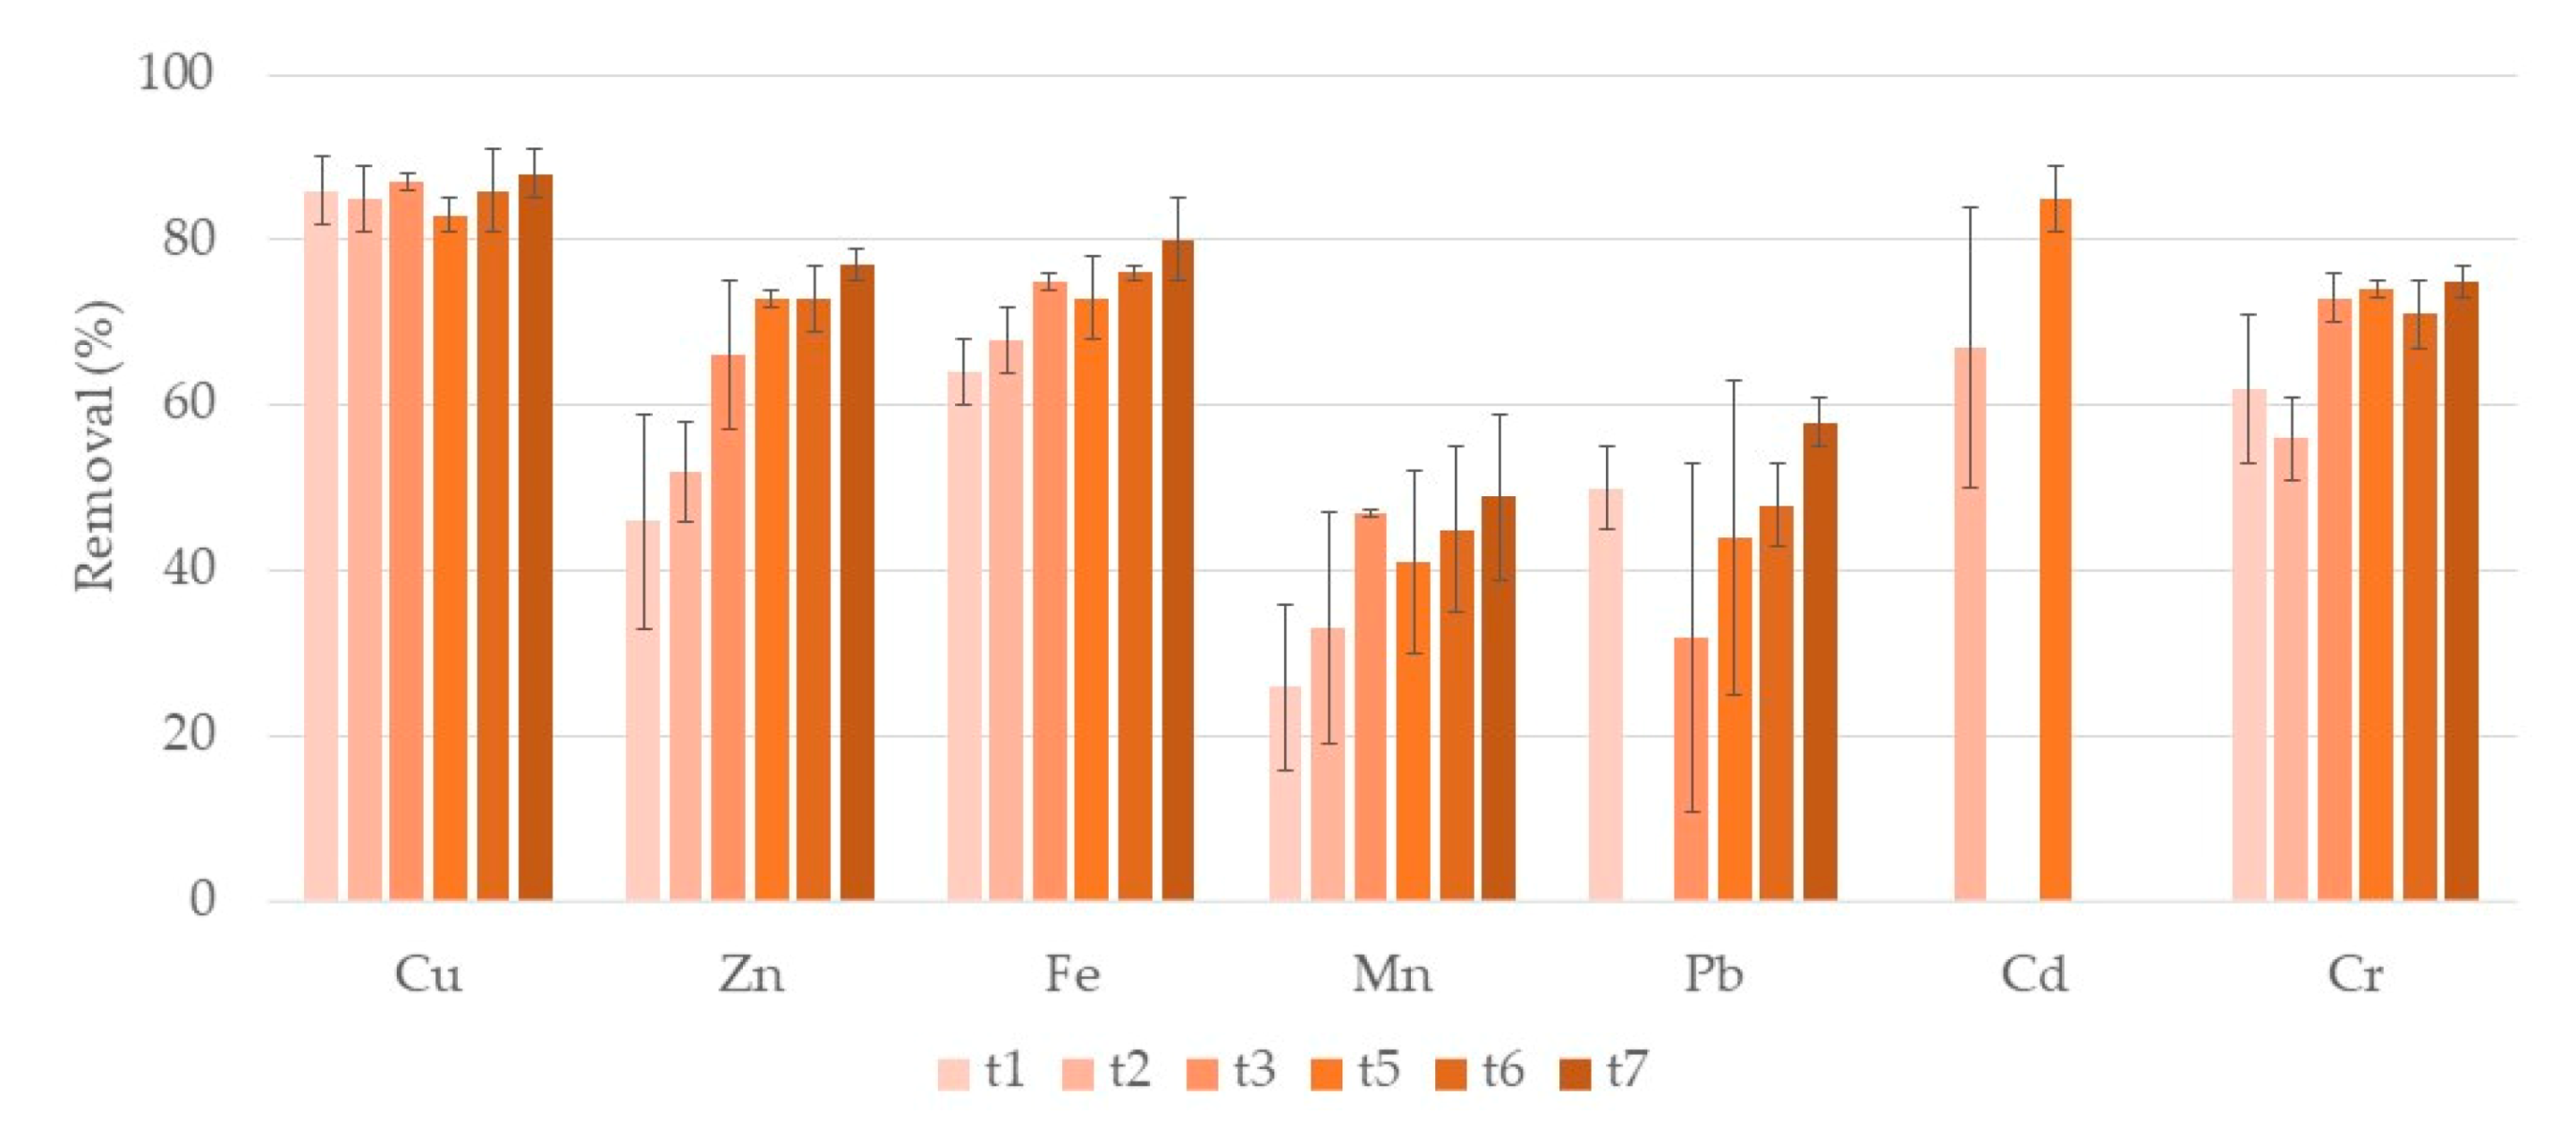
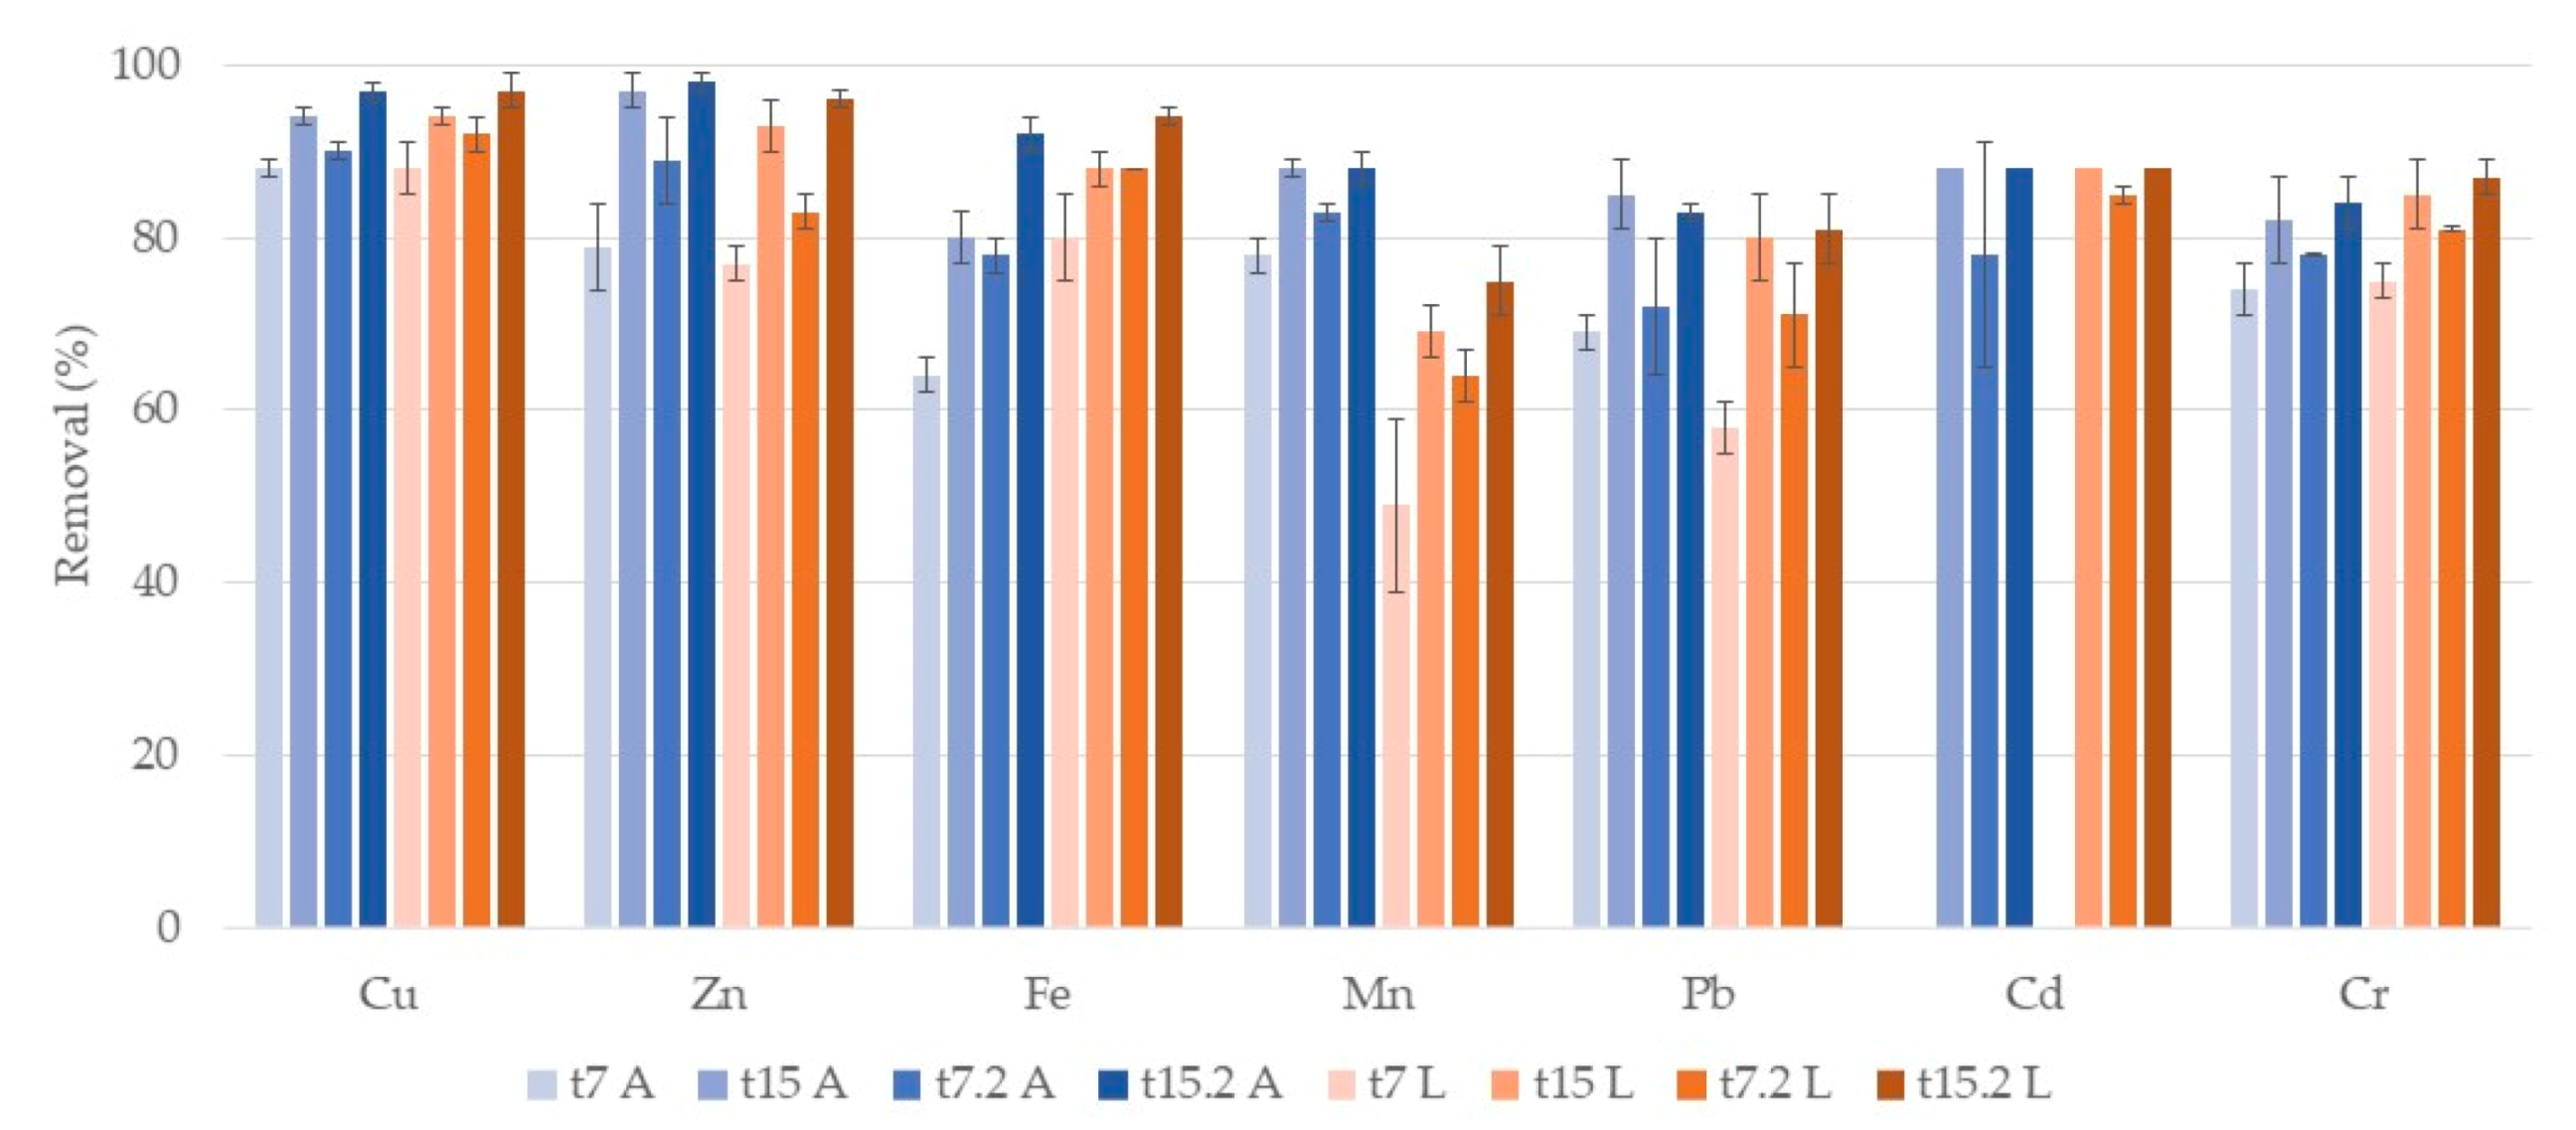
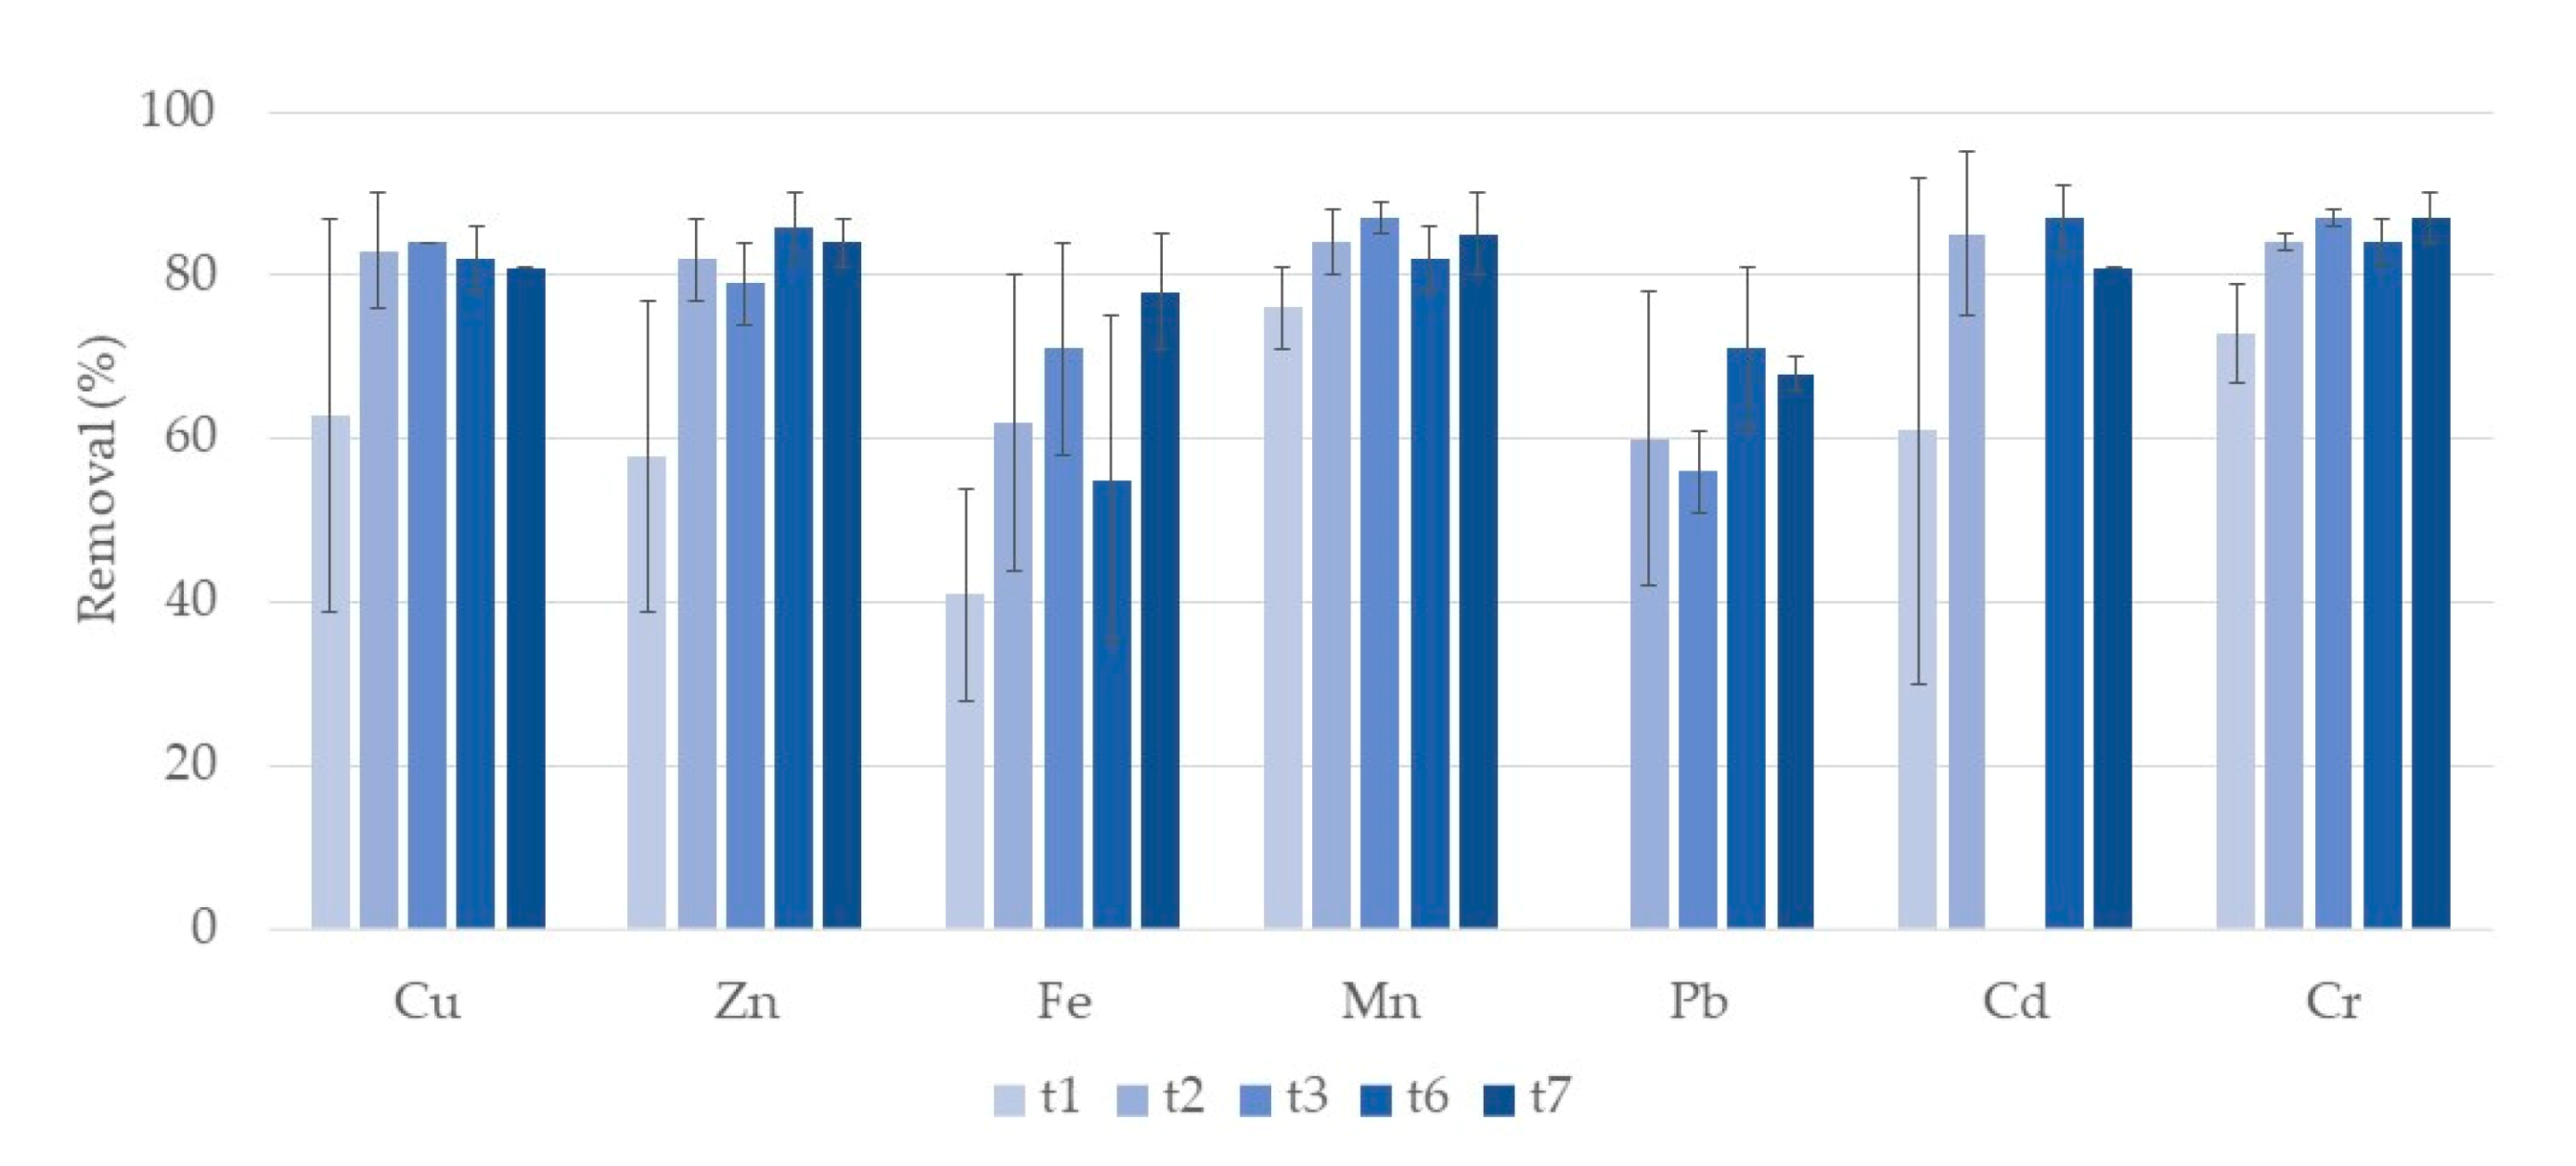
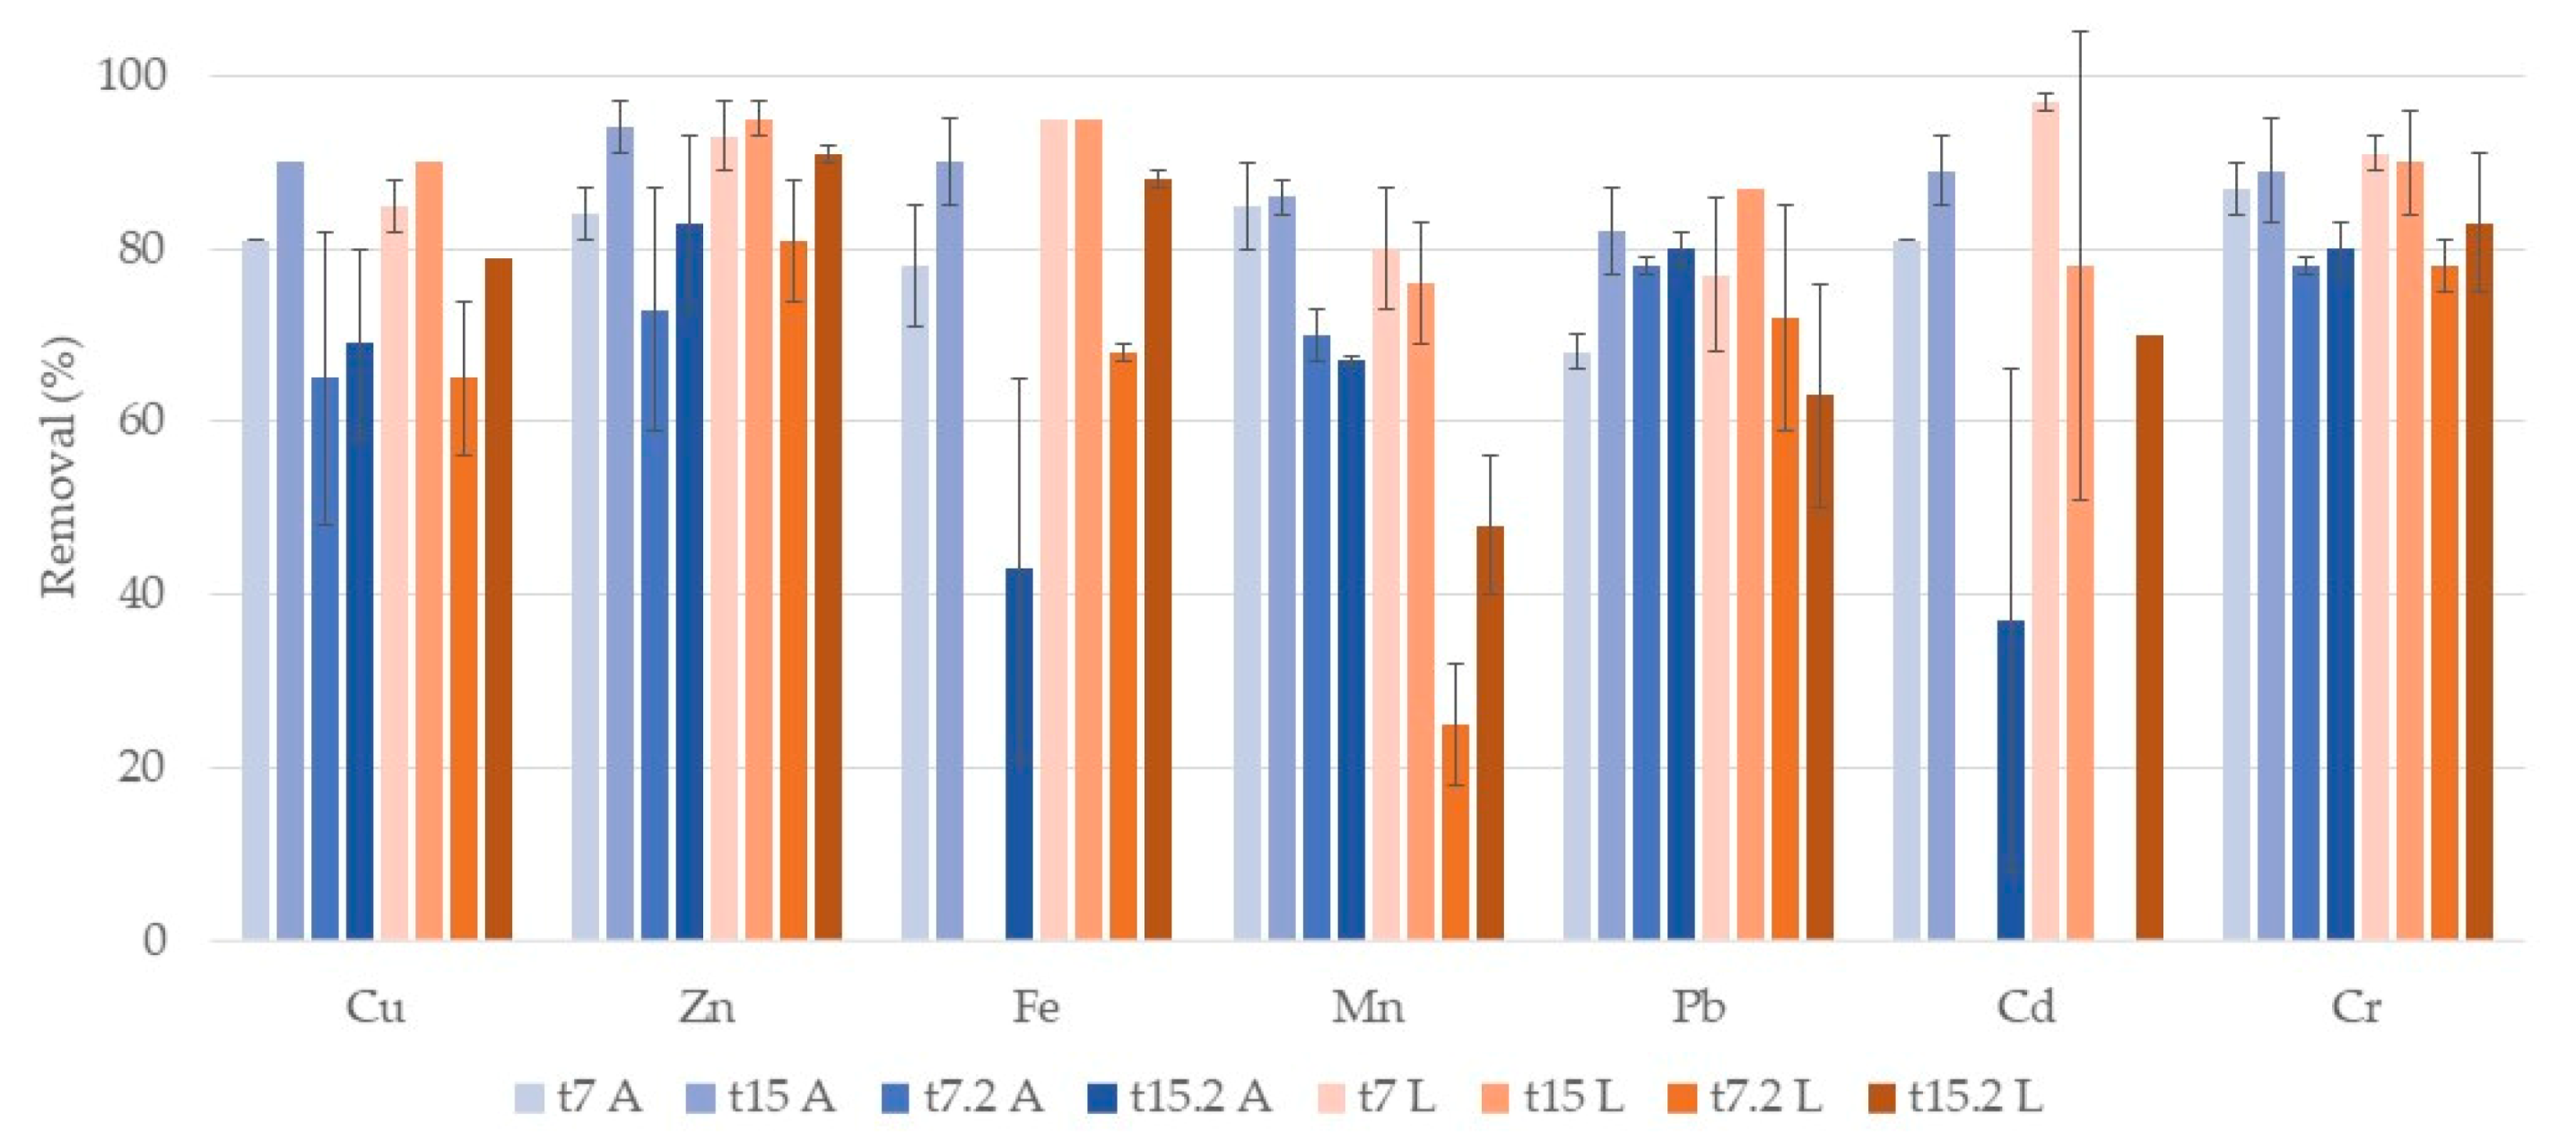
3.1. Metals
3.1.1. Water
Phragmites Australis
Typha Latifolia
3.1.2. Plant Tissues
3.1.3. Sand Substrate
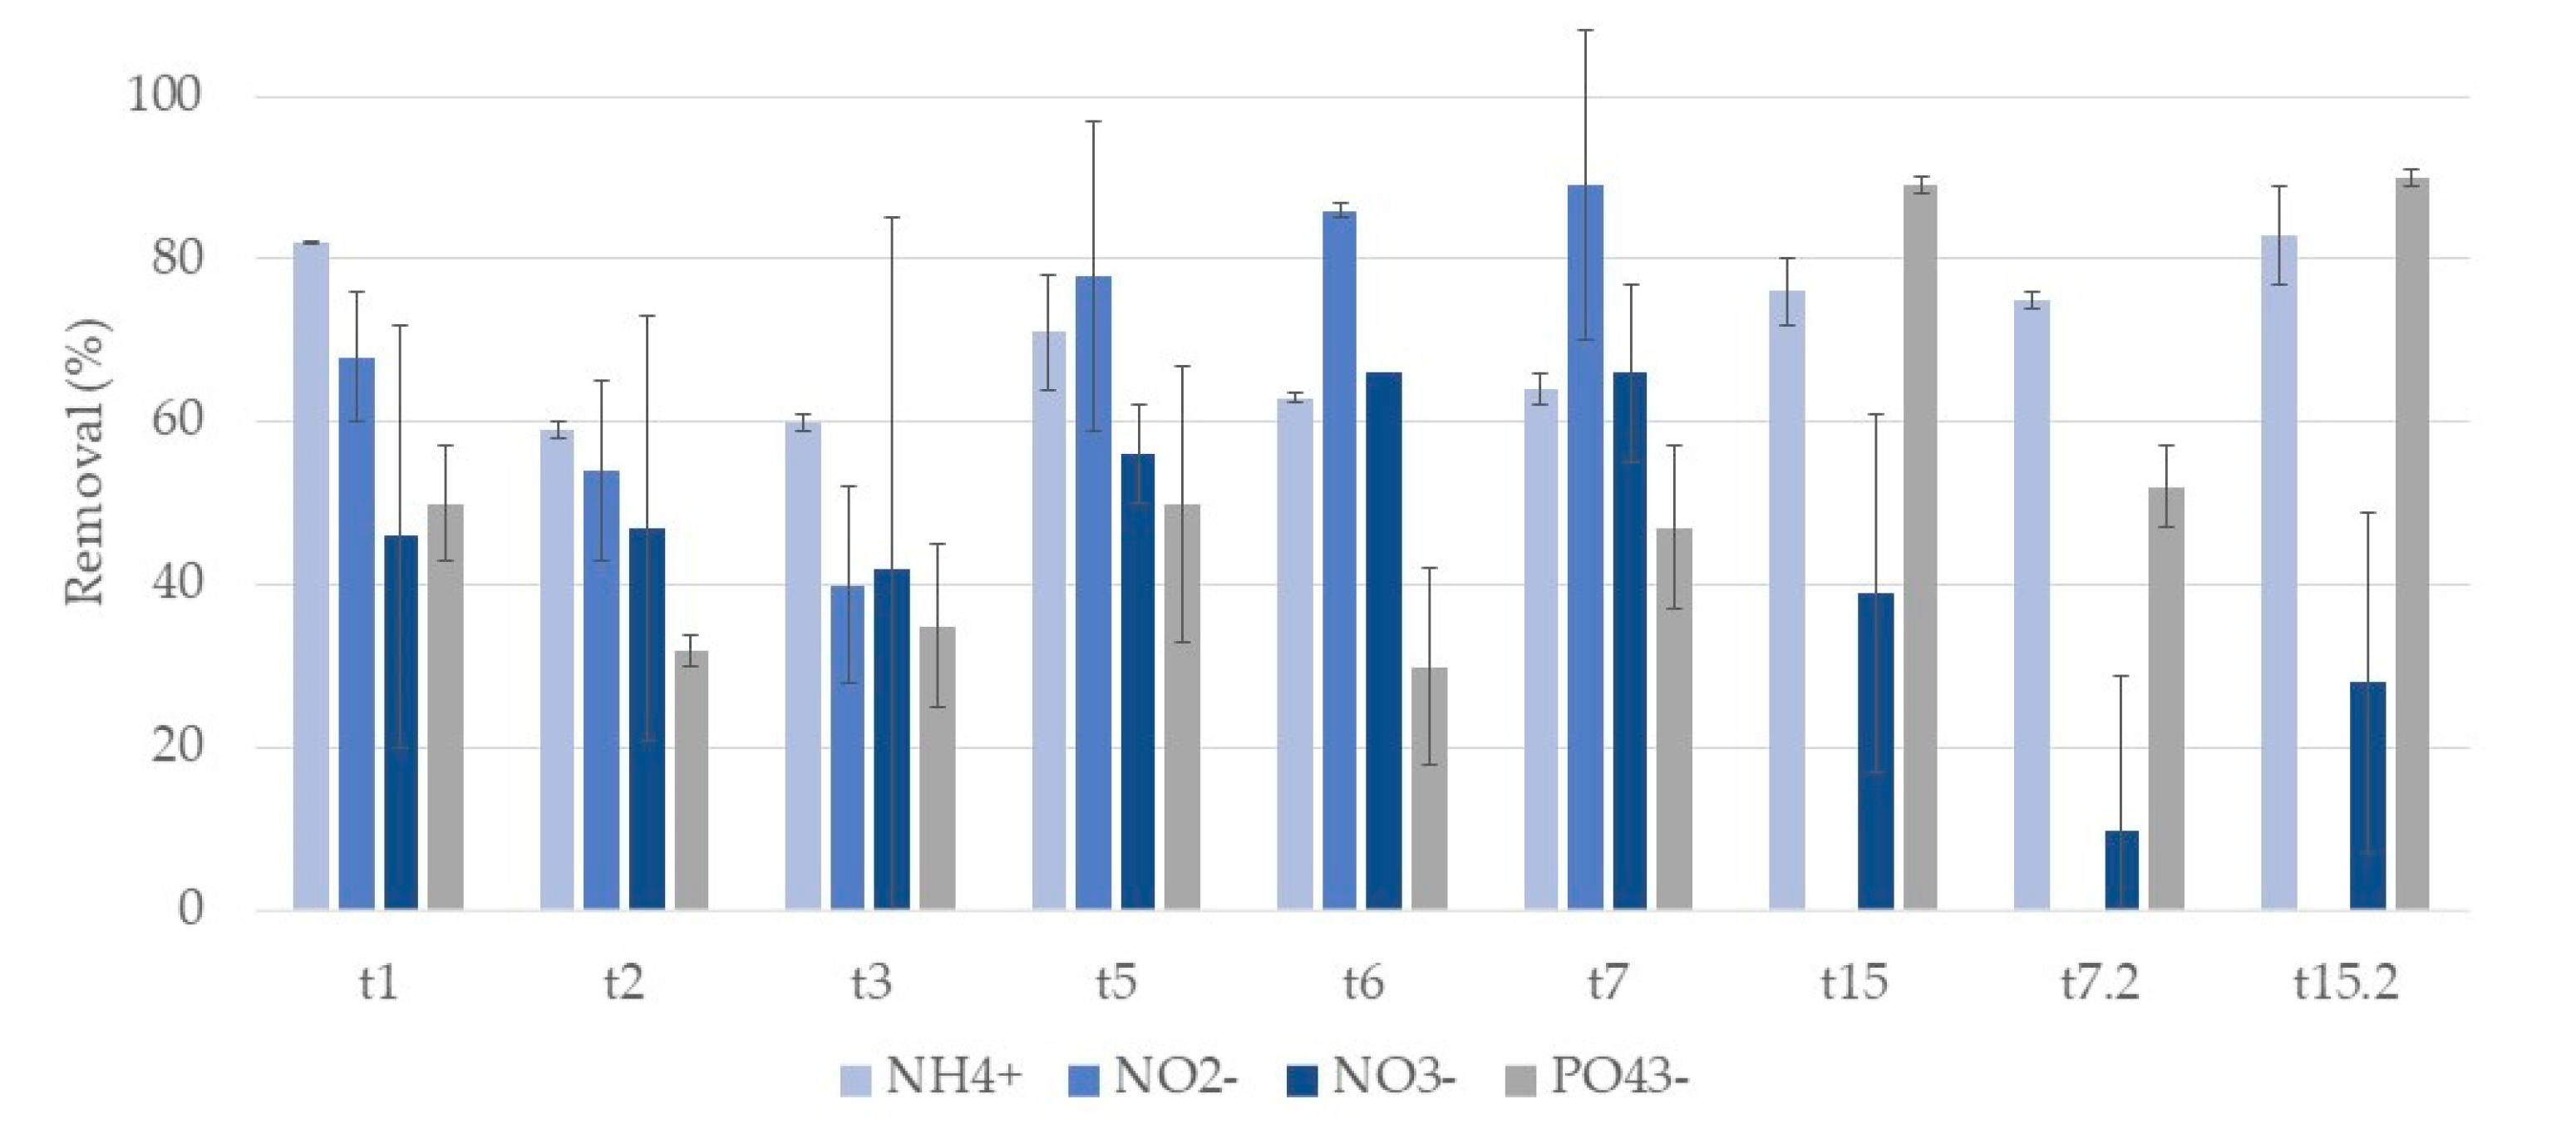
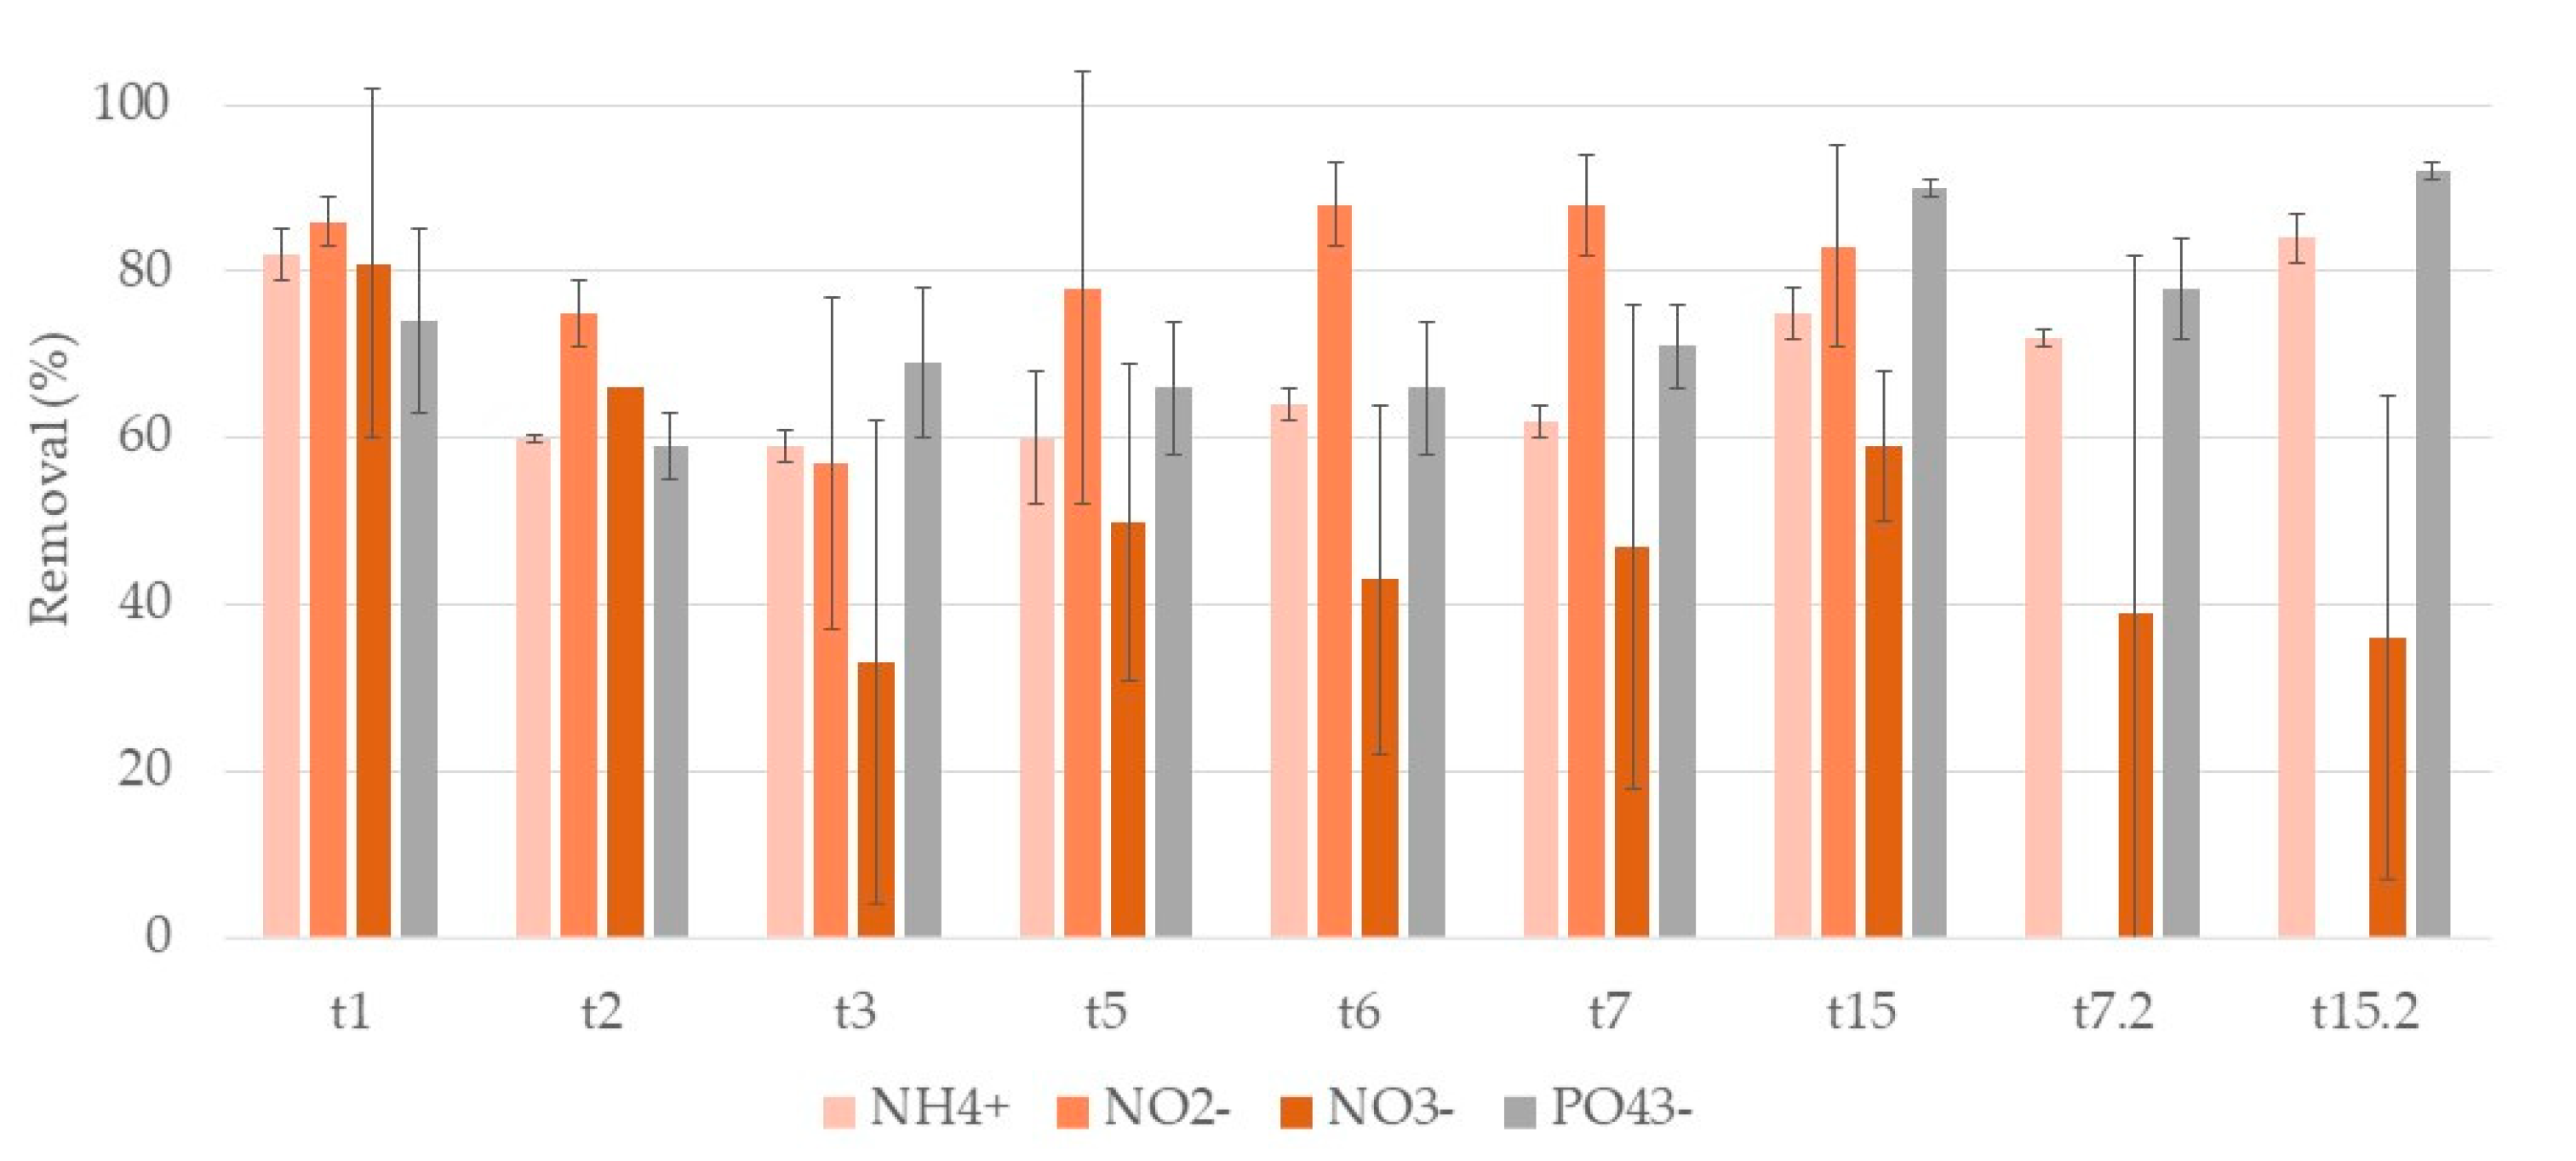
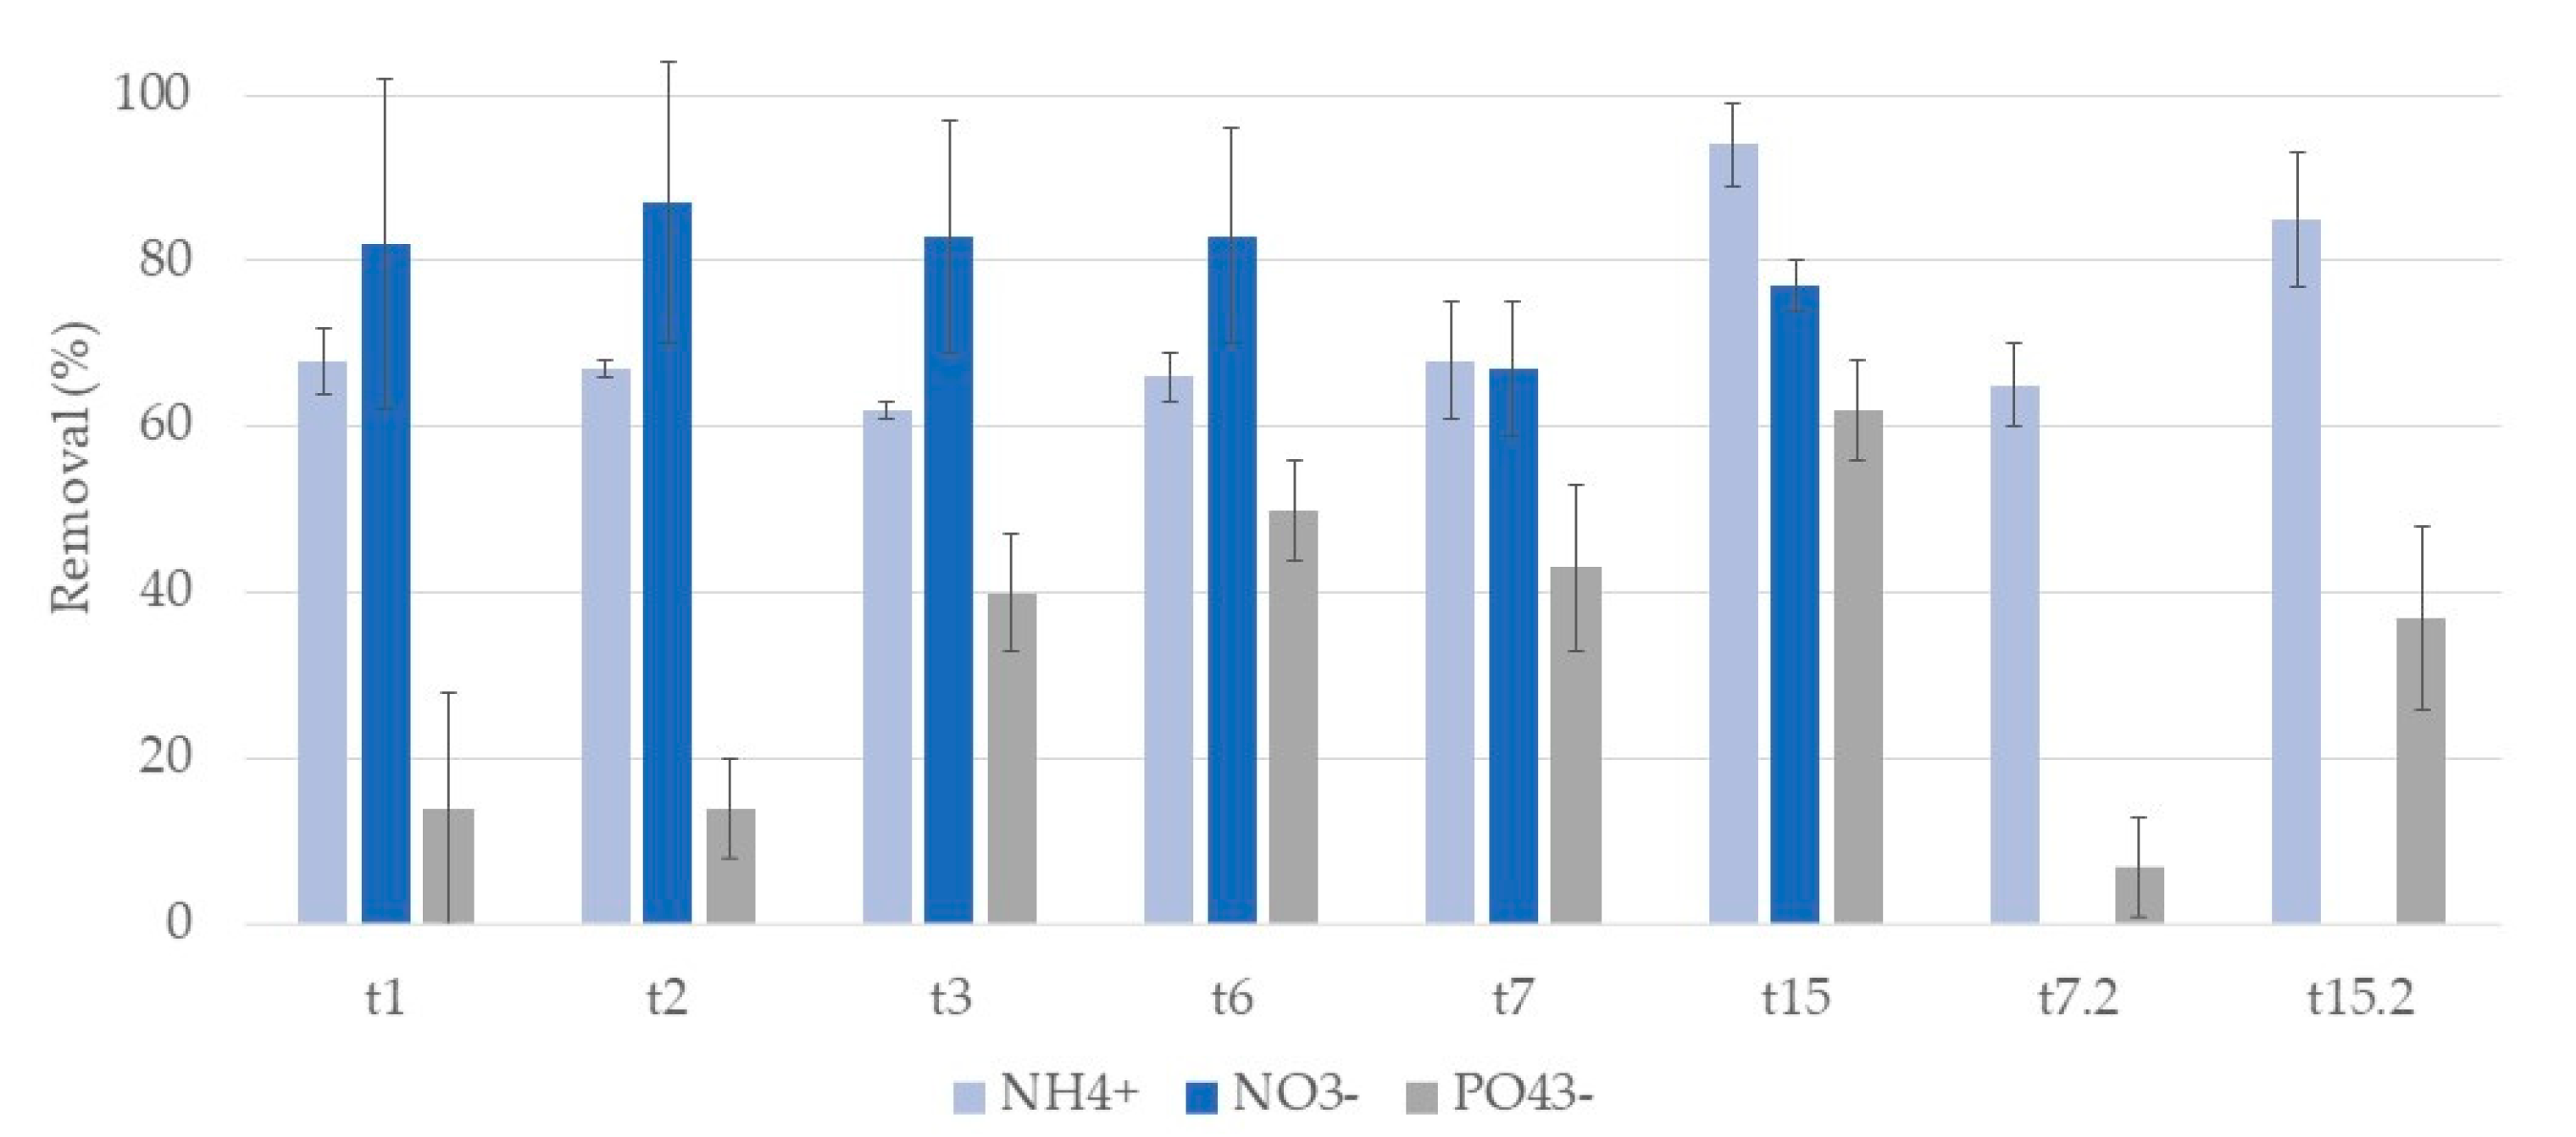
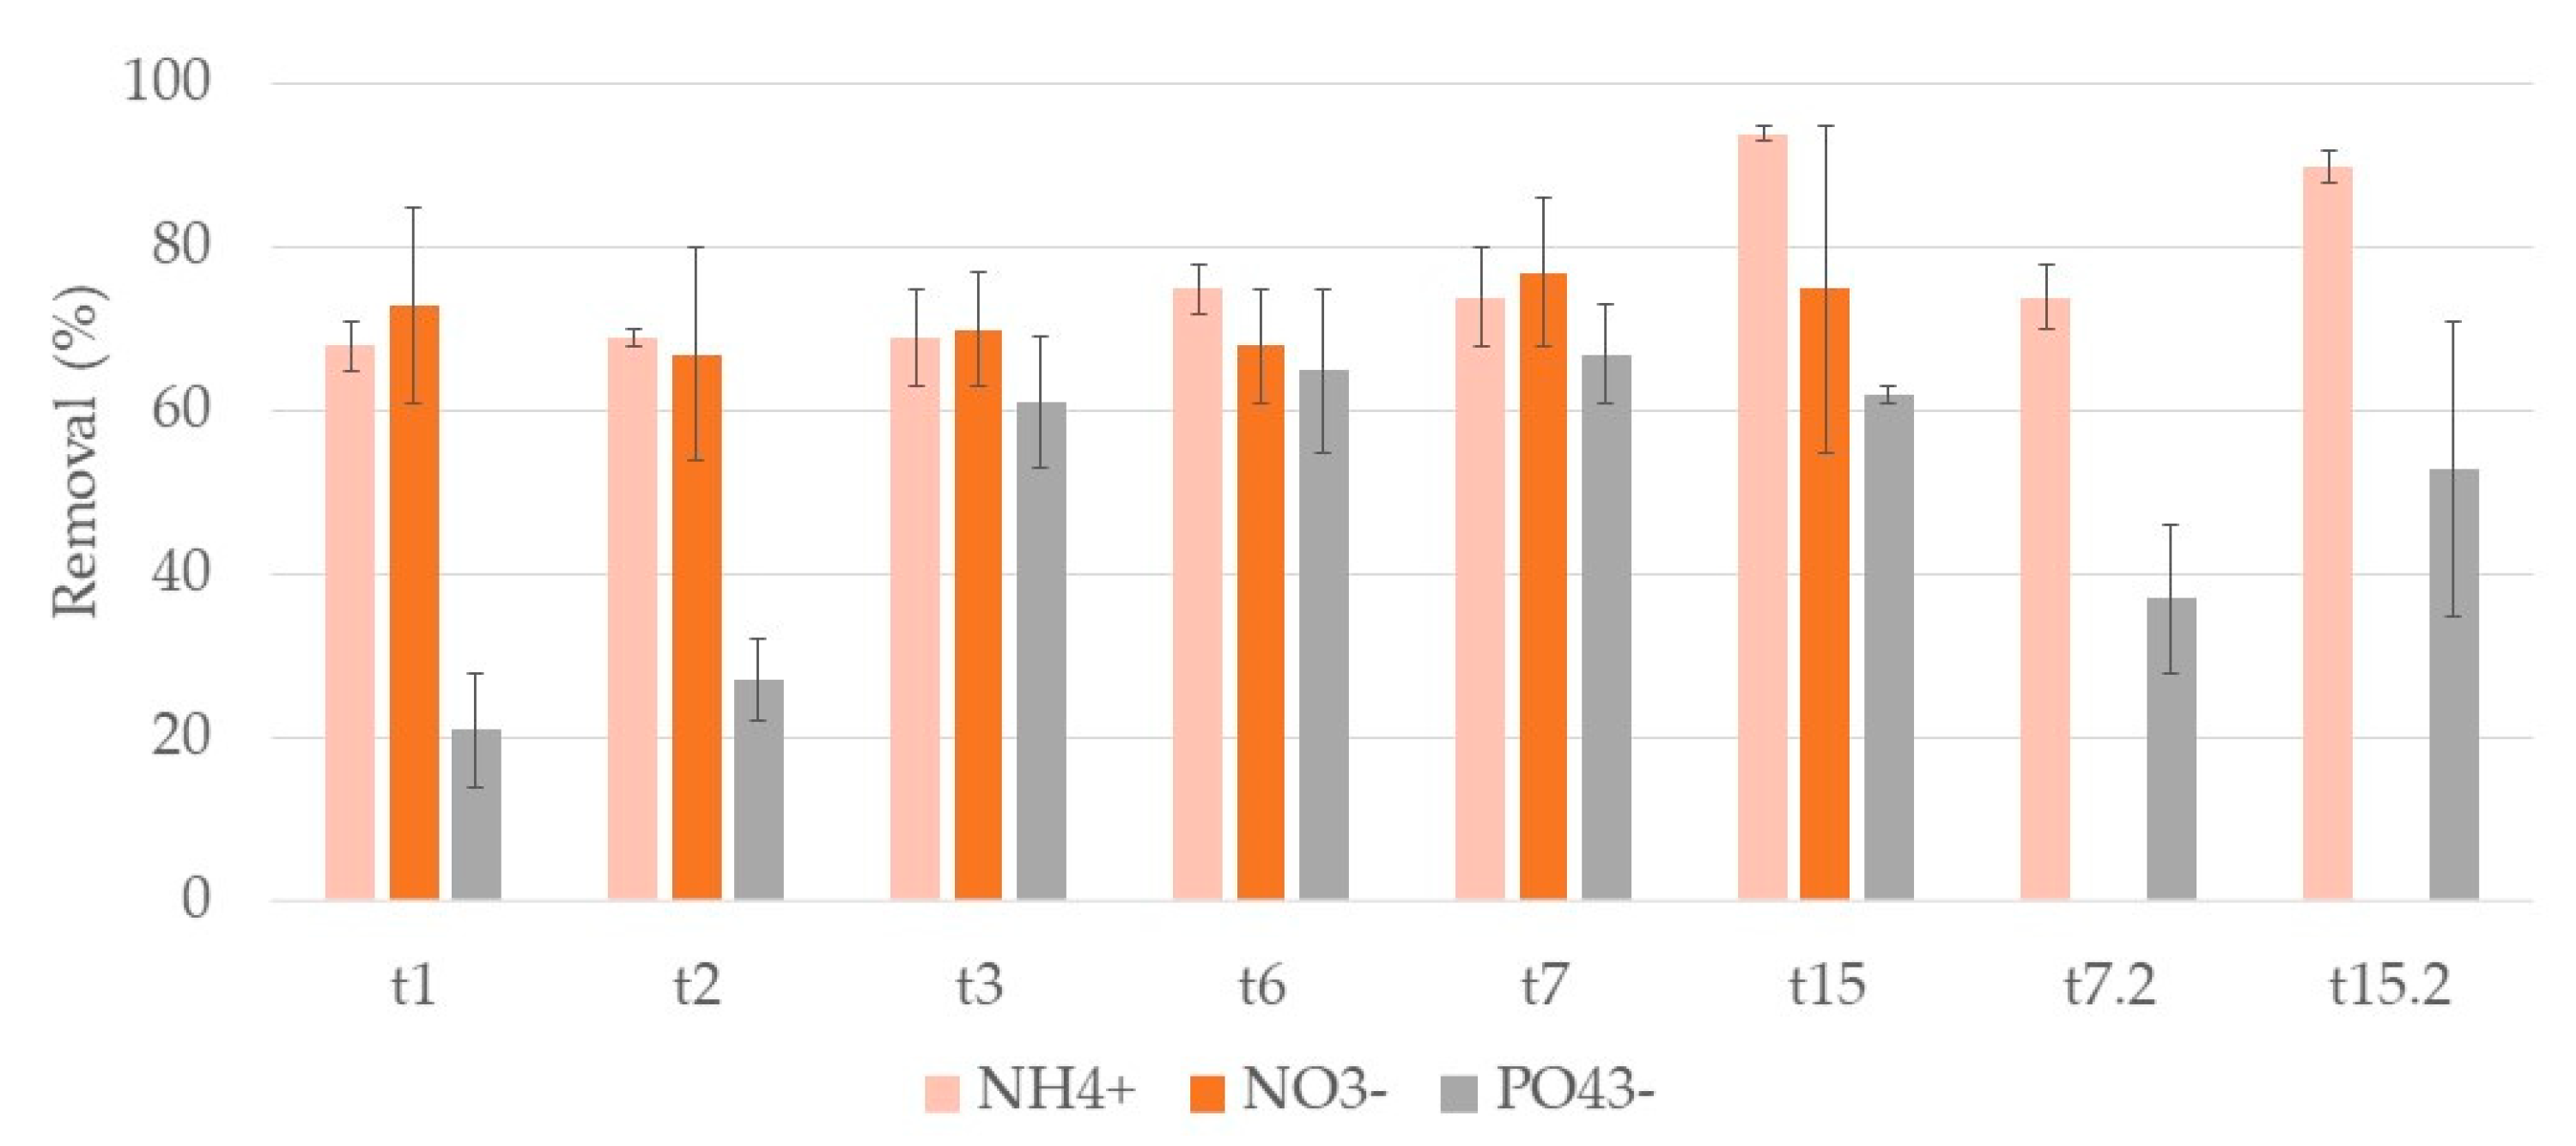
3.2. Nutrients
3.2.1. Phragmites Australis
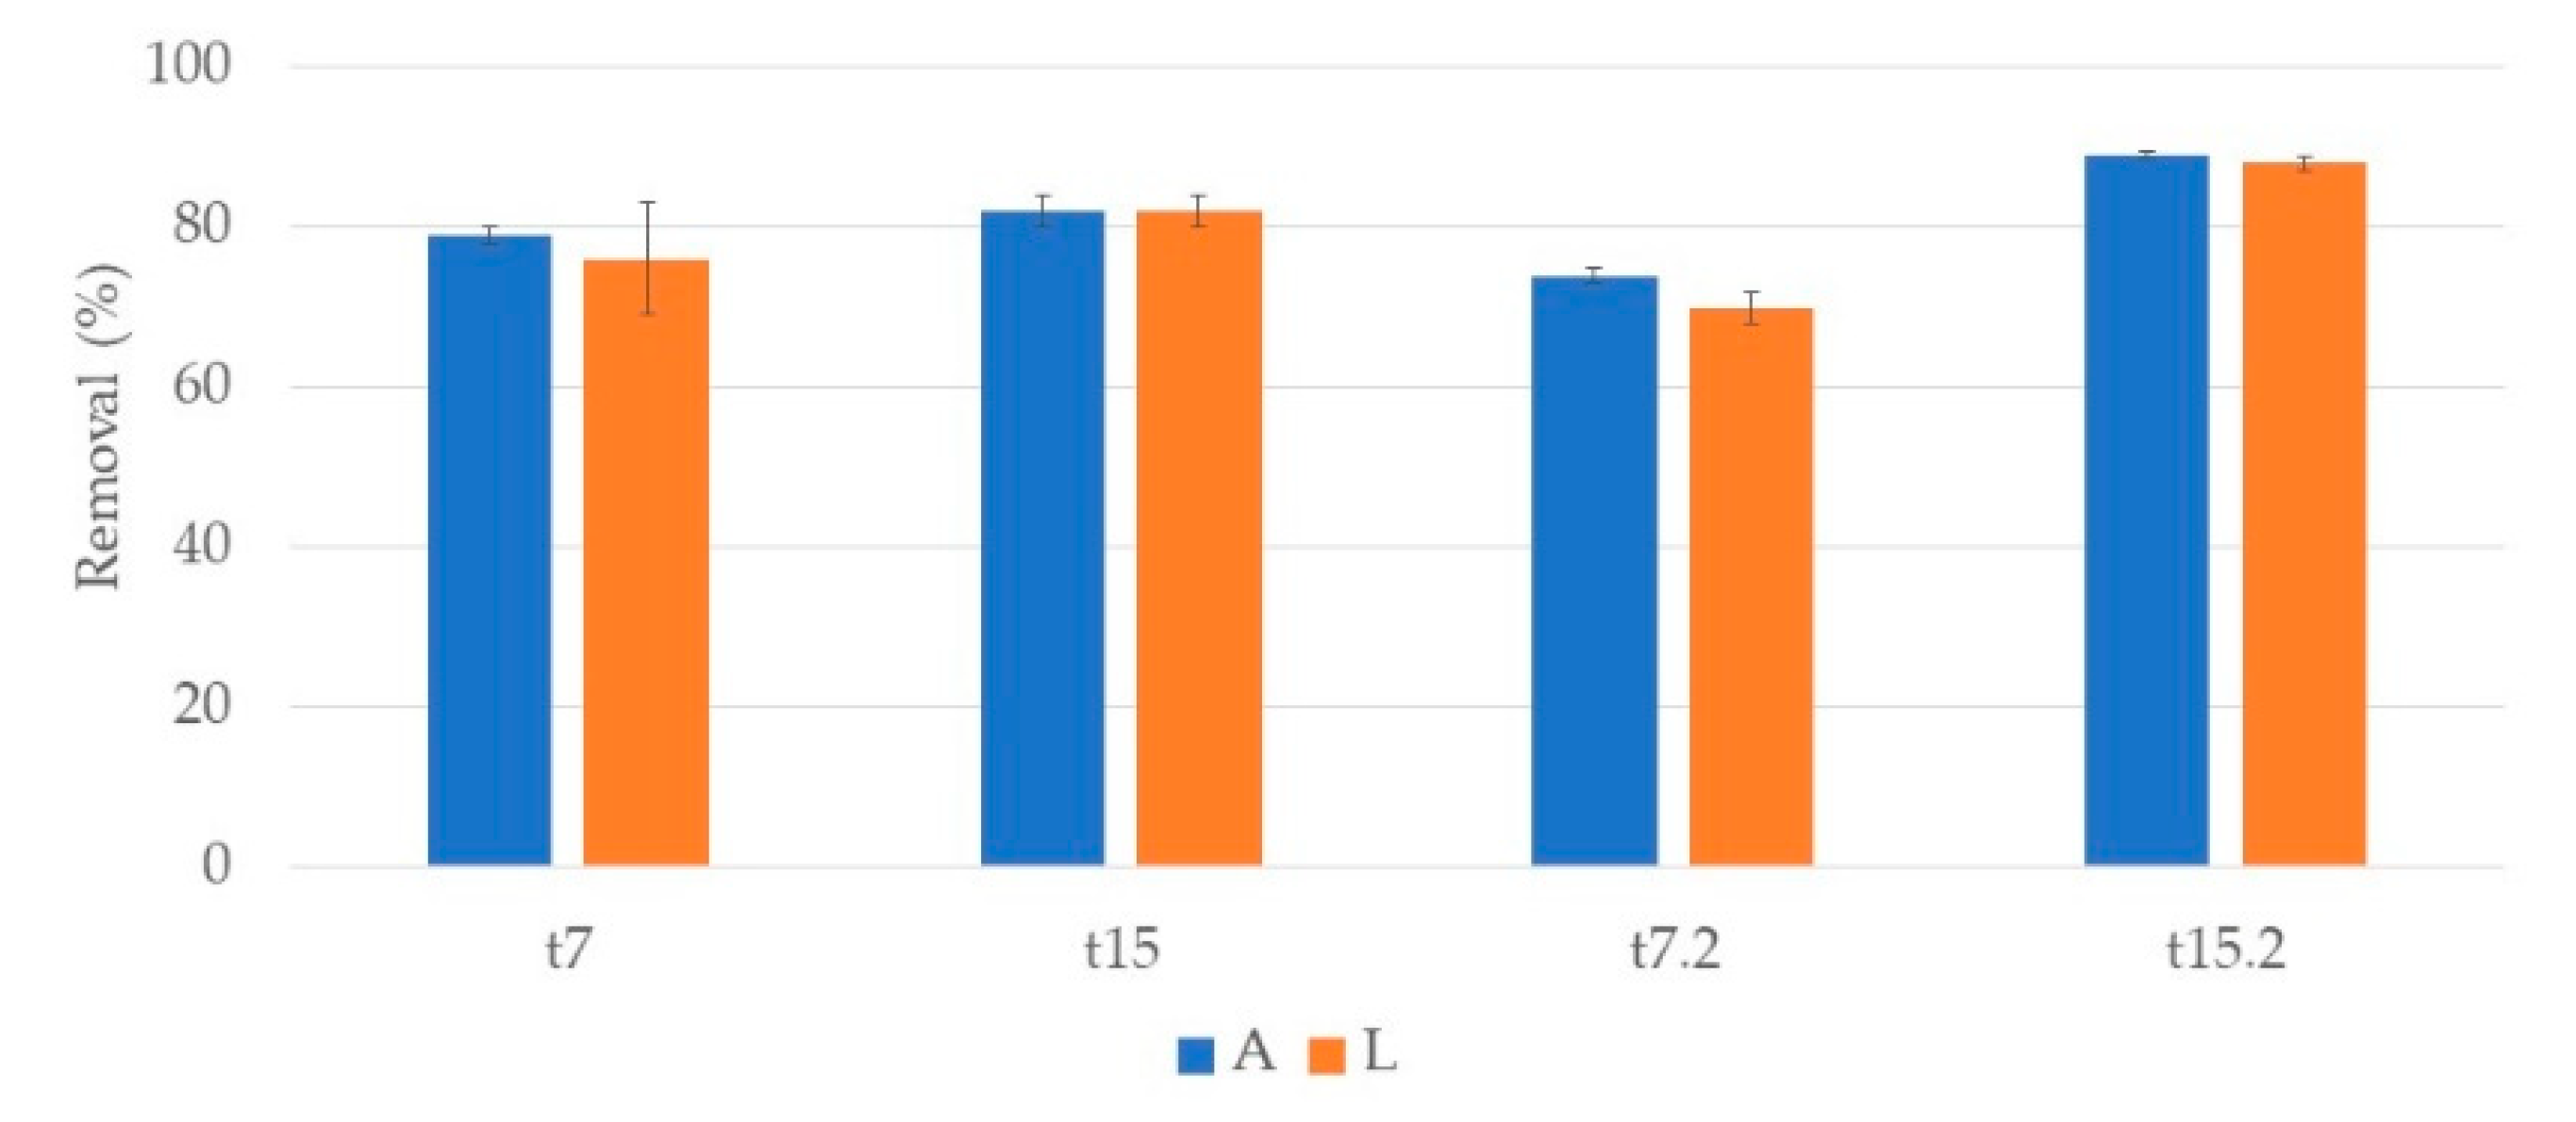
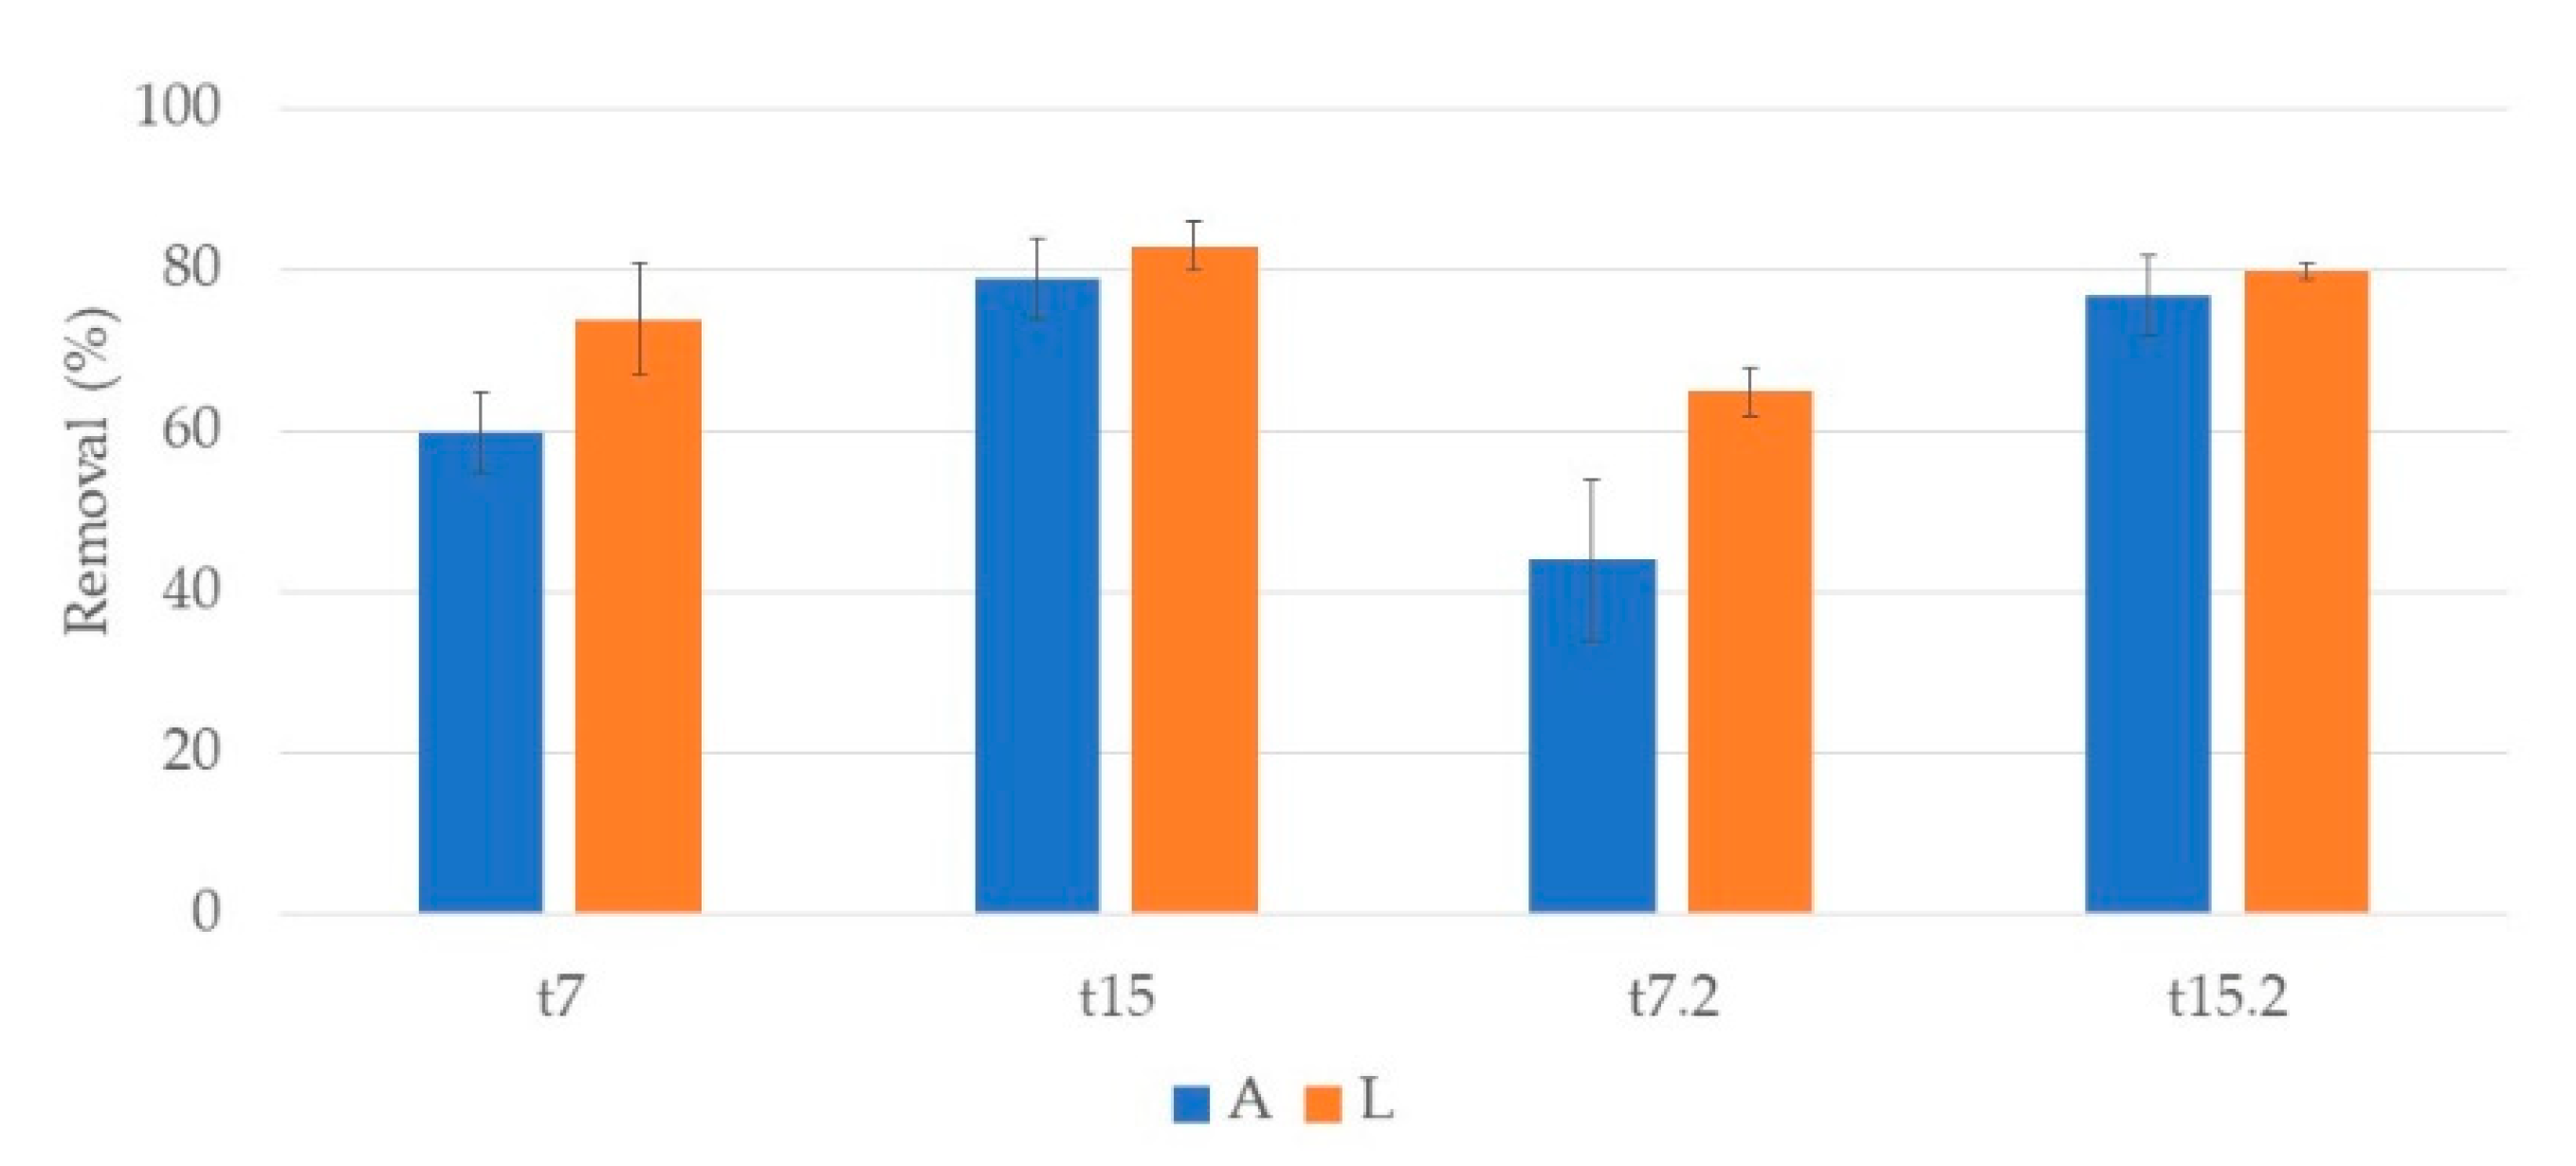
3.2.2. Typha Latifolia
3.3. Organic Matter
4. Discussion
5. Conclusions
Supplementary Materials
Author Contributions
Funding
Conflicts of Interest
References
- Shakir, E.; Zahraw, Z.; Al-Obaidy, A.H.M.J. Environmental and health risks associated with reuse of wastewater for irrigation. Egypt. J. Pet. 2017, 26, 95–102. [Google Scholar] [CrossRef]
- Sgroi, M.; Vagliasindi, F.G.A.; Roccaro, P. Feasibility, sustainability and circular economy concepts in water reuse. Curr. Opin. Environ. Sci. Heal. 2018, 2, 20–25. [Google Scholar] [CrossRef]
- Chen, W.; Lu, S.; Pan, N.; Wang, Y.; Wu, L. Impact of reclaimed water irrigation on soil health in urban green areas. Chemosphere 2015, 119, 654–661. [Google Scholar] [CrossRef] [PubMed]
- Forslund, A.; Ensink, J.H.J.; Battilani, A.; Kljujev, I.; Gola, S.; Raicevic, V.; Jovanovic, Z.; Stikic, R.; Sandei, L.; Fletcher, T.; et al. Faecal contamination and hygiene aspect associated with the use of treated wastewater and canal water for irrigation of potatoes (Solanum tuberosum). Agric. Water Manag. 2010, 98, 440–450. [Google Scholar] [CrossRef]
- Lopez, A.; Pollice, A.; Lonigro, A.; Masi, S.; Palese, A.M.; Cirelli, G.L.; Toscano, A.; Passino, R. Agricultural wastewater reuse in southern Italy. Desalination 2006, 187, 323–334. [Google Scholar] [CrossRef]
- Maiolo, M.; Pantusa, D. A proposal for multiple reuse of urban wastewater. J. Water Reuse Desalin. 2018, 8, 468–478. [Google Scholar] [CrossRef]
- Oron, G.; Gillerman, L.; Buriakovsky, N.; Bick, A.; Gargir, M.; Dolan, Y.; Manor, Y.; Katz, L.; Hagin, J. Membrane technology for advanced wastewater reclamation for sustainable agriculture production. Desalination 2008, 218, 170–180. [Google Scholar] [CrossRef]
- Almeida, C.M.R.; Santos, F.; Ferreira, A.C.F.; Lourinha, I.; Basto, M.C.P.; Mucha, A.P. Can veterinary antibiotics affect constructed wetlands performance during treatment of livestock wastewater? Ecol. Eng. 2017, 102, 583–588. [Google Scholar] [CrossRef]
- Hu, H.; Li, X.; Wu, S.; Yang, C. Sustainable livestock wastewater treatment via phytoremediation: Current status and future perspectives. Bioresour. Technol. 2020, 315, 123809. [Google Scholar] [CrossRef]
- Hejna, M.; Moscatelli, A.; Stroppa, N.; Onelli, E.; Pilu, S.; Baldi, A.; Rossi, L. Bioaccumulation of heavy metals from wastewater through a Typha latifolia and Thelypteris palustris phytoremediation system. Chemosphere 2020, 241, 125018. [Google Scholar] [CrossRef]
- van Alen, S.; Kaspar, U.; Idelevich, E.A.; Köck, R.; Becker, K. Increase of zinc resistance in German human derived livestock-associated MRSA between 2000 and 2014. Vet. Microbiol. 2018, 214, 7–12. [Google Scholar] [CrossRef] [PubMed]
- Ministerio da Economia. Decreto-Lei n.º 103/2015. In Diário da República n.º 114/2015; Ministério da Economia: Lisboa, Portugal, 2015; pp. 3756–3788. [Google Scholar]
- Ministerio do Ambiente. Decreto-Lei n.º 236/98. In Diário da República nº 176/1998; Ministério do Ambiente: Lisboa, Portugal, 1998; pp. 3676–3722. [Google Scholar]
- U.S. Environmental Protection Agency. Guidelines for Water Reuse; U.S. Agency for International Development: Washington, DC, USA, 2004.
- Norton-Brandão, D.; Scherrenberg, S.M.; van Lier, J.B. Reclamation of used urban waters for irrigation purposes—A review of treatment technologies. J. Environ. Manag. 2013, 122, 85–98. [Google Scholar] [CrossRef] [PubMed]
- Dias, S.; Correia, B.; Fraga-Santiago, P.; Silva, C.; Baptista, P.C.; Gomes, C.R.; Almeida, C.M.R. Potential of an estuarine salt marsh plant (Phragmites australis (Cav.) Trin. Ex Steud10751) for phytoremediation of bezafibrate and paroxetine. Hydrobiologia 2020, 1–14. [Google Scholar] [CrossRef]
- Liang, Y.; Zhu, H.; Bañuelos, G.; Yan, B.; Zhou, Q.; Yu, X.; Cheng, X. Constructed wetlands for saline wastewater treatment: A review. Ecol. Eng. 2017, 98, 275–285. [Google Scholar] [CrossRef]
- Gorito, A.M.; Ribeiro, A.R.; Almeida, C.M.R.; Silva, A.M.T. A review on the application of constructed wetlands for the removal of priority substances and contaminants of emerging concern listed in recently launched EU legislation. Environ. Pollut. 2017, 227, 428–443. [Google Scholar] [CrossRef] [PubMed]
- Wang, M.; Zhang, D.; Dong, J.; Tan, S.K. Application of constructed wetlands for treating agricultural runoff and agro-industrial wastewater: A review. Hydrobiologia 2017, 805, 1–31. [Google Scholar] [CrossRef]
- A, D.; Zhang, X.; Dai, Y.; Chen, C.; Yang, Y. Occurrence and removal of quinolone, tetracycline, and macrolide antibiotics from urban wastewater in constructed wetlands. J. Clean. Prod. 2020, 252, 119677. [Google Scholar] [CrossRef]
- Santos, F.; Almeida, C.M.R.; Ribeiro, I.; Mucha, A.P. Potential of constructed wetland for the removal of antibiotics and antibiotic resistant bacteria from livestock wastewater. Ecol. Eng. 2019, 129, 45–53. [Google Scholar] [CrossRef]
- Reddy, G.B.; Hunt, P.G.; Phillips, R.; Stone, K.; Grubbs, A. Treatment of swine wastewater in marsh-pond-marsh constructed wetlands. Water Sci. Technol. 2001, 44, 545–550. [Google Scholar] [CrossRef]
- Lee, C.Y.; Lee, C.C.; Lee, F.Y.; Tseng, S.K.; Liao, C.J. Performance of subsurface flow constructed wetland taking pretreated swine effluent under heavy loads. Bioresour. Technol. 2004, 92, 173–179. [Google Scholar] [CrossRef]
- Meers, E.; Rousseau, D.P.L.; Blomme, N.; Lesage, E.; Du Laing, G.; Tack, F.M.G.; Verloo, M.G. Tertiary treatment of the liquid fraction of pig manure with Phragmites australis. Water Air Soil Pollut. 2005, 160, 15–26. [Google Scholar] [CrossRef]
- Meers, E.; Tack, F.M.G.; Tolpe, I.; Michels, E. Application of a full-scale constructed wetland for tertiary treatment of piggery manure: Monitoring results. Water Air Soil Pollut. 2008, 193, 15–24. [Google Scholar] [CrossRef]
- Anning, A.K.; Korsah, P.E.; Addo-Fordjour, P. Phytoremediation of Wastewater with Limnocharis Flava, Thalia Geniculata and Typha Latifolia in Constructed Wetlands. Int. J. Phytoremediation 2013, 15, 452–464. [Google Scholar] [CrossRef] [PubMed]
- Almeida, C.M.R.; Santos, F.; Ferreira, A.C.F.; Gomes, C.R.; Basto, M.C.P.; Mucha, A.P. Constructed wetlands for the removal of metals from livestock wastewater—Can the presence of veterinary antibiotics affect removals? Ecotoxicol. Environ. Saf. 2017, 137, 143–148. [Google Scholar] [CrossRef]
- Ibekwe, A.; Murinda, S. Continuous Flow-Constructed Wetlands for the Treatment of Swine Waste Water. Int. J. Environ. Res. Public Health 2018, 15, 1369. [Google Scholar] [CrossRef] [PubMed]
- Gorito, A.M.; Ribeiro, A.R.; Gomes, C.R.; Almeida, C.M.R.; Silva, A.M.T. Constructed wetland microcosms for the removal of organic micropollutants from freshwater aquaculture effluents. Sci. Total Environ. 2018, 644, 1171–1180. [Google Scholar] [CrossRef] [PubMed]
- Batool, A.; Saleh, T.A. Removal of toxic metals from wastewater in constructed wetlands as a green technology; catalyst role of substrates and chelators. Ecotoxicol. Environ. Saf. 2020, 189, 109924. [Google Scholar] [CrossRef]
- Mucha, A.P.; Teixeira, C.; Reis, I.; Magalhães, C.; Bordalo, A.A.; Almeida, C.M.R. Response of a salt marsh microbial community to metal contamination. Estuar. Coast. Shelf Sci. 2013, 130, 81–88. [Google Scholar] [CrossRef]
- Anning, A.K.; Akoto, R. Assisted phytoremediation of heavy metal contaminated soil from a mined site with Typha latifolia and Chrysopogon zizanioides. Ecotoxicol. Environ. Saf. 2018, 148, 97–104. [Google Scholar] [CrossRef]
- Rana, V.; Maiti, S.K. Municipal wastewater treatment potential and metal accumulation strategies of Colocasia esculenta (L.) Schott and Typha latifolia L. in a constructed wetland. Environ. Monit. Assess. 2018, 190, 1–15. [Google Scholar] [CrossRef]
- Dordio, A.; Carvalho, A.J.P. Constructed wetlands with light expanded clay aggregates for agricultural wastewater treatment. Sci. Total. Environ. 2013, 463, 454–461. [Google Scholar] [CrossRef] [PubMed]
- Calheiros, C.S.C.; Rangel, A.O.S.S.; Castro, P.M.L. Evaluation of different substrates to support the growth of Typha latifolia in constructed wetlands treating tannery wastewater over long-term operation. Bioresour. Technol. 2008, 99, 6866–6877. [Google Scholar] [CrossRef] [PubMed]
- Collison, R.S.; Grismer, M.E. Nitrogen and Chemical Oxygen Demand Removal from Septic Tank Wastewater in Subsurface Flow Constructed Wetlands: Substrate (Cation Exchange Capacity) Effects. Water Environ. Res. 2013, 86, 314–323. [Google Scholar] [CrossRef]
- Carvalho, P.N.; Basto, M.C.P.; Almeida, C.M.R. Potential of Phragmites australis for the removal of veterinary pharmaceuticals from aquatic media. Bioresour. Technol. 2012, 116, 497–501. [Google Scholar] [CrossRef]
- Jones, M.N. Nitrate reduction by shaking with cadmium: Alternative to cadmium columns. Water Res. 1984, 18, 643–646. [Google Scholar] [CrossRef]
- Villamar, C.-A.; Vera-Puerto, I.; Rivera, D.; De la Hoz, F. Reuse and Recycling of Livestock and Municipal Wastewater in Chilean Agriculture: A Preliminary Assessment. Water 2018, 10, 817. [Google Scholar] [CrossRef]
- Yadav, A.K.; Abbassi, R.; Kumar, N.; Satya, S.; Sreekrishnan, T.R.; Mishra, B.K. The removal of heavy metals in wetland microcosms: Effects of bed depth, plant species, and metal mobility. Chem. Eng. J. 2012, 211, 501–507. [Google Scholar] [CrossRef]
- Bhatia, M.; Goyal, D. Analyzing remediation potential of wastewater through wetland plants: A review. Environ. Prog. Sustain. Energy 2014, 33, 9–27. [Google Scholar] [CrossRef]
- Sandoval-Herazo, L.; Alvarado-Lassman, A.; Marín-Muñiz, J.; Méndez-Contreras, J.; Zamora-Castro, S.A. Effects of the Use of Ornamental Plants and Different Substrates in the Removal of Wastewater Pollutants through Microcosms of Constructed Wetlands. Sustainability 2018, 10, 1594. [Google Scholar] [CrossRef]
- Almeida, C.M.R.; Mucha, A.P.; Teresa Vasconcelos, M. Role of different salt marsh plants on metal retention in an urban estuary (Lima estuary, NW Portugal). Estuar. Coast. Shelf Sci. 2011, 91, 243–249. [Google Scholar] [CrossRef]
- Kumari, M.; Tripathi, B.D. Efficiency of Phragmites australis and Typha latifolia for heavy metal removal from wastewater. Ecotoxicol. Environ. Saf. 2015, 112, 80–86. [Google Scholar] [CrossRef] [PubMed]
- Bonanno, G. Comparative performance of trace element bioaccumulation and biomonitoring in the plant species Typha domingensis, Phragmites australis and Arundo donax. Ecotoxicol. Environ. Saf. 2013, 97, 124–130. [Google Scholar] [CrossRef] [PubMed]
- Bonanno, G.; Cirelli, G.L. Comparative analysis of element concentrations and translocation in three wetland congener plants: Typha domingensis, Typha latifolia and Typha angustifolia. Ecotoxicol. Environ. Saf. 2017, 143, 92–101. [Google Scholar] [CrossRef] [PubMed]
- Ghosh, D.; Gopal, B. Effect of hydraulic retention time on the treatment of secondary effluent in a subsurface flow constructed wetland. Ecol. Eng. 2010, 36, 1044–1051. [Google Scholar] [CrossRef]
- Stottmeister, U.; Wießner, A.; Kuschk, P.; Kappelmeyer, U.; Kästner, M.; Bederski, O.; Müller, R.A.; Moormann, H. Effects of plants and microorganisms in constructed wetlands for wastewater treatment. Biotechnol. Adv. 2003, 22, 93–117. [Google Scholar] [CrossRef]
- Saeed, T.; Sun, G. A review on nitrogen and organics removal mechanisms in subsurface flow constructed wetlands: Dependency on environmental parameters, operating conditions and supporting media. J. Environ. Manag. 2012, 112, 429–448. [Google Scholar] [CrossRef]
- Adhikari, A.; Acharya, K.; Shanahan, S.; Zhou, X. Removal of nutrients and metals by constructed and naturally created wetlands in the Las Vegas Valley, Nevada. Environ. Monit. Assess. 2011, 180, 97–113. [Google Scholar] [CrossRef]
- Vymazal, J.; Březinová, T. Heavy metals in plants in constructed and natural wetlands: Concentration, accumulation and seasonality. Water Sci. Technol. 2015, 71, 268–276. [Google Scholar] [CrossRef]
- Vymazal, J.A.N. Removal of Heavy Metals in a Horizontal Sub-Surface Flow Constructed Wetland. J. Environ. Sci. Health 2005, 40, 1369–1379. [Google Scholar] [CrossRef]
- Dordio, A.V.; Teimão, J.; Ramalho, I.; Carvalho, A.J.P.; Candeias, A. Selection of a support matrix for the removal of some phenoxyacetic compounds in constructed wetlands systems. Sci. Total. Environ. 2007, 380, 237–246. [Google Scholar] [CrossRef]


Publisher’s Note: MDPI stays neutral with regard to jurisdictional claims in published maps and institutional affiliations. |
© 2020 by the authors. Licensee MDPI, Basel, Switzerland. This article is an open access article distributed under the terms and conditions of the Creative Commons Attribution (CC BY) license (http://creativecommons.org/licenses/by/4.0/).
Share and Cite
Dias, S.; Mucha, A.P.; Duarte Crespo, R.; Rodrigues, P.; Almeida, C.M.R. Livestock Wastewater Treatment in Constructed Wetlands for Agriculture Reuse. Int. J. Environ. Res. Public Health 2020, 17, 8592. https://doi.org/10.3390/ijerph17228592
Dias S, Mucha AP, Duarte Crespo R, Rodrigues P, Almeida CMR. Livestock Wastewater Treatment in Constructed Wetlands for Agriculture Reuse. International Journal of Environmental Research and Public Health. 2020; 17(22):8592. https://doi.org/10.3390/ijerph17228592
Chicago/Turabian StyleDias, Sofia, Ana P. Mucha, Rute Duarte Crespo, Pedro Rodrigues, and C. Marisa R. Almeida. 2020. "Livestock Wastewater Treatment in Constructed Wetlands for Agriculture Reuse" International Journal of Environmental Research and Public Health 17, no. 22: 8592. https://doi.org/10.3390/ijerph17228592
APA StyleDias, S., Mucha, A. P., Duarte Crespo, R., Rodrigues, P., & Almeida, C. M. R. (2020). Livestock Wastewater Treatment in Constructed Wetlands for Agriculture Reuse. International Journal of Environmental Research and Public Health, 17(22), 8592. https://doi.org/10.3390/ijerph17228592