Facilitating the Development of Deep Learning Models with Visual Analytics for Electronic Health Records


Abstract
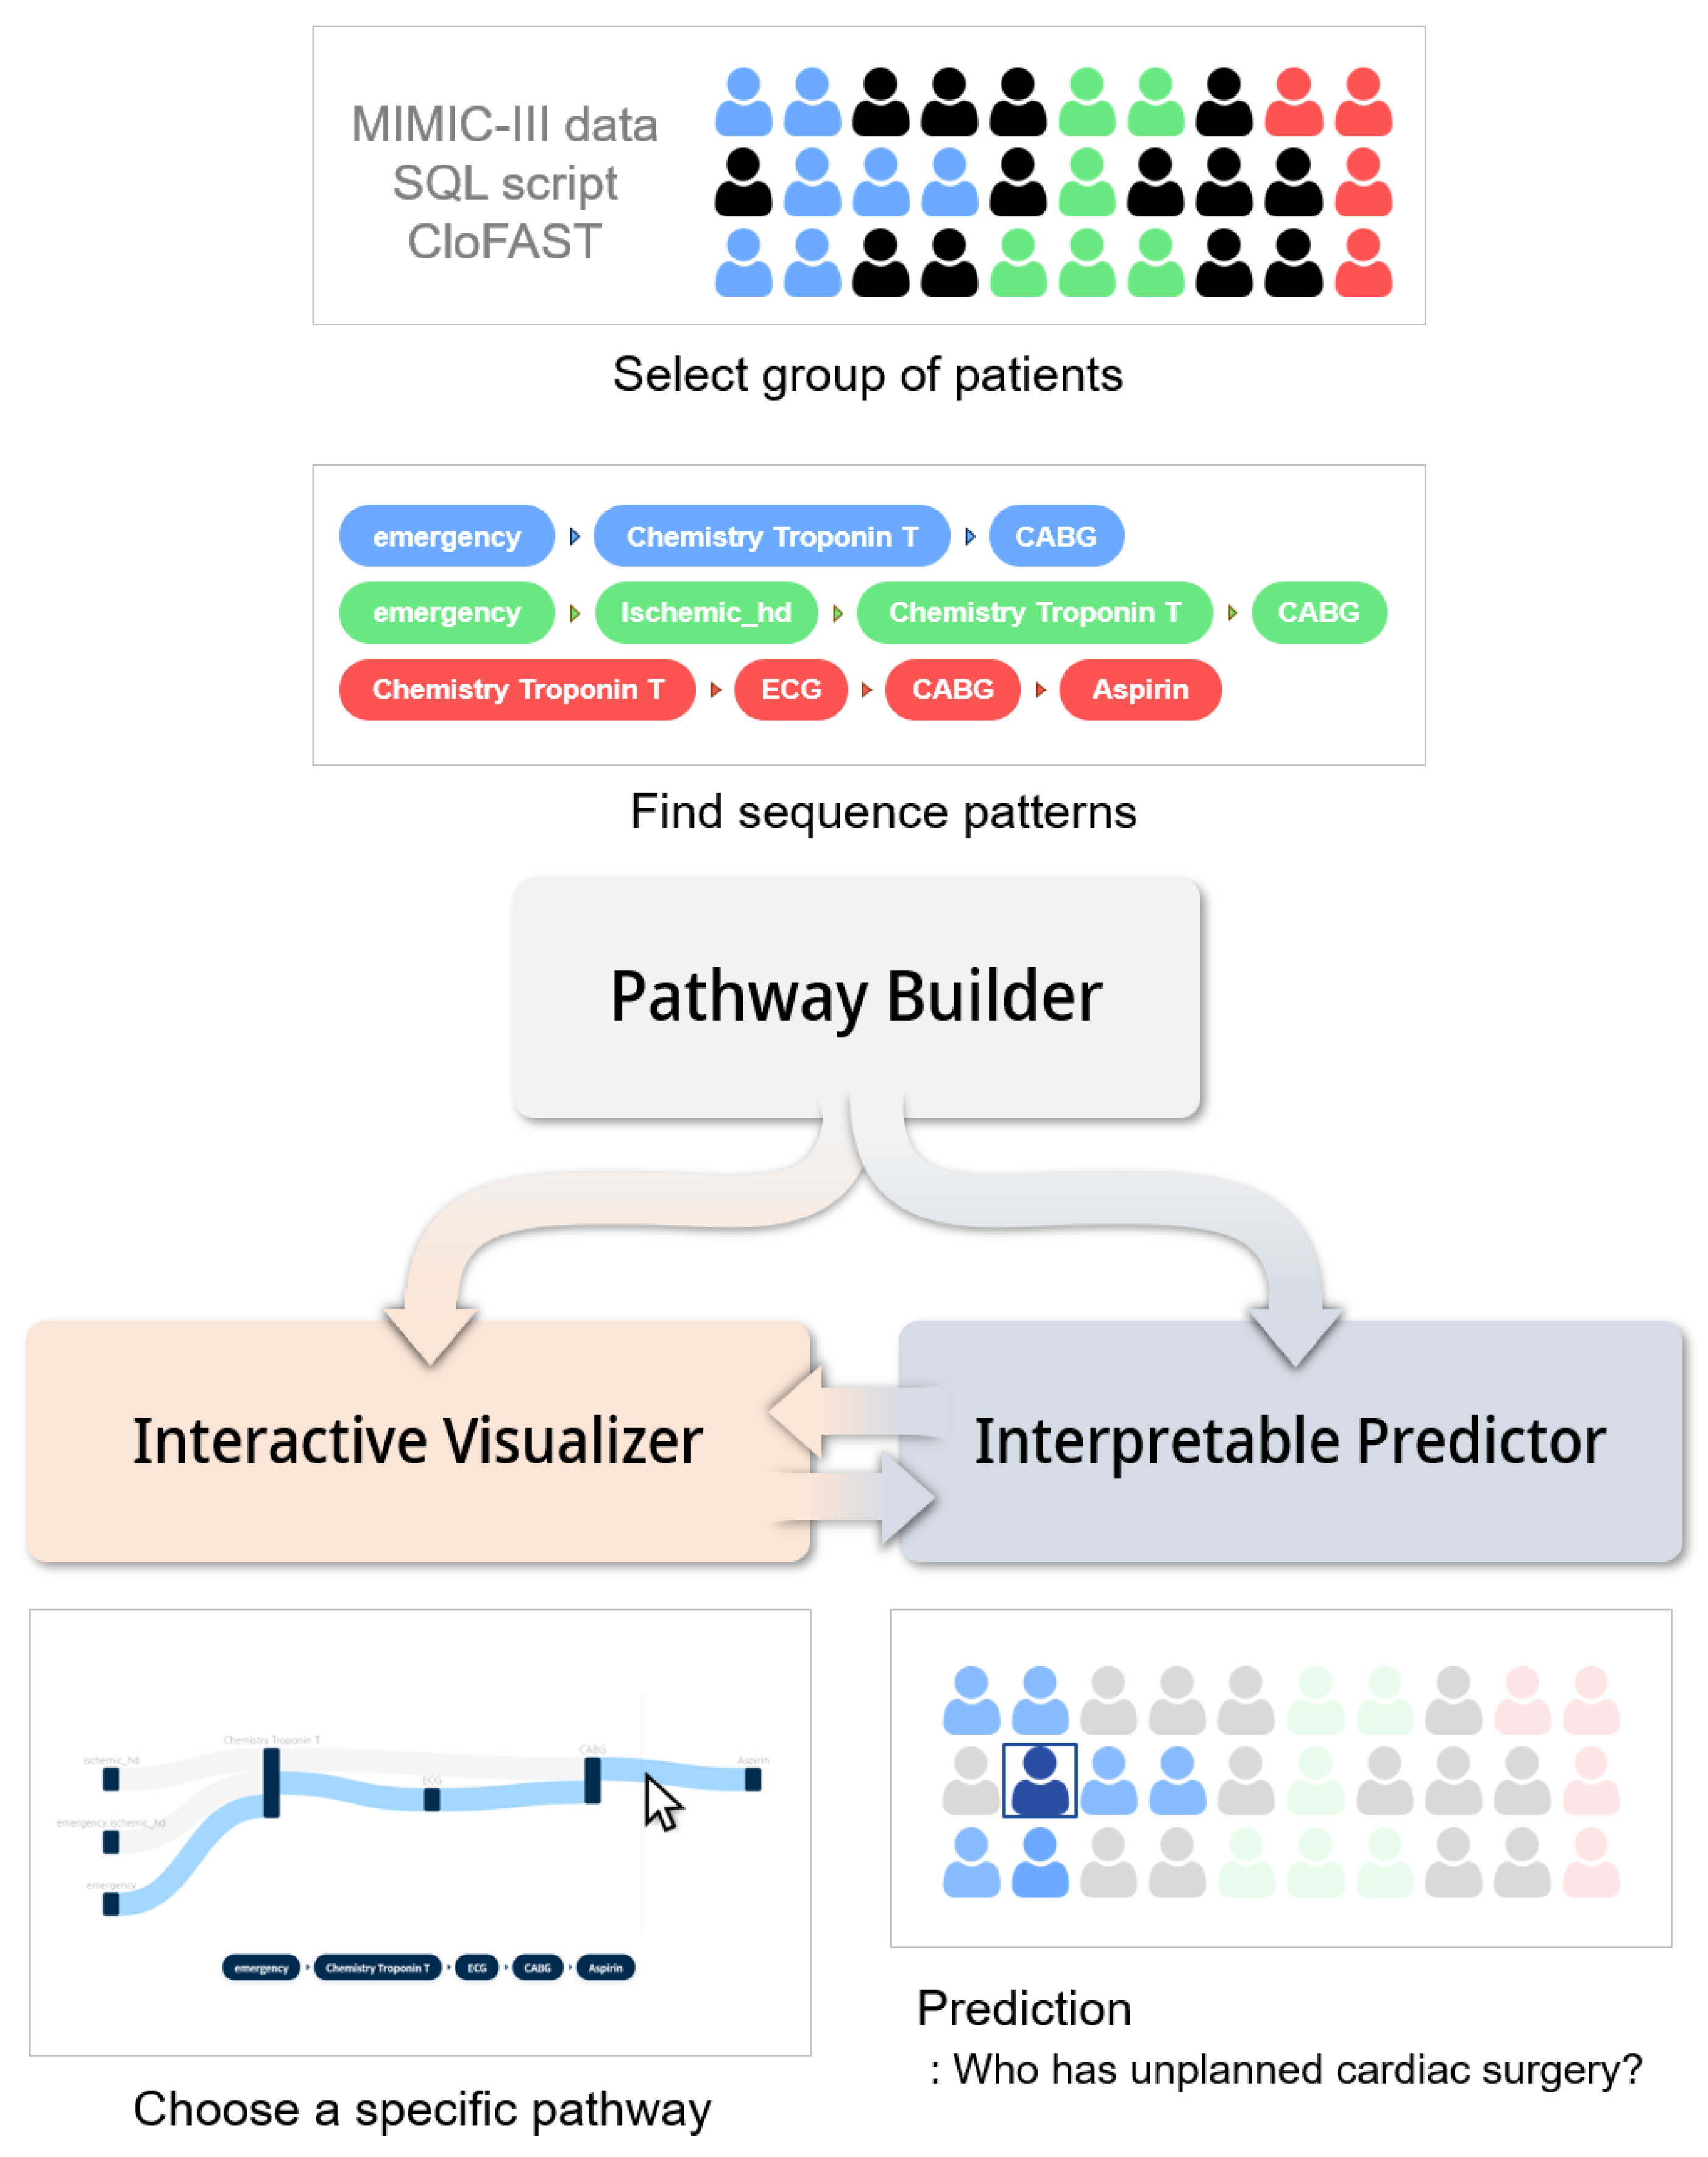
1. Introduction
2. Materials and Methods
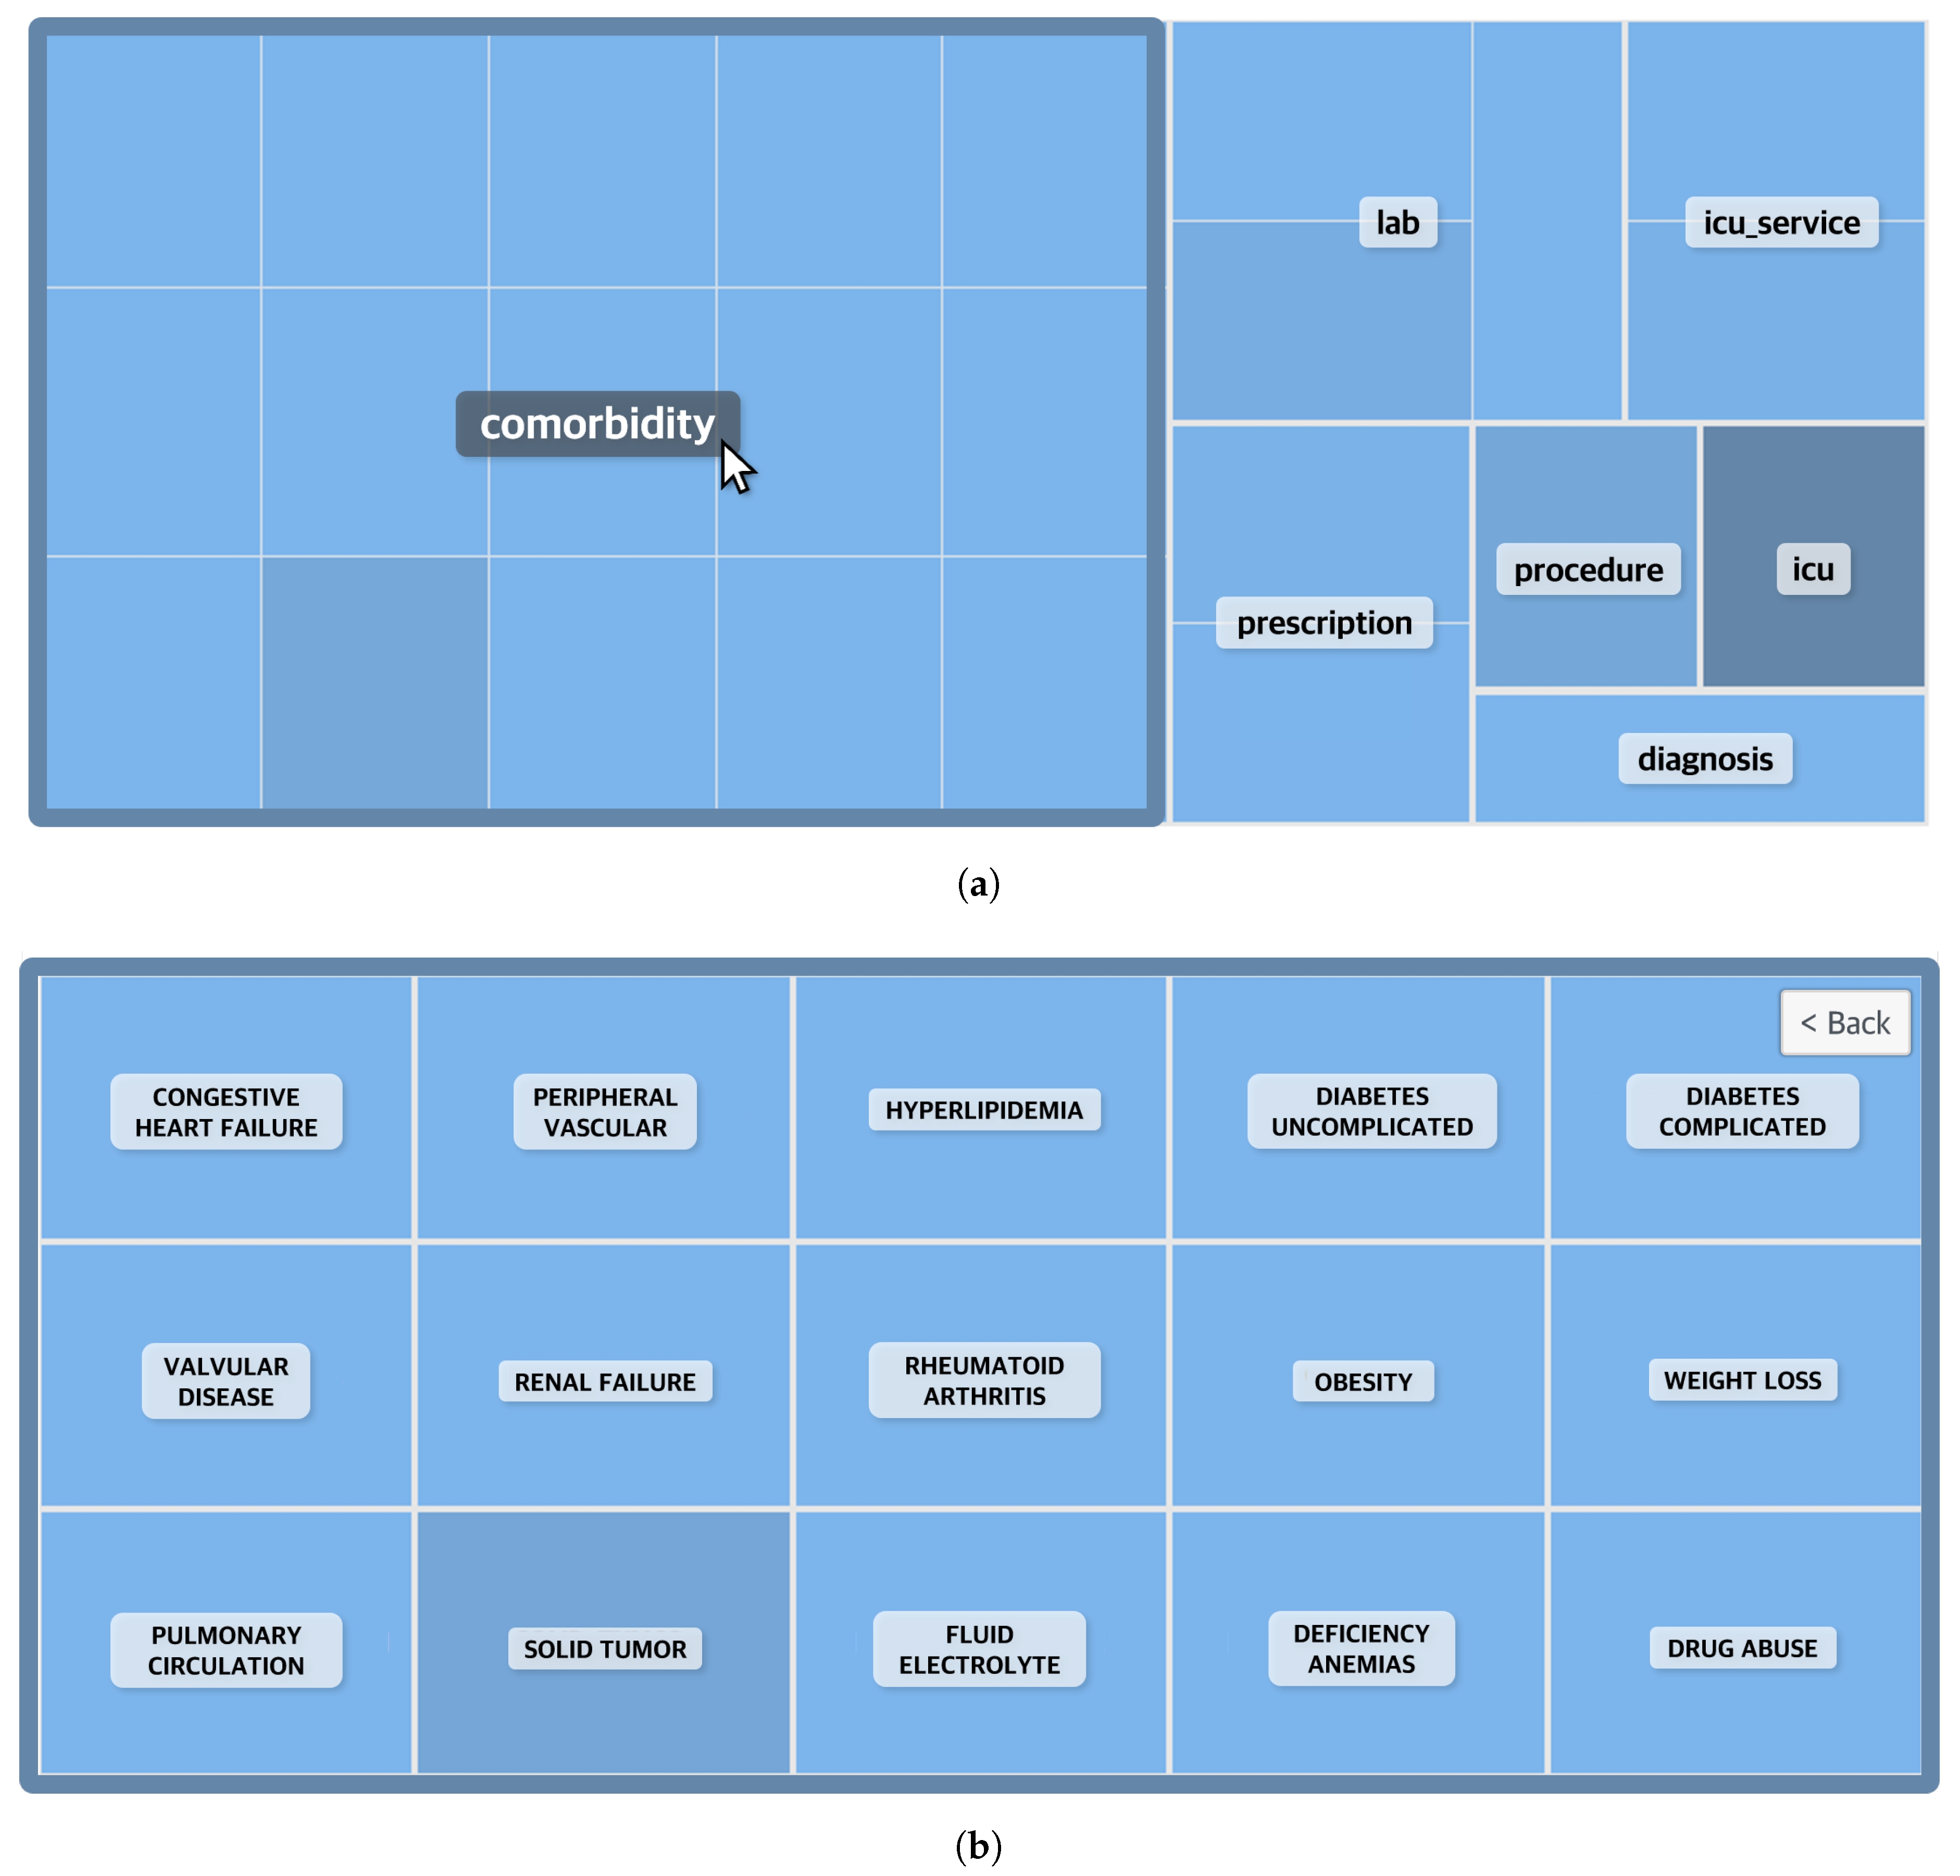
2.1. Data Description and Cohort Construction
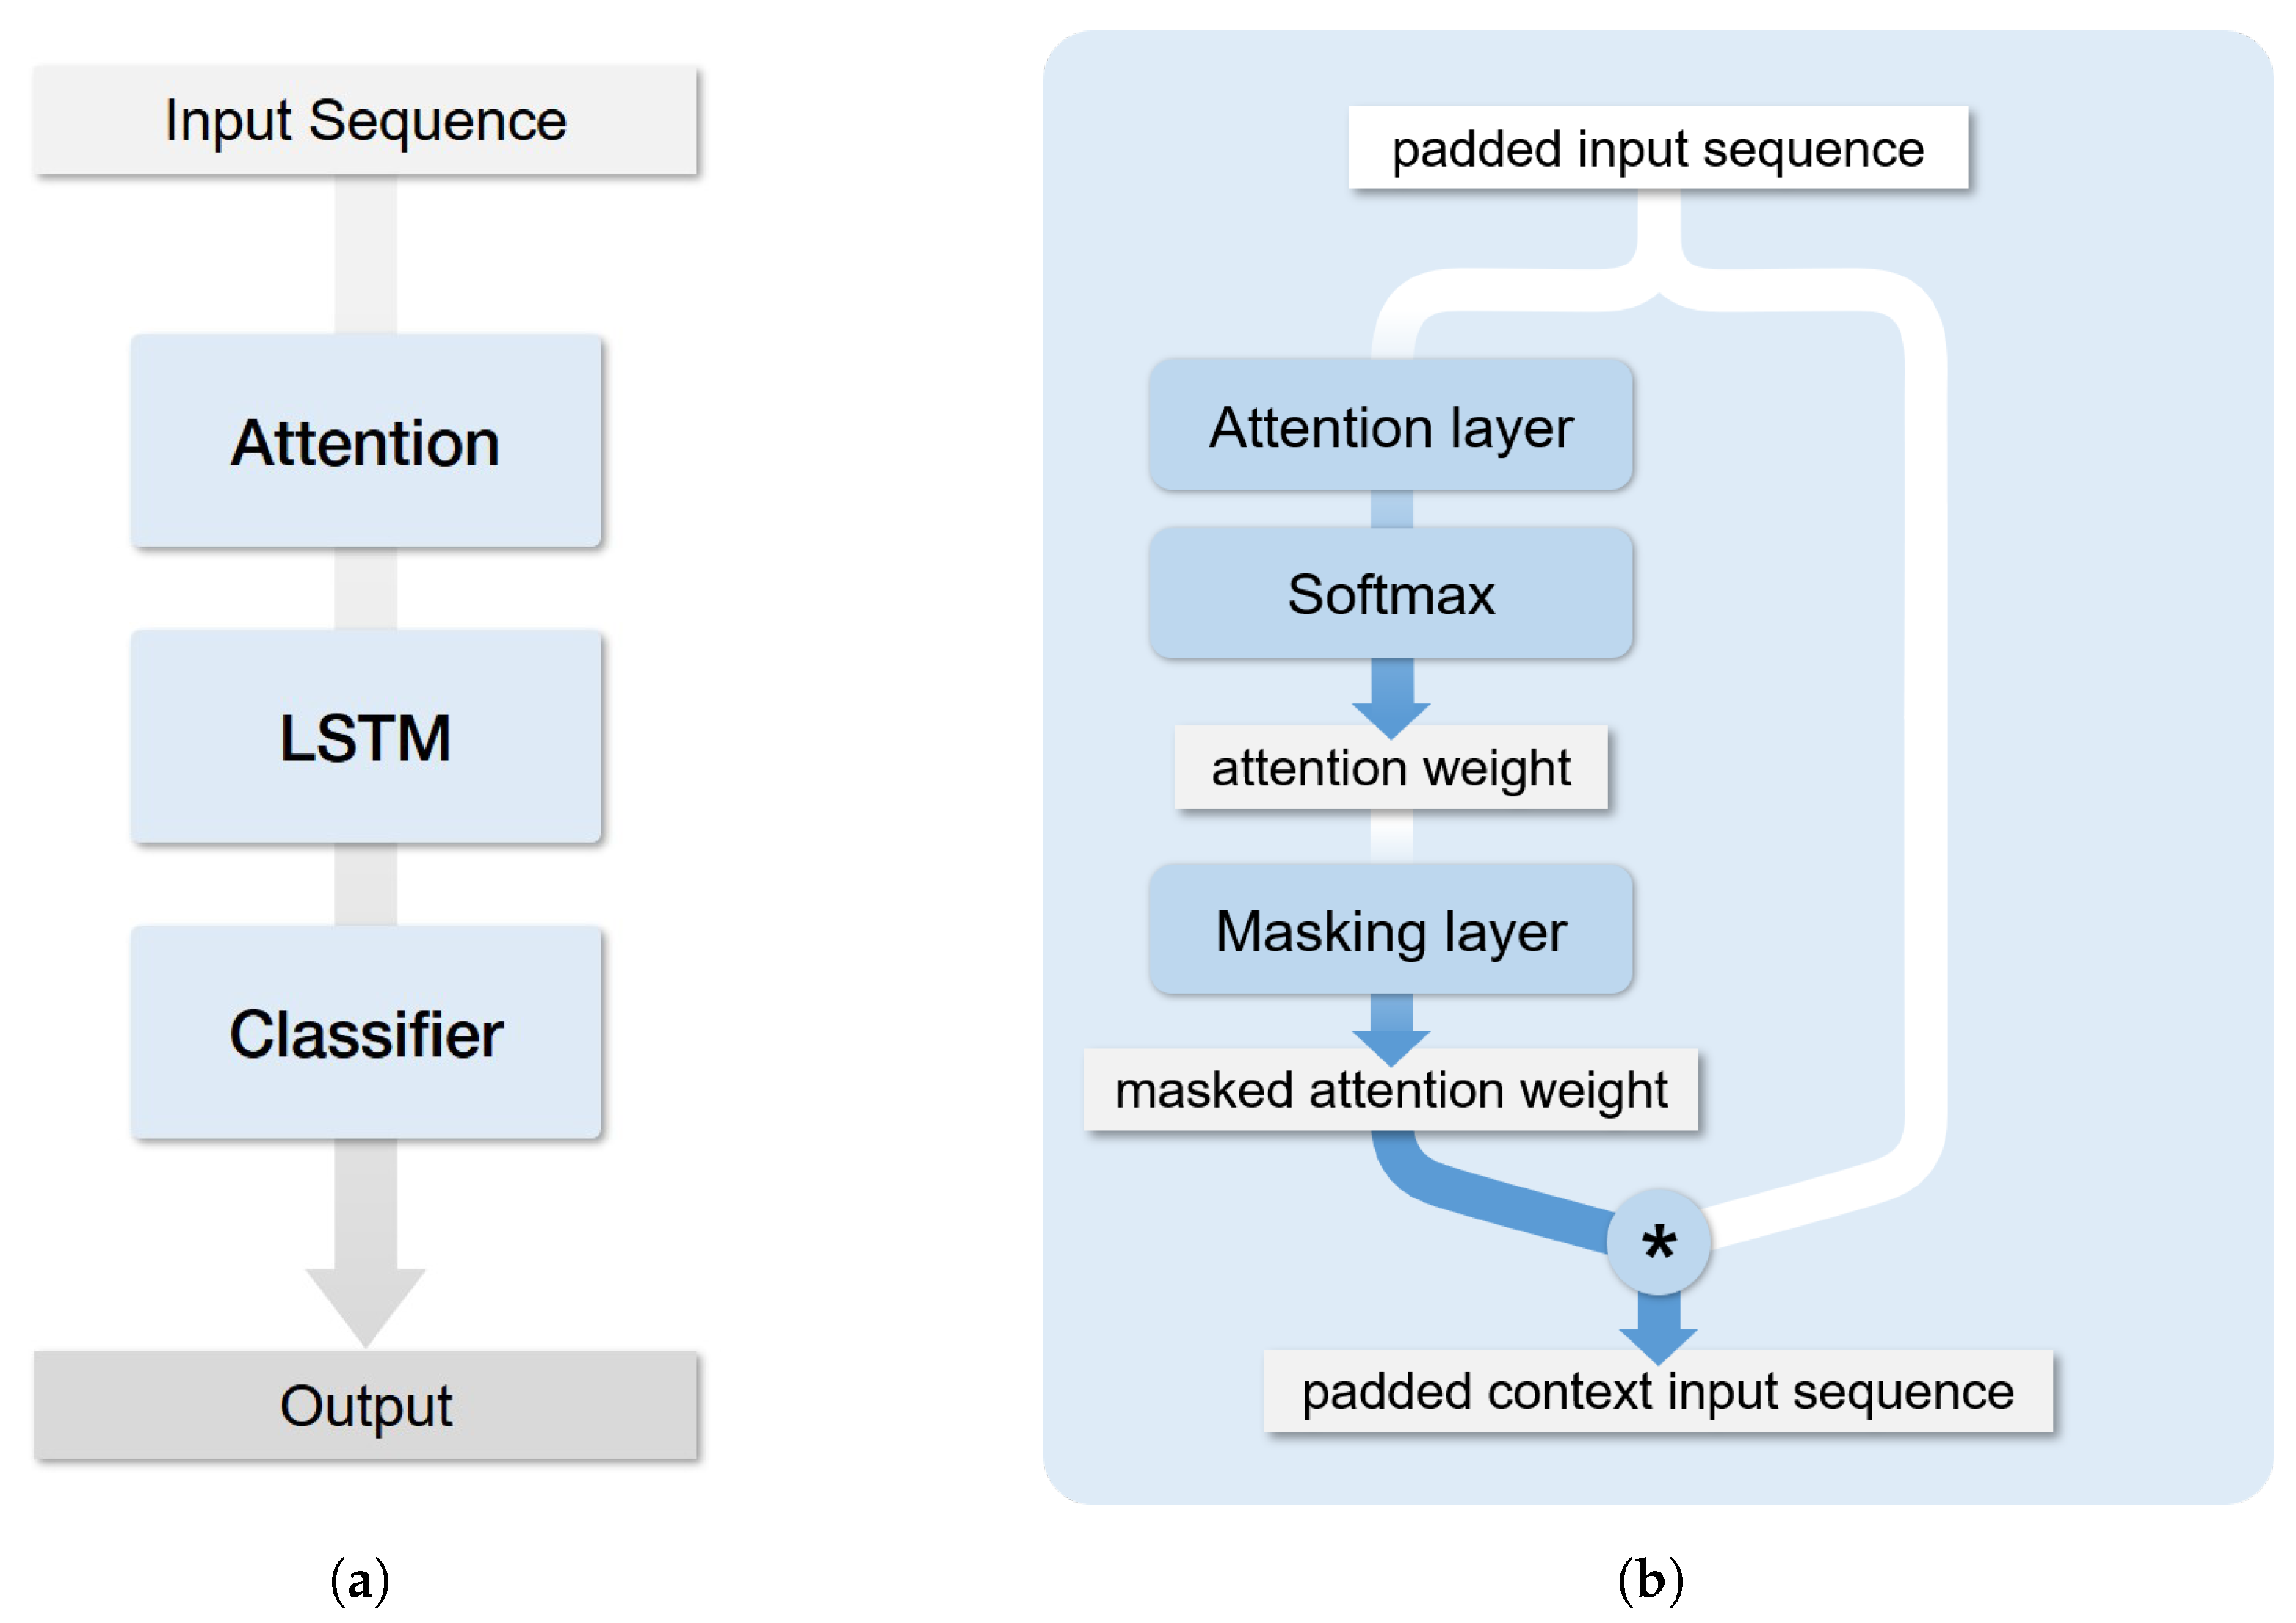
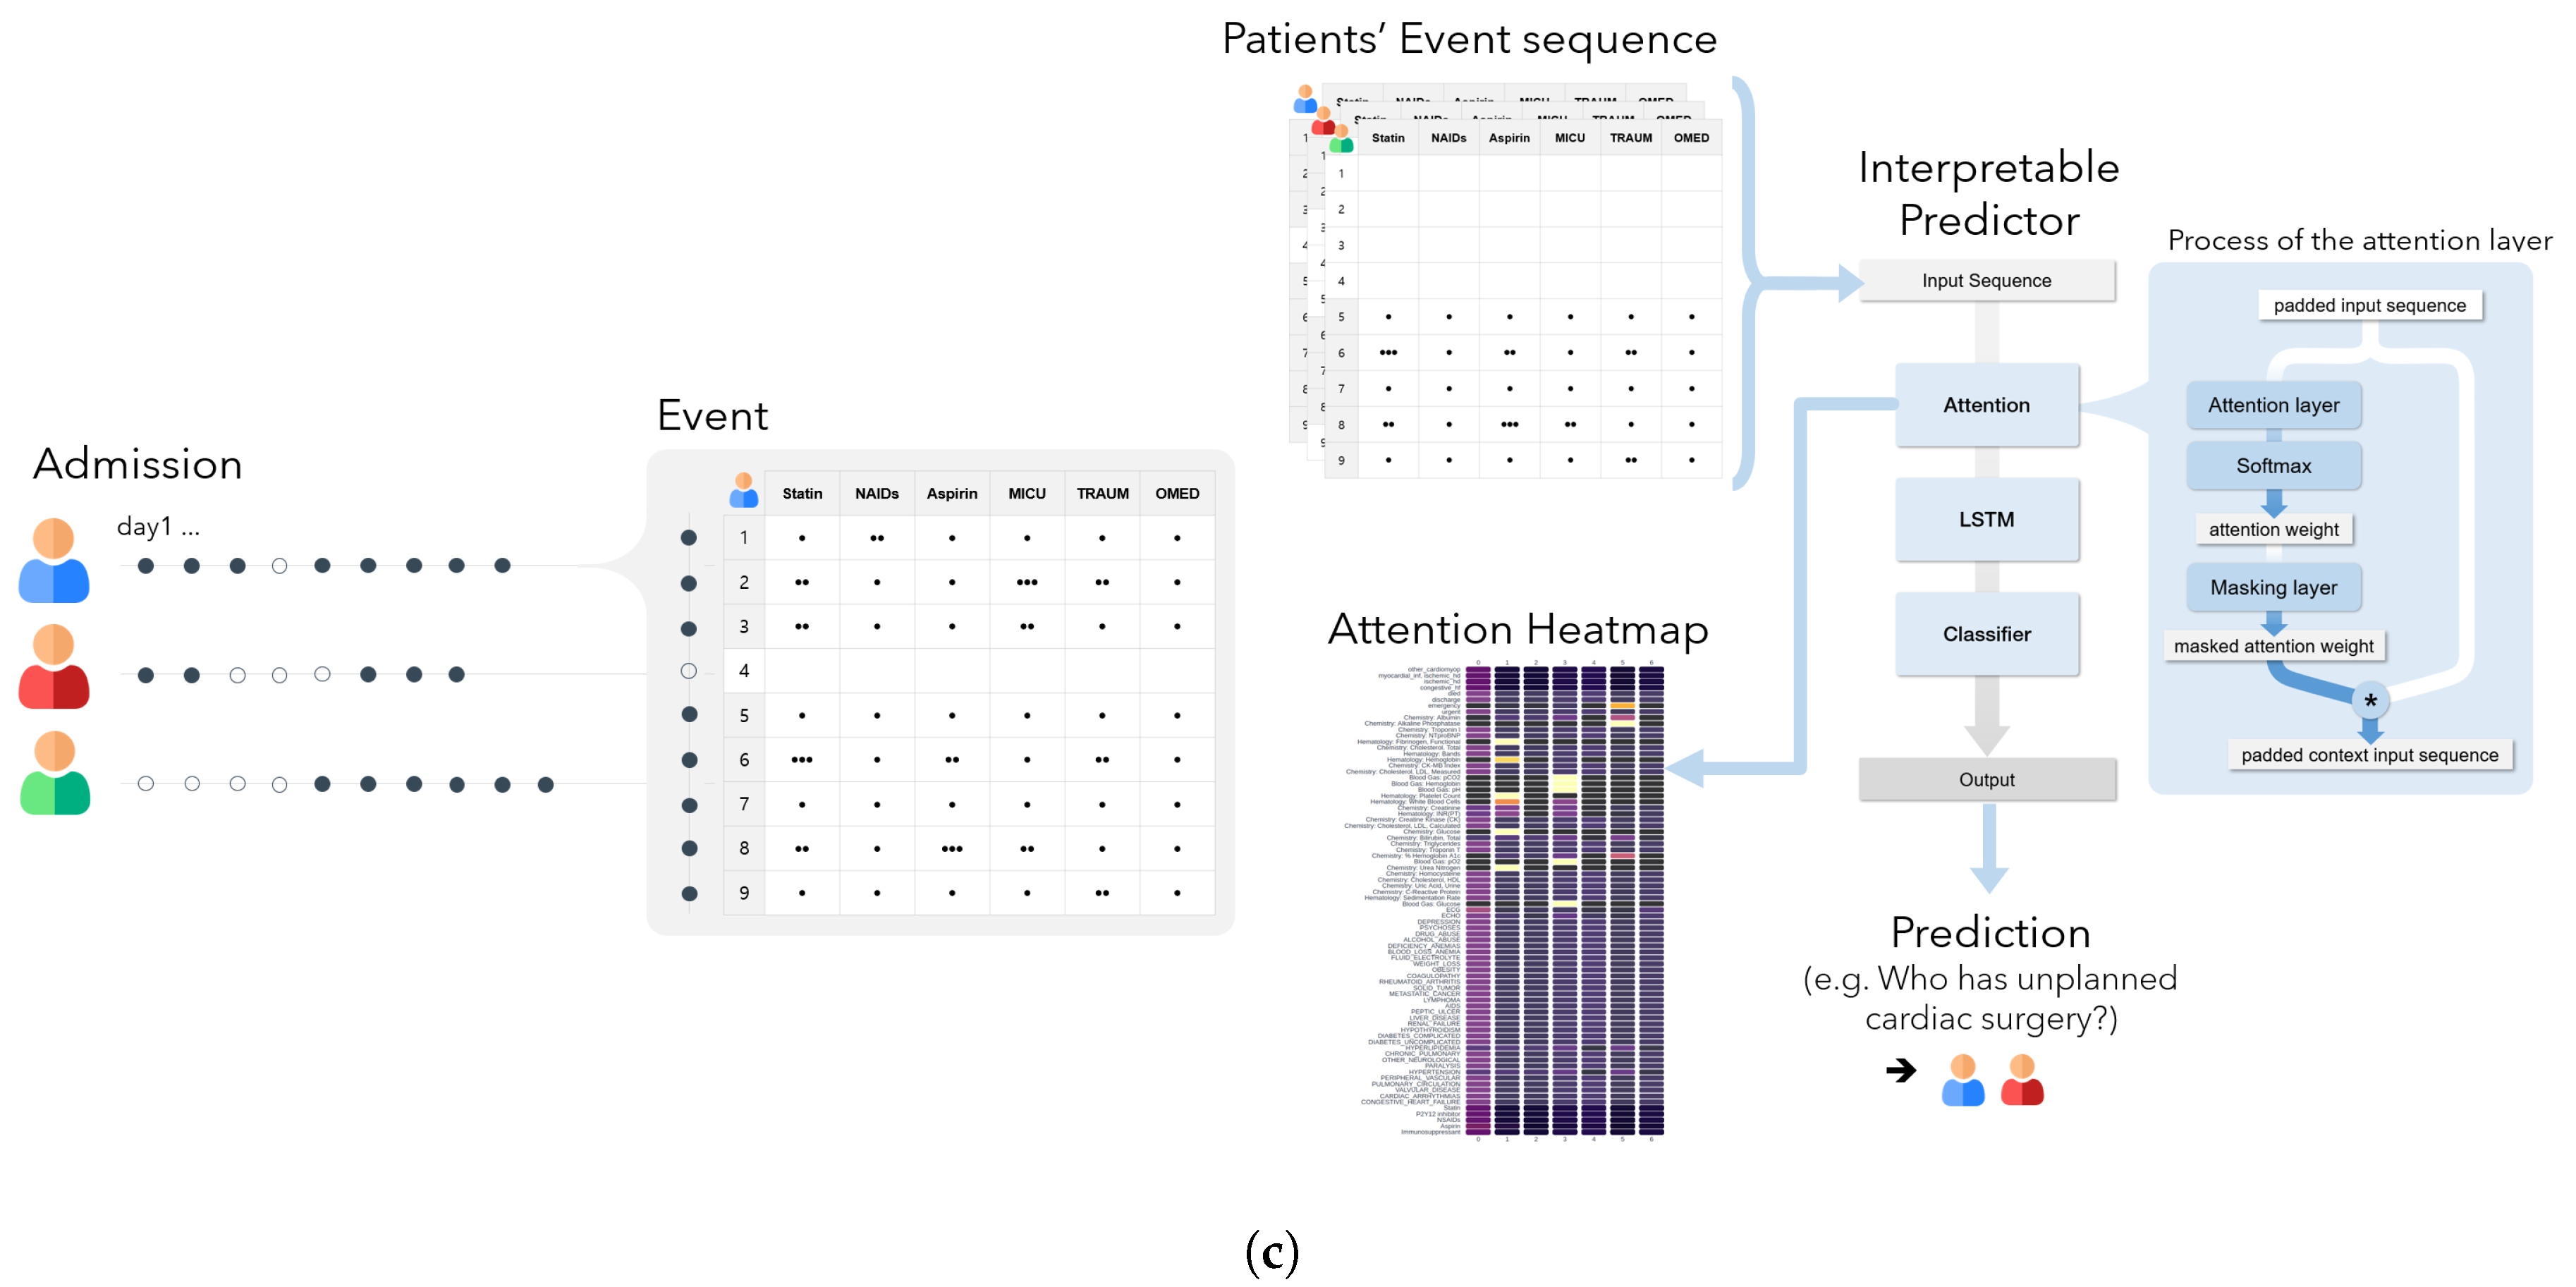
2.2. Architecture
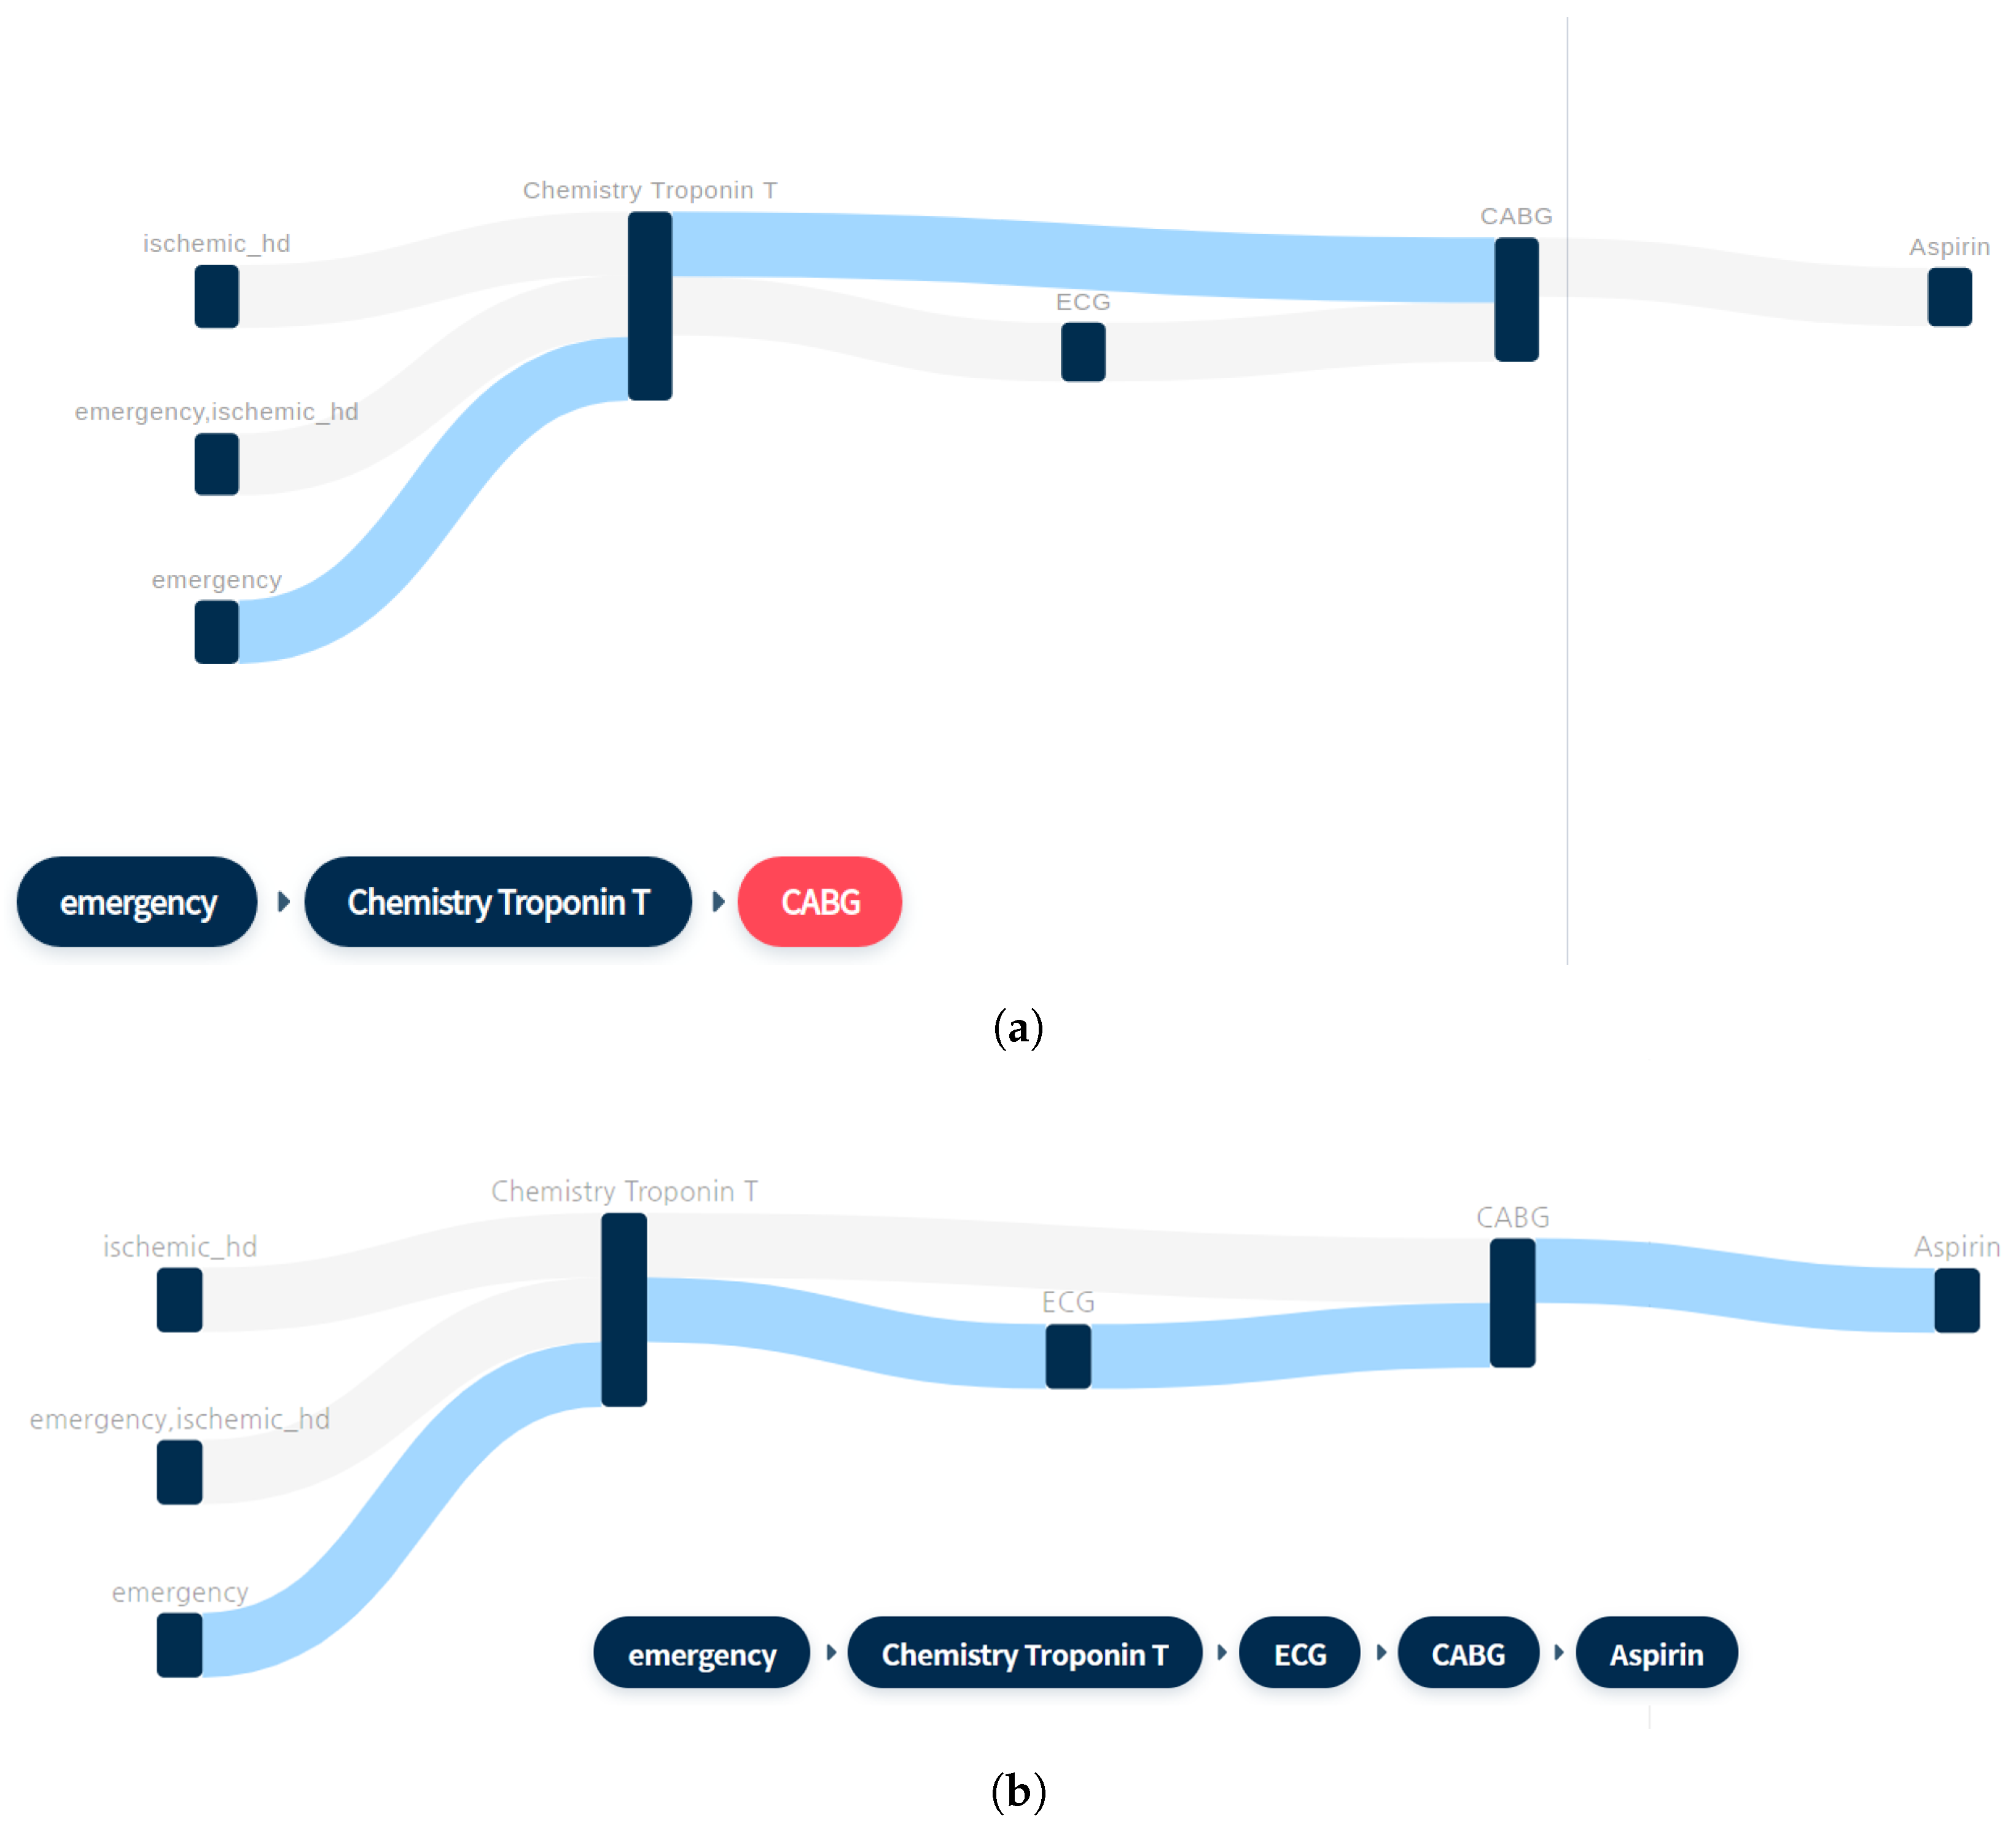
2.3. Sequence Mining for Clinical Pathways
- Context: Important events differ depending on the context. Each disease has a different important event, which implies that every event must not be treated equally and must be included or excluded according to the purpose. For example, for the use case presented herein, it is possible to include echocardiography, which is strongly related to heart diseases.
- Granularity: Medical codes have an intrinsic classification scheme, which implies that the whole hierarchy must be adjusted according to the purpose. For example, it is possible to analyze even the lowest level of disease codes in detail and divide it into efficacy groups by using medical codes.
- Irregularity: The cycle of event occurrence has irregularity, which increases the computational cost and negatively affects learning performance. Therefore, it is necessary to assemble data per hospitalization unit or day.
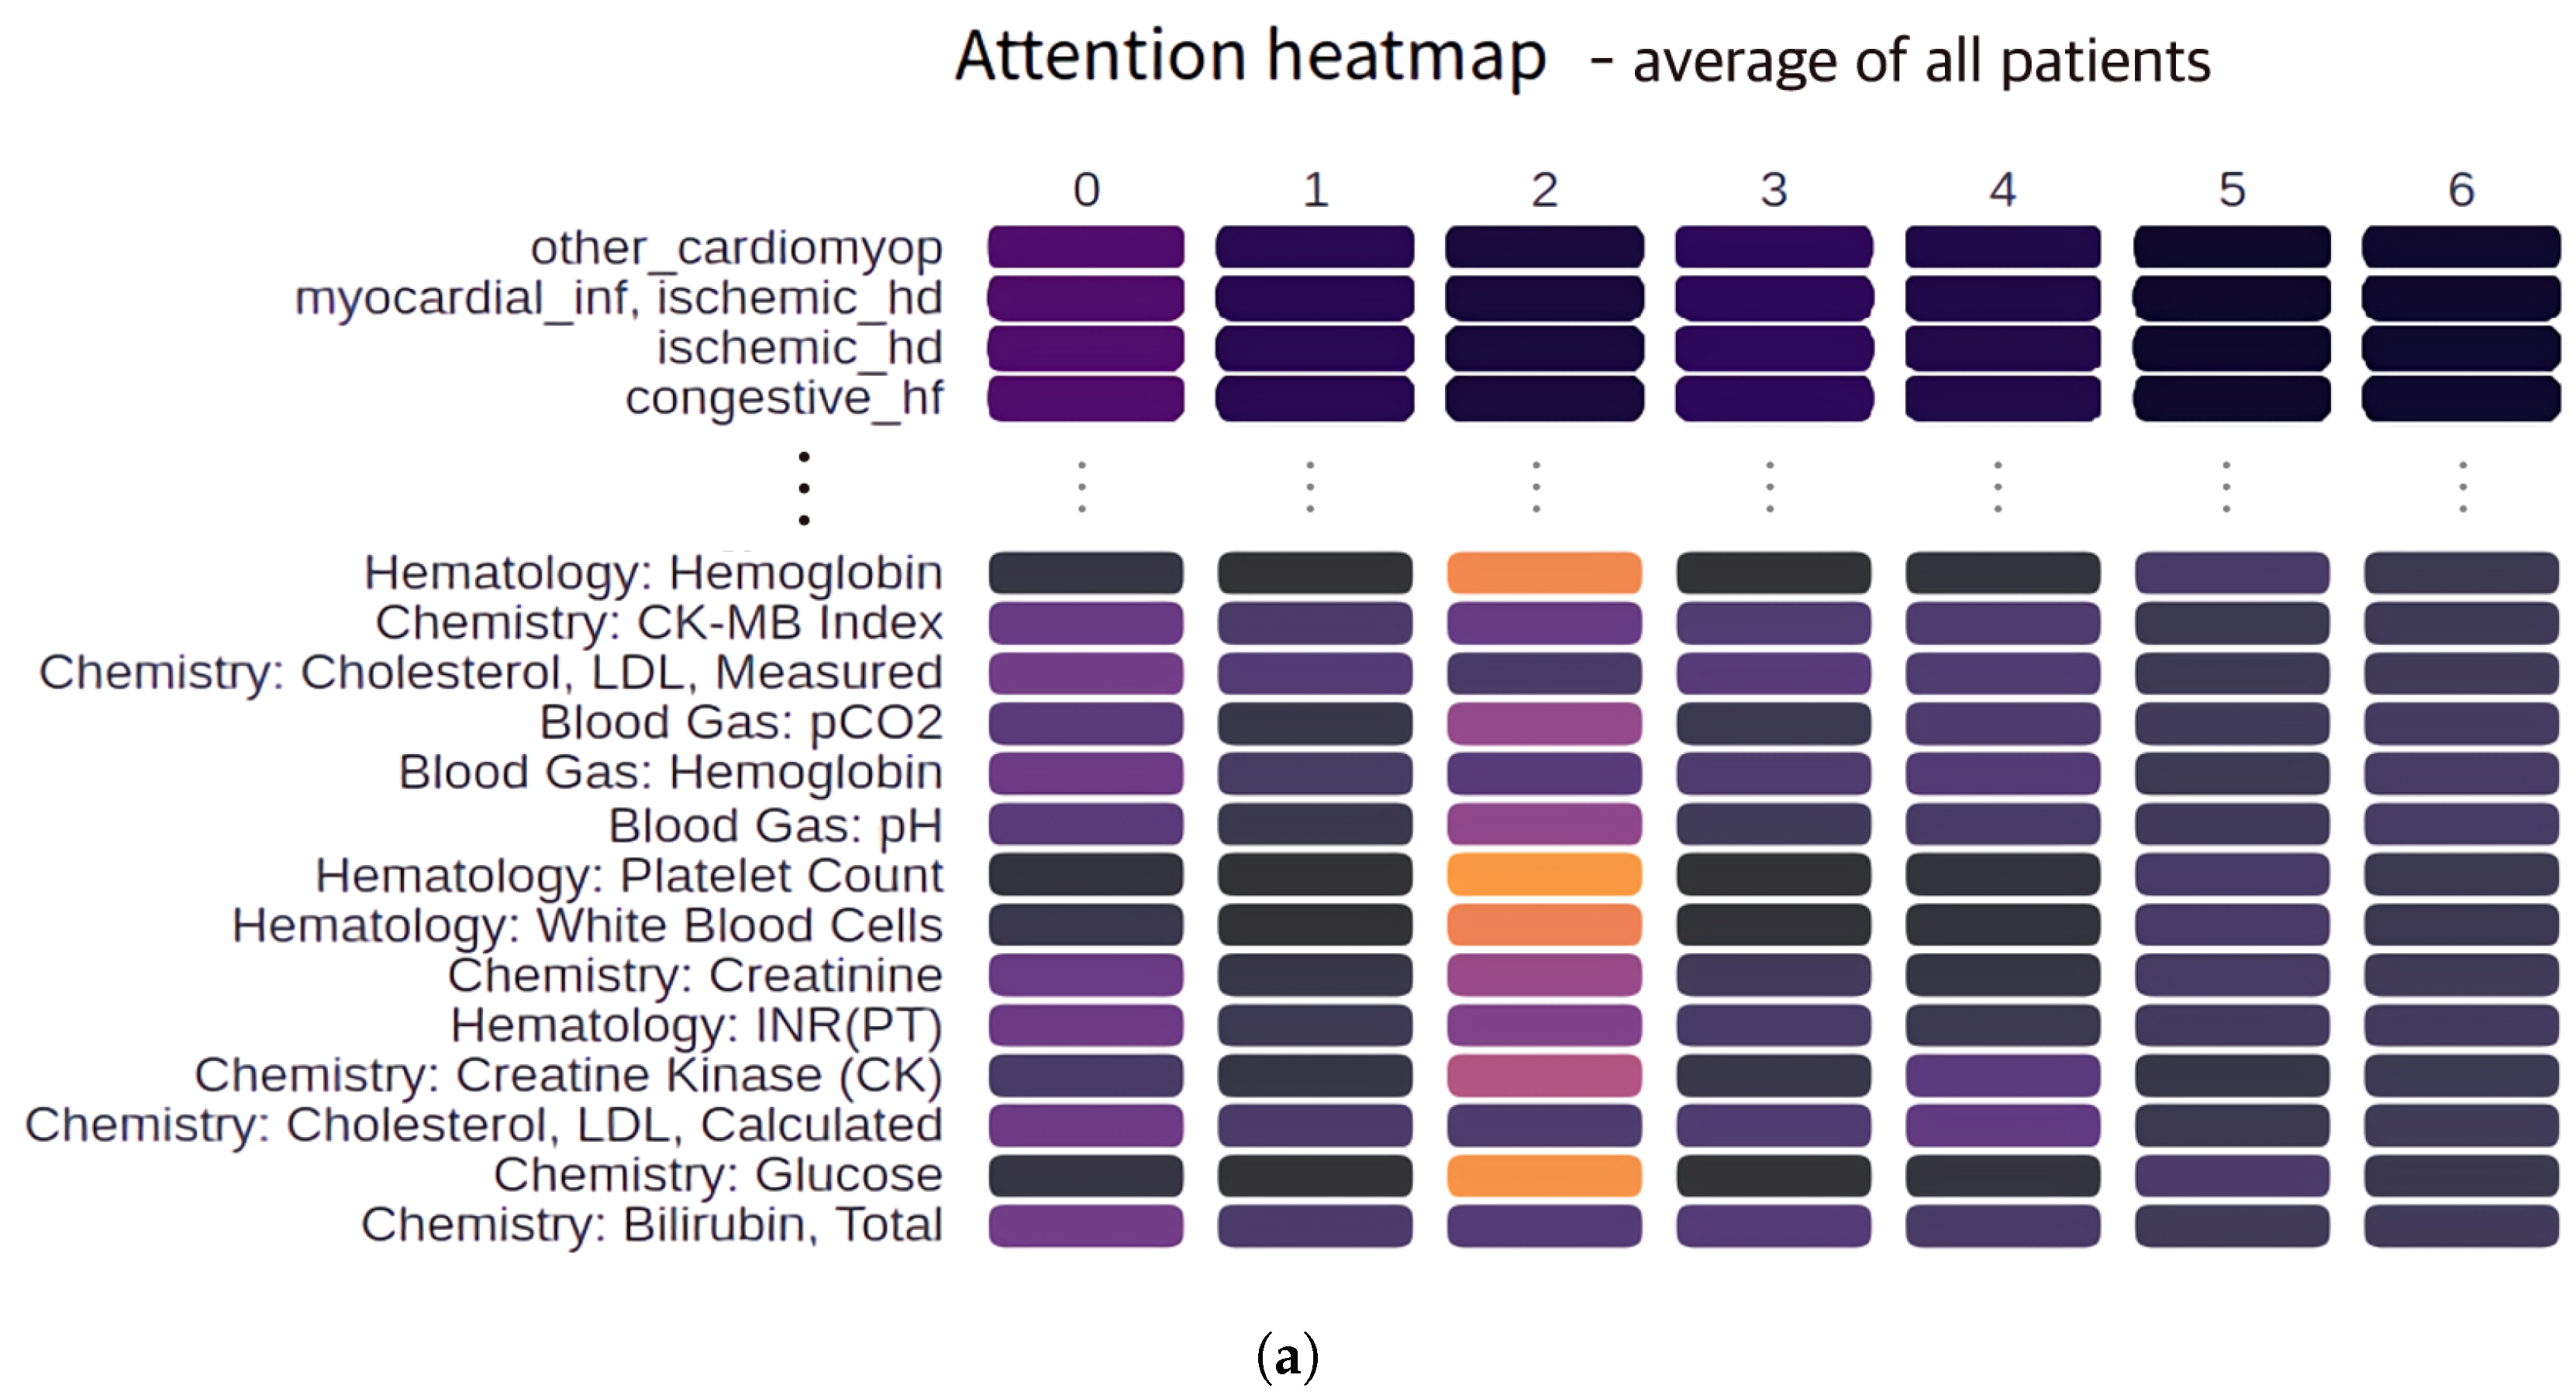
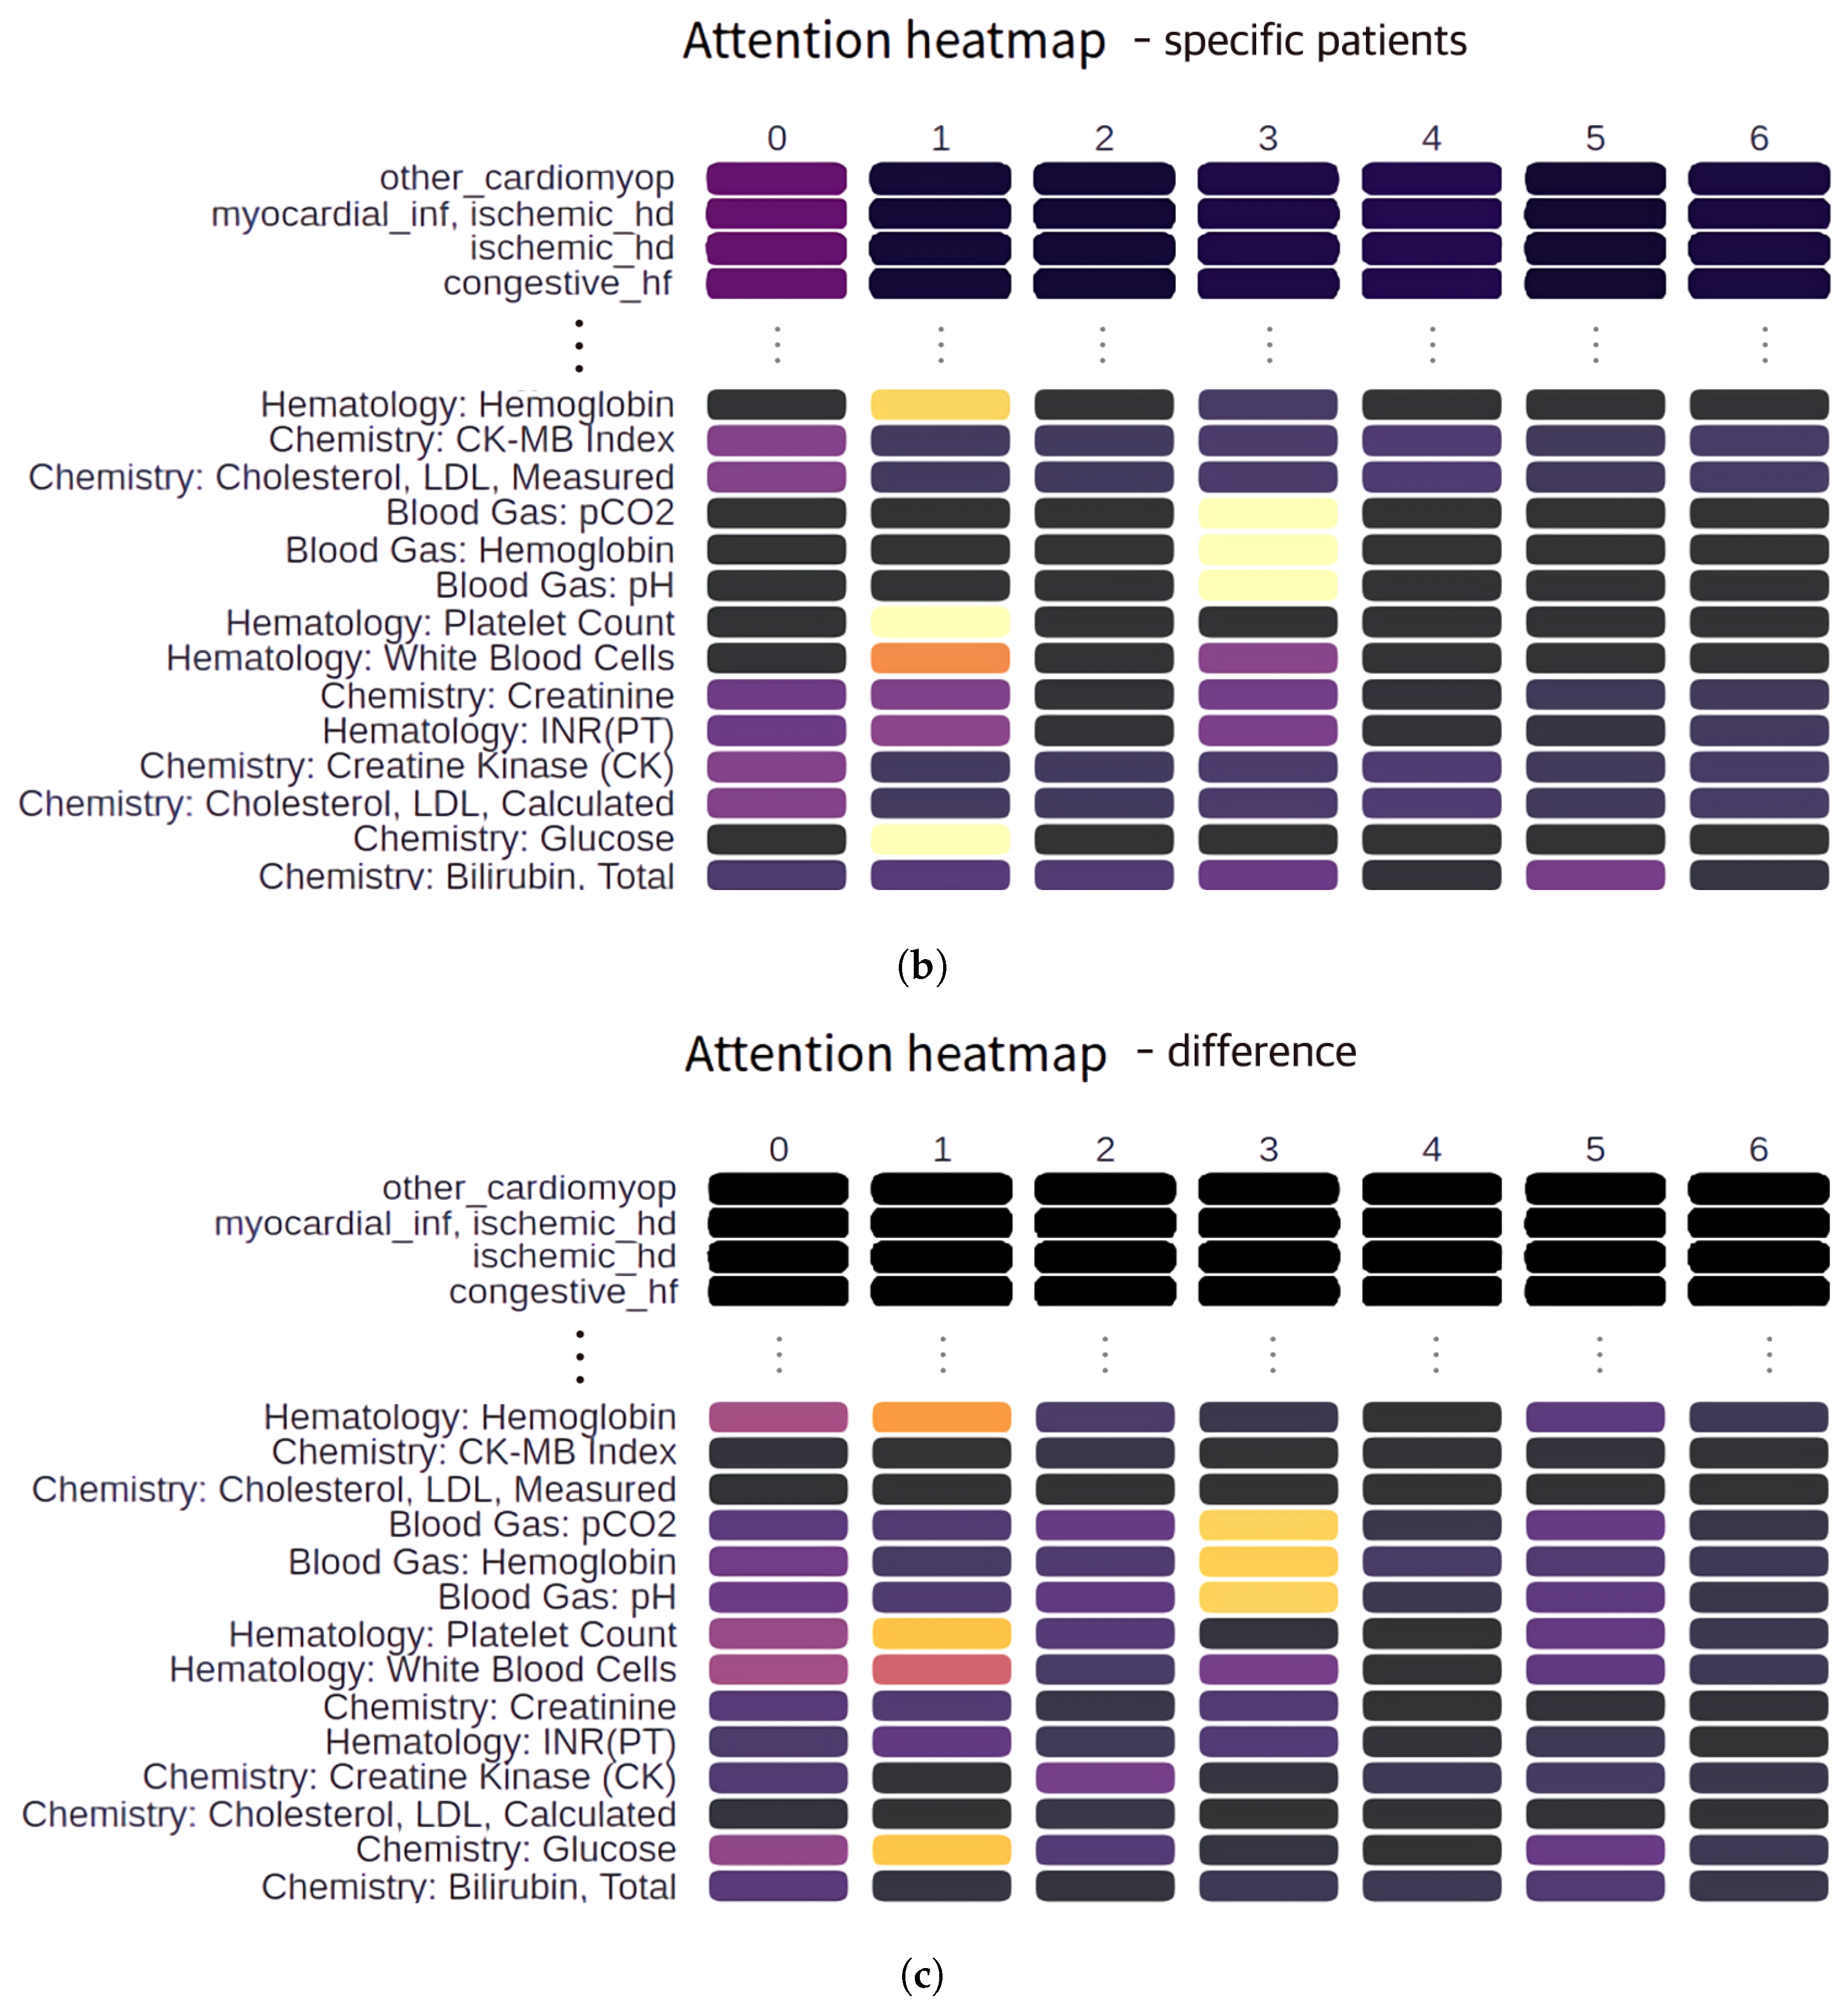
2.4. LSTM Attention Model
3. Results
4. Discussion
5. Conclusions
Author Contributions
Funding
Acknowledgments
Conflicts of Interest
References
- Wang, W.; Krishnan, E. Big data and clinicians: A review on the state of the science. JMIR Med. Inf. 2014, 2, e1. [Google Scholar] [CrossRef]
- Shickel, B.; Tighe, P.J.; Bihorac, A.; Rashidi, P. Deep EHR: A survey of recent advances in deep learning techniques for electronic health record (EHR) analysis. IEEE J. Biomed. Health Inf. 2017, 22, 1589–1604. [Google Scholar] [CrossRef] [PubMed]
- Silverio, A.; Cavallo, P.; De Rosa, R.; Galasso, G. Big Health Data and Cardiovascular Diseases: A Challenge for Research, an Opportunity for Clinical Care. Front. Med. 2019, 6, 36. [Google Scholar] [CrossRef]
- Jensen, P.B.; Jensen, L.J.; Brunak, S. Mining electronic health records: Towards better research applications and clinical care. Nat. Rev. Genet. 2012, 13, 395–405. [Google Scholar] [CrossRef]
- West, V.L.; Borland, D.; Hammond, W.E. Innovative information visualization of electronic health record data: A systematic review. J. Am. Med Inf. Assoc. 2015, 22, 330–339. [Google Scholar] [CrossRef]
- Shneiderman, B.; Plaisant, C.; Hesse, B.W. Improving healthcare with interactive visualization. Computer 2013, 46, 58–66. [Google Scholar] [CrossRef]
- Rind, A.; Wang, T.D.; Aigner, W.; Miksch, S.; Wongsuphasawat, K.; Plaisant, C.; Shneiderman, B. Interactive information visualization to explore and query electronic health records. Found. Trends Hum. Comput. Interact. 2013, 5, 207–298. [Google Scholar] [CrossRef]
- Roque, F.S.; Jensen, P.B.; Schmock, H.; Dalgaard, M.; Andreatta, M.; Hansen, T.; Søeby, K.; Bredkjær, S.; Juul, A.; Werge, T.; et al. Using electronic patient records to discover disease correlations and stratify patient cohorts. PLoS Comput. Biol. 2011, 7, e1002141. [Google Scholar] [CrossRef]
- Wongsuphasawat, K.; Guerra Gómez, J.A.; Plaisant, C.; Wang, T.D.; Taieb-Maimon, M.; Shneiderman, B. LifeFlow: Visualizing an overview of event sequences. In Proceedings of the SIGCHI Conference on Human Factors in Computing Systems, Vancouver, BC, Canada, 7–12 May 2011; pp. 1747–1756. [Google Scholar]
- Guo, S.; Jin, Z.; Gotz, D.; Du, F.; Zha, H.; Cao, N. Visual progression analysis of event sequence data. IEEE Trans. Vis. Comput. Graph. 2018, 25, 417–426. [Google Scholar] [CrossRef]
- Liu, Z.; Kerr, B.; Dontcheva, M.; Grover, J.; Hoffman, M.; Wilson, A. Coreflow: Extracting and visualizing branching patterns from event sequences. In Computer Graphics Forum; Wiley Online Library: Hoboken, NJ, USA, 2017; Volume 36, pp. 527–538. [Google Scholar]
- Loorak, M.H.; Perin, C.; Kamal, N.; Hill, M.; Carpendale, S. Timespan: Using visualization to explore temporal multi-dimensional data of stroke patients. IEEE Trans. Vis. Comput. Graph. 2015, 22, 409–418. [Google Scholar] [CrossRef]
- Perer, A.; Wang, F.; Hu, J. Mining and exploring care pathways from electronic medical records with visual analytics. J. Biomed. Inf. 2015, 56, 369–378. [Google Scholar] [CrossRef]
- Law, P.M.; Liu, Z.; Malik, S.; Basole, R.C. MAQUI: Interweaving queries and pattern mining for recursive event sequence exploration. IEEE Trans. Vis. Comput. Graph. 2018, 25, 396–406. [Google Scholar] [CrossRef]
- Gotz, D.; Stavropoulos, H. Decisionflow: Visual analytics for high-dimensional temporal event sequence data. IEEE Trans. Vis. Comput. Graph. 2014, 20, 1783–1792. [Google Scholar] [CrossRef]
- Choi, E.; Bahadori, M.T.; Sun, J.; Kulas, J.; Schuetz, A.; Stewart, W. Retain: An interpretable predictive model for healthcare using reverse time attention mechanism. In Proceedings of the NEURAL INFORMATION PROCESSING SYSTEMS (NIPS), Barcelona, Spain, 5–10 December 2016; pp. 3504–3512. [Google Scholar]
- Kwon, B.C.; Choi, M.J.; Kim, J.T.; Choi, E.; Kim, Y.B.; Kwon, S.; Sun, J.; Choo, J. Retainvis: Visual analytics with interpretable and interactive recurrent neural networks on electronic medical records. IEEE Trans. Vis. Comput. Graph. 2018, 25, 299–309. [Google Scholar] [CrossRef]
- Strobelt, H.; Gehrmann, S.; Behrisch, M.; Perer, A.; Pfister, H.; Rush, A.M. Seq2Seq-Vis: A visual debugging tool for sequence-to-sequence models. IEEE Trans. Vis. Comput. Graph. 2018, 25, 353–363. [Google Scholar] [CrossRef]
- Johnson, A.E.; Pollard, T.J.; Shen, L.; Li-Wei, H.L.; Feng, M.; Ghassemi, M.; Moody, B.; Szolovits, P.; Celi, L.A.; Mark, R.G. MIMIC-III, a freely accessible critical care database. Sci. Data 2016, 3, 160035. [Google Scholar] [CrossRef] [PubMed]
- Fumarola, F.; Lanotte, P.F.; Ceci, M.; Malerba, D. CloFAST: Closed sequential pattern mining using sparse and vertical id-lists. Knowl. Inf. Syst. 2016, 48, 429–463. [Google Scholar] [CrossRef]
- Vaswani, A.; Shazeer, N.; Parmar, N.; Uszkoreit, J.; Jones, L.; Gomez, A.N.; Kaiser, Ł.; Polosukhin, I. Attention is all you need. In Proceedings of the 31st Conference on Neural Information Processing Systems (NIPS 2017), Long Beach, CA, USA, 4–9 December 2017. [Google Scholar]
- Devlin, J.; Chang, M.W.; Lee, K.; Toutanova, K. Bert: Pre-training of deep bidirectional transformers for language understanding. arXiv 2018, arXiv:1810.04805. [Google Scholar]
- Choi, E.; Bahadori, M.T.; Song, L.; Stewart, W.F.; Sun, J. GRAM: Graph-based attention model for healthcare representation learning. In Proceedings of the 23rd ACM SIGKDD International Conference on Knowledge Discovery and Data Mining, Halifax, NS, Canada, 13–17 August 2017; pp. 787–795. [Google Scholar]
- Ma, F.; Chitta, R.; Zhou, J.; You, Q.; Sun, T.; Gao, J. Dipole: Diagnosis prediction in healthcare via attention-based bidirectional recurrent neural networks. In Proceedings of the 23rd ACM SIGKDD International Conference on Knowledge Discovery and Data Mining, Halifax, NS, Canada, 13–17 August 2017; pp. 1903–1911. [Google Scholar]
- Ma, F.; You, Q.; Xiao, H.; Chitta, R.; Zhou, J.; Gao, J. Kame: Knowledge-based attention model for diagnosis prediction in healthcare. In Proceedings of the 27th ACM International Conference on Information and Knowledge Management, Turin, Italy, 22–26 October 2018; pp. 743–752. [Google Scholar]
- Wang, F.; Kaushal, R.; Khullar, D. Should Health Care Demand Interpretable Artificial Intelligence or Accept “Black Box” Medicine? Annals of Internal Medicine: New York, NY, USA, 2020. [Google Scholar]
- Bai, B.; Liang, J.; Zhang, G.; Li, H.; Bai, K.; Wang, F. Why is Attention Not So Attentive? arXiv 2020, arXiv:2006.05656. [Google Scholar]
- Golas, S.B.; Shibahara, T.; Agboola, S.; Otaki, H.; Sato, J.; Nakae, T.; Hisamitsu, T.; Kojima, G.; Felsted, J.; Kakarmath, S.; et al. A machine learning model to predict the risk of 30-day readmissions in patients with heart failure: A retrospective analysis of electronic medical records data. BMC Med. Inf. Decis. Mak. 2018, 18, 44. [Google Scholar] [CrossRef]
- Rajkomar, A.; Oren, E.; Chen, K.; Dai, A.M.; Hajaj, N.; Hardt, M.; Liu, P.J.; Liu, X.; Marcus, J.; Sun, M.; et al. Scalable and accurate deep learning with electronic health records. NPJ Digit. Med. 2018, 1, 18. [Google Scholar] [CrossRef] [PubMed]
- Thygesen, K.; Alpert, J.S.; Jaffe, A.S.; Chaitman, B.R.; Bax, J.J.; Morrow, D.A.; White, H.D. Fourth universal definition of myocardial infarction. J. Am. Coll. Cardiol. 2018, 72, 2231–2264. [Google Scholar] [CrossRef] [PubMed]
- Tomašev, N.; Glorot, X.; Rae, J.W.; Zielinski, M.; Askham, H.; Saraiva, A.; Mottram, A.; Meyer, C.; Ravuri, S.; Protsyuk, I.; et al. A clinically applicable approach to continuous prediction of future acute kidney injury. Nature 2019, 572, 116–119. [Google Scholar] [CrossRef] [PubMed]
- Yu, B.; Kumbier, K. Veridical data science. Proc. Natl. Acad. Sci. USA 2020, 117, 3920–3929. [Google Scholar] [CrossRef] [PubMed]


| Patient ID, Subject_id | Hospital Admission ID, Hadm_id | Timestamp, ts | Event ID, Event_id | Event Value, Event_Value |
|---|---|---|---|---|
| 18803 | 233 | 2189-12-24 7:15:00 | 2 | 1 |
| 18803 | 233 | 2189-12-24 7:15:00 | 6185 | 1 |
| 18803 | 254 | 2189-12-24 7:15:00 | 30 | 1 |
| Sequence | (2), (6185), (30) | |||
| Minimum Support Rate (%) | Total Time (s) | Pattern Count |
|---|---|---|
| 25 | 12.5 | 97 |
| 10 | 60.884 | 1094 |
| 5 | 154.066 | 8312 |
| 3 | 987.708 | 28,745 |
| No. | Pattern | Support (%) |
|---|---|---|
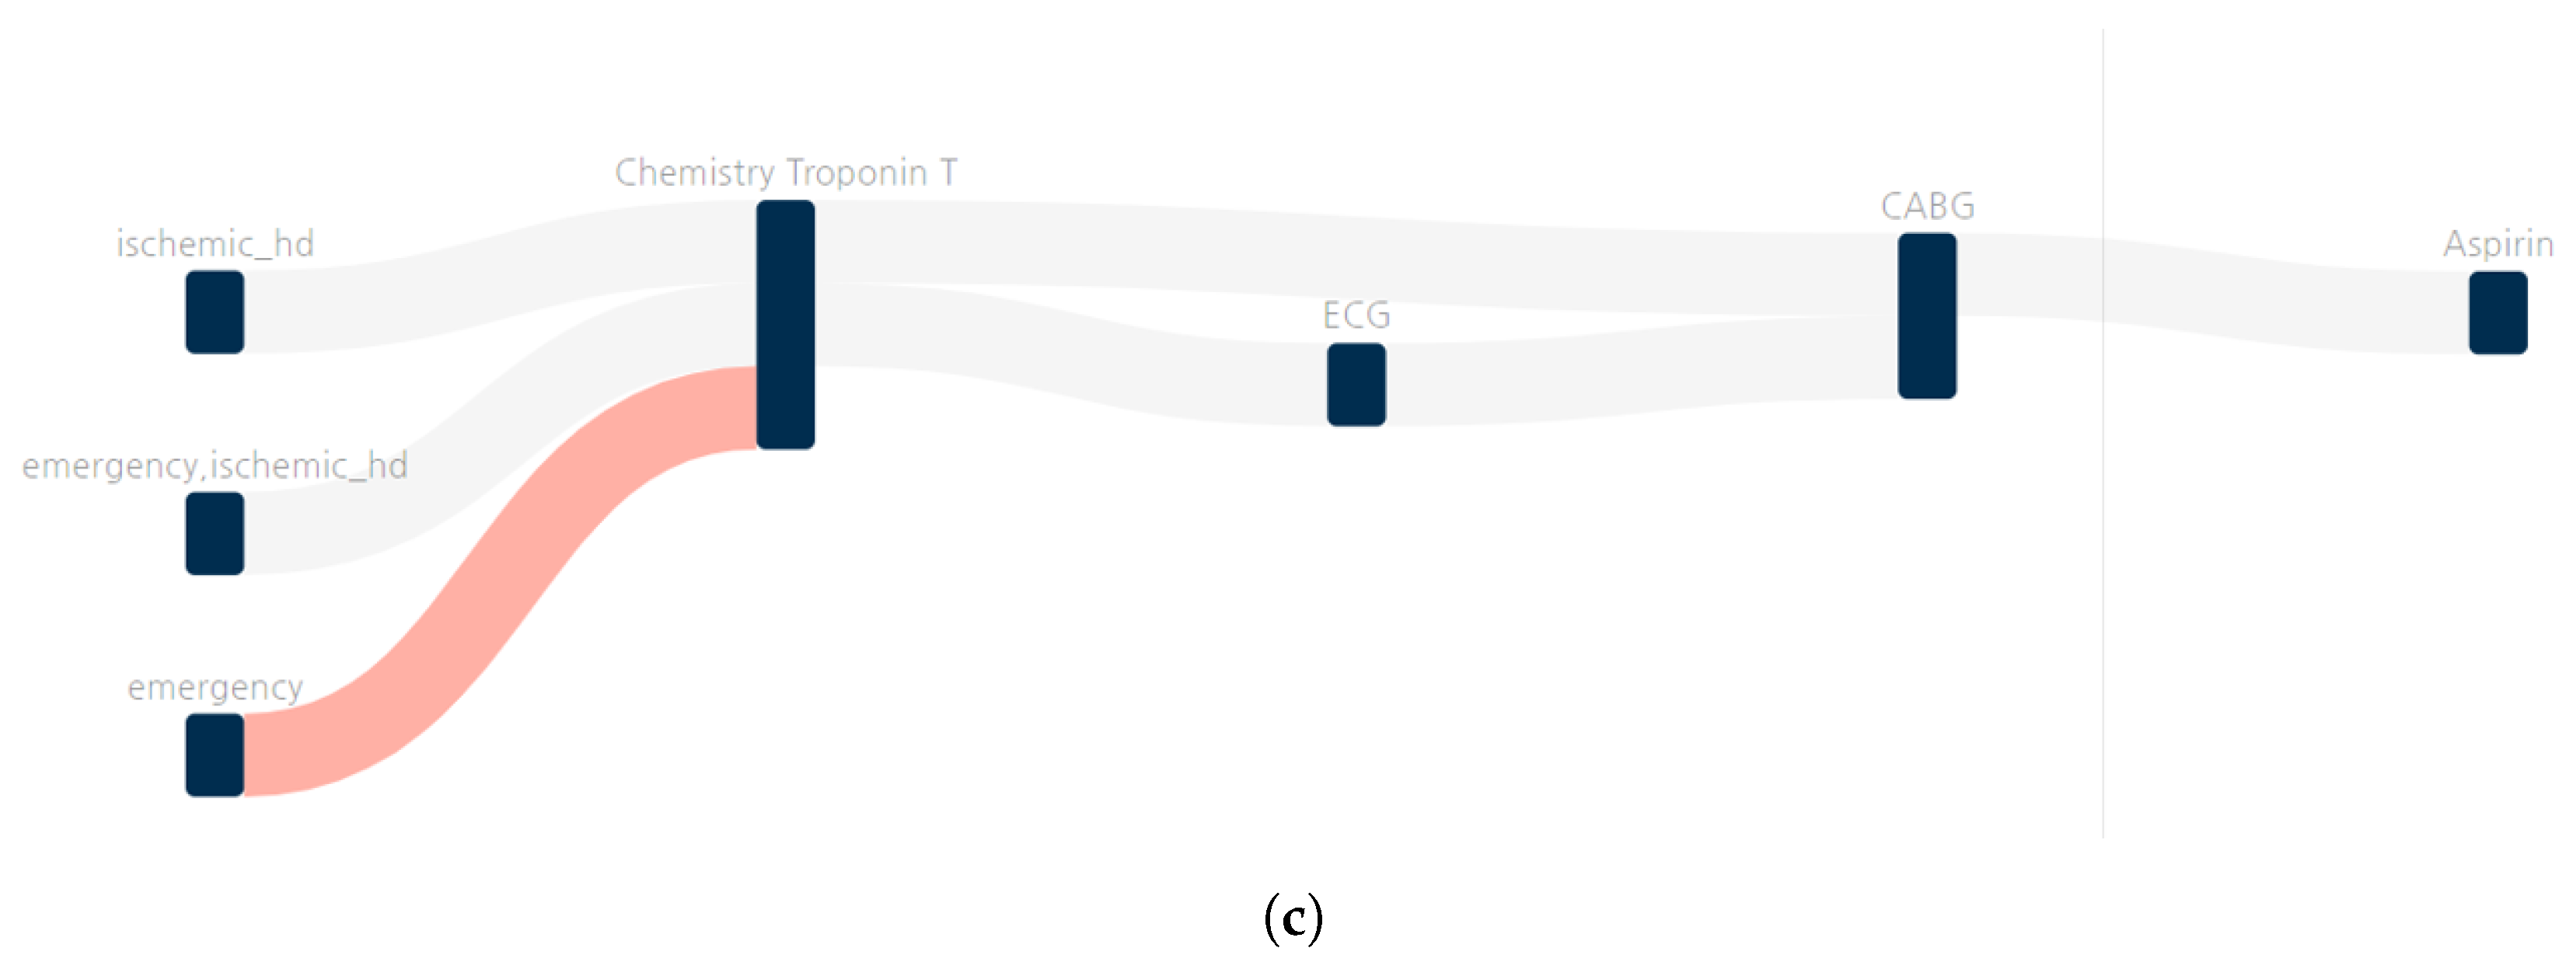
| 1 | Chemistry: Troponin T ->CABG | 0.051 |
| 2 | Chemistry: Troponin T ->ECG ->CABG | 0.046 |
| 3 | Chemistry: Troponin T ->CABG ->Aspirin | 0.046 |
| 4 * | Emergency ->Chemistry: Troponin T ->CABG | 0.05 |
| 5 | Emergency ->Ischemic_hd ->Chemistry: Troponin T ->CABG | 0.049 |
| 6 | Ischemic_hd ->Chemistry: Troponin T ->CABG | 0.05 |
| 7 | Emergency ->Chemistry: Troponin T ->ECG ->CABG | 0.045 |
| 8 | Emergency ->Chemistry: Troponin T ->CABG ->Aspirin | 0.045 |
| 9 | Emergency ->Ischemic_hd ->Chemistry: Troponin T ->ECG ->CABG | 0.044 |
| 10 | Emergency ->Ischemic_hd ->Chemistry: Troponin T ->CABG ->Aspirin | 0.044 |
| 11 | Ischemic_hd ->Chemistry: Troponin T ->ECG ->CABG | 0.045 |
| 12 | Ischemic_hd ->Chemistry: Troponin T ->CABG ->Aspirin | 0.046 |
Publisher’s Note: MDPI stays neutral with regard to jurisdictional claims in published maps and institutional affiliations. |
© 2020 by the authors. Licensee MDPI, Basel, Switzerland. This article is an open access article distributed under the terms and conditions of the Creative Commons Attribution (CC BY) license (http://creativecommons.org/licenses/by/4.0/).
Share and Cite
Hur, C.; Wi, J.; Kim, Y. Facilitating the Development of Deep Learning Models with Visual Analytics for Electronic Health Records. Int. J. Environ. Res. Public Health 2020, 17, 8303. https://doi.org/10.3390/ijerph17228303
Hur C, Wi J, Kim Y. Facilitating the Development of Deep Learning Models with Visual Analytics for Electronic Health Records. International Journal of Environmental Research and Public Health. 2020; 17(22):8303. https://doi.org/10.3390/ijerph17228303
Chicago/Turabian StyleHur, Cinyoung, JeongA Wi, and YoungBin Kim. 2020. "Facilitating the Development of Deep Learning Models with Visual Analytics for Electronic Health Records" International Journal of Environmental Research and Public Health 17, no. 22: 8303. https://doi.org/10.3390/ijerph17228303
APA StyleHur, C., Wi, J., & Kim, Y. (2020). Facilitating the Development of Deep Learning Models with Visual Analytics for Electronic Health Records. International Journal of Environmental Research and Public Health, 17(22), 8303. https://doi.org/10.3390/ijerph17228303