The Quality of Work Index and the Quality of Employment Index: A Multidimensional Approach of Job Quality and Its Links to Well-Being at Work


Abstract
1. Introduction
1.1. Definition and Conceptualization of Job Quality, Quality of Work, and Quality of Employment
1.2. Approaches to Measure Job Quality
1.2.1. Existing Job Quality Indicators
1.2.2. Limitations of Existing Job Quality Indicators
1.3. A New Job Quality Approach
1.3.1. Theoretical Foundation
1.3.2. Methodological Choices
- The selection of working conditions is based on the theoretical and empirical work of social scientists.
- The indicators are defined, constructed and anonymously computed at the individual level,
- Only indicators that are relevant for all working sectors were included,
- A composite index is created based on a system of aggregated indicators (on the basis of equal weights),
- The collected data is based on self-assessments of employees (self-reported, mostly subjective),
- The main job aspects contribute clearly and directly to employees’ well-being (outcome of job quality),
- The theoretically based differentiation between job demands and job resources is respected,
- Only issues which are related to job quality (eliminating labor market access, the distribution of disposable income, etc.) were considered.
1.3.3. Quality of Work
- (a)
- Job design (participation, feedback, autonomy);
- (b)
- Work intensity (mental demands, time pressure, emotional demands);
- (c)
- Social conditions (social support, competition, mobbing); and
- (d)
- Physical conditions (risk of accidents, physical burden).
1.3.4. Quality of Employment
1.3.5. Well-Being Dimensions
2. Methods
2.1. Measures
2.1.1. Quality of Work Index
2.1.2. Quality of Employment Index
2.1.3. Long Work Week and Atypical Working Hours
2.1.4. Well-Being Dimensions
2.2. Translation Process
2.3. Data Collection Procedure
2.4. Sample
2.5. Statistical Analyses
3. Results
3.1. Preliminary Analysis
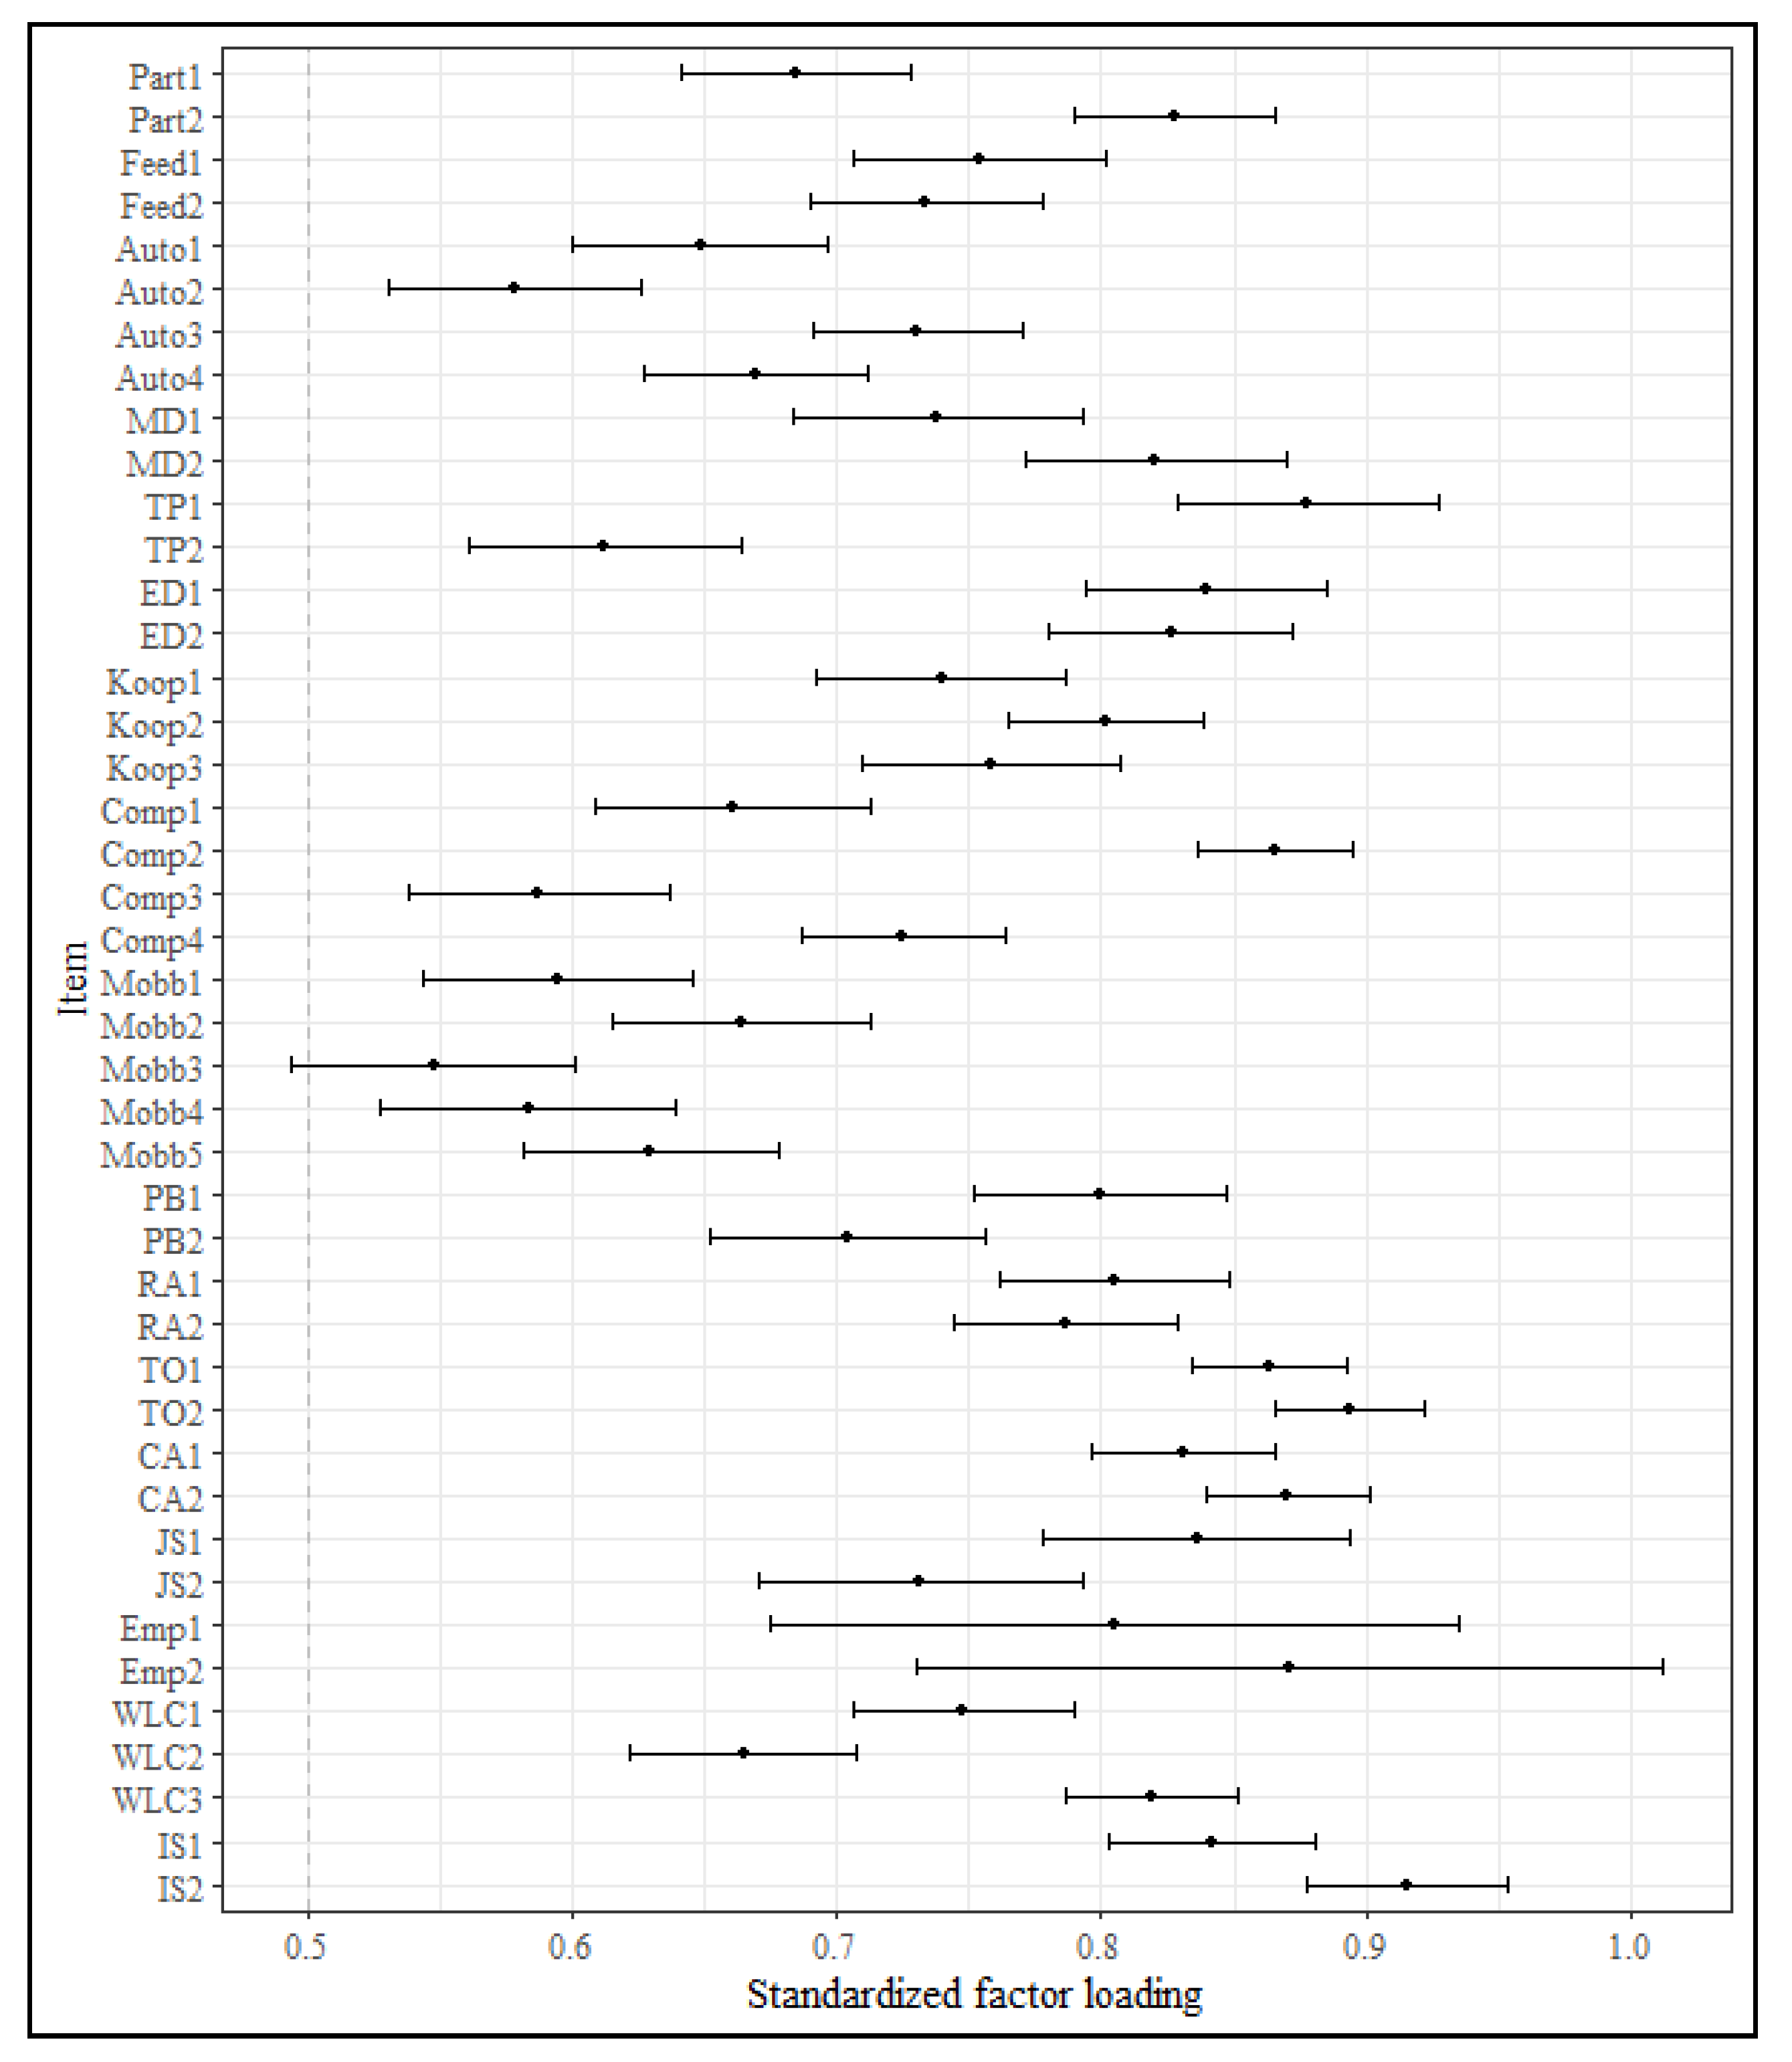
3.2. Factor Structure
3.3. Internal Consistencies
3.4. Intercorrelations
3.5. Multiple Regression Analyses
4. Discussion
5. Conclusions
Author Contributions
Funding
Acknowledgments
Conflicts of Interest
Appendix A

| Area | Dimension | Variable | Item | Answer Category |
|---|---|---|---|---|
| Job design | Participation | Part1 | To what extent are you involved in decisions in your organisation? | 1 (= to a very low extent) to 5 (= to a very large extent) |
| Part2 | To what extent does your superior consider your opinion in decisions or in upcoming changes? | 1 (= to a very low extent) to 5 (= to a very large extent) | ||
| Feedback | Feed1 | To what extent do you receive feedback about your work from your superior or from your colleagues? | 1 (= to a very low extent) to 5 (= to a very large extent) | |
| Feed2 | To what extent do you receive feedback from your superior about your professional competences? | 1 (= to a very low extent) to 5 (= to a very large extent) | ||
| Autonomy | Auto1 | To what extent can you decide how you carry out your work? | 1 (= to a very low extent) to 5 (= to a very large extent) | |
| Auto2 | To what extent can you determine your working hours yourself? | 1 (= to a very low extent) to 5 (= to a very large extent) | ||
| Auto3 | To what extent can you determine the order of your work tasks yourself? | 1 (= to a very low extent) to 5 (= to a very large extent) | ||
| Auto4 | To what extent can you determine the content of your work yourself? | 1 (= to a very low extent) to 5 (= to a very large extent) | ||
| Work intensity | Mental demands | MD1 | To what extent does your work demand concentration? | 1 (= to a very low extent) to 5 (= to a very large extent) |
| MD2 | To what extent is your work intellectually challenging? | 1 (= to a very low extent) to 5 (= to a very large extent) | ||
| Time pressure | TP1 | How often are you under time pressure or rushed in your work? | 1 (= never) to 5 (= (almost) always) | |
| TP2 | How often are you required to meet tight deadlines in your work? | 1 (= never) to 5 (= (almost) always) | ||
| Emotional demands | ED1 | How often does your work require you to control your feelings? | 1 (= never) to 5 (= (almost) always) | |
| ED2 | How often does your work require you to hide your true feelings? | 1 (= never) to 5 (= (almost) always) | ||
| Social conditions | Social support | Sup1 | To what extent are you supported in your work by your colleagues? | 1 (= to a very low extent) to 5 (= to a very large extent) |
| Sup2 | To what extent do you and your colleagues help one another with work-related problems? | 1 (= to a very low extent) to 5 (= to a very large extent) | ||
| Sup3 | To what extent are you able to ask your colleagues for help for work-related problems? | 1 (= to a very low extent) to 5 (= to a very large extent) | ||
| Competition | Comp1 | To what extent are you competing with your colleagues? | 1 (= to a very low extent) to 5 (= to a very large extent) | |
| Comp2 | To what extent is there any competition amongst your colleagues? | 1 (= to a very low extent) to 5 (= to a very large extent) | ||
| Comp3 | To what extent is there competitive pressure in your work area? | 1 (= to a very low extent) to 5 (= to a very large extent) | ||
| Comp4 | To what extent are there rivalries in your group of colleagues? | 1 (= to a very low extent) to 5 (= to a very large extent) | ||
| Mobbing | Mobb1 | How often is your work criticised by your colleagues or by your superior? | 1 (= never) to 5 (= (almost) always) | |
| Mobb2 | How often are you ignored at work by your colleagues or your superior? | 1 (= never) to 5 (= (almost) always) | ||
| Mobb3 | How often are you assigned meaningless tasks by your superior? | 1 (= never) to 5 (= (almost) always) | ||
| Mobb4 | How often are you ridiculed in front of others by your superior or by your colleagues? | 1 (= never) to 5 (= (almost) always) | ||
| Mobb5 | How often are you in conflict with your colleagues or superior? | 1 (= never) to 5 (= (almost) always) | ||
| Physical conditions | Physical burden | PB1 | How often is your work physically strenuous, e.g., does it involve prolonged standing? | 1 (= never) to 5 (= (almost) always) |
| PB2 | How often does your work leave you physically exhausted? | 1 (= never) to 5 (= (almost) always) | ||
| Risk of accident | RA1 | To what extent does your work put you at risk of accident and injury? | 1 (= to a very low extent) to 5 (= to a very large extent) | |
| RA2 | To what extent is your work carried out in working conditions that are harmful to health? | 1 (= to a very low extent) to 5 (= to a very large extent) |
| Area | Variable | Item | Answer Category |
|---|---|---|---|
| Training opportunities | TO1 | To what extent do you have possibilities to engage in further training in your organization? | 1 (= to a very low extent) to 5 (= to a very large extent) |
| TO2 | To what extent does your organization support you to undertake further training? | 1 (= to a very low extent) to 5 (= to a very large extent) | |
| Career advancement | CA1 | To what extent do you have possibilities of advancement and promotion in your organization? | 1 (= to a very low extent) to 5 (= to a very large extent) |
| CA2 | To what extent does your organization support professional advancement or promotion? | 1 (= to a very low extent) to 5 (= to a very large extent) | |
| Job security | JS1 | To what extent do you consider your own job as being safe? | 1 (= to a very low extent) to 5 (= to a very large extent) |
| JS2 | To what extent are you afraid to lose your job? (reversed) | 1 (= to a very low extent) to 5 (= to a very large extent) | |
| Employability | Emp1 | How difficult would it be for you to find a similar job, if you were to lose or resign from your job? (reversed) | 1 (= not difficult at all) to 5 (= very difficult) |
| Emp2 | And how difficult would it be for you to actually find a job, if you were to lose or resign from your job? (reversed) | 1 (= not difficult at all) to 5 (= very difficult) | |
| Work life conflict | WLC1 | How often are you unable to reconcile your work and your private life? | 1 (= never) to 5 (= (almost) always) |
| WLC2 | How difficult is it for you to give the necessary attention to your work as well as your private life? | 1 (= not difficult at all) to 5 (= very difficult) | |
| WLC3 | How often are conflicts arising as a result of the demands of your work and those of your private life? | 1 (= never) to 5 (= (almost) always) | |
| Income satisfaction | IS1 | To what extent does your salary reflect your work input? | 1 (= to a very low extent) to 5 (= to a very large extent) |
| IS2 | How satisfied are you at present with your salary? | 1 (= to a very low extent satisfied) to 5 (= to a very large extent satisfied) |
| Area | Variable | Item | Answer Category |
|---|---|---|---|
| Working time | WT | With reference to the last 12 months, how many hours a week do you work on average? Please include any regular additional time or overtime. | Open ended |
| Atypical working hours | AWH | How many days per month do you work in the evening from 7 PM or at night from 10 PM or at the weekend? | Open ended |
| Area | Variable | Item | Answer Category |
|---|---|---|---|
| Work satisfaction | WS1 | How satisfied are you at present with your work? | 1 (= to a very low extent satisfied) to 5 (= to a very large extent satisfied) |
| WS2 | How satisfied are you at present with the work atmosphere at work? | 1 (= to a very low extent satisfied) to 5 (= to a very large extent satisfied) | |
| WS3 | How satisfied are you at present with the working conditions at work? | 1 (= to a very low extent satisfied) to 5 (= to a very large extent satisfied) | |
| Burnout | Burn1 | How often do you feel exhausted at the end of a working day? | 1 (= never) to 5 (= (almost) always) |
| Burn2 | How often do you feel exhausted in the morning at the thought of a new working day? | 1 (= never) to 5 (= (almost) always) | |
| Burn3 | How often do you feel that every working hour is exhausting for you? | 1 (= never) to 5 (= (almost) always) | |
| Burn4 | To what extent is your work emotionally exhausting? | 1 (= to a very low extent) to 5 (= to a very large extent) | |
| Burn5 | To what extent are you frustrated by your work? | 1 (= to a very low extent) to 5 (= to a very large extent) | |
| Burn6 | To what extent Do you feel burnt out by your work? | 1 (= to a very low extent) to 5 (= to a very large extent) | |
| General well-being (WHO-5) | WHO1 | In the last two weeks I have been happy and in a good mood. | 1 (= at no time) to 5 (= all the time) |
| WHO2 | In the last two weeks I have felt calm and relaxed. | 1 (= at no time) to 5 (= all the time) | |
| WHO3 | In the last two weeks I have felt energetic and active. | 1 (= at no time) to 5 (= all the time) | |
| WHO4 | In the last two weeks I have woken up refreshed and well rested. | 1 (= at no time) to 5 (= all the time) | |
| WHO5 | In the last two weeks my day-to-day life has been busy with things that interest me. | 1 (= at no time) to 5 (= all the time) | |
| Subjective physiological health problems | SPHP1 | How often have you experienced health problems in the last 12 months? | 1 (= never) to 5 (= (almost) always) |
| SPHP2 | How often in the last 12 months have you had heart problems? | 1 (= never) to 5 (= (almost) always) | |
| SPHP3 | How often in the last 12 months have you had headaches? | 1 (= never) to 5 (= (almost) always) | |
| SPHP4 | How often in the last 12 months have you had back problems? | 1 (= never) to 5 (= (almost) always) | |
| SPHP5 | How often in the last 12 months have you had joint problems? | 1 (= never) to 5 (= (almost) always) | |
| SPHP6 | How often in the last 12 months have you had stomach problems? | 1 (= never) to 5 (= (almost) always) | |
| SPHP7 | How often in the last 12 months have you had insomnia? | 1 (= never) to 5 (= (almost) always) | |
| Vigor | Vigor1 | How often do you have the feeling that you are overflowing with energy at work? | 1 (= never) to 5 (= (almost) always) |
| Vigor2 | How often do you feel fit and vigorous at work? | 1 (= never) to 5 (= (almost) always) | |
| Vigor3 | How often do you look forward to going to work as you get up in the morning? | 1 (= never) to 5 (= (almost) always) | |
| Work performance | WP1 | How do you evaluate your overall work performance in comparison with that of your colleagues? | 1 (= below average) to 5 (= above average) |
| WP2 | How does your superior evaluate your overall work performance? | 1 (= below average) to 5 (= above average) |
References
- Balliester, T.; Elsheikhi, A. The Future of Work: A Literature Review. Available online: https://www.ilo.org/wcmsp5/groups/public/---dgreports/---inst/documents/publication/wcms_625866.pdf (accessed on 23 October 2020).
- Trends in Job Quality in Europe; Publications Office of the European Union: Luxembourg, 2012.
- Burchell, B.; Ladipo, D.; Wilkinson, F. (Eds.) Job Insecurity and Work Intensification; Routledge: London, UK, 2002. [Google Scholar]
- Fifth European Working Conditions Survey—Overview Report; Publications Office of the European Union: Luxembourg, 2012; Available online: https://www.eurofound.europa.eu/de/publications/report/2012/working-conditions/fifth-european-working-conditions-survey-overview-report (accessed on 23 October 2020).
- Clark, A.E. Your money or your life: Changing job quality in OECD countries. Br. J. Ind. Relat. 2005, 43, 377–400. [Google Scholar] [CrossRef]
- Green, F. Work intensification, discretion, and the decline in well-being at work. East. Econ. J. 2004, 30, 615–626. [Google Scholar]
- Kalleberg, A.L.; Vaisey, S. Pathways to a good job: Perceived work quality among the machinists in North America. Br. J. Ind. Relat. 2005, 43, 431–454. [Google Scholar] [CrossRef]
- De Bustillo, R.M.; Fernández-Macías, E.; Esteve, F.; Antón, J.I. E pluribus unum? A critical survey of job quality indicators. Socio. Econ. Rev. 2011, 9, 447–475. [Google Scholar] [CrossRef]
- Grote, G.; Guest, D. The case for reinvigorating quality of working life research. Hum. Relat. 2017, 70, 149–167. [Google Scholar] [CrossRef]
- Burchell, B.; Sehnbruch, K.; Piasna, A.; Agloni, N. The quality of employment and decent work: Definitions, methodologies, and ongoing debates. Camb. J. Econ. 2014, 38, 459–477. [Google Scholar] [CrossRef]
- Findlay, P.; Kalleberg, A.L.; Warhurst, C. The challenge of job quality. Hum. Relat. 2013, 66, 441–451. [Google Scholar] [CrossRef]
- Gallie, D. Production regimes and the quality of employment in Europe. Annu. Rev. Sociol. 2007, 33, 85–104. [Google Scholar] [CrossRef]
- Van Aerden, K.; Puig-Barrachina, V.; Bosmans, K.; Vanroelen, C. How does employment quality relate to health and job satisfaction in Europe? A typological approach. Soc. Sci. Med. 2016, 158, 132–140. [Google Scholar] [CrossRef]
- Gallie, D. The quality of working life: Is Scandinavia different? Eur. Sociol. Rev. 2003, 19, 61–79. [Google Scholar] [CrossRef]
- Gallie, D. Production regimes, employment regimes, and the quality of work. In Employment Regimes and the Quality of Work; Gallie, D., Ed.; Oxford University Press: Oxford, UK, 2007; pp. 1–33. [Google Scholar]
- Piasna, A.; Burchell, B.; Sehnbruch, K.; Agloni, N. Job quality: Conceptual and methodological challenges for comparative analysis. In Making Work More Equal; Grimshaw, D., Fagan, C., Hebson, G., Tavora, I., Eds.; Manchester University Press: Manchester, UK, 2017; pp. 168–187. [Google Scholar]
- Steffgen, G.; Kohl, D.; Reese, G.; Happ, C.; Sischka, P. Quality of work: Validation of a new instrument in three languages. Int. J. Environ. Res. Public Health 2015, 12, 14988–15006. [Google Scholar] [CrossRef] [PubMed]
- Muñoz de Bustillo, R.; Fernandez-Macias, E.; Antón, J.I.; Esteve, F. Indicators of Job Quality in the European Union. Available online: https://www.europarl.europa.eu/document/activities/cont/201107/20110718ATT24284/20110718ATT24284EN.pdf (accessed on 23 October 2020).
- De Bustillo, R.M.; Fernandez-Macias, E.; Antón, J.I.; Esteve, F. Measuring more than Money: The Social Economics of Job Quality; Edward Elgar: Cheltenham, UK, 2011. [Google Scholar]
- Cazes, S.; Hijzen, A.; Saint-Martin, A. Measuring and assessing job quality. The OECED job quality framework. Oecd Soc. Employ. Migr. Work. Pap. 2015, 174. [Google Scholar] [CrossRef]
- Ritter, J.A.; Anker, R. Good jobs, bad jobs: Workers’ evaluations in five countries. Int. Labour Rev. 2002, 141, 331–358. [Google Scholar] [CrossRef]
- Sixth European Working Conditions Survey—Technical Report. Available online: http://www.eurofound.europa.eu/sites/default/files/ef_survey/field_ef_documents/6th_ewcs_-_technical_report.pdf (accessed on 23 October 2020).
- Leschke, J.; Watt, A.; Finn, M. Putting a Number on Job Quality? Constructing a European Job Quality Index. Available online: https://library.fes.de/pdf-files/gurn/00367.pdf (accessed on 23 October 2020).
- Leschke, J.; Watt, A. Challenges in constructing a multi-dimensional European job quality index. Soc. Indic. Res. 2014, 118, 1–31. [Google Scholar] [CrossRef]
- Holler, M.; Krüger, T.; Mußmann, F. Die Weiterentwicklung des DGB-Index Gute Arbeit. Z. Für Arb. 2014, 68, 163–174. [Google Scholar] [CrossRef]
- European Commission (Ed.) Employment in Europe 2008; Office for Official Publications of the European Communities: Luxembourg, 2008. [Google Scholar]
- Jackson, A.; Kumar, P. Measuring and monitoring the quality of jobs and the work environment in Canada. In Proceedings of the CSLS Conference on the State of Living Standards and the Quality of Life, Centre for the Study of Living Standards, Ottawa, ON, Canada, 31 October 1998. [Google Scholar]
- Caprile, M.; Potrony, J. IQT. Objetivos y metodología. In Anuario Sociolaboral de la UGT de Catalunya; UGT, Ed.; UGT and CRESC: Barcelona, Spain, 2005; Volume 2, pp. 53–63. [Google Scholar]
- European Commission. Employment and Social Policy: A Framework for Investing in Quality; Communication from the Commission to the European Parliament, the Economic and Social Committee and the Committee of the Regions, COM: Brussels, Belgium, 2001; p. 313. [Google Scholar]
- Union of Industrials and Employers’ Confederations of Europe (UNICE). UNICE Position Paper on the Commission Communication “Employment and Social Policies: A Framework for Investing in Quality”. Available online: http://www.businesseurope.eu (accessed on 23 October 2020).
- Employment Committee (EMCO). Quality in Work—Thematic Review 2010; Employment Committee (EMCO): Brussels, Belgium, 2010. [Google Scholar]
- International Labour Organization (ILO). Decent Work Indicators: Concepts and Definitions; ILO Manual: Geneva, Sweden, 2012. [Google Scholar]
- Sixth European Working Conditions Survey—Overview Report; Publications Office of the European Union: Luxembourg, 2016.
- United Nations Economic Commission for Europe (UNECE). Handbook on Measuring Quality of Employment. A Statistical Framework; United Nations Economic Commission for Europe: New York, NY, USA, 2015. [Google Scholar]
- Vandenbrande, T.; Vandekerckhove, S.; Vendramin, P.; Valenduc, G.; Huys, R.; Van Hootegem, G.; De Witte, H. Quality of Work and Employment in Belgium; Eurofound: Dublin, Ireland, 2013. [Google Scholar]
- Díaz-Chao, Á.; Ficapal-Cusí, P.; Torrent Sellens, J. Workplace or Working Environment? Job Quality and Economic Crisis in Spain; Internet Interdisciplinary Institute, Open University of Catalonia (UOC): Barcelona, Spain, 2014. [Google Scholar]
- Hauff, S.; Kirchner, S. Cross-National Differences and Trends in Job Quality. A Literature Review and Research Agenda; Universität Hamburg: Hamburg, Germany, 2014. [Google Scholar]
- Vandenberg, R.J.; Lance, C.E. A review and synthesis of the measurement invariance literature: Suggestions, practices, and recommendations for organizational research. Organ. Res. Methods 2000, 3, 4–70. [Google Scholar] [CrossRef]
- Humphrey, S.E.; Nahrgang, J.D.; Morgeson, F.P. Integrating motivational, social, and contextual work design features: A meta-analytic summary and theoretical extension of the work design literature. J. Appl. Psychol. 2007, 92, 1332–1356. [Google Scholar] [CrossRef]
- Karasek, R.A. Job demands, job decision latitude, and mental strain: Implications for job redesign. Adm. Sci. Q 1979, 24, 285–308. [Google Scholar] [CrossRef]
- Johnson, J.V.; Hall, E.M. Job strain, work place social support, and cardiovascular disease: A cross-sectional study of a random sample of the Swedish working population. Am. J. Public Health 1988, 78, 1336–1342. [Google Scholar] [CrossRef]
- Bakker, A.B.; Demerouti, E. The job demands-resources model: State of the art. J. Manag. Psychol. 2007, 22, 309–328. [Google Scholar] [CrossRef]
- Bakker, A.B.; Demerouti, E. Job demands–resources theory: Taking stock and looking forward. J. Occup. Health Psychol. 2017, 22, 273–285. [Google Scholar] [CrossRef]
- Bakker, A.B.; Demerouti, E.; De Boer, E.; Schaufeli, W.B. Job demands and job resources as predictors of absence duration and frequency. J. Vocat. Behav. 2003, 62, 341–356. [Google Scholar] [CrossRef]
- Bakker, A.B.; Demerouti, E.; Euwema, M.C. Job resources buffer the impact of job demands on burnout. J. Occup. Health Psychol. 2005, 10, 170–180. [Google Scholar] [CrossRef] [PubMed]
- Llorens, S.; Bakker, A.B.; Schaufeli, W.; Salanova, M. Testing the robustness of the job demands-resources model. Int. J. Stress Manag. 2006, 13, 378–391. [Google Scholar] [CrossRef]
- Jackson, S.E. Participation in decision making as a strategy for reducing job-related strain. J. Appl. Psychol. 1983, 68, 3–19. [Google Scholar] [CrossRef]
- Reeves, D.W.; Walsh, B.M.; Tuller, M.D.; Magley, V.J. The positive effects of participative decision making for midlevel correctional management. Crim. Justice Behav. 2012, 39, 1361–1372. [Google Scholar] [CrossRef]
- Gallie, D. Direct participation and the quality of work. Hum. Relat. 2013, 66, 453–473. [Google Scholar] [CrossRef]
- Crawford, E.R.; LePine, J.A.; Rich, B.L. Linking job demands and resources to employee engagement and burnout: A theoretical extension and meta-analytic test. J. Appl. Psychol. 2010, 95, 834–848. [Google Scholar] [CrossRef]
- Nielsen, K.; Nielsen, M.B.; Ogbonnaya, C.; Känsälä, M.; Saari, E.; Isaksson, K. Workplace resources to improve both employee well-being and performance: A systematic review and meta-analysis. Work Stress 2017, 31, 101–120. [Google Scholar] [CrossRef]
- Alarcon, G.M. A meta-analysis of burnout with job demands, resources, and attitudes. J. Vocat. Behav. 2011, 79, 549–562. [Google Scholar] [CrossRef]
- Halbesleben, J.R. A meta-analysis of work engagement: Relationships with burnout, demands, resources, and consequences. In Work Engagement: A Handbook of Essential Theory and Research; Bakker, A.B., Leiter, M.P., Eds.; Psychology Press: Hove, UK, 2010; pp. 102–117. [Google Scholar]
- Meijman, T.F.; Mulder, G. Psychological aspects of workload. In Handbook of Work and Organizational Psychology, Volume 2, Work psychology, 2nd ed.; Drenth, P.J.D., Thierry, H., Wolff, C.J.D., Eds.; Psychology Press: Hove, UK, 1998; pp. 5–39. [Google Scholar]
- Michélsen, H.; Bildt, C. Psychosocial conditions on and off the job and psychological ill health: Depressive symptoms, impaired psychological wellbeing, heavy consumption of alcohol. Occup. Environ. Med. 2003, 60, 489–496. [Google Scholar] [CrossRef]
- LePine, J.A.; Podsakoff, N.P.; LePine, M.A. A meta-analytic test of the challenge stressor–hindrance stressor framework: An explanation for inconsistent relationships among stressors and performance. Acad. Manag. J. 2005, 48, 764–775. [Google Scholar] [CrossRef]
- Ilies, R.; Dimotakis, N.; De Pater, I.E. Psychological and physiological reactions to high workloads: Implications for well-being. Pers. Psychol. 2010, 63, 407–436. [Google Scholar] [CrossRef]
- Sonnentag, S.; Arbeus, H.; Mahn, C.; Fritz, C. Exhaustion and lack of psychological detachment from work during off-job time: Moderator effects of time pressure and leisure experiences. J. Occup. Health Psychol. 2014, 19, 206–216. [Google Scholar] [CrossRef]
- Hülsheger, U.R.; Schewe, A.F. On the costs and benefits of emotional labor: A meta-analysis of three decades of research. J. Occup. Health Psychol. 2011, 16, 361–389. [Google Scholar] [CrossRef]
- Zapf, D. Emotion work and psychological well-being: A review of the literature and some conceptual considerations. Hum. Resour. Manag. Rev. 2002, 12, 237–268. [Google Scholar] [CrossRef]
- Viswesvaran, C.; Sanchez, J.I.; Fisher, J. The role of social support in the process of work stress: A meta-analysis. J. Vocat. Behav. 1999, 54, 314–334. [Google Scholar] [CrossRef]
- Keller, A.C.; Spurk, D.; Baumeler, F.; Hirschi, A. Competitive climate and workaholism: Negative sides of future orientation and calling. Personal. Individ. Differ. 2016, 96, 122–126. [Google Scholar] [CrossRef]
- Agervold, M.; Mikkelsen, E.G. Relationships between bullying, psychosocial work environment and individual stress reactions. Work Stress 2004, 18, 336–351. [Google Scholar] [CrossRef]
- Nielsen, M.B.; Einarsen, S. Outcomes of exposure to workplace bullying: A meta-analytic review. Work Stress 2012, 26, 309–332. [Google Scholar] [CrossRef]
- Nahrgang, J.D.; Morgeson, F.P.; Hofmann, D.A. Safety at work: A meta-analytic investigation of the link between job demands, job resources, burnout, engagement, and safety outcomes. J. Appl. Psychol. 2011, 96, 71–94. [Google Scholar] [CrossRef] [PubMed]
- Bailey, T.S.; Dollard, M.F.; McLinton, S.S.; Richards, P.A. Psychosocial safety climate, psychosocial and physical factors in the aetiology of musculoskeletal disorder symptoms and workplace injury compensation claims. Work Stress 2015, 29, 190–211. [Google Scholar] [CrossRef]
- Burr, H.; Pohrt, A.; Rugulies, R.; Holtermann, A.; Hasselhorn, H.M. Does age modify the association between physical work demands and deterioration of self-rated general health? Scand. J. Work. Health 2017, 43, 241–249. [Google Scholar] [CrossRef] [PubMed]
- Schmidt, S.W. The relationship between satisfaction with workplace training and overall job satisfaction. Hum. Resour. Dev. Q 2007, 18, 481–498. [Google Scholar] [CrossRef]
- Bakker, A.B. An evidence-based model of work engagement. Curr. Dir. Psychol. Sci. 2011, 20, 265–269. [Google Scholar] [CrossRef]
- Koster, F.; De Grip, A.; Fouarge, D. Does perceived support in employee development affect personnel turnover? Int. J. Hum. Resour. Manag. 2011, 22, 2403–2418. [Google Scholar] [CrossRef]
- Kalleberg, A.L. Work values and job rewards: A theory of job satisfaction. Am. Sociol. Rev. 1977, 42, 124–143. [Google Scholar] [CrossRef]
- Poon, J.M. Relationships among perceived career support, affective commitment, and work engagement. Int. J. Psychol. 2013, 48, 1148–1155. [Google Scholar] [CrossRef]
- Kraimer, M.L.; Seibert, S.E.; Wayne, S.J.; Liden, R.C.; Bravo, J. Antecedents and outcomes of organizational support for development: The critical role of career opportunities. J. Appl. Psychol. 2011, 96, 485–500. [Google Scholar] [CrossRef]
- Sverke, M.; Hellgren, J.; Näswall, K. No security: A meta-analysis and review of job insecurity and its consequences. J. Occup. Health Psychol. 2002, 7, 242–264. [Google Scholar] [CrossRef]
- De Cuyper, N.; Bernhard-Oettel, C.; Berntson, E.; Witte, H.D.; Alarco, B. Employability and employees’ well-being: Mediation by job insecurity. Appl. Psychol. 2008, 57, 488–509. [Google Scholar] [CrossRef]
- Lunau, T.; Bambra, C.; Eikemo, T.A.; Van der Wel, K.A.; Dragano, N. A balancing act? Work–life balance, health and well-being in European welfare states. Eur. J. Public Health 2014, 24, 422–427. [Google Scholar] [CrossRef] [PubMed]
- Nohe, C.; Meier, L.L.; Sonntag, K.; Michel, A. The chicken or the egg? A meta-analysis of panel studies of the relationship between work–family conflict and strain. J. Appl. Psychol. 2015, 100, 522–536. [Google Scholar] [CrossRef] [PubMed]
- Williams, M.L.; McDaniel, M.A.; Nguyen, N.T. A meta-analysis of the antecedents and consequences of pay level satisfaction. J. Appl. Psychol. 2006, 91, 392–413. [Google Scholar] [CrossRef] [PubMed]
- Kahneman, D.; Deaton, A. High income improves evaluation of life but not emotional well-being. Proc. Natl. Acad. Sci. USA 2010, 107, 16489–16493. [Google Scholar] [CrossRef] [PubMed]
- Boyce, C.J.; Brown, G.D.; Moore, S.C. Money and happiness: Rank of income, not income, affects life satisfaction. Psychol. Sci. 2010, 21, 471–475. [Google Scholar] [CrossRef]
- Hakanen, J.J.; Schaufeli, W.B.; Ahola, K. The job demands-resources model: A three-year cross-lagged study of burnout, depression, commitment, and work engagement. Work Stress 2008, 22, 224–241. [Google Scholar] [CrossRef]
- Nixon, A.E.; Mazzola, J.J.; Bauer, J.; Krueger, J.R.; Spector, P.E. Can work make you sick? A meta-analysis of the relationships between job stressors and physical symptoms. Work Stress 2011, 25, 1–22. [Google Scholar] [CrossRef]
- Bowling, N.A.; Eschleman, K.J.; Wang, Q. A meta-analytic examination of the relationship between job satisfaction and subjective well-being. J. Occup. Organ. Psychol. 2010, 83, 915–934. [Google Scholar] [CrossRef]
- Harrison, D.A.; Newman, D.A.; Roth, P.L. How important are job attitudes? Meta-analytic comparisons of integrative behavioral outcomes and time sequences. Acad. Manag. J. 2006, 49, 305–325. [Google Scholar] [CrossRef]
- Tett, R.P.; Meyer, J.P. Job satisfaction, organizational commitment, turnover intention, and turnover: Path analyses based on meta-analytic findings. Pers. Psychol. 1993, 46, 259–293. [Google Scholar] [CrossRef]
- Schaufeli, W.B.; Bakker, A.B.; Salanova, M. The measurement of work engagement with a short questionnaire: A cross-national study. Educ. Psychol. Meas. 2006, 66, 701–716. [Google Scholar] [CrossRef]
- González-Romá, V.; Schaufeli, W.B.; Bakker, A.B.; Lloret, S. Burnout and work engagement: Independent factors or opposite poles? J. Vocat. Behav. 2006, 68, 165–174. [Google Scholar] [CrossRef]
- Leymann, H. Handanleitung für den LIPT-Fragebogen; [Leymann Inventory of Psychological Terror]; Deutsche Gesellschaft für Verhaltenstherapie Verlag: Tübingen, Germany, 1996. [Google Scholar]
- Morgeson, F.P.; Humphrey, S.E. The Work Design Questionnaire (WDQ): Developing and validating a comprehensive measure for assessing job design and the nature of work. J. Appl. Psychol. 2006, 91, 1321–1339. [Google Scholar] [CrossRef]
- Burr, H.; Berthelsen, H.; Moncada, S.; Nübling, M.; Dupret, E.; Demiral, Y.; Oudyk, J.; Kristensen, T.S.; Llorens, C.; Navarro, A.; et al. The third version of the Copenhagen Psychosocial Questionnaire. Safety Health Work 2019, 10, 482–503. [Google Scholar] [CrossRef]
- Tourangeau, R.; Rips, L.J.; Rasinski, K. The Psychology of Survey Response; University Press: Cambridge, UK, 2000. [Google Scholar]
- Rammstedt, B.; Beierlein, C. Can’t we make it any shorter? J. Individ. Differ. 2014, 35, 212–220. [Google Scholar] [CrossRef]
- Fisher, G.G.; Matthews, R.A.; Gibbons, A.M. Developing and investigating the use of single-item measures in organizational research. J. Occup. Health Psychol. 2016, 21, 3–23. [Google Scholar] [CrossRef]
- Steffgen, G.; Sischka, P.; Schmidt, A.F.; Kohl, D.; Happ, C. The Luxembourg workplace mobbing scale. Psychometric properties of a short instrument in three different languages. Eur. J. Psychol. Assess. 2019, 35, 164–171. [Google Scholar] [CrossRef]
- Sischka, P.E.; Schmidt, A.F.; Steffgen, G. Further evidence for criterion validity and measurement invariance of the Luxembourg Workplace Mobbing Scale. Eur. J. Psychol. Assess. 2020, 36, 32–43. [Google Scholar] [CrossRef]
- Kristensen, T.S.; Borritz, M.; Villadsen, E.; Christensen, K.B. The copenhagen burnout inventory: A new tool for the assessment of burnout. Work Stress 2005, 19, 192–207. [Google Scholar] [CrossRef]
- World Health Organization (WHO). Well-Being Measures in Primary Health Care: The DepCare Project; WHO Regional Office for Europe: Copenhagen, Denmark, 1998. [Google Scholar]
- Topp, C.W.; Østergaard, S.D.; Søndergaard, S.; Bech, P. The WHO-5 Well-Being Index: A systematic review of the literature. Psychother. Psychosom. 2015, 84, 167–176. [Google Scholar] [CrossRef] [PubMed]
- Sischka, P.E.; Costa, A.P.; Steffgen, G.; Schmidt, A.F. The WHO-5 Well-Being Index—Validation based on item response theory and the analysis of measurement invariance across 35 countries. 2020; Unpublished manuscript. [Google Scholar]
- Ercikan, K.; Lyons-Thomas, J. Adapting tests for use in other languages and cultures. In APA Handbook of Testing and Assessment in Psychology, Vol. 3: Testing and Assessment in School Psychology and Education; Geisinger, K.F., Bracken, B.A., Carlson, J.F., Hansen, J.I.C., Kuncel, N.R., Reise, S.P., Rodriguez, M.C., Eds.; American Psychological Association: Washington, DC, USA, 2013; pp. 545–569. [Google Scholar]
- Van Widenfelt, B.M.; Treffers, P.D.; De Beurs, E.; Siebelink, B.M.; Koudijs, E. Translation and cross-cultural adaptation of assessment instruments used in psychological research with children and families. Clin. Child Family Psychol. Rev. 2005, 8, 135–147. [Google Scholar] [CrossRef] [PubMed]
- Schneiderat, G.; Schlinzig, T. Mobile-and landline-onlys in dual-frame-approaches: Effects on sample quality. In Telephone Surveys in Europe; Häder, S., Häder, M., Kühne, M., Eds.; Springer: Berlin, Germany, 2012; pp. 121–143. [Google Scholar]
- Sischka, P.; Steffgen, G. Quality of Work-Index. 5. Forschungsbericht zur Weiterentwicklung des Arbeitsqualitätsindexes in Luxembourg; Universität Luxemburg: Luxembourg, 2019. [Google Scholar]
- Van Buuren, S. Flexible Imputation of Missing Data, 2nd ed.; CRC Press: Boca Raton, FL, USA, 2018. [Google Scholar]
- Eekhout, I.; De Vet, H.C.; De Boer, M.R.; Twisk, J.W.; Heymans, M.W. Passive imputation and parcel summaries are both valid to handle missing items in studies with many multi-item scales. Stat. Methods Med. Res. 2018, 27, 1128–1140. [Google Scholar] [CrossRef]
- Rubin, D.B. Multiple Imputation for Nonresponse in Surveys; John Wiley & Sons: New York, NY, USA, 1987. [Google Scholar]
- Sass, D.A. Testing measurement invariance and comparing latent factor means within a confirmatory factor analysis framework. J. Psychoeduc. Assess. 2011, 29, 347–363. [Google Scholar] [CrossRef]
- Yuan, K.H.; Bentler, P.M. Three likelihood-based methods for mean and covariance structure analysis with nonnormal missing data. Sociol. Methodol. 2000, 30, 165–200. [Google Scholar] [CrossRef]
- Finney, S.J.; DiStefano, C. Nonnormal and categorical data in structural equation modeling. In Structural Equation Modeling—A Second Course, 2nd ed.; Hancock, G.R., Mueller, R.O., Eds.; Information Age Publishing: Charlotte, NC, USA, 2013; pp. 439–492. [Google Scholar]
- Little, T.D. Longitudinal Structural Equation Modeling; Guilford Press: New York, NY, USA, 2013. [Google Scholar]
- Lee, J.; Little, T.D.; Preacher, K.J. Methodological issues in using structural equation models for testing differential item functioning. In Cross-Cultural Data Analysis: Methods and Applications; Davidov, E., Schmidt, P., Billiet, J., Eds.; Routledge: New York, NY, USA, 2011; pp. 55–84. [Google Scholar]
- Cheung, G.W.; Rensvold, R.B. Evaluating goodness-of-fit indexes for testing measurement invariance. Struct. Equ. Modeling 2002, 9, 233–255. [Google Scholar] [CrossRef]
- Chen, F.F. Sensitivity of goodness of fit indexes to lack of measurement invariance. Struct. Equ. Model. 2007, 14, 464–504. [Google Scholar] [CrossRef]
- Meade, A.W.; Johnson, E.C.; Braddy, P.W. Power and sensitivity of alternative fit indices in tests of measurement invariance. J. Appl. Psychol. 2008, 93, 568–592. [Google Scholar] [CrossRef]
- Enders, C.K.; Bandalos, D.L. The relative performance of full information maximum likelihood estimation for missing data in structural equation models. Struct. Equ. Model. 2001, 8, 430–457. [Google Scholar] [CrossRef]
- R Core Team. R: A Language and Environment for Statistical Computing; R Foundation for Statistical Computing: Vienna, Austria, 2020. [Google Scholar]
- Van Buuren, S.; Groothuis-Oudshoorn, K. Mice: Multivariate imputation by chained equations in R. J. Stat. Softw. 2011, 45, 1–67. [Google Scholar] [CrossRef]
- Robitsch, A.; Grund, S.; Henke, T. miceadds. Some Additional Multiple Imputation Functions, Especially for ‘Mice’, Version 3.10-28, R Package. 2020. Available online: https://cran.r-project.org/web/packages/miceadds/index.html (accessed on 23 October 2020).
- Tierney, N.; Cook, D.; McBain, M.; Fay, C.; O’Hara-Wild, M.; Hester, J.; Smith, L. Naniar: Data Structures, Summaries, and Visualisations for Missing Data, Version 0.6.0, R package. 2020. Available online: https://cran.r-project.org/web/packages/naniar/index.html (accessed on 23 October 2020).
- Rosseel, Y. lavaan: An r package for structural equation modeling. J. Stat. Softw. 2012, 48, 1–36. [Google Scholar] [CrossRef]
- Jorgensen, T.D.; Pornprasertmanit, S.; Schoemann, A.M.; Rosseel, Y.; Miller, P.; Quick, C.; Ben-Shachar, M.S. semTools: Useful Tools for Structural Equation Modeling, Version 0.5-3, R package. 2020. Available online: https://cran.r-project.org/web/packages/semTools/index.html (accessed on 23 October 2020).
- Wickham, H.; Chang, W.; Henry, L.; Pedersen, T.L.; Takahashi, K.; Wilke, C.; Woo, K.; Yutani, H.; Dunnington, D. RStudio. ggplot2: Create Elegant Data Visualisations Using the Grammar of Graphics, Version 3.3.1, R Package. 2020. Available online: https://cran.r-project.org/web/packages/ggplot2/index.html (accessed on 23 October 2020).
- Verkuil, B.; Atasayi, S.; Molendijk, M.L. Workplace bullying and mental health: A meta-analysis on cross-sectional and longitudinal data. PLoS ONE 2015, 10, e0135225. [Google Scholar] [CrossRef]
- Hauge, L.J.; Skogstad, A.; Einarsen, S. The relative impact of workplace bullying as a social stressor at work. Scand. J. Psychol. 2010, 51, 426–433. [Google Scholar] [CrossRef] [PubMed]
- Hansen, A.M.; Hogh, A.; Persson, R.; Karlson, B.; Garde, A.H.; Orbaek, P. Bullying at work, health outcomes, and physiological stress response. J. Psychosom. Res. 2006, 60, 63–72. [Google Scholar] [CrossRef]
- Tuckey, M.R.; Neall, A.M. Workplace bullying erodes job and personal resources: Between-and within-person perspectives. J. Occup. Health Psychol. 2014, 19, 413–424. [Google Scholar] [CrossRef]
- Vega, G.; Comer, D.R. Sticks and stones may break your bones, but words can break your spirit: Bullying in the workplace. J. Bus. Ethics 2005, 58, 101–109. [Google Scholar] [CrossRef]
- Amstad, F.T.; Meier, L.L.; Fasel, U.; Elfering, A.; Semmer, N.K. A meta-analysis of work–family conflict and various outcomes with a special emphasis on cross-domain versus matching-domain relations. J. Occup. Health Psychol. 2011, 16, 151–169. [Google Scholar] [CrossRef]
- Nunnally, J.C.; Bernstein, I.H. Psychometric Theory, 3rd ed.; McGraw-Hill: New York, NY, USA, 1994. [Google Scholar]
- Streiner, D.L. Starting at the beginning: An introduction to coefficient alpha and internal consistency. J. Personal. Assess. 2003, 80, 99–103. [Google Scholar] [CrossRef]
- Elovainio, M.; Heponiemi, T.; Jokela, M.; Hakulinen, C.; Presseau, J.; Aalto, A.M.; Kivimäki, M. Stressful work environment and wellbeing: What comes first? J. Occup. Health Psychol. 2015, 20, 289–300. [Google Scholar] [CrossRef]
- Weigold, A.; Weigold, I.K.; Russell, E. Examination of the equivalence of self-report survey-based paper-and-pencil and internet data collection methods. Psychol. Methods 2013, 18, 53–70. [Google Scholar] [CrossRef] [PubMed]
- Lang, F.R.; John, D.; Lüdtke, O.; Schupp, J.; Wagner, G.G. Short assessment of the Big Five: Robust across survey methods except telephone interviewing. Behav. Res. Methods 2011, 43, 548–567. [Google Scholar] [CrossRef] [PubMed]

| Job Quality (EWCS; Eurofound, 2016) | QoW and QoE | ||
|---|---|---|---|
| Area | Dimension | Area | Dimension |
| Skills and discretion | Cognitive dimension Decision latitude Organizational participation Training | Job design (resources) | Participation Feedback Autonomy |
| Work intensity | Quantitative demands Pace determinants and interdependency Emotional demands | Work intensity (demands) | Mental demands Time pressure Emotional demands |
| Social environment | Adverse social behavior Social support Management quality | Social conditions | Social support Competition Mobbing |
| Physical environment | Posture related Ambient Biological & chemical | Physical conditions | Physical burden Risk of accident |
| Working time quality (objective) | Duration Atypical working time Working time arrangements Flexibility | Working time index | Items |
| Prospects | Employment status Career prospects Job security Downsizing | Quality of employment | Training opportunities Career advancement Job security Employability |
| Earnings (objective) | wages | Income satisfaction | |
| n (%) | Total | Language Version | Differences | |||
|---|---|---|---|---|---|---|
| Luxembourgish | French | German | ||||
| Gender | Men | 871 (57.2) | 340 (51.4) | 399 (61.5) | 106 (61.6) | χ2(2) = 15.406 ** |
| Women | 651 (42.8) | 322 (48.6) | 250 (38.5) | 66 (38.4) | ||
| Age M (SD) | 46.2 (9.0) | 45.8 (9.7) | 46.3 (8.4) | 47.5 (8.4) | F(1, 1481) = 4.801 * | |
| Nationality | Luxembourgish | 606 (39.9) | 580 (87.7) | 20 (3.1) | 6 (3.5) | χ2(8) = 2332.5 *** |
| French | 372 (24.5) | 18 (2.7) | 352 (54.3) | 2 (1.2) | ||
| German | 156 (10.3) | 4 (0.6) | 1 (0.2) | 151 (87.8) | ||
| Belgian | 185 (12.2) | 12 (1.8) | 166 (25.6) | 7 (4.1) | ||
| Other | 201 (13.2) | 47 (7.1) | 109 (16.8) | 6 (3.5) | ||
| Residence | Luxembourg | 913 (60) | 643 (97.1) | 209 (32.2) | 24 (14) | χ2(6) = 1781.6 *** |
| France | 301 (19.8) | 12 (1.8) | 289 (44.5) | 0 (0) | ||
| Germany | 149 (9.8) | 0 (0) | 7 (1.1) | 140 (81.4) | ||
| Belgium | 159 (10.4) | 7 (1.1) | 144 (22.2) | 8 (4.7) | ||
| Education | ISCED 1 | 46 (3) | 13 (2) | 29 (4.5) | 2 (1.2) | χ2(14) = 49.895 *** |
| ISCED 2 | 142 (9.4) | 68 (10.3) | 50 (7.7) | 11 (6.4) | ||
| ISCED 3 | 549 (36.2) | 279 (42.4) | 201 (31) | 65 (37.8) | ||
| ISCED 4 | 106 (7) | 45 (6.8) | 43 (6.6) | 16 (9.3) | ||
| ISCED 5 | 108 (7.1) | 34 (5.2) | 57 (8.8) | 15 (8.7) | ||
| ISCED 6 | 236 (15.5) | 105 (16) | 110 (16.9) | 16 (9.3) | ||
| ISCED 7 | 303 (20) | 101 (15.3) | 148 (22.8) | 43 (25) | ||
| ISCED 8 | 28 (1.8) | 13 (2) | 11 (1.7) | 4 (2.3) | ||
| Work sector (Isco-08) | Armed forces | 2 (0.1) | 2 (0.3) | 0 (0) | 0 (0) | χ2(18) = 62.008 *** |
| Managers | 75 (5) | 30 (4.6) | 36 (5.6) | 6 (3.5) | ||
| Professional | 426 (28.3) | 184 (28.2) | 179 (27.8) | 52 (30.2) | ||
| Technicians | 377 (25) | 189 (28.9) | 134 (20.8) | 48 (27.9) | ||
| Clerical support worker | 186 (12.4) | 95 (14.5) | 70 (10.9) | 21 (12.2) | ||
| Service and sales | 146 (9.7) | 62 (9.5) | 66 (10.3) | 15 (8.7) | ||
| Agricultural | 14 (0.9) | 10 (1.5) | 3 (0.5) | 1 (0.6) | ||
| Craft and related trades workers | 151 (10) | 47 (7.2) | 73 (11.4) | 25 (14.5) | ||
| Plant and machine operators | 64 (4.3) | 16 (2.5) | 42 (6.5) | 2 (1.2) | ||
| Elementary occupations | 64 (4.3) | 18 (2.8) | 40 (6.2) | 2 (1.2) | ||
| Item | % Missing | Mean | SD | Skewness | Kurtosis |
|---|---|---|---|---|---|
| Part1 | 0.39 | 2.82 | 1.13 | 0.00 | −0.74 |
| Part2 | 0.85 | 3.15 | 1.04 | −0.33 | −0.32 |
| Feed1 | 1.38 | 3.29 | 1.04 | −0.31 | −0.37 |
| Feed2 | 1.64 | 2.99 | 1.11 | −0.13 | −0.73 |
| Auto1 | 0.39 | 3.61 | 1.05 | −0.57 | −0.11 |
| Auto2 | 0.07 | 2.70 | 1.30 | 0.13 | −1.10 |
| Auto3 | 0.07 | 3.52 | 1.16 | −0.55 | −0.41 |
| Auto4 | 0.59 | 2.85 | 1.16 | 0.07 | −0.75 |
| MD1 | 0.00 | 4.05 | 0.79 | −0.82 | 1.25 |
| MD2 | 0.07 | 3.85 | 0.84 | −0.66 | 0.62 |
| TP1 | 0.13 | 3.21 | 1.11 | −0.19 | −0.64 |
| TP2 | 0.26 | 3.65 | 1.06 | −0.59 | −0.24 |
| ED1 | 0.33 | 3.15 | 1.23 | −0.13 | −0.97 |
| ED2 | 0.46 | 2.82 | 1.26 | 0.08 | −1.02 |
| Sup1 | 4.20 | 3.68 | 0.90 | −0.56 | 0.31 |
| Sup2 | 4.27 | 3.96 | 0.83 | −0.81 | 1.12 |
| Sup3 | 4.20 | 3.88 | 0.93 | −0.82 | 0.66 |
| Comp1 | 3.94 | 1.99 | 0.99 | 0.82 | 0.15 |
| Comp2 | 5.32 | 2.25 | 1.06 | 0.52 | −0.48 |
| Comp3 | 4.34 | 2.43 | 1.20 | 0.46 | −0.78 |
| Comp4 | 4.60 | 2.22 | 1.05 | 0.58 | −0.27 |
| Mobb1 | 1.31 | 2.11 | 0.83 | 0.58 | 0.39 |
| Mobb2 | 1.18 | 1.67 | 0.89 | 1.39 | 1.67 |
| Mobb3 | 1.12 | 1.86 | 0.96 | 0.97 | 0.28 |
| Mobb4 | 1.18 | 1.24 | 0.59 | 3.00 | 10.46 |
| Mobb5 | 1.12 | 1.83 | 0.80 | 0.71 | 0.04 |
| PB1 | 0.07 | 2.72 | 1.40 | 0.36 | −1.16 |
| PB2 | 0.13 | 2.76 | 1.15 | 0.18 | −0.76 |
| RA1 | 0.07 | 2.01 | 1.14 | 0.89 | −0.19 |
| RA2 | 0.07 | 2.10 | 1.09 | 0.71 | −0.37 |
| TO1 | 0.85 | 2.92 | 1.23 | −0.10 | −0.98 |
| TO2 | 1.31 | 3.02 | 1.28 | −0.21 | −1.04 |
| CA1 | 2.43 | 2.21 | 1.10 | 0.55 | −0.58 |
| CA2 | 3.48 | 2.48 | 1.13 | 0.20 | −0.89 |
| JS1 | 0.46 | 3.90 | 1.03 | −0.85 | 0.33 |
| JS2 | 0.20 | 3.97 | 1.09 | −0.89 | 0.05 |
| Emp1 | 1.31 | 2.77 | 1.41 | 0.15 | −1.24 |
| Emp2 | 1.45 | 3.02 | 1.38 | −0.04 | −1.19 |
| WLC1 | 0.13 | 2.33 | 1.08 | 0.49 | −0.49 |
| WLC2 | 0.20 | 2.29 | 1.05 | 0.41 | −0.58 |
| WLC3 | 0.07 | 2.28 | 0.98 | 0.45 | −0.35 |
| IS1 | 1.51 | 3.37 | 0.86 | −0.27 | 0.27 |
| IS2 | 0.26 | 3.38 | 0.85 | −0.38 | 0.53 |
| Version | χ2 | df | RMSEA (90% CI) | CFI | TLI | SRMR |
|---|---|---|---|---|---|---|
| Total (n = 1522) | 1896.339 *** | 724 | 0.033 (0.031; 0.034) | 0.943 | 0.929 | 0.038 |
| Luxembourg (n = 662) | 1377.066 *** | 724 | 0.037 (0.034; 0.040) | 0.924 | 0.905 | 0.043 |
| French (n = 649) | 1245.145 *** | 724 | 0.033 (0.030; 0.036) | 0.943 | 0.929 | 0.044 |
| German (n = 172) | 1012.422 *** | 724 | 0.048 (0.041; 0.055) | 0.915 | 0.893 | 0.058 |
| Configural invariance | 3697.663 *** | 2172 | 0.038 (0.036; 0.040) | 0.930 | 0.913 | 0.045 |
| Metric invariance | 3784.172 *** | 2224 | 0.038 (0.036; 0.040) | 0.929 | 0.913 | 0.048 |
| Scalar invariance | 4014.246 *** | 2276 | 0.039 (0.037; 0.041) | 0.921 | 0.906 | 0.049 |
| Dimensions | Total | Luxembourgish | French | German |
|---|---|---|---|---|
| Job design | ||||
| Participation | 0.72 | 0.75 | 0.67 | 0.78 |
| Feedback | 0.71 | 0.68 | 0.71 | 0.80 |
| Autonomy | 0.74 | 0.74 | 0.73 | 0.79 |
| Work intensity | ||||
| Mental demands | 0.75 | 0.74 | 0.77 | 0.76 |
| Time pressure | 0.70 | 0.63 | 0.74 | 0.74 |
| Emotional demands | 0.82 | 0.81 | 0.83 | 0.84 |
| Social conditions | ||||
| Social support | 0.80 | 0.79 | 0.79 | 0.81 |
| Competition | 0.78 | 0.77 | 0.77 | 0.83 |
| Mobbing | 0.73 | 0.74 | 0.70 | 0.82 |
| Physical conditions | ||||
| Physical burden | 0.71 | 0.69 | 0.73 | 0.72 |
| Risk of accident | 0.78 | 0.75 | 0.80 | 0.78 |
| Quality of Employment | ||||
| Training opportunities | 0.86 | 0.83 | 0.88 | 0.90 |
| Career advancement | 0.82 | 0.81 | 0.85 | 0.76 |
| Job security | 0.76 | 0.73 | 0.73 | 0.86 |
| Employability | 0.82 | 0.80 | 0.84 | 0.86 |
| Work life conflict | 0.78 | 0.75 | 0.80 | 0.81 |
| Income satisfaction | 0.86 | 0.87 | 0.85 | 0.89 |
| Outcomes | ||||
| Burnout | 0.83 | 0.83 | 0.83 | 0.87 |
| General well-being | 0.83 | 0.81 | 0.86 | 0.85 |
| Subjective physiological health problems | 0.72 | 0.71 | 0.73 | 0.75 |
| Work satisfaction | 0.83 | 0.83 | 0.82 | 0.81 |
| Vigor | 0.65 | 0.64 | 0.66 | 0.72 |
| Performance | 0.63 | 0.60 | 0.66 | 0.51 |
| Variables | M | SD | 1 | 2 | 3 | 4 | 5 | 6 | 7 | 8 | 9 | 10 | 11 | 12 | |
| 1 | Long working hours a | 14% | |||||||||||||
| 2 | Atypical working hours a | 22% | 0.14 *** | ||||||||||||
| 3 | Training opportunities | 3.0 | 1.2 | 0.04 | −0.04 | ||||||||||
| 4 | Career advancement | 2.3 | 1.0 | 0.04 | −0.02 | 0.58 *** | |||||||||
| 5 | Job security | 3.9 | 1.0 | −0.02 | 0.02 | 0.25 *** | 0.22 *** | ||||||||
| 6 | Employability | 2.9 | 1.3 | 0.01 | 0.02 | 0.16 *** | 0.17 *** | 0.19 *** | |||||||
| 7 | Work life conflict | 2.3 | 0.9 | 0.17 *** | 0.18 *** | −0.03 | −0.05 * | −0.20 *** | −0.02 | ||||||
| 8 | Income satisfaction | 3.4 | 0.8 | −0.01 | 0.00 | 0.29 *** | 0.23 *** | 0.31 *** | 0.08 ** | −0.11 *** | |||||
| 9 | QoE | 3.2 | 0.6 | −0.02 | −0.05 * | 0.70 *** | 0.67 *** | 0.60 *** | 0.54 *** | −0.36 *** | 0.53 *** | ||||
| 10 | Participation | 3.0 | 1.0 | 0.10 *** | −0.06 * | 0.27 *** | 0.30 *** | 0.21 *** | 0.16 *** | −0.11 *** | 0.23 *** | 0.37 *** | |||
| 11 | Feedback | 3.1 | 0.9 | −0.02 | −0.06 * | 0.28 *** | 0.32 *** | 0.12 *** | 0.08 ** | −0.11 *** | 0.20 *** | 0.32 *** | 0.42 *** | ||
| 12 | Autonomy | 3.2 | 0.9 | 0.09 *** | −0.19 *** | 0.18 *** | 0.17 *** | 0.16 *** | 0.13 *** | −0.08 ** | 0.17 *** | 0.26 *** | 0.50 *** | 0.22 *** | |
| 13 | Mental demands | 4.0 | 0.7 | 0.14 *** | 0.07 ** | 0.14 *** | 0.06 * | 0.02 | 0.07 ** | 0.25 *** | 0.02 | 0.03 | 0.08 ** | 0.14 *** | 0.07 ** |
| 14 | Time pressure | 3.4 | 1.0 | 0.20 *** | 0.11 *** | −0.06 * | −0.03 | −0.15 *** | 0.00 | 0.36 *** | −0.17 *** | −0.20 *** | −0.08 *** | −0.01 | −0.11 *** |
| 15 | Emotional demands | 3.0 | 1.1 | 0.08 ** | 0.17 *** | 0.04 | −0.06 * | −0.12 *** | −0.04 | 0.32 *** | −0.03 | −0.14 *** | −0.09 *** | −0.07 ** | −0.12 *** |
| 16 | Social support | 3.8 | 0.8 | −0.01 | 0.00 | 0.23 *** | 0.20 *** | 0.18 *** | 0.10 *** | −0.16 *** | 0.24 *** | 0.31 *** | 0.27 *** | 0.45 *** | 0.17 *** |
| 17 | Competition | 2.2 | 0.9 | 0.07 ** | 0.03 | −0.02 | 0.03 | −0.22 *** | −0.04 | 0.28 *** | −0.12 *** | −0.17 *** | −0.07 ** | −0.10 *** | −0.06 * |
| 18 | Mobbing | 1.7 | 0.6 | 0.08 ** | 0.05 * | −0.12 *** | −0.17 *** | −0.22 *** | −0.11 *** | 0.35 *** | −0.18 *** | −0.31 *** | −0.33 *** | −0.32 *** | −0.21 *** |
| 19 | Physical burden | 2.7 | 1.1 | 0.02 | 0.26 *** | −0.15 *** | −0.14 *** | −0.17 *** | −0.05 * | 0.13 *** | −0.21 *** | −0.24 *** | −0.19 *** | −0.14 *** | −0.32 *** |
| 20 | Risk of accident | 2.1 | 1.0 | 0.04 | 0.29 *** | −0.09 *** | −0.05 * | −0.06 * | −0.01 | 0.09 *** | −0.17 *** | −0.12 *** | −0.13 *** | −0.09 *** | −0.27 *** |
| 21 | QoW | 3.3 | 0.4 | −0.08 ** | −0.26 *** | 0.23 *** | 0.25 *** | 0.29 *** | 0.12 *** | −0.40 *** | 0.31 *** | 0.44 *** | 0.56 *** | 0.48 *** | 0.55 *** |
| 22 | Burnout | 2.4 | 0.8 | 0.08 ** | 0.12 *** | −0.15 *** | −0.21 *** | −0.30 *** | −0.12 *** | 0.50 *** | −0.31 *** | −0.43 *** | −0.29 *** | −0.23 *** | −0.23 *** |
| 23 | General well-being | 3.2 | 1.0 | −0.02 | −0.02 | 0.13 *** | 0.15 *** | 0.23 *** | 0.09 *** | −0.35 *** | 0.17 *** | 0.31 *** | 0.24 *** | 0.20 *** | 0.18 *** |
| 24 | Health problems | 2.1 | 0.7 | 0.00 | 0.05 * | −0.13 *** | −0.16 *** | −0.22 *** | −0.19 *** | 0.31 *** | −0.22 *** | −0.35 *** | −0.23 *** | −0.18 *** | −0.17 *** |
| 25 | Work satisfaction | 3.6 | 0.8 | −0.04 | −0.08 ** | 0.32 *** | 0.31 *** | 0.37 *** | 0.15 *** | −0.36 *** | 0.40 *** | 0.53 *** | 0.43 *** | 0.38 *** | 0.31 *** |
| 26 | Vigor | 3.4 | 0.7 | −0.01 | 0.00 | 0.13 *** | 0.15 *** | 0.22 *** | 0.13 *** | −0.28 *** | 0.19 *** | 0.31 *** | 0.26 *** | 0.22 *** | 0.18 *** |
| 27 | Performance | 3.7 | 0.7 | 0.02 | 0.00 | 0.03 | 0.07 ** | 0.10 *** | 0.08 ** | −0.06 * | 0.01 | 0.10 *** | 0.19 *** | 0.15 *** | 0.15 *** |
| 13 | 14 | 15 | 16 | 17 | 18 | 19 | 20 | 21 | 22 | 23 | 24 | 25 | 26 | ||
| 14 | Time pressure | 0.38 *** | |||||||||||||
| 15 | Emotional demands | 0.26 *** | 0.31 *** | ||||||||||||
| 16 | Social support | 0.11 *** | −0.11 *** | −0.05 * | |||||||||||
| 17 | Competition | 0.07 ** | 0.23 *** | 0.21 *** | −0.21 *** | ||||||||||
| 18 | Mobbing | 0.07 ** | 0.21 *** | 0.26 *** | −0.27 *** | 0.34 *** | |||||||||
| 19 | Physical burden | −0.06 * | 0.15 *** | 0.15 *** | −0.10 *** | 0.09 *** | 0.20 *** | ||||||||
| 20 | Risk of accident | 0.01 | 0.11 *** | 0.12 *** | −0.03 | 0.10 *** | 0.16 *** | 0.58 *** | |||||||
| 21 | QoW | −0.22 *** | −0.50 *** | −0.52 *** | 0.44 *** | −0.43 *** | −0.57 *** | −0.58 *** | −0.52 *** | ||||||
| 22 | Burnout | 0.22 *** | 0.35 *** | 0.39 *** | −0.30 *** | 0.28 *** | 0.45 *** | 0.37 *** | 0.23 *** | −0.61 *** | |||||
| 23 | General well-being | −0.06 * | −0.22 *** | −0.23 *** | 0.29 *** | −0.17 *** | −0.32 *** | −0.15 *** | −0.07 ** | 0.38 *** | −0.53 *** | ||||
| 24 | Health problems | 0.06 * | 0.19 *** | 0.23 *** | −0.22 *** | 0.17 *** | 0.30 *** | 0.33 *** | 0.18 *** | −0.42 *** | 0.55 *** | −0.43 *** | |||
| 25 | Work satisfaction | −0.02 | −0.28 *** | −0.26 *** | 0.44 *** | −0.28 *** | −0.48 *** | −0.27 *** | −0.19 *** | 0.60 *** | −0.58 *** | 0.44 *** | −0.41 *** | ||
| 26 | Vigor | −0.03 | −0.14 *** | −0.16 *** | 0.24 *** | −0.13 *** | −0.30 *** | −0.08 ** | −0.05 * | 0.32 *** | −0.45 *** | 0.51 *** | −0.32 *** | 0.44 *** | |
| 27 | Performance | 0.08 ** | 0.08 ** | −0.01 | 0.03 | −0.02 | −0.15 *** | −0.05 * | −0.05 * | 0.11 *** | −0.12 *** | 0.14 *** | −0.06 * | 0.12 *** | 0.20 *** |
| Predictor Variables | Burnout | General Well-Being | ||||||
|---|---|---|---|---|---|---|---|---|
| Step 1 | Step 2 | Step 3 | Step 4 | Step 1 | Step 2 | Step 3 | Step 4 | |
| Demographic variables | ||||||||
| Long work week | 0.19 * | 0.00 | −0.04 | −0.08 | 0.05 | 0.06 | ||
| Atypical working time | 0.26 *** | 0.09 | −0.10 * | −0.04 | 0.08 | 0.13 * | ||
| Training opportunities | 0.03 | 0.01 | 0.03 | 0.01 | ||||
| Career advancement | −0.11 *** | −0.05 * | 0.06 * | 0.02 | ||||
| Job security | −0.13 *** | −0.06 ** | 0.12 *** | 0.08 ** | ||||
| Employability | −0.05 * | −0.04 * | 0.04 | 0.03 | ||||
| Work life conflict | 0.45 *** | 0.25 *** | −0.34 *** | −0.22 *** | ||||
| Income satisfaction | −0.20 *** | −0.12 *** | 0.07 ** | 0.02 | ||||
| Participation | −0.07 ** | 0.06 * | ||||||
| Feedback | 0.01 | 0.01 | ||||||
| Autonomy | 0.00 | 0.02 | ||||||
| Mental demands | 0.12 *** | 0.00 | ||||||
| Time pressure | 0.05 * | −0.06 * | ||||||
| Emotional demands | 0.16 *** | −0.09 *** | ||||||
| Social support | −0.13 *** | 0.16 *** | ||||||
| Competition | 0.02 | 0.02 | ||||||
| Mobbing | 0.15 *** | −0.11 *** | ||||||
| Physical burden | 0.23 *** | −0.05 | ||||||
| Risk of accident | 0.01 | 0.04 | ||||||
| F | 2.085 | 4.918 *** | 57.223 *** | 63.291 *** | 1.016 | 0.987 | 22.472 *** | 19.295 *** |
| ΔF | 12.928 *** | 124.417 *** | 46.687 *** | 0.902 | 50.790 *** | 12.805 *** | ||
| R2 | 0.01 | 0.03 | 0.35 | 0.52 | 0.00 | 0.01 | 0.17 | 0.24 |
| ΔR2 | 0.02 | 0.32 | 0.17 | 0.00 | 0.16 | 0.07 | ||
| Predictor Variables | Subjective Physiological Health Problems | Work Satisfaction | ||||||
|---|---|---|---|---|---|---|---|---|
| Step 1 | Step 2 | Step 3 | Step 4 | Step 1 | Step 2 | Step 3 | Step 4 | |
| Demographic variables | ||||||||
| Long work week | 0.10 | −0.04 | −0.07 | −0.07 | 0.06 | 0.04 | ||
| Atypical working time | 0.11 | −0.01 | −0.14 * | −0.19 ** | −0.06 | 0.03 | ||
| Training opportunities | 0.02 | 0.02 | 0.09 *** | 0.06 ** | ||||
| Career advancement | −0.04 | 0.00 | 0.12 *** | 0.05 * | ||||
| Job security | −0.11 *** | −0.06 * | 0.17 *** | 0.11 *** | ||||
| Employability | −0.09 *** | −0.09 *** | 0.03 | 0.01 | ||||
| Work life conflict | 0.32 *** | 0.20 *** | −0.31 *** | −0.14 *** | ||||
| Income satisfaction | −0.13 *** | −0.08 ** | 0.25 *** | 0.17 *** | ||||
| Participation | −0.04 | 0.14 *** | ||||||
| Feedback | −0.02 | 0.06 * | ||||||
| Autonomy | 0.04 | 0.05 * | ||||||
| Mental demands | 0.04 | 0.01 | ||||||
| Time pressure | 0.03 | −0.07 ** | ||||||
| Emotional demands | 0.08 ** | −0.09 *** | ||||||
| Social support | −0.08 ** | 0.18 *** | ||||||
| Competition | 0.02 | −0.04 * | ||||||
| Mobbing | 0.09 *** | −0.17 *** | ||||||
| Physical burden | 0.23 *** | −0.04 | ||||||
| Risk of accident | 0.00 | −0.03 | ||||||
| F | 12.662 *** | 10.151 *** | 30.844 *** | 25.817 *** | 6.601 *** | 6.306 *** | 61.073 *** | 66.431 *** |
| ΔF | 2.732 | 55.662 *** | 15.363 *** | 5.348 ** | 130.299 *** | 46.934 *** | ||
| R2 | 0.05 | 0.05 | 0.22 | 0.30 | 0.03 | 0.03 | 0.36 | 0.53 |
| ΔR2 | 0.00 | 0.17 | 0.08 | 0.01 | 0.33 | 0.17 | ||
| Predictor Variables | Vigor | Subjective Work Performance | ||||||
|---|---|---|---|---|---|---|---|---|
| Step 1 | Step 2 | Step 3 | Step 4 | Step 1 | Step 2 | Step 3 | Step 4 | |
| Demographic variables | ||||||||
| Long work week | 0.01 | 0.12 | 0.08 | 0.05 | 0.07 | −0.02 | ||
| Atypical working time | 0.00 | 0.10 | 0.13 * | 0.00 | 0.01 | 0.06 | ||
| Training opportunities | 0.02 | 0.00 | −0.03 | −0.04 | ||||
| Career advancement | 0.06 * | 0.01 | 0.08 * | 0.02 | ||||
| Job security | 0.12 *** | 0.09 *** | 0.08 ** | 0.07 * | ||||
| Employability | 0.08 ** | 0.06 * | 0.09 ** | 0.06 * | ||||
| Work life conflict | −0.27 *** | −0.19 *** | −0.06 * | −0.06 | ||||
| Income satisfaction | 0.06 * | −0.04 | −0.05 | |||||
| Participation | 0.10 *** | 0.12 *** | ||||||
| Feedback | 0.04 | 0.08 * | ||||||
| Autonomy | 0.06 * | 0.08 * | ||||||
| Mental demands | 0.01 | 0.05 | ||||||
| Time pressure | −0.01 | 0.11 *** | ||||||
| Emotional demands | −0.06 * | 0.01 | ||||||
| Social support | 0.10 *** | −0.06 | ||||||
| Competition | 0.03 | 0.01 | ||||||
| Mobbing | −0.11 *** | −0.08 ** | ||||||
| Physical burden | 0.04 | 0.01 | ||||||
| Risk of accident | 0.00 | −0.03 | ||||||
| F | 0.629 | 0.471 | 17.812 *** | 14.995 *** | 2.035 | 1.566 | 3.649 *** | 5.735 *** |
| ΔF | 0.005 | 40.823 *** | 9.949 *** | 0.183 | 6.394 *** | 8.134 *** | ||
| R2 | 0.00 | 0.00 | 0.14 | 0.20 | 0.01 | 0.01 | 0.03 | 0.09 |
| ΔR2 | 0.00 | 0.14 | 0.06 | 0.00 | 0.02 | 0.06 | ||
Publisher’s Note: MDPI stays neutral with regard to jurisdictional claims in published maps and institutional affiliations. |
© 2020 by the authors. Licensee MDPI, Basel, Switzerland. This article is an open access article distributed under the terms and conditions of the Creative Commons Attribution (CC BY) license (http://creativecommons.org/licenses/by/4.0/).
Share and Cite
Steffgen, G.; Sischka, P.E.; Fernandez de Henestrosa, M. The Quality of Work Index and the Quality of Employment Index: A Multidimensional Approach of Job Quality and Its Links to Well-Being at Work. Int. J. Environ. Res. Public Health 2020, 17, 7771. https://doi.org/10.3390/ijerph17217771
Steffgen G, Sischka PE, Fernandez de Henestrosa M. The Quality of Work Index and the Quality of Employment Index: A Multidimensional Approach of Job Quality and Its Links to Well-Being at Work. International Journal of Environmental Research and Public Health. 2020; 17(21):7771. https://doi.org/10.3390/ijerph17217771
Chicago/Turabian StyleSteffgen, Georges, Philipp E. Sischka, and Martha Fernandez de Henestrosa. 2020. "The Quality of Work Index and the Quality of Employment Index: A Multidimensional Approach of Job Quality and Its Links to Well-Being at Work" International Journal of Environmental Research and Public Health 17, no. 21: 7771. https://doi.org/10.3390/ijerph17217771
APA StyleSteffgen, G., Sischka, P. E., & Fernandez de Henestrosa, M. (2020). The Quality of Work Index and the Quality of Employment Index: A Multidimensional Approach of Job Quality and Its Links to Well-Being at Work. International Journal of Environmental Research and Public Health, 17(21), 7771. https://doi.org/10.3390/ijerph17217771