Influence of Food and Beverage Companies on Retailer Marketing Strategies and Consumer Behavior

 ,
,
Abstract
1. Introduction
2. Methods
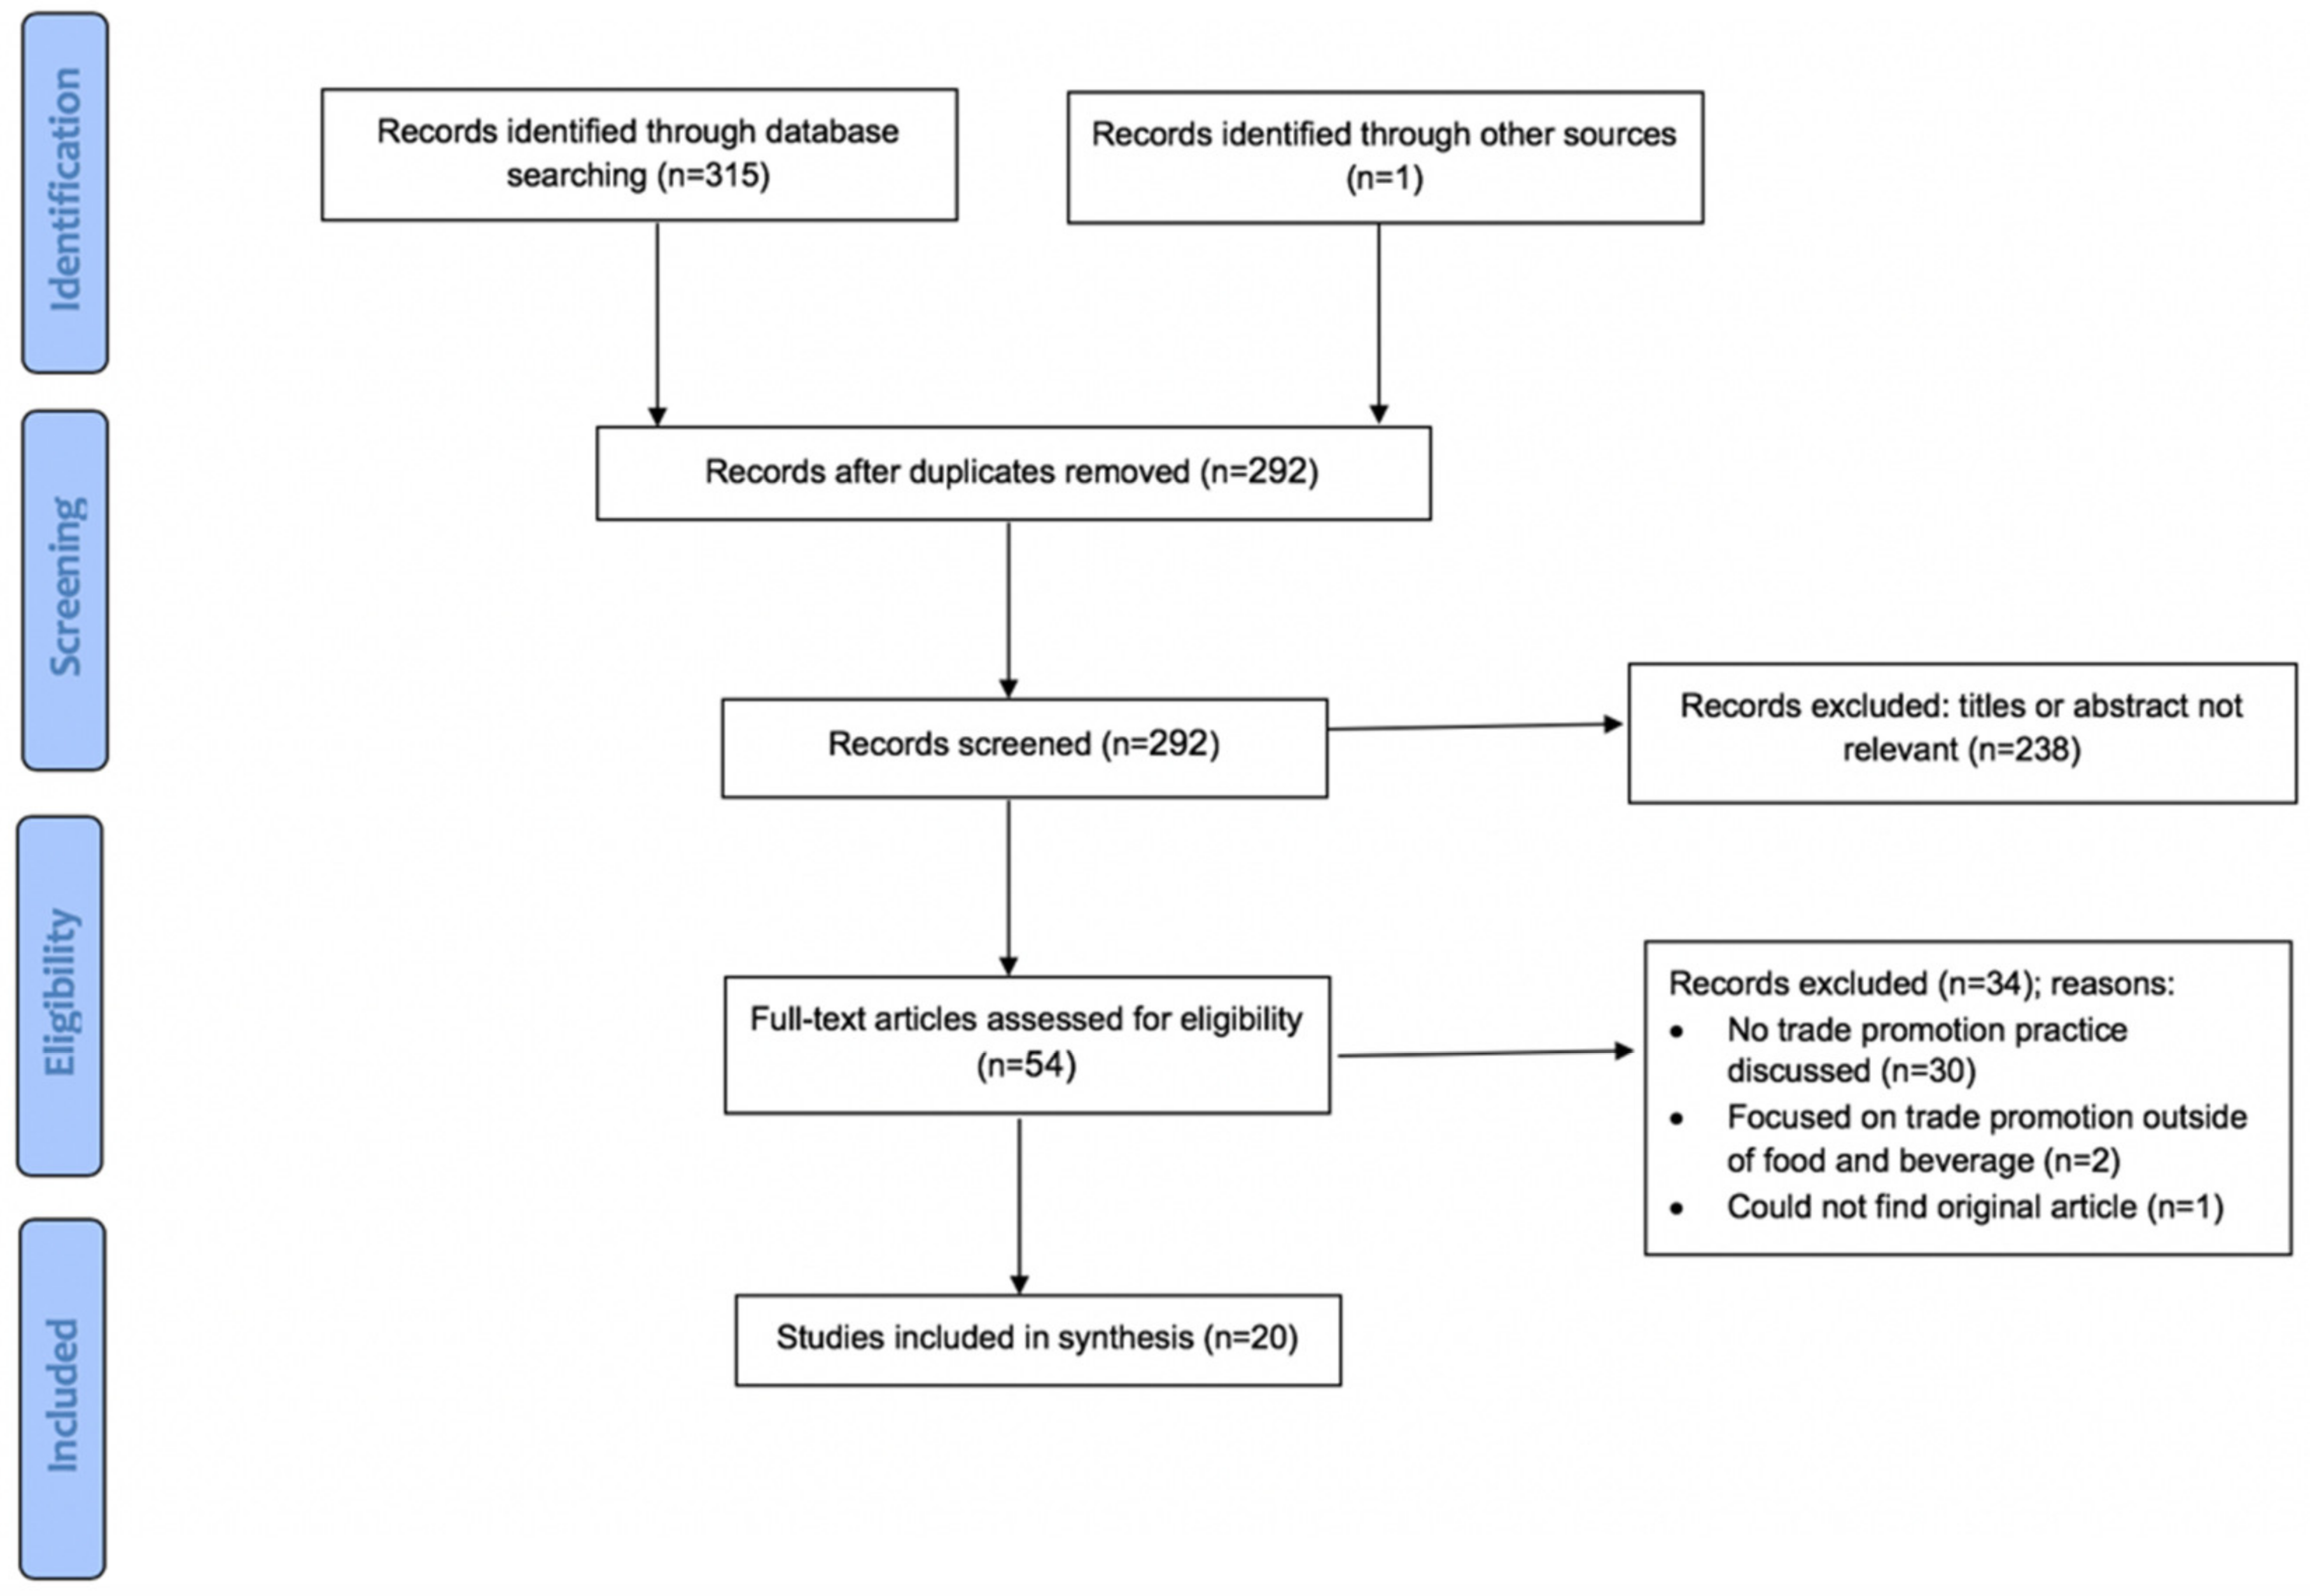
2.1. Research Question 1: Search Strategy and Inclusion Criteria
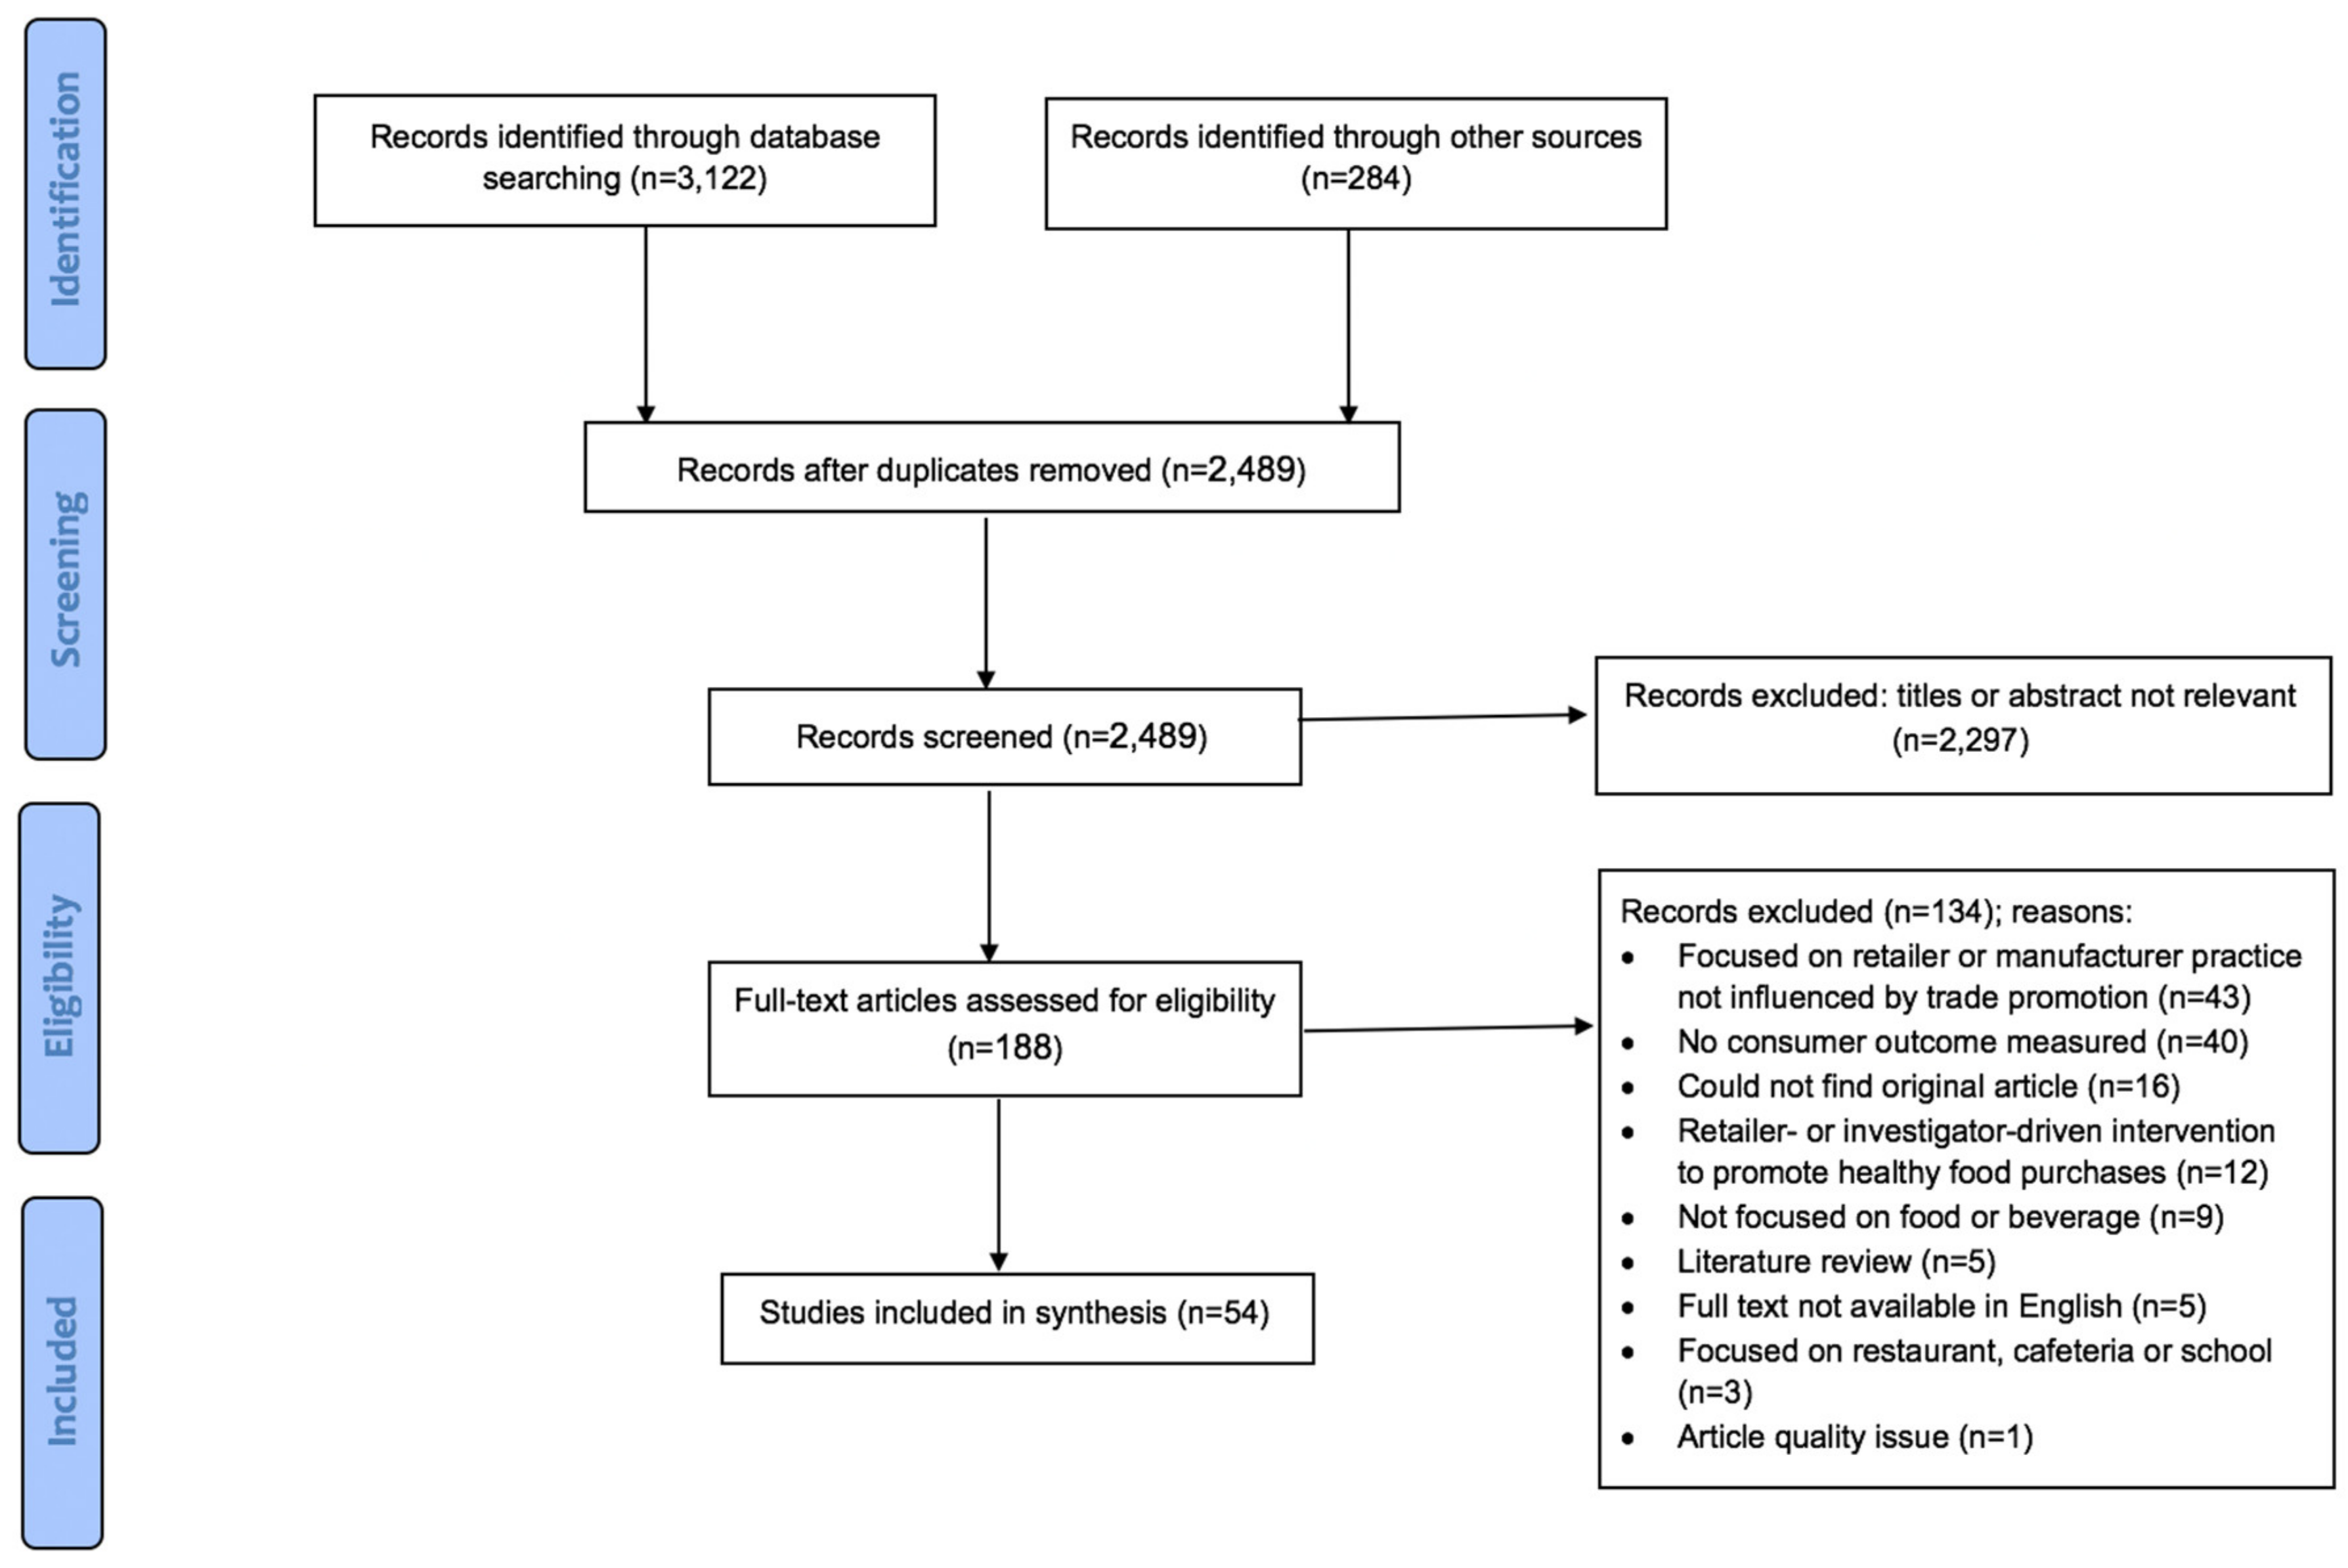
2.2. Research Question 2: Search Strategy and Inclusion Criteria
2.3. Quality of Studies
3. Results
3.1. Narrative Review of Trade Promotion Practices
3.1.1. Category Management
3.1.2. Slotting Allowances
3.1.3. Price Discounts
3.1.4. Cooperative Advertising
3.2. Literature Review of Impacts of Retailer Marketing Strategies on Consumers
3.2.1. Pricing
Coupons
Temporary Price Reductions
Other Price Promotions
Perceived Importance of Price Promotions
3.2.2. Placement
Endcaps
Shelf Placement and Space
Other Placement Strategies
3.2.3. Promotion
Signs
In-Store Sampling
Games, Giveaways and Limited-Time Offers
Perceived Importance of Promotions
3.2.4. Comparison of Marketing Healthy versus Unhealthy Products
3.2.5. Comparison across Marketing Strategies
3.2.6. Quality of Evidence Grading
4. Discussion
4.1. Future Research Directions
- Online and other nontraditional retail formats. Eighty percent of included articles focused on retailer marketing strategies in grocery stores and supermarkets; other nontraditional retail formats such as dollar stores and online retailers should be assessed. Despite rapid proliferation of dollar stores in the past decade [103], they were assessed in only one of the included articles. Considering dollar stores are most common in rural and low-income communities, evaluations in dollar stores may provide insight into geographic and socioeconomic disparities in diet and food purchasing. In 2015, dollar stores represented two-thirds of new stores in designated “food deserts” [104]. Relatedly, online retail was the focus of only four of the included articles. While online grocery retail represented only 6.3% of total US grocery spending in 2019, [105] online sales are rapidly expanding, and due to concerns about COVID-19 transmission, are expected to grow more than 40% in 2020 [106].
- Distal consumer outcomes including consumption and health. None of the included studies measured the impact of retailer marketing strategies on distal or long-term outcomes, such as diet quality or weight. Admittedly, it may be difficult to detect the impact of marketing strategies on health outcomes, especially because diet-related health outcomes are influenced by a multitude of environmental and biological factors. Dietary consumption, which has been linked to health outcomes in the public health literature, however, may be assessed. Analysis of these outcomes will require collection of different types of data, such as food frequency questionnaires or dietary recall surveys, coupled with objective purchase data. Dietary data collection methods, however, do have limitations (e.g., food frequency questionnaires may not be sensitive enough to detect small effect sizes, and dietary recalls are resource-intensive and subject to recall bias).
- Other outcomes of importance to retailers and manufacturers. While this review excluded studies that did not measure consumer behavior or attitudes, the initial scan of titles and abstracts revealed few studies that assessed other outcomes of importance to industry, such as short- and long-term return on investment and customer lifetime value (i.e., the total profit a retailer makes from customers over their lifetime). Interventions that benefit public health, in order to be sustainable and acceptable to manufactures and retailers, must consider these outcomes.
- Differential impacts of retail practices on consumers by demographic characteristics. Few studies compared how retailer marketing strategies affected different consumer segments, such as families with children, shoppers with low income, or shoppers who identify as racial or ethnic minorities. Insight into how certain populations may be disproportionately influenced or targeted by retailer marketing strategies can guide intervention efforts.
- Retailer marketing strategies that have the strongest impact on consumer behavior. Only a small number of studies directly compared the impacts of different retailer marketing strategies, and most of these focused on perceived importance. Additional head-to-head comparison of retailer marketing strategies is needed to prioritize which components to include in future interventions.
- Trade promotion practices that have the strongest impact on retailer behavior. Data on TPP are largely proprietary, and thus, research is limited on the amount manufacturers spend annually on TPP, which TPP are used most frequently, what proportion of retailer profit comes from TPP, and which TPP are the strongest drivers of retailer marketing. Additional research, potentially done in partnership with industry, is needed to understand these powerful market drivers.
4.2. Limitations
5. Conclusions
Author Contributions
Funding
Acknowledgments
Conflicts of Interest
Appendix A
Food and Beverage Retail Formats *:
Appendix B
Search Terms
Research Question 1 Search String
Research Question 2 Search String
Appendix C

| Selection (max of 5 stars) | (1) Representativeness of the sample: | (a) Truly representative of the average in the target population1 (e.g., all subjects or random sampling) | * |
| (b) Somewhat representative of the average in the target population1 (e.g., nonrandom sampling) | * | ||
| (c) Selected group of users | No stars | ||
| (d) No description of the sampling strategy | No stars | ||
| (2) Sample size: | (a) Justified and satisfactory | * | |
| (b) Not justified | No stars | ||
| (3) Non-respondents: | (a) Comparability between respondents’ and non-respondents’ characteristics is established, and the response rate is satisfactory | * | |
| (b) The response rate is unsatisfactory, or the comparability between respondents and non-respondents is unsatisfactory | No stars | ||
| (c) No description of the response rate or the characteristics of the responders and the non-responders | No stars | ||
| (d) Not applicable (e.g., aggregate sales data) | NA | ||
| (4) Ascertainment of risk factor: | (a) Built into dataset | ** | |
| (b) Built into study design | ** | ||
| (c) Self-reported/-stated | * | ||
| (d) No information disclosed | No stars | ||
| Comparability (max of 2 stars) | (1) The subjects in different outcome groups are comparable, based on the study design or analysis. Confounding factors are controlled | (a) The study controls for the most important factor (e.g., income/SES) | * |
| (b) The study controls for any additional factor (e.g., age, gender, household size, race) | * | ||
| (c) Not applicable (e.g., there is no comparison group) | NA | ||
| Outcome (max of 3 stars) | (1) Assessment of the outcome: | (a) Independent blind assessment | ** |
| (b) Record linkage | ** | ||
| (c) Self reports | * | ||
| (d) No description | No stars | ||
| (2) Statistical test: | (a) The statistical test used to analyze the data is clearly described and appropriate, and the measurement of the association is presented, including confidence intervals and the probability level (p value) | * | |
| (b) The statistical test is not appropriate, not described or incomplete | No stars |
Appendix D
| Reference | Selection | Comparability | Outcome | |||||
|---|---|---|---|---|---|---|---|---|
| Representativeness of the Sample | Sample Size | Non- Respondents | Ascertainment of Risk Factor | Are Confounding Factors Controlled | Assessment of Outcome | Statistical Test | Overall Score * | |
| Andorfer et al. (2015) | 0 | 1 | 0 | 2 | 1 | 1 | 1 | 6/10 |
| Arce-Urriza et al. (2017) | 1 | 1 | NA | 2 | NA | 2 | 1 | 7/7 |
| Awan et al. (2015) | 1 | 0 | 0 | 1 | NA | 1 | 1 | 4/8 |
| Aziz et al. (2013) | 0 | 0 | 0 | 1 | 0 | 1 | 1 | 3/10* |
| Banks et al. (2016) | 0 | 0 | NA | 1 | NA | 1 | 0 | 2/7* |
| Bogomolova et al. (2019) | 1 | 1 | NA | 1 | 2 | 1 | 1 | 7/9 |
| Breugelmans and Campo (2016) | 1 | 1 | NA | 2 | 1 | 2 | 1 | 8/9 |
| Čábelková et al. (2015) | 1 | 1 | 0 | 1 | 2 | 1 | 1 | 7/10 |
| Huang et al. (2012) | 1 | 0 | 0 | 2 | 2 | 2 | 1 | 8/10 |
| Caruso et al. (2018) | 1 | 1 | 0 | 2 | 0 | 2 | 1 | 7/10 |
| Caspi et al. (2017) | 1 | 0 | 0 | 1 | 1 | 1 | 1 | 5/10 |
| Farrag (2012) | 0 | 0 | 0 | 2 | 0 | 1 | 1 | 4/10 |
| Felgate et al. (2012) | 1 | 1 | NA | 2 | 0 | 2 | 1 | 7/9 |
| Fornari et al. (2013) | 1 | 0 | NA | 2 | NA | 2 | 1 | 6/7 |
| Goić et al. (2011) | 0 | 0 | NA | 2 | NA | 0 | 1 | 3/7 |
| Guan et al. (2018) | 1 | 1 | 0 | 2 | 2 | 1 | 1 | 8/10 |
| Hong et al. (2016) | 1 | 1 | NA | 2 | 1 | 2 | 1 | 8/9 |
| Jamal et al. (2012) | 1 | 1 | 0 | 1 | NA | 1 | 0 | 4/8 |
| Johnson et al. (2013) | 1 | 0 | 0 | 2 | NA | 2 | 1 | 6/8 |
| Kacen et al. (2012) | 1 | 0 | NA | 2 | 2 | 1 | 1 | 7/9 |
| Kim et al. (2011) | 1 | 1 | NA | 2 | NA | 2 | 1 | 7/7 |
| Leeflang et al. (2012) | 0 | 0 | NA | 2 | NA | 2 | 1 | 5/7 |
| Levy and Gendel-Guterman (2012) | 1 | 1 | 0 | 1 | 2 | 1 | 1 | 7/10 |
| Liang et al. (2017) | 1 | 1 | NA | 2 | 0 | 2 | 1 | 7/9 |
| Mamiya et al. (2018) | 1 | 1 | NA | 2 | 2 | 2 | 1 | 9/9 |
| Minnema et al. (2017) | 1 | 1 | 0 | 2 | 2 | 2 | 1 | 9/10 |
| Mortimer and Weeks (2011) | 1 | 1 | 0 | 2 | 1 | 1 | 1 | 7/10 |
| Mussol et al. (2019) | 1 | 0 | 0 | 2 | 1 | 1 | 1 | 6/10 |
| Nakamura et al. (2015) | 1 | 1 | 0 | 2 | 1 | 2 | 1 | 8/10 |
| Nakamura et al. (2014) | 1 | 0 | NA | 2 | NA | 2 | 1 | 6/7 |
| Nordfält and Lange (2013) | 1 | 0 | NA | 2 | NA | 2 | 1 | 6/7 |
| Osuna et al. (2016) | 1 | 0 | NA | 2 | 1 | 2 | 1 | 7/9 |
| Page et al. (2019) | 1 | 0 | NA | 2 | 2 | 2 | 1 | 8/9 |
| Panzone and Tiffin (2012) | 1 | 1 | 0 | 1 | 0 | 1 | 1 | 5/10 |
| Phillips et al. (2015) | 1 | 0 | NA | 2 | 1 | 2 | 1 | 7/9 |
| Phipps et al (2010) | 0 | 0 | 0 | 2 | 1 | 2 | 1 | 6/10 |
| Point of Purchase Advertising International (2012) | 1 | 1 | 0 | 2 | 0 | 2 | 0 | 6/10 |
| Pozzi (2013) | 1 | 1 | NA | 2 | 2 | 2 | 1 | 9/9 |
| Ranjan (2018) | 1 | 0 | NA | 2 | 1 | 2 | 1 | 7/9 |
| Revoredo-Giha (2015) | 1 | 1 | 0 | 2 | 1 | 2 | 1 | 8/10 |
| Ruff et al. (2016) | 1 | 0 | 0 | 2 | 2 | 1 | 1 | 7/10 |
| Sanchez-Flack et al. (2017) | 1 | 1 | 1 | 2 | 2 | 1 | 1 | 9/10 |
| Sano and Suzuki (2013) | 0 | 0 | NA | 2 | NA | 2 | 1 | 5/9 |
| Seva et al. (2011) | 0 | 0 | 0 | 2 | 0 | 2 | 1 | 5/10 |
| Singh (2013) | 1 | 0 | 0 | 2 | 2 | 2 | 1 | 8/10 |
| Smithson et al. (2015) | 1 | 1 | 0 | 2 | 2 | 2 | 1 | 9/10 |
| Spanjaard (2014) | 1 | 1 | 0 | 1 | NA | 1 | NA | 4/7 |
| Tacka (2019) | 1 | 0 | 0 | 1 | 0 | 1 | 1 | 4/10 |
| Talukdar and Lindsey (2013) | 1 | 0 | NA | 2 | 2 | 2 | 1 | 8/9 |
| Tan et al. (2018) | 1 | 0 | NA | 2 | 1 | 2 | 1 | 7/9 |
| Tran (2019) | 0 | 0 | 0 | 1 | 0 | 1 | 1 | 3/10* |
| Walmsley et al. (2018) | 1 | 1 | NA | 2 | 0 | 2 | 1 | 7/9 |
| Yildirim and Aydin (2012) | 1 | 1 | 0 | 2 | 1 | 1 | 1 | 7/10 |
| Zhang (2017) | 1 | 1 | NA | 2 | 2 | 2 | 1 | 9/9 |
References
- Willett, W.C.; Koplan, J.P.; Nugent, R.; Dusenbury, C.; Puska, P.; Gaziano, T.A. Prevention of Chronic Disease by Means of Diet and Lifestyle Changes. In Disease Control Priorities in Developing Countries; Jamison, D.T., Breman, J.G., Measham, A.R., Alleyne, G., Claeson, M., Evans, D.B., Jha, P., Mills, A., Musgrove, P., Eds.; World Bank: Washington, DC, USA, 2006; ISBN 978-0-8213-6179-5. [Google Scholar]
- Riesenberg, D.; Backholer, K.; Zorbas, C.; Sacks, G.; Paix, A.; Marshall, J.; Blake, M.R.; Bennett, R.; Peeters, A.; Cameron, A.J. Price Promotions by Food Category and Product Healthiness in an Australian Supermarket Chain, 2017–2018. Am. J. Public Health 2019, 109, 1434–1439. [Google Scholar] [CrossRef] [PubMed]
- Bennett, R.; Zorbas, C.; Huse, O.; Peeters, A.; Cameron, A.J.; Sacks, G.; Backholer, K. Prevalence of healthy and unhealthy food and beverage price promotions and their potential influence on shopper purchasing behaviour: A systematic review of the literature. Obes Rev. 2019. [Google Scholar] [CrossRef] [PubMed]
- Ravensbergen, E.A.; Waterlander, W.E.; Kroeze, W.; Steenhuis, I.H. Healthy or unhealthy on sale? A cross-sectional study on the proportion of healthy and unhealthy foods promoted through flyer advertising by supermarkets in the Netherlands. BMC Public Health 2015, 15, 470. [Google Scholar] [CrossRef] [PubMed]
- Zorbas, C.; Gilham, B.; Boelsen-Robinson, T.; Blake, M.R.; Peeters, A.; Cameron, A.J.; Wu, J.H.; Backholer, K. The frequency and magnitude of price-promoted beverages available for sale in Australian supermarkets. Aust. N. Z. J. Public Health 2019, 43, 346–351. [Google Scholar] [CrossRef]
- Nakamura, R.; Suhrcke, M.; Jebb, S.A.; Pechey, R.; Almiron-Roig, E.; Marteau, T.M. Price promotions on healthier compared with less healthy foods: A hierarchical regression analysis of the impact on sales and social patterning of responses to promotions in Great Britain. Am. J. Clin. Nutr. 2015, 101, 808–816. [Google Scholar] [CrossRef]
- López, A.; Seligman, H.K. Online Grocery Store Coupons and Unhealthy Foods, United States. Prev. Chronic Dis. 2014, 11. [Google Scholar] [CrossRef]
- Smithson, M.; Kirk, J.; Capelin, C. Sugar reduction: The evidence for action Annexe 4: An analysis of the role of price promotions on the household purchases of food and drinks high in sugar. A research project for Public Health England conducted by Kantar Worldpanel; London. 2015. Available online: https://assets.publishing.service.gov.uk/government/uploads/system/uploads/attachment_data/file/470175/Annexe_4._Analysis_of_price_promotions.pdf (accessed on 6 October 2020).
- Martin, L.; Bauld, L.; Angus, K. Rapid Evidence Review: The Impact of Promotions on High Fat, Sugar and Salt (HFSS) Food and Drink on Consumer Purchasing and Consumption Behaviour and the Effectiveness of Retail Environment Interventions; NHS Health Scotland: Edinburgh, UK, 2017. [Google Scholar]
- Hales, C.M.; Carroll, M.D.; Fryar, C.D.; Ogden, C.L. Prevalence of obesity and severe obesity among adults: United States, 2017–2018. NCHS Data Brief 2020. Available online: https://www.cdc.gov/nchs/data/databriefs/db360-h.pdf (accessed on 6 October 2020).
- Grier, S.A.; Kumanyika, S.K. The Context for Choice: Health Implications of Targeted Food and Beverage Marketing to African Americans. Am. J. Public Health 2008, 98, 1616–1629. [Google Scholar] [CrossRef]
- Moran, A.J.; Musicus, A.; Findling, M.T.G.; Brissette, I.F.; Lowenfels, A.A.; Subramanian, S.; Roberto, C.A. Increases in Sugary Drink Marketing During Supplemental Nutrition Assistance Program Benefit Issuance in New York. Am. J. Prev. Med. 2018, 55, 55–62. [Google Scholar] [CrossRef]
- Lang, T.; Heasman, M. Food Wars: The Global Battle for Mouths, Minds and Markets, 2nd ed.; Routledge Earthscan: London, UK, 2015. [Google Scholar]
- Mancino, L.; Guthrie, J.F.; Ver Ploeg, M.; Lin, B. Nutritional Quality of Foods Acquired by Americans: Findings From USDA’s National Household Food Acquisition and Purchase Survey; U.S. Department of Agriculture Economic Research Service: Washington, DC, USA, 2018.
- 2012 Shopper Engagement Study Media Topline Report. 2012. Available online: http://ww1.prweb.com/prfiles/2012/05/08/9489590/Media-Topline-Final.pdf (accessed on 6 October 2020).
- Cohen, D.A.; Lesser, L.I. Obesity prevention at the point of purchase. Obes. Rev. 2016, 17, 389–396. [Google Scholar] [CrossRef]
- Rivlin, G. Rigged: Supermarket Shelves for Sale; Center for Science in the Public Interest: Washington, DC, USA, 2016. [Google Scholar]
- Kotler, P.; Armstrong, G. Principles of Marketing, 17th ed.; Pearson: London, UK, 2017. [Google Scholar]
- The Path to Efficient Trade Promotions; Nielsen. 2015. Available online: https://www.nielsen.com/us/en/insights/report/2015/the-path-to-efficient-trade-promotions/ (accessed on 6 October 2020).
- Backholer, K.; Sacks, G.; Cameron, A.J. Food and Beverage Price Promotions: An Untapped Policy Target for Improving Population Diets and Health. Curr. Nutr. Rep. 2019, 8, 250–255. [Google Scholar] [CrossRef]
- Glanz, K.; Bader, M.D.M.; Iyer, S. Retail grocery store marketing strategies and obesity: An integrative review. Am. J. Prev. Med. 2012, 42, 503–512. [Google Scholar] [CrossRef] [PubMed]
- Welch, V.; Petticrew, M.; Tugwell, P.; Moher, D.; O’Neill, J.; Waters, E.; White, H.; PRISMA-Equity Bellagio group. PRISMA-Equity 2012 extension: Reporting guidelines for systematic reviews with a focus on health equity. PLoS Med. 2012, 9. [Google Scholar] [CrossRef] [PubMed]
- Modesti, P.A.; Reboldi, G.; Cappuccio, F.P.; Agyemang, C.; Remuzzi, G.; Rapi, S.; Perruolo, E.; Parati, G.; ESH Working Group on CV Risk in Low Resource Settings. Panethnic differences in blood pressure in Europe: A systematic review and meta-analysis. PLoS ONE 2016, 11, e0147601. [Google Scholar] [CrossRef] [PubMed]
- Takahashi, N.; Hashizume, M. A systematic review of the influence of occupational organophosphate pesticides exposure on neurological impairment. BMJ Open 2014, 4, e004798. [Google Scholar] [CrossRef]
- Achrol, R.S. Slotting allowances: A time series analysis of aggregate effects over three decades. J. Acad. Mark. Sci. 2012, 40, 673–694. [Google Scholar] [CrossRef]
- Ayala, G.X.; D’Angelo, H.; Gittelsohn, J.; Horton, L.; Ribisl, K.; Sindberg, L.S.; Olson, C.; Kharmats, A.; Laska, M.N. Who is behind the stocking of energy-dense foods and beverages in small stores? The importance of food and beverage distributors. Public Health Nutr. 2017, 20, 3333–3342. [Google Scholar] [CrossRef]
- Dhar, S.K.; Hoch, S.J.; Kumar, N. Effective category management depends on the role of the category. J. Retail. 2001, 77, 165–184. [Google Scholar] [CrossRef]
- Efthymiou, N. Shelved Cases. Mark. Week 2003, 26, 43–44. [Google Scholar]
- Feig, B. Notes From Orlando. Frozen Food Age 2002, 51, 18. [Google Scholar]
- Gomez, M.I.; Maratou, L.M.; Just, D.R. Factors Affecting the Allocation of Trade Promotions in the U.S. Food Distribution System. Rev. Agric. Econ. 2007, 29, 119–140. [Google Scholar] [CrossRef]
- Guissoni, A.; Consoli, M.; Rodrigues, J. Is Category Management in Small Supermarket Worth the Effort? Rev. Adm. Empresas 2013, 53, 592–603. [Google Scholar] [CrossRef]
- Hamilton, S.F. Slotting Allowances as a Facilitating Practice by Food Processors in Wholesale Grocery Markets: Profitability and Welfare Effects. Am. J. Agric. Econ. 2003, 85, 797. [Google Scholar] [CrossRef]
- Henry, J.A.; Guthrie, J.C.; McLeod, G.F.H. A Model of Supermarket Pricing Behaviour. Asian J. Bus. Res. 2015, 5, 44–57. [Google Scholar] [CrossRef]
- Hingley, M.K. Power Imbalance in UK Agri-Food Supply Channels: Learning to Live with the Supermarkets? J. Mark. Manag. 2005, 21, 63–88. [Google Scholar] [CrossRef]
- Hyvonen, S.; Lindblom, A.; Olkkonen, R.; Ollila, P. Exploring the effects of manufacturers’ influence strategies and control on category performance in the grocery goods sector. Int. Rev. Retail Distrib. Consum. Res. 2010, 20, 311–333. [Google Scholar] [CrossRef]
- Laska, M.N.; Sindberg, L.S.; Ayala, G.X.; D’Angelo, H.; Horton, L.A.; Ribisl, K.M.; Kharmats, A.; Olson, C.; Gittelsohn, J. Agreements between small food store retailers and their suppliers: Incentivizing unhealthy foods and beverages in four urban settings. Food Pol. 2018, 79, 324–330. [Google Scholar] [CrossRef]
- Major, M. Charting new territory. Progress. Groc. 2005, 84, 104–108. [Google Scholar]
- Martinelli, E.; Marchi, G. Enabling and Inhibiting Factors in Adoption of Electronic-Reverse Auctions: A Longitudinal Case Study in Grocery Retailing. Int. Rev. Retail Distrib. Consum. Res. 2007, 17, 203–218. [Google Scholar] [CrossRef]
- Silveira, P.D.; Marreiros, C.G. Shopper Centric Category Management in Convenience Stores: A Qualitative Study. In Proceedings of the BE-ci 2016 International Conference on Business and Economics, Selangor, Malaysia, 21–23 September 2016; pp. 327–338. Available online: https://www.europeanproceedings.com/files/data/article/47/1416/article_47_1416_pdf_100.pdf (accessed on 6 October 2020).
- Stanton, J.L.; Herbst, K.C. Slotting allowances: Short-term gains and long-term negative effects on retailers and consumers. Int. J. Retail Distrib. Manag. 2006, 34, 187–197. [Google Scholar] [CrossRef]
- Urbanski, A. Captains of your fate? Progress. Groc. 2002, 81, 28. [Google Scholar]
- Food makers must prove their worth to the new “marketing aristocrats”. Mark. News 1988, 22, 23-23.
- Category management is working at Giant. Chain Store Age 1997, 73, 56.
- Managing for profits. Beverage Ind. 1997, 88, 20.
- Federal Trade Commission. Slotting Allowances in the Retail Grocery Industry: Selected Case Studies in Five Product Categories; 2003. Available online: https://www.ftc.gov/sites/default/files/documents/reports/use-slotting-allowances-retail-grocery-industry/slottingallowancerpt031114.pdf (accessed on 6 October 2020).
- Tan, P.J.; Corsi, A.; Cohen, J.; Sharp, A.; Lockshin, L.; Caruso, W.; Bogomolova, S. Assessing the sales effectiveness of differently located endcaps in a supermarket. J. Retail. Consum. Serv. 2018, 43, 200–208. [Google Scholar] [CrossRef]
- Gomez, M.I.; Rao, V.R. Market power and trade promotions in US supermarkets. Br. Food J. 2009, 111, 866–877. [Google Scholar] [CrossRef]
- Taillie, L.S.; Ng, S.W.; Xue, Y.; Harding, M. Deal or no deal? The prevalence and nutritional quality of price promotions among U.S. food and beverage purchases. Appetite 2017, 117, 365–372. [Google Scholar] [CrossRef]
- Price, R.K.; Livingstone, M.B.; Burns, A.A.; Furey, S.; McMahon-Beattie, U.; Holywood, L.E. What foods are Northern Ireland supermarkets promoting? A content analysis of supermarket online. Proc. Nutr. Soc. 2017, 76. [Google Scholar] [CrossRef]
- Bogomolova, S.; Dunn, S.; Trinh, G.; Taylor, J.; Volpe, R.J. Price promotion landscape in the US and UK: Depicting retail practice to inform future research agenda. J. Retail. Consum. Serv. 2015, 25, 1–11. [Google Scholar] [CrossRef]
- Coker, T.; Rumgay, H.; Whiteside, E.; Rosenberg, G.; Vohra, J. Paying the Price: New Evidence on the Link between Price Promotions, Purchasing of Less Healthy Food and Drink, and Overweight and Obesity in Great Britain; Cancer Research: Oxford, UK, 2019. [Google Scholar]
- Inmar Inc 2017 Marks the Demise of Print-at-Home Coupons as Digital Redemption Climbs 67%. Available online: https://www.inmar.com/blog/press/2017-marks-demise-print-home-coupons-digital-redemption-climbs-67 (accessed on 8 January 2020).
- Mussol, S.; Aurier, P.; de Lanauze, G.S. Developing in-store brand strategies and relational expression through sales promotions. J. Retail. Consum. Serv. 2019, 47, 241–250. [Google Scholar] [CrossRef]
- Guan, X.; Atlas, S.A.; Vadiveloo, M. Targeted retail coupons influence category-level food purchases over 2-years. Int. J. Behav. Nutr. Phys. Act. 2018, 15, 111. [Google Scholar] [CrossRef]
- Osuna, I.; González, J.; Capizzani, M. Which categories and brands to promote with targeted coupons to reward and to develop customers in supermarkets. J. Retail. 2016, 92, 236–251. [Google Scholar] [CrossRef]
- Zhang, N. Essays on Nudging Customers’ Behaviors: Evidence from Online Grocery Shopping and Crowdfunding. Ph.D. Thesis, Purdue University, West Lafayette, IN, USA, 2017. [Google Scholar]
- Huang, Y.; Hui, S.; Inman, J.; Suher, J. Capturing the “First Moment of Truth”: Understanding Point-of-Purchase Drivers of Unplanned Consideration and Purchase. Available online: https://www.msi.orghttps://www.msi.org/reports/capturing-the-first-moment-of-truth-understanding-point-of-purchase-drivers (accessed on 13 May 2020).
- Johnson, J.; Tellis, G.J.; Ip, E.H. To Whom, When, and How Much to Discount? A Constrained Optimization of Customized Temporal Discounts. J. Retail. 2013, 89, 361–373. [Google Scholar] [CrossRef]
- Andorfer, V.A.; Liebe, U. Do information, price, or morals influence ethical consumption? A natural field experiment and customer survey on the purchase of Fair Trade coffee. Soc. Sci. Res. 2015, 52, 330–350. [Google Scholar] [CrossRef] [PubMed]
- Fornari, E.; Fornari, D.; Grandi, S.; Menegatti, M. The influence of retailing -mix levers on private label market share: The case of the Italian FMCG market. J. Retail. Consum. Serv. 2013, 20, 617–624. [Google Scholar] [CrossRef]
- Panzone, L.; Tiffin, R. The Impact of Price Promotions on Producer Strategies in Markets With Large Product Heterogeneity. AGRIBUSINESS 2012, 28, 421–439. [Google Scholar] [CrossRef]
- Kacen, J.J.; Hess, J.D.; Walker, D. Spontaneous selection: The influence of product and retailing factors on consumer impulse purchases. J. Retail. Consum. Serv. 2012, 19, 578–588. [Google Scholar] [CrossRef]
- Breugelmans, E.; Campo, K. Cross-Channel Effects of Price Promotions: An Empirical Analysis of the Multi-Channel Grocery Retail Sector. J. Retail. 2016, 92, 333–351. [Google Scholar] [CrossRef]
- Pozzi, A. E-commerce as a stockpiling technology: Implications for consumer savings. Int. J. Ind. Organ. 2013, 31, 677–689. [Google Scholar] [CrossRef][Green Version]
- Arce-Urriza, M.; Cebollada, J.; Fernanda Tarira, M. The effect of price promotions on consumer shopping behavior across online and offline channels: Differences between frequent and non-frequent shoppers. Inf. Syst. E-Bus. Manag. 2017, 15. [Google Scholar] [CrossRef]
- Kim, C.; Xu, Y.; Hyde, K.F. Advertising versus Sales Promotion: An Examination of the Japanese Food Industry, 1976-2008. J. Glob. Sch. Mark. Sci. 2011, 21, 193–200. [Google Scholar] [CrossRef]
- Phipps, E.J.; Kumanyika, S.K.; Stites, S.D.; Singletary, S.B.; Cooblall, C.; DiSantis, K.I. Buying Food on Sale: A Mixed Methods Study With Shoppers at an Urban Supermarket, Philadelphia, Pennsylvania, 2010–2012. Prev. Chronic Dis. 2014, 11. [Google Scholar] [CrossRef] [PubMed]
- Felgate, M.; Fearne, A.; DiFalco, S.; Martinez, M.G. Using supermarket loyalty card data to analyse the impact of promotions. Int. J. Mark. Res. 2012, 54, 221–240. [Google Scholar] [CrossRef]
- Revoredo-Giha, C.; Akaichi, F.; Leat, P.M.K. Retailers’ Promotions: What Role Do They Play in Household Food Purchases by Degree of Food Access in Scotland? Available online: https://ageconsearch.umn.edu/record/189695 (accessed on 13 May 2020).
- Leeflang, P.S.H.; Parreño-Selva, J. Cross-category demand effects of price promotions. J. Acad. Mark. Sci. 2012, 40, 572–586. [Google Scholar] [CrossRef] [PubMed]
- Mamiya, H.; Moodie, E.E.M.; Ma, Y.; Buckeridge, D.L. Susceptibility to price discounting of soda by neighbourhood educational status: An ecological analysis of disparities in soda consumption using point-of-purchase transaction data in Montreal, Canada. Int. J. Epidemiol. 2018, 47, 1877–1886. [Google Scholar] [CrossRef]
- Sano, N.; Suzuki, T. Evaluation of Discount Effects Using Poisson Regression Based on Interaction Effects Between Bargain Scale and Product Category. In Proceedings of the 2013 IEEE 13th International Conference on Data Mining Workshops; Institute of Electrical and Electronics Engineers (IEEE), Dallas, TX, USA, 7–10 December 2013; pp. 234–241. [Google Scholar]
- Singh, S. Consumer Information Search and Choice in Retail Markets; ProQuest Information & Learning: Cambridge, UK, 2013. [Google Scholar]
- Talukdar, D.; Lindsey, C. To Buy or Not to Buy: Consumers’ Demand Response Patterns for Healthy versus Unhealthy Food. J. Mark. 2013. [Google Scholar] [CrossRef]
- Goic, M.; Jerath, K.; Srinivasan, K. Cross-Market Discounts. Mark. Sci. 2011, 30, 134–148. [Google Scholar] [CrossRef]
- Tran, T.-T. Factors affecting the impulse shopping intention of Vietnamese people: An application case in Ho Chi Minh City. Int. J. Adv. Appl. Sci. 2019, 6, 65–74. [Google Scholar] [CrossRef]
- Mortimer, G.S.; Weeks, C.S. Grocery product pricing and Australian supermarket consumers: Gender differences in perceived importance levels. Int. Rev. Retail Distrib. Consum. Res. 2011, 21, 361–373. [Google Scholar] [CrossRef]
- Čábelková, I.; Pogorilyak, B.; Strielkowski, W.; Stříteský, V. Customer Store Loyalty Determinants: A Case of the Czech Republic. Dlsu Bus. Econ. Rev. 2015, 25, 28–44. [Google Scholar]
- Farrag, D.A. Impact of Shari’ah on Consumers’ Behavior Toward Sales Promotion Tools: Focus on Egyptian Convenience Products. J. Food Prod. Mark. 2017, 23, 533–552. [Google Scholar] [CrossRef]
- Awan, H.M.; Siddiquei, A.N.; Haider, Z. Factors affecting Halal purchase intention-evidence from Pakistan’s Halal food sector. Manag. Res. Rev. 2015, 38, 640–660. [Google Scholar] [CrossRef]
- Jamal, A.; Peattie, S.; Peattie, K. Ethnic minority consumers’ responses to sales promotion sinthe packaged food market. J. Retail. Consum. Serv. 2012, 19, 98–108. [Google Scholar] [CrossRef]
- Liang, A.R.-D.; Yang, W.; Chen, D.-J.; Chung, Y.-F. The effect of sales promotions on consumers’ organic food response An application of logistic regression model. Br. Food J. 2017, 119, 1247–1262. [Google Scholar] [CrossRef]
- Caruso, W.; Corsi, A.M.; Bogomolova, S.; Cohen, J.; Sharp, A.; Lockshin, L.; Tan, P.J. The Real Estate Value Of Supermarket Endcaps Why Location In-Store Matters. J. Advert. Res. 2018, 58, 177–188. [Google Scholar] [CrossRef]
- Caspi, C.E.; Lenk, K.; Pelletier, J.E.; Barnes, T.L.; Harnack, L.; Erickson, D.J.; Laska, M.N. Association between store food environment and customer purchases in small grocery stores, gas-marts, pharmacies and dollar stores. Int. J. Behav. Nutr. Phys. Act. 2017, 14. [Google Scholar] [CrossRef]
- Nakamura, R.; Pechey, R.; Suhrcke, M.; Jebb, S.A.; Marteau, T.M. Sales impact of displaying alcoholic and non-alcoholic beverages in end-of-aisle locations: An observational study. Soc. Sci. Med. 2014, 108, 68–73. [Google Scholar] [CrossRef]
- Page, B.; Trinh, G.; Bogomolova, S. Comparing two supermarket layouts: The effect of a middle aisle on basket size, spend, trip duration and endcap use. J. Retail. Consum. Serv. 2019, 47, 49–56. [Google Scholar] [CrossRef]
- Phillips, M.; Parsons, A.G.; Wilkinson, H.J.; Ballantine, P.W. Competing for attention with in-store promotions. J. Retail. Consum. Serv. 2015, 26, 141–146. [Google Scholar] [CrossRef]
- Ranjan, B. Studying Shopping Decisions and Layout Planning in Physical Retail Settings; ProQuest Information & Learning: Cambridge, UK, 2018. [Google Scholar]
- Ruff, R.R.; Akhund, A.; Adjoian, T. Small Convenience Stores and the Local Food Environment: An Analysis of Resident Shopping Behavior Using Multilevel Modeling. Am. J. Health Promot. 2016, 30, 172–180. [Google Scholar] [CrossRef]
- Sanchez-Flack, J.; Pickrel, J.L.; Belch, G.; Lin, S.-F.; Anderson, C.A.M.; Martinez, M.E.; Arredondo, E.M.; Ayala, G.X. Examination of the Relationship between In-Store Environmental Factors and Fruit and Vegetable Purchasing among Hispanics. Int. J. Env. Res. Public Health 2017, 14. [Google Scholar] [CrossRef]
- Seva, R.R.; Go, K.; Garcia, K.; Grindulo, W. Predictive Model of Attention in Viewing Selected Grocery Products. Dlsu Bus. Econ. Rev. 2011, 21, 97–110. [Google Scholar]
- Walmsley, R.; Jenkinson, D.; Saunders, I.; Howard, T.; Oyebode, O. Choice architecture modifies fruit and vegetable purchasing in a university campus grocery store: Time series modelling of a natural experiment. BMC Public Health 2018, 18, 1149. [Google Scholar] [CrossRef] [PubMed]
- Banks, S. Tap into the treat trends. Conv. Store 2016, 57–60. [Google Scholar]
- Hong, S.; Misra, K.; Vilcassim, N. The Perils of Category Management: The Effect of Product Assortment on Multicategory Purchase Incidence. J. Mark. 2016, 80, 34–52. [Google Scholar] [CrossRef]
- Spanjaard, D.; Young, L.; Freeman, L. Emotions in supermarket brand choice: A multi-method approach. Qual. Mark. Res. Int. J. 2014, 17, 209–224. [Google Scholar] [CrossRef]
- Yildirim, Y.; Aydin, O. Investigation of the effects of discount announcements on consumers’ purchase decisions: A case study in supermarket. Procedia Soc. Behav. Sci. 2012, 62, 1235–1244. [Google Scholar] [CrossRef]
- Tacka, R.C. Consumer Impulsivity and Attitude: A Quantitative study of Instant Consumable Snack Food Purchases; ProQuest Information & Learning: Cambridge, UK, 2019. [Google Scholar]
- Levy, S.; Gendel-Guterman, H. Does advertising matter to store brand purchase intention? A conceptual framework. J. Prod. Brand Manag. St. Barbar. 2012, 21, 89–97. [Google Scholar] [CrossRef]
- Nordfält, J.; Lange, F. In-store demonstrations as a promotion tool. J. Retail. Consum. Serv. 2013, 20, 20–25. [Google Scholar] [CrossRef]
- Minnema, A.; Bijmolt, T.H.A.; Non, M.C. The impact of instant reward programs and bonus premiums on consumer purchase behavior. Int. J. Res. Mark. 2017, 34, 194–211. [Google Scholar] [CrossRef]
- Aziz, Y.; Chok, N. The Role of Halal Awareness, Halal Certification, and Marketing Components in Determining Halal Purchase Intention Among Non-Muslims in Malaysia: A Structural Equation Modeling Approach:: Vol 25, No 1. J. Int. Food Agribus. Mark. 2012, 25. [Google Scholar] [CrossRef]
- United States Department of Agriculture SNAP Retailer Data: 2019 Year End Summary; 2019. Available online: https://fns-prod.azureedge.net/sites/default/files/resource-files/2019-SNAP-Retailer-Management-Year-End-Summary.pdf (accessed on 18 May 2020).
- Donahue, M.; Mitchell, S. Dollar Stores Are Targeting Struggling Urban Neighborhoods and Small Towns. One Community Is Showing How to Fight Back; Institute for Local Self-Reliance: Washington, DC, USA, 2018; Available online: https://ilsr.org/dollar-stores-target-cities-towns-one-fights-back/ (accessed on 6 October 2020).
- Dollar Stores Are Taking Over the Grocery Business, and It’s Bad News for Public Health and Local Economies. Available online: https://civileats.com/2018/12/17/dollar-stores-are-taking-over-the-grocery-business-and-its-bad-news-for-public-health-and-local-economies/ (accessed on 18 May 2020).
- 2019 Ecommerce in Review: U.S. Online Grocery Sales. Available online: https://www.digitalcommerce360.com/2019/12/24/2019-ecommerce-in-review-online-grocery-sales/ (accessed on 18 May 2020).
- Redman, R. Online Grocery Sales to Grow 40% in 2020. Available online: https://www.supermarketnews.com/online-retail/online-grocery-sales-grow-40-2020 (accessed on 18 May 2020).


| Trade Promotion Practice (n) | Definition |
|---|---|
| Category management (11) | Collaboration between retailers and manufacturers to make decisions regarding product assortment, supply, pricing, and promotion for entire categories |
| Slotting allowances (7) | Lump-sum fees paid by manufacturers to retailers in exchange for access to the consumer market (e.g., shelf space, prominent placement) |
| Price discounts (4) | Fixed discounts (merchandise is sold at a set discount for a specified period) or performance-based discounts (discounts are tied to a measure of performance such as units sold or displayed) |
| Cooperative advertising (1) | Cost-sharing between retailers and manufacturers to create and distribute promotional materials |
| Reference | Marketing Strategy | Retail Format | Country | Study Duration | Data Source | Objective | Outcome | Key Findings |
|---|---|---|---|---|---|---|---|---|
| Andorfer, et al. (2015) [59] | Price | Supermarket/ grocery store | Germany | 5 mo (5 March, 2012– 29 July 2012) | Scanner/panel data Customer surveys Direct observation | To identify how information, price, and moral considerations influence consumers’ purchases of fair trade (FT) coffee products. | Purchase volume Purchase frequency | - A 20% TPR had a positive effect on coffee purchase volume when compared to the effects of information and moral appeal. |
| Arce-Urriza, et al. (2017) [65] | Price | Supermarket/ grocery store Online retailer | Spain | 6 mo (15 May 2007–15 November 2007) | Scanner/panel data | To evaluate the differential effect of price promotions on brand choice when shopping at a grocery store’s online outlet vs. brick-and-mortar store. | Brand choice | - Price promotions had a positive effect on purchases made in-person but not on purchases made online. - Frequent customers were more responsive to price promotions than infrequent customers. |
| Awan, et al. (2015) [80] | Price Promotion | Not specified | Pakistan | Not specified | Customer surveys | To identify which factors affect consumers’ decisions to purchase Halal food. | Purchase attitude | - Customers were influenced by Halal marketing and branding practices (e.g., sales promotions and celebrity endorsements). - Customers were willing to spend considerable effort and money to purchase Halal food as a result of Halal marketing. |
| Aziz, et al. (2013) [101] | Promotion | Other (shopping mall) | Malaysia | Not specified | Customer surveys | To determine the relationships between factors, including Halal marketing, and intention to purchase Halal products. | Purchase attitude | - Halal marketing promotion was positively related to purchase intention. |
| Banks et al. (2016) [93] | Placement | Convenience store | UK | Not specified | Marketing data | To describe the impact of endcap placement and shelf-ready cases for cookies sales. | Purchase volume Spending Market share | - Marketing efforts led to an increase in shoppers’ basket size (two-fold increase), spending (£3 increase), and market size (increased to £3.8bn) for cookies. |
| Bogomolova et al. (2019) [50] | Price | Supermarket/ grocery store | Australia | 3 years (2 February 2012–31 December 2014) | Interviews/focus groups Loyalty card data | To assess reasons for first-time and impulse purchases | Product trialing Impulse purchasing | - The most common factor that prompted first-time brand purchases and impulse purchases was an item being placed on price promotion or having a special offer. |
| Breugelmans and Campo (2016) [63] | Price | Supermarket/ grocery store Online retailer | UK | 78 weeks (July 2006–December 2007) | Scanner/panel data | To examine the cross-channel effects of price promotions (online vs. offline) on category purchase decisions. | Purchase incidence Purchase volume | - Price promotions had positive effects on purchasing decisions and degree of impact varied based on customer brand loyalty. - Promotions in one channel decreased category purchases in the other channel during the promotion period (online price promotions had a stronger impact on offline purchase decisions than vice versa). - High promotion frequency had negative effects on future promotion effectiveness. |
| Čábelková et al. (2015) [78] | Price | Supermarket/ grocery store | Czech Republic | 2 months (October 2013–November 2013) | Customer surveys | To determine which activities are associated with customer store loyalty and differential effects by customer socio-demographic characteristics. | Customer loyalty | - Customer loyalty is linked to low prices and discount sales. - 44% of respondents said prices were one of the factors that compel them to make all their purchases in only one supermarket chain. - Probability of ranking prices and sales promotions as important factors was higher among older respondents and respondents who spent more monthly at supermarkets. |
| Caruso et al. (2018) [83] | Placement | Supermarket/ grocery store | Australia, New Zealand | 56 hours (December 2008 and December 2015) | Direct observation | To assess how foot traffic and visual reach of endcaps differ by location. | Foot traffic Visual attention | - Back-of-store endcaps had 24% more foot traffic and 30% more visual reach than front-of-store endcaps. |
| Caspi et al. (2017) [84] | Placement Promotion | Dollar store Convenience store Other (pharmacy) | US | 5 months (July 2014–November 2014) | Customer surveys Direct observation | To examine whether customers who shop at small/non-traditional food stores with more health promotions make healthier purchases. | Healthy eating index-2010 (HEI) score of products purchased | - Controlling for individual characteristics and store type, HEI scores for purchases were higher in stores with greater shelf space for fruits and vegetables. - Healthy advertisements on the store exterior were associated with lower purchase HEI scores. - The presence of interior healthy advertisements were not associated with purchase HEI scores. |
| Farrag (2012) [79] | Price | Supermarket/ grocery store | Egypt | Not specified | Interviews/focus groups | To measure to what extent compliance with Shariah moderates the relationship between sales promotion methods (price discount, product sampling, buy one get one free, sweepstakes/ lucky draws, scratch and win offers) of convenient products and consumer behaviors (product trial, stockpiling, spending more). | Purchase attitude | - Price discounts and buy-one-get-one were associated with self-reported stockpiling and spending more. - Price discounts had the strongest impact on consumer behavior (compared to sweepstakes/ lucky draw, scratch-and-win, free samples). - The relationship between price discounts and consumer behavior was moderated by Shariah law because some practices (e.g., scratch-and-win and sweepstake draws) were not compliant with Shariah law. |
| Felgate et al. (2012) [68] | Price | Supermarket/ grocery store | UK | 86 weeks (29 May 2006–21 January 2008) | Scanner/panel data | To assess how supermarket loyalty card data can be used to analyze the effect of price promotions on spending. | Spending by product subgroup | - Promotions accounted for 14% of the variance in sales of beef. - While overall impact of promotion on sales of beef was insignificant, there was variability by cut of meat, customer group, and price promotions. |
| Fornari et al. (2013) [60] | Price | Supermarket/ grocery store | Italy | 2011 | Scanner/panel data | To assess the impact of different retailing-mix levers on private label market share. | Purchase volume | - Findings suggest partial support for price promotion increasing market share. - A significant presence on shelves, in width (increase in the number of product categories) and depth (increase in the number of SKUs in each product category) increased sales, suggesting that assortment is more important than price promotion. |
| Goić et al. (2011) [75] | Price | Supermarket/ grocery store | US | Not specified | Not specified | To investigate the effects of cross-market promotions (e.g., grocery store purchases that lead to price discounts for gas) on purchase volume and sales price. | Purchase volume Sales price | - Offering cross-market discounts on gas for grocery purchases led to an increase in both price and quantity of groceries purchased. |
| Guan et al. (2018) [54] | Price | Supermarket/ grocery store | US | 2 years (2003–2005) | Scanner/panel data | To compare the effects of individually-targeted coupons for less healthful and more healthful foods on consumer purchasing patterns. | Purchase volume | - Being exposed to coupons resulted in an increase in the rate of purchase as compared to those without coupons. - People responded more to targeted coupons than to untargeted coupons. - Targeted coupons significantly increased purchases of both healthy and less healthy items, with greater increases in the purchases of less healthy items. |
| Hong et al. (2016) [94] | Placement | Supermarket/ grocery store | UK | Not specified | Scanner/panel data Direct observation | To examine whether the assortment or placement of one category affects purchase incidence in a different category that shares a common display space (e.g., frozen meals and ice cream). | Purchase incidence | - Consumers were less likely to purchase from a category of a given assortment when it was presented with another category assortment of greater variety and this effect was driven by the display proximity. |
| Huang et al. (2012) [57] | Price | Supermarket/ grocery store | US | Not specified | Customer surveysDirect observation | To identify shopper trip-level and point-of-purchase-level drivers of unplanned consideration and purchase behavior. | Purchase incidenceImpulse purchases | - An impulse purchase was more likely if a shopper viewed fewer product shelf displays, stood closer to the shelf, and referenced external information. |
| Jamal et al. (2012) [81] | Price | Supermarket/ grocery store | UK | Not specified | Interviews/focus groups | To investigate “ethnic” consumers’ responses to different sales promotions. | Perceived importance for purchase decisions | - “Ethnic” customers reported a range of responses to sales promotion—some were responsive, some hostile—depending on the “net worth” of the sales promotion. |
| Johnson et al. (2013) [58] | PlacementPrice | Supermarket/ grocery store | US | Not specified | Scanner/panel data | To examine how customized temporal discounts influence consumers’ decisions to purchase products and overall profit of the retailers. | Purchase incidence Brand choice Profit | - The customization of discounts by time and value yielded an increase in profits of 18–40% relative to a model that optimizes the value of the discounts. |
| Kacen et al. (2012) [62] | Placement Price | Supermarket/ grocery store | US | Not specified | Customer surveys | To assess the effect of retailing factors on the likelihood that a consumer will make an impulse purchase. | Impulse purchasing | - Products on sale and on display in a high–low pricing store increased the probability of an impulse buy to 7%. - A product had a 13.3% likelihood of being purchased if it was not on sale but a 17.6% likelihood if it was on sale. - A product had a 13.3% likelihood of being purchased if it was not on display, but a 20% likelihood if it was on display. |
| Kim et al. (2011) [66] | Price | Not specified | Japan | 32 years (1976–2008) | Scanner/panel data Marketing data | To understand how changes among manufacturers in budget allocation from advertising to sales promotion affects sales volume and profitability. | Purchase volume profit | - Expenditure on sales promotion was associated with an increase in total volume sales but a decrease in profitability. |
| Leeflang et al. (2012) [70] | Price | Supermarket/ grocery store | Spain | 1 year | Scanner/panel data | To determine the impact of price promotions in one category on the revenues of other categories. | Purchase volume Sales revenue | - Half of all price promotions expanded revenues for that category, especially for categories with deeper supported discounts. - There was a 61% probability that a price promotion affected sales of at least one other category. - Cross-promotional effects between categories more closely located in a store existed. |
| Levy and Gendel-Guterman (2012) [98] | Promotion | Supermarket/ grocery store | Not specified | Not specified | Customer surveys | To understand how consumer characteristics are correlated with advertising and the tendency to impulse buy store brands. | Impulse purchasing | - Advertising was positively correlated to the tendency to engage in impulse buying. |
| Liang et al. (2017) [82] | PromotionPrice | Other (organic market) | Taiwan | 2 month (2012) | Customer surveys | To understand organic food consumers’ preferences for specific promotional programs (e.g., discounts, giveaways, limited time offers). | Purchase attitude | - Consumers preferred the programs in the discount category and the free giveaway category. - Limited time offers reduced purchase intention. |
| Mamiya et al. (2018) [71] | Price | Supermarket/ grocery store Convenience storeOther (pharmacy) | Canada | 6 years (January 2008–December 2013) | Scanner/panel data | To assess whether there was a differential impact of price discounting of soda on sales by store-neighborhood education. | Purchase volume | - Across all levels of education and types of store, discounting was positively associated with soda sales. - The modification of the effect of price discounting by education was most prominent in pharmacies, where the average log sales associated with discounting increased as education decreased. |
| Minnema et al. (2017) [100] | Promotion | Supermarket/ grocery store | Netherlands | 20 weeks (2010) | Scanner/panel data | To examine the effectiveness of instant reward programs with bonus premiums (i.e., collectible giveaways). | Shopping tripsCategory purchase incidence Brand choice Purchase volume | - Instant giveaway of collectible premiums resulted in increased brand and category choice probability, but no change in purchase quantity. - Consumers were more likely to choose the promoted brand if it was promoted with both the bonus premium and price discount compared to when it was promoted with just a price discount. |
| Mortimer and Weeks (2011) [77] | Price | Supermarket/ grocery store | Australia | Not specified | Customer surveys | To examine how price information is differentially considered by men and women in an Australian grocery store and how this affects grocery shopping behavior. | Purchase attitude | - The mean score for how consumers rate the importance of promotional pricing on their shopping decisions was 4.41 out of 5. - Men considered price attributes of products and promotional tactics as being significantly lower in importance than did women. |
| Mussol et al. (2019) [53] | Promotion Price | Supermarket/ grocery store | France | Not specified | Customer surveys | To explore in-store sales promotions as a tool in developing in-store relationships with consumers. | Purchase attitude | - Samplings, in-store games, lotteries nurtured consumer loyalty and relationships with brands. - Price-based promotions should be used to trigger purchases, whereas non-monetary promotions should be used to nurture brand relationships. |
| Nakamura et al. (2014) [85] | Placement | Supermarket/ grocery store | UK | Not specified | Scanner/panel data | To estimate of the effect of end-of-aisle display on sales. | Purchase volume | - End-of-aisle display increased sales volumes by 23.2% for beer, 33.6% for wine, and 46.1% for spirits, by 51.7% for carbonated drinks, 73.5% for coffee, and 113.8% for tea. - The effect size was equivalent to a decrease in price of between 4% and 9% per volume for alcohol categories, and a decrease in price of between 22% and 62% per volume for non-alcohol categories. |
| Nakamura et al. (2015) [6] | Price | Supermarket/ grocery store Convenience storeOther (various) | UK | 1 years (2010) | Scanner/panel data | To investigate if consumers are more responsive to promotions on less-healthy products; and if there are socioeconomic differences in food purchases in response to price promotions. | Purchase volume | - After controlling for the reference price, price discount rate, and brand-specific effects, the sales uplift arising from price promotions was larger in less-healthy than in healthier categories. - A 1% increase in the depth of price discount led to a sales uplift by 1.44% within a given category. |
| Nordfält and Lange (2013) [99] | Promotion | Supermarket/ grocery store | Sweden | 2 weeks (April 2008 and March 2009) | Scanner/Panel data Customer surveys | To investigate when and how in-store demonstrations work best. | Purchase volume | - In-store demonstrations increased sales, particularly when: closer to the weekend, the product was displayed next to the demonstration (235.07% increase), there was personnel offering the demonstration (24.31% increase), there was signage promoting the product (90.76% increase), and a commercial was run on an in-store TV (36.32%). - There was no significant change when in-store demonstrations were offered in a higher traffic area. |
| Osuna et al. (2016) [55] | Price | Supermarket/ grocery store | Not specified | 2 years (2008–2009) | Loyalty card data | To explore how targeted coupons influence the uptake of new category and brand purchases. | Coupon redemption Product trialing | - To entice customers to buy in new categories, coupon redemption rates were higher for leading brands and categories that are popular, easy to store, have a low number of SKUs, and are frequently on sale. - To increase incremental purchases, coupons should be in categories that have low purchase frequency and high number of SKUs. |
| Page et al. (2019) [86] | Placement | Supermarket/ grocery store | Australia | 24 hours | Direct observation | To explore the shopper traffic entering and exiting the middle aisle, and interaction with endcap promotions. | Shopper traffic Endcap use Basket size | - Overall use of endcaps in the store with a middle aisle was lower than that in the store with standard layout. - In a standard store, 2.2% of all observed shoppers were interacting with an endcap (48% at rear, 52% at front of store), while in the store with the middle aisle, 1.6%, (24% at the rear, 38% at the front, and 39% in the middle). |
| Panzone and Tiffin (2012) [61] | Price | Supermarket/ grocery store Convenience storeOther (liquor store) | England | Not specified | Customer surveys Receipts | To assess the impact of price promotions on wine on consumer purchases | Purchase volumePurchase initiation | - The presence of a discount was influential in determining what to buy (74% of the total impact of the discount), with a smaller effect on how much of a wine to buy (26% of the total impact), and no influence on interpurchase time. - Consumers primarily used discounts to determine the segment they will purchase from, and secondarily to purchase multiple units of the wine they had chosen. |
| Phillips et al. (2015) [87] | Placement Promotion | Supermarket/ grocery store | US | 3 days | Direct observation | To explore whether the effectiveness of an end-of-aisle display is weakened if there is a product demonstration occurring near the end-of-aisle. | Visual attention | - The presence of an in-store demonstration near the end-of-aisle affected shoppers’ attention paid to the end-of-the-aisle. - The best way to attract attention to the end-of-aisle was not to have an in-store demonstration near it. |
| Phipps et al. (2010) [67] | Price | Supermarket/ grocery store | US | Not specified | Scanner/panel data Interview/focus groups | To explore the associations of discounted prices on supermarket purchases of selected high-calorie foods and more healthful, low-calorie foods. | Purchase volume Purchase attitude | - Odds of purchasing on price promotion compared with off promotion was 2.4 for high-calorie products and 1.2 for low-calorie products. - Odds of purchasing on sale versus full price were higher for sweet snacks, grain-based snacks, and sugar-sweetened beverages. - Participants emphasized the lure of sale items and said they took advantage of sales to stock up. |
| Point of Purchase Advertising International (2012) [15] | Placement | Supermarket/ grocery store | US | Not specified | Customer surveys Direct observation Other (store audit) | To investigate how shoppers are interacting with the in-store environment. | Purchase volume | - More than 1 in 6 purchases were made when a display with that brand was present in store. |
| Pozzi (2013) [64] | Price | Supermarket/ grocery store Online retailer | US | 2 years (June 2004–June 2006) | Scanner/panel data | To assess if the introduction of e-commerce affects bulk purchase and stockpiling behavior by customers. | Purchase volume Impulse purchasing | - The share of expenditure on discounted items rose by 9–20% with the introduction of e-commerce. - Online shopping did not increase the likelihood of buying promoted items but positively impacted the amount customers bought when they bought promoted items. - The amount of purchasing increases as the amount of discount increases. |
| Ranjan (2018) [88] | Placement | Supermarket/ grocery store | US | 8 months (1 May 2015–31 December 2015) | Scanner/panel data Loyalty card data Marketing data | To explore how category location, adjacencies, size and merchandizing determine consumers’ category choices. | Spending Purchase volume | - Moving to a central (peripheral) position in the layout improved purchase quantity and purchase incidence. - There was an overall “attention-stealing” effect of having neighbors. |
| Revoredo-Giha (2015) [69] | Price | Supermarket/ grocery store Convenience store Other (various) | UK | 2006–2013 | Scanner/panel data | To analyze the overall effect of price promotions on consumers’ food purchases. | Spending | - Price promotions had a positive effect on total household expenditure and expenditure by category across socioeconomic quintiles. - Consumers responded positively to price promotions on fruits, vegetables, soft drinks, juices, fats, and eggs. |
| Ruff et al. (2016) [89] | Placement Promotion | Convenience store | US | Not specified | Customer surveys Other (bag check) | To study how placement of products and signs in small convenience stores influence shopping behavior. | Purchase incidence | - Placement of water at eye-level and of produce in at the front of the store was not associated with sugar-sweetened beverage purchases. - Signs advertising water and sugar-sweetened beverages were not associated with sugar-sweetened beverage purchases. |
| Sanchez-Flack et al. (2017) [90] | Placement Promotion | Convenience store | US | 1 years (2010) | Customer surveys Other (store audit) | To examine how product availability, placement, and promotion were associated with fruit and vegetable purchasing among Hispanic customers in San Diego County. | Purchase volume Spending | - Each additional square foot of display space dedicated to fruits and vegetables and each additional fresh fruits and vegetables display were associated with a $0.02 increase and $0.29 decrease, respectively, in fruit and vegetable purchasing. |
| Sano and Suzuki (2013) [72] | Price | Supermarket/ grocery store | Japan | 1 months (May 2009–June 2009) | Scanner/panel data Other (shopping path) | To determine the share of product categories that should be included on discount flyers. | Purchase volume | - Price promotion of items would likely increase sales, particularly in some categories like drinks and western deli. - Price promotion would be less effective where there are already a lot of discounts. |
| Seva et al. (2011) [91] | Placement | Supermarket/ grocery store | Philippines | Not specified | Customer surveysDirect observation | To assess the effect of shelf position and product characteristics on the number and duration of eye fixations on a grocery shelf containing junk foods. | Visual attention | - Products placed at the top shelf received the highest attention from consumers as compared to the products placed on the other levels (the eye-level of majority of the subjects was in line with the top shelf). - Consumer attention decreased as the products’ vertical position deviated from eye-level. |
| Singh (2013) [73] | PromotionPrice | Supermarket/ grocery store | US | Not specified | Scanner/panel data | To investigate how pricing and promotion in frequently purchased categories influenced consumer visits to competing multiproduct grocery stores. | Store choice | - Own-store and cross-store prices, and own-store and cross-store feature advertising in frequently purchased categories impacted consumers’ choice. - For stockpiling categories, the own store feature activity (but not own store price) positively influenced consumer choice. |
| Smithson et al. (2015) [8] | Price | Supermarket/ grocery store Convenience store Other (various) | UK | 52 weeks (December 2004–December 2005) | Scanner/panel data | To explore the role that price promotions play in purchasing levels of high-sugar food and drinks. | Purchase volume Brand switching | - 1/5 of foods and beverages bought on price promotion were purchased in addition to what would be expected for a given category if the price promotion was not in place. - Price promotions led to short-term brand switching. - Price promotions led to an overall increase in take-home food and drink volumes. |
| Spanjaard (2014) [95] | Promotion | Supermarket/ grocery store | Australia | Not specified | Customer surveys Direct observation Interviews/focus groups Other (diaries) | To understand which factors drive customer purchasing decisions. | Purchase attitude | - 41% of survey participants said they were influenced by promotional offers. - Trust and emotional connection the brand that are main purchasing decision drivers for customers. |
| Tacka (2019) [97] | Promotion | Not specified | US | 5 days (19 September 2018–24 September 2018) | Customer surveys | To investigate the relationship between marketing activities (among other factors) and purchases of instant consumable snack foods | Purchase attitude | - Marketing activities were rated, on average, as being of “little importance” or “neither important nor unimportant,” when purchasing an instant consumable snack food. |
| Talukdar and Lindsey (2013) [74] | Price | Supermarket/ grocery store | US | 52 weeks (2003–2004) | Scanner/panel data Customer surveys | To predict the effects of price changes on consumers’ food consumption behavior. | Purchase volume | - For healthy food, demand sensitivity was greater for a price increase than for a price decrease. - For unhealthy food, demand sensitivity was greater for a price decrease than a price increase. |
| Tan et al. (2018) [46] | Placement | Supermarket/ grocery store | Australia | Not specified | Scanner/panel data Direct observation | To compare the sales effectiveness of front versus back located end-of-aisle promotional displays in a supermarket. | Purchase volume | - Rear endcaps generated 416% sales uplift while front endcaps generated 346% sales uplift. |
| Tran (2019) [76] | PromotionPrice | Supermarket/ grocery store | Vietnam | 2 weeks | Customer surveys | To investigate factors that influence customers’ impulse purchasing behavior. | Purchase attitude | - Sale promotion, presence of family and friends, emotion, merchandise display, money available and festival season accounted for 65.162% of impulse buying behavior. |
| Walmsley et al. (2018) [92] | Placement | Supermarket/ grocery store | England | 170 weeks (January 2012–July 2017) | Scanner/panel data | To examine the effect of the store re-arrangements on purchasing of fruits and vegetables. | Purchase volume Spending | - The effect of the shop re-arrangement to make fruit and vegetables more prominent and moving the fruit and vegetable display to face the entrance led to an increase in sales and total dollars spent on fruits and vegetables. |
| Yildirim and Aydin (2012) [96] | Promotion | Supermarket/ grocery store | Turkey | 10 days | Customer surveys | To assess the effect of supermarket announcements on customer behavior while shopping. | Purchase attitude | - Announcements related to price discounts, buy-one-get-one offers, membership deals, giveaways, and coupons were most desired and impactful announcements. - The most noticed type of announcement focused on price discounts. |
| Zhang (2017) [56] | Price | Online retailer | US | 2 weeks (13 January 2014–26 January 2014) | Scanner/panel data | To evaluate the impact of coupons and informational nudges to customers identified through modeling on purchasing. | Purchase incidence | - Providing information and discounts to specific customers who are selected through modeling led to a higher conversion to purchase products. |
© 2020 by the authors. Licensee MDPI, Basel, Switzerland. This article is an open access article distributed under the terms and conditions of the Creative Commons Attribution (CC BY) license (http://creativecommons.org/licenses/by/4.0/).
Share and Cite
Hecht, A.A.; Perez, C.L.; Polascek, M.; Thorndike, A.N.; Franckle, R.L.; Moran, A.J. Influence of Food and Beverage Companies on Retailer Marketing Strategies and Consumer Behavior. Int. J. Environ. Res. Public Health 2020, 17, 7381. https://doi.org/10.3390/ijerph17207381
Hecht AA, Perez CL, Polascek M, Thorndike AN, Franckle RL, Moran AJ. Influence of Food and Beverage Companies on Retailer Marketing Strategies and Consumer Behavior. International Journal of Environmental Research and Public Health. 2020; 17(20):7381. https://doi.org/10.3390/ijerph17207381
Chicago/Turabian StyleHecht, Amelie A., Crystal L. Perez, Michele Polascek, Anne N. Thorndike, Rebecca L. Franckle, and Alyssa J. Moran. 2020. "Influence of Food and Beverage Companies on Retailer Marketing Strategies and Consumer Behavior" International Journal of Environmental Research and Public Health 17, no. 20: 7381. https://doi.org/10.3390/ijerph17207381
APA StyleHecht, A. A., Perez, C. L., Polascek, M., Thorndike, A. N., Franckle, R. L., & Moran, A. J. (2020). Influence of Food and Beverage Companies on Retailer Marketing Strategies and Consumer Behavior. International Journal of Environmental Research and Public Health, 17(20), 7381. https://doi.org/10.3390/ijerph17207381