Article

A Computational Biomechanics Human Body Model Coupling Finite Element and Multibody Segments for Assessment of Head/Brain Injuries in Car-To-Pedestrian Collisions

1
School of Mechanical and Automotive Engineering, Xiamen University of Technology, Xiamen 361024, China
2
Fujian Collaborative Innovation Center for R&D of Coach and Special Vehicle, Xiamen 361024, China
3
School of Automotive and Mechanical Engineering, Changsha University of Science & Technology, Changsha 410205, China
4
School of Mechanical Engineering, Hunan University of Science and Technology, Xiangtan 411201, China
5
State Key Laboratory of Advanced Design and Manufacturing for Vehicle Body, Hunan University, Changsha 410082, China
*
Author to whom correspondence should be addressed.
Int. J. Environ. Res. Public Health 2020, 17(2), 492; https://doi.org/10.3390/ijerph17020492
Submission received: 21 November 2019 / Revised: 22 December 2019 / Accepted: 8 January 2020 / Published: 13 January 2020

Abstract

:
It has been challenging to efficiently and accurately reproduce pedestrian head/brain injury, which is one of the most important causes of pedestrian deaths in road traffic accidents, due to the limitations of existing pedestrian computational models, and the complexity of accidents. In this paper, a new coupled pedestrian computational biomechanics model (CPCBM) for head safety study is established via coupling two existing commercial pedestrian models. The head–neck complex of the CPCBM is from the Total Human Model for Safety (THUMS, Toyota Central R&D Laboratories, Nagakute, Japan) (Version 4.01) finite element model and the rest of the parts of the body are from the Netherlands Organisation for Applied Scientific Research (TNO, The Hague, The Netherlands) (Version 7.5) multibody model. The CPCBM was validated in terms of head kinematics and injury by reproducing three cadaveric tests published in the literature, and a correlation and analysis (CORA) objective rating tool was applied to evaluate the correlation of the related signals between the predictions using the CPCBM and the test results. The results show that the CPCBM head center of gravity (COG) trajectories in the impact direction (YOZ plane) strongly agree with the experimental results (CORA ratings: Y = 0.99 ± 0.01; Z = 0.98 ± 0.01); the head COG velocity with respect to the test vehicle correlates well with the test data (CORA ratings: 0.85 ± 0.05); however, the correlation of the acceleration is less strong (CORA ratings: 0.77 ± 0.06). No significant differences in the behavior in predicting the head kinematics and injuries of the tested subjects were observed between the TNO model and CPCBM. Furthermore, the application of the CPCBM leads to substantial reduction of the computation time cost in reproducing the pedestrian head tissue level injuries, compared to the full-scale finite element model, which suggests that the CPCBM could present an efficient tool for pedestrian brain-injury research.

1. Introduction

According to the latest report by the World Health Organization, about 1.25 million people worldwide die from road traffic accidents each year, of which pedestrians account for about 22% of the fatal injuries [1]. The traffic accident reconstruction technology has been widely utilized to analyze the cause of human injuries in the accident, further improve the safety design of vehicles [2], and eventually prevent or reduce the fatal damage to pedestrians. Human body computational biomechanics models are the core of traffic accident reconstruction technology, which have become one of the most important tools in the pedestrian protection research and automotive safety design.
At present, the pedestrian computational biomechanics models used in the study of pedestrian protection mainly include multibody (MB) (e.g., the Netherlands Organisation for Applied Scientific Research (TNO) model [3]) and finite element (FE) models (e.g., the Total Human Model for Safety (THUMS) model by Toyota Central R&D Laboratories [4,5]). The TNO model has been validated under various collision scenarios, by means of cadaver tests [6,7], dummy tests [2], and the pedestrian kinematics/injury prediction from the reconstruction of real-world accidents [8,9,10]. For instance, Linder et al. [9] reconstructed six car-to-pedestrian accidents using the TNO model, and the results showed that the impact locations of the vehicle exterior coincided with the reported vehicle damage, and the predicted pedestrian throw distance errors were within 20% when compared to the actual collision data. The THUMS model, as one of the most widely used pedestrian FE models, has been validated at both the segment [11,12,13] and the full-scale levels [14,15,16]. Recently, Wu et al. [17] further evaluated the biofidelity of the THUMS model (Version 4.01) in a whole-body car-to-pedestrian impact condition by reproducing three full-scale postmortem human subjects (PMHSs) impact tests, in which the whole body’s response data (that included head, thoracic T1 and T8, pelvis, left and right femur, etc.) between the simulation and experiment were evaluated.
As is well-known, the MB model is far less realistic than the FE model in terms of human biofidelity and the contacts definition between the rigid bodies, and is not able to calculate the human tissue level injury (such as stress, strain). However, such a model can efficiently reproduce the pedestrian kinematic in an accident and output the kinematic-based injuries, which is convenient for quick reconstruction of complicated traffic accidents or for massive simulations [18,19,20,21,22,23,24]. Compared to the MB model, the advantage of the FE model, being able to represent detailed human anatomical structure, makes it possible to study human tissue level injuries. However, the FE model requires high computational resources for the model adjustment and computations, which means that it is not realistic to conduct complicated traffic accident reconstruction using solely the FE model [25].
Head injury has been identified to be the most common cause of pedestrian fatality in pedestrian accidents, and substantial research efforts have been made focusing on pedestrian head injury biomechanics and prevention [25,26,27,28,29]. In this field, the FE model was frequently used for assessment of the pedestrian brain tissue injury, as the importance of brain deformation on traumatic brain injury had been extensively confirmed. However, due to the relatively low time efficiency in repositioning the impact conditions and simulating the impact of the accident event, the application of the full-scale FE model is now limited to parametric study concentrating on the defined impact scenarios by varying impact velocity, pedestrian position or angle with respect to the vehicle, e.g., [13,24,30]. In order to predict pedestrian head/brain injury responses in an accurate and efficient way by reproducing real-world car-to-pedestrian impact accidents, two popular approaches are usually employed:
(a)
Firstly, multibody dynamics analysis software (such as MADYMO [31]) is used to reconstruct the accident, then the boundary conditions (e.g., initial linear and angular velocity/acceleration, initial position, etc.) at the instant of head–vehicle contact are extracted and applied to the isolated FE head model (head-only) complemented by the FE vehicle subsystem model (such as windshield or bonnet) to obtain skull fracture and brain tissue injury data [32,33,34,35].
(b)
The accident is firstly reproduced with the full-scale MB models, similar to the above approach, and the time histories of the six degrees of freedom of the head center of gravity (COG) during the whole impact event are taken out from the MB reconstruction and prescribed to the head-only FE model to reproduce the brain tissue injury [36,37].
Both methods have dramatically decreased the time required for pedestrian repositioning and calculation compared to the full-scale FE models. However, there are still limitations. Specifically, the former one ignored the influence of the rest of the human body on head kinematics and injury response during the head–vehicle impact, which has been confirmed in the literature [38,39,40]. In addition, the head–ground impact was not considered; the latter one, relying on the assumption that the skull is a rigid body, may produce a remarkable difference in predicting brain tissue responses.
Overall, the obvious advantages and disadvantages of the FE and MB pedestrian computational biomechanics models mean that research on brain injury in car impact accidents is still challenging. In order to overcome these limitations. Shu [41] applied mesh morphing technology [42,43] to the study of impact injury in obese children, which helped to simplify the FE human model adjustment process; Lalwala et al. [44] reconstructed real-world car-to-pedestrian impact accidents using a full-scale THUMS FE model, with the purpose of investigating the kinematics behavior and evaluating the biofidelity of this model; Li et al. [45] improved the computational efficiency of the THUMS model by increasing the skeleton elements size and simplifying the lower limbs of the model, and this simplified FE pedestrian model performed well in the prediction of the pedestrian kinematics when simulating existing cadaver tests. Chai et al. [46] constructed a pedestrian model (knockdown human model) by combining a simplified FE head model (including just cortical bone, cancellous bone, encephalon and scalp) with the TNO model, connected by a dynamic hinge. However, these attempts still cannot reach the balance between accurately predicting the pedestrian brain injury and the computational efficiency.
The purpose of this paper is to utilize the existing coupling technique [46,47] to establish a new coupled pedestrian computational biomechanics model (CPCBM), capable of balancing the accuracy and computational efficiency. The head–neck part and the rest of the CPCBM are taken from THUMS (Version 4.01) FE and TNO (Version 7.5) MB 50th percentile adult male pedestrian models; each part being connected by the coupling technique [46,47]. The reliability of the CPCBM is evaluated by reconstructing three cadaver tests published in the literature [17,48,49]. This study can provide a more efficient and reliable tool for the research of pedestrian head-injury biomechanics and prevention of injury due to car impact.

2. Materials and Methods

2.1. Development of CPCBM

2.1.1. Extraction of THUMS and TNO Pedestrian Models

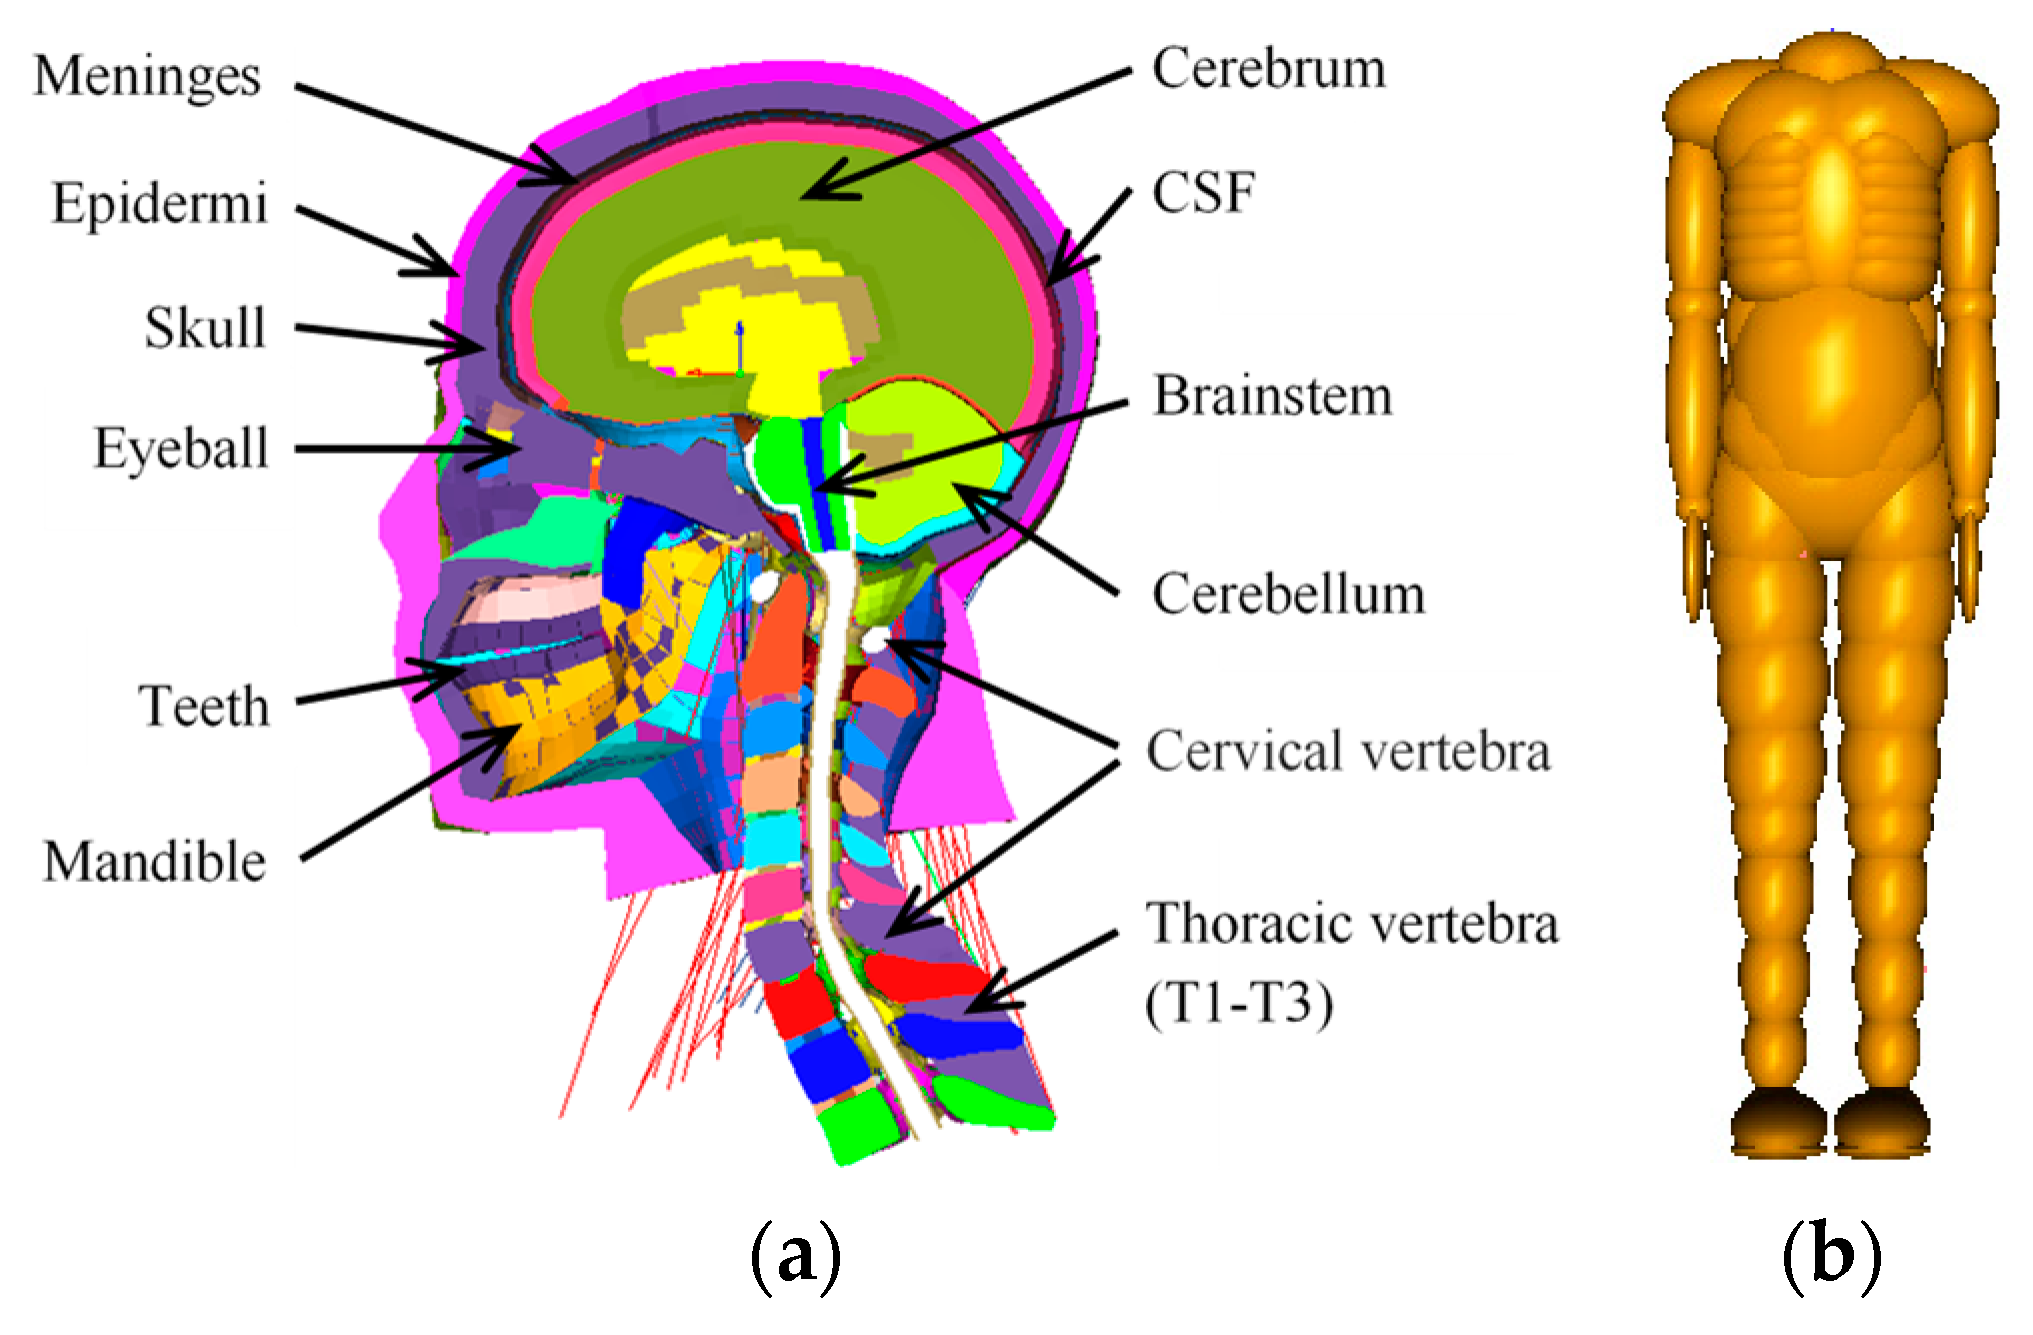
Extraction of THUMS Pedestrian Model

The THUMS (Version 4.01) FE pedestrian model [4,5] consists of approximately 0.65 million nodes and 2 million elements. The stature and weight of the model are 175 cm and 77 kg, respectively. From the full-scale THUMS model, we extracted the head, neck, some one-dimensional elements connected to the head and body, and the three thoracic vertebrae (T1–T3). The head–neck complex of the THUMS model presents a detailed human anatomy structure, as shown in Figure 1a.

Extraction of TNO Pedestrian Model

The remaining parts of the CPCBM are taken from the TNO 50th percentile adult male pedestrian model [3,31]. The full-scale TNO model has a stature and weight of 174 cm and 75.7 kg, respectively, and it consists of 52 rigid bodies. We removed the ellipsoids (including head and neck) above the collar of the TNO model and the remaining parts of the TNO pedestrian model for constructing the CPCBM, which includes the torso, the upper and lower limbs, as shown in Figure 1b.

2.1.2. Coupling of Finite Element and Multibody Parts of the CPCBM

With the head–neck complex of the THUMS model and the remaining body parts of the TNO model (see Section 2.1.1), the full-scale CPCBM can be built in the coupling assistant module available in MADYMO software package [47]. It should be noted that some auxiliary processing on the FE head–neck model before the coupling procedure needs to be performed so that the FE parts can be reasonably connected with the MB parts. For example, in the isolated head–neck model, one end of the FE one-dimensional elements (such as the line-shaped elements around the neck, Figure 2a, representing the neck muscles) that are originally connected to the FE upper torso and shoulder become free ends. These free ends cannot be directly connected to the rigid bodies (clavicle r body, torso up body and clavicle l body), so the block elements are created (the blue elements in the red circles in Figure 2a) and free ends (they are divided into three groups depending on their locations relative to the block elements) are connected to the three block elements via rigid connection. Direct connection between the block elements and the upper torso and shoulder bodies (see the markers “ Ijerph 17 00492 i003
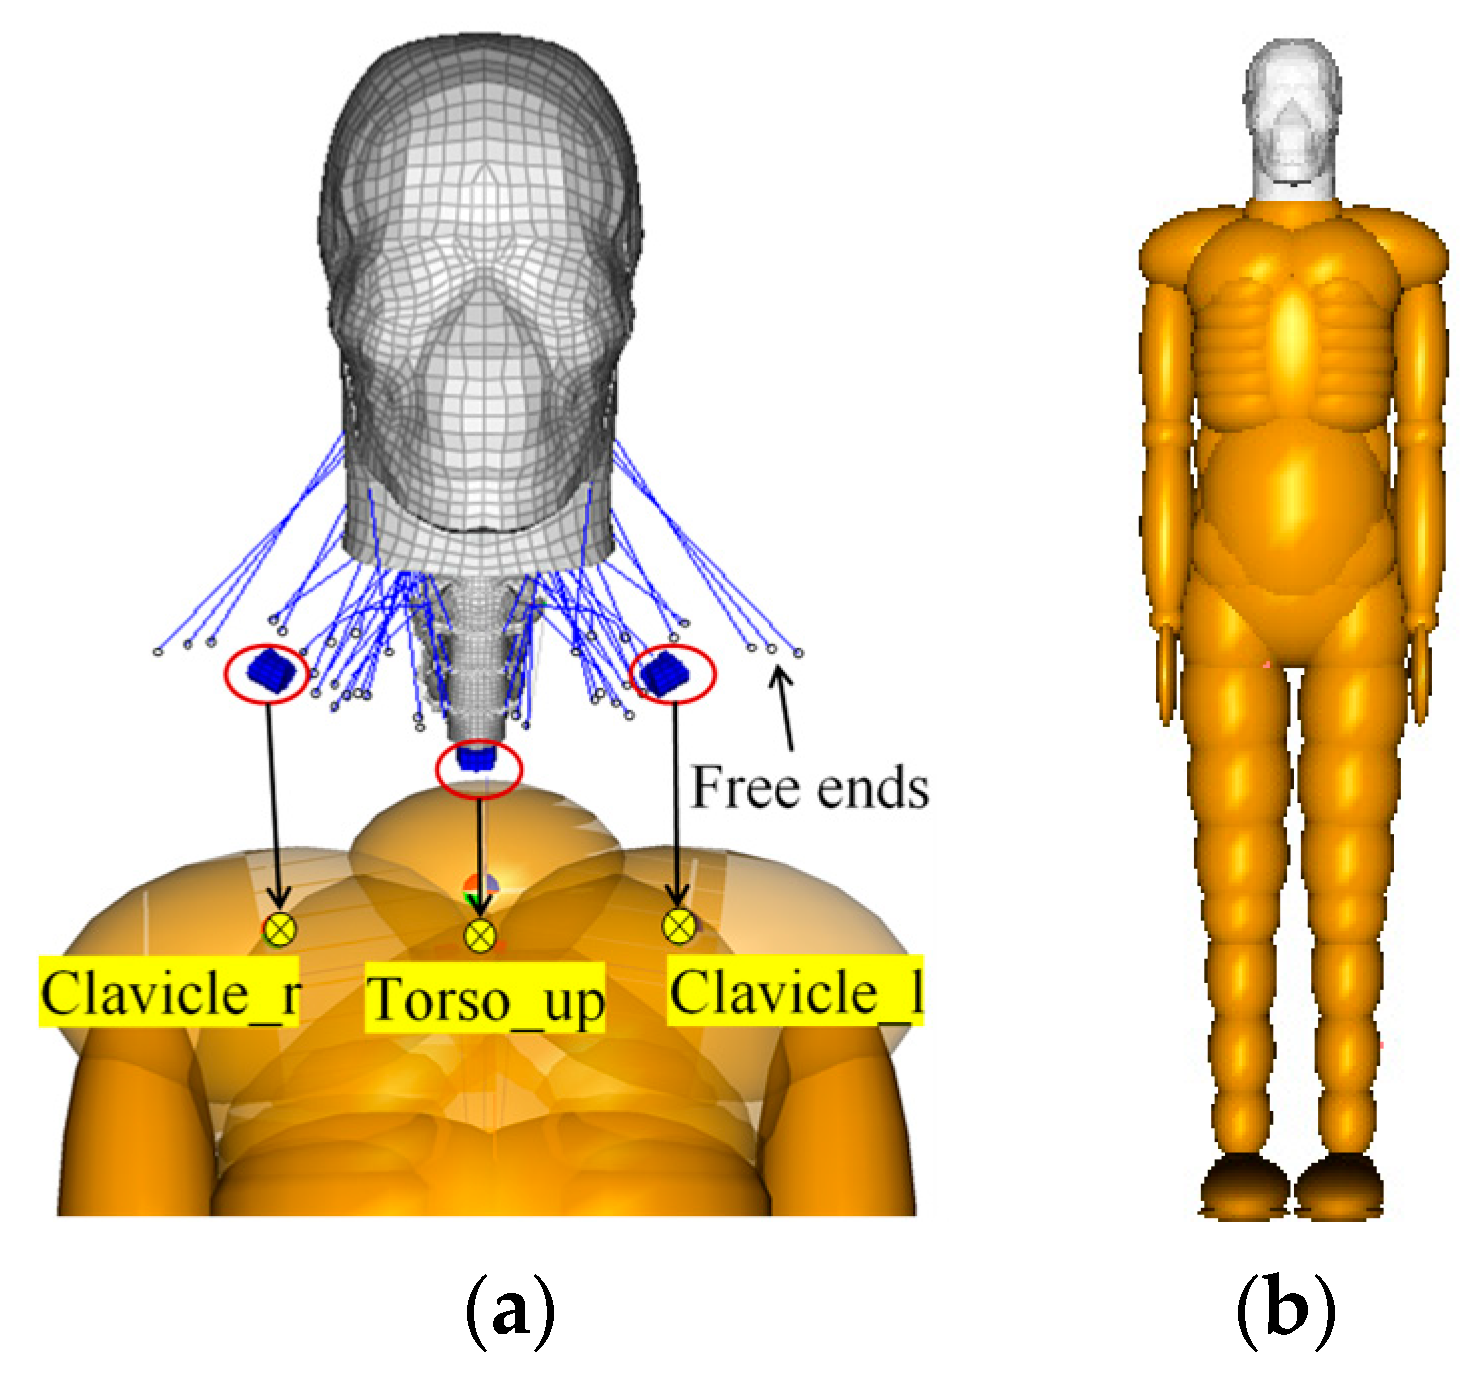
” in Figure 2a, including the upper torso and two clavicles) via the “Constraints MADYMO Body” keyword in the coupling assistant module in the MADYMO software package are created to implement the coupling of the FE head–neck complex with the remaining MB segments of the TNO pedestrian model. The coupling procedure is shown in Figure 2a, and the full-scale CPCBM is shown in Figure 2b.

2.2. Validation of the CPCBM

2.2.1. Description of Cadaver Tests

Three cadaver impact tests from the literature were selected for the validation of the CPCBM [17,48,49]; the details of the PMHSs are listed in Table 1. The subjects were initially positioned in a nominal mid-gait stance with the left foot forward and right foot behind, and were oriented so that they were struck laterally on the subject’s right side. The arms were positioned with the hands crossed in front of the abdomen and bound at the wrist with the cable ties (for test V2374, the upper extremities were bound together at the point of amputation). For each subject, the initial position was adjusted following the positioning guidelines described in SAE J2782. During the test, the impact buck was accelerated to a target impact velocity of approximate 40 km/h, at which it contacted the pedestrian [17].
According to Wu et al. [17], a large amount of motion information from the head to the lower extremities of the subjects was recorded from the tests, including various anatomical positions (head, thoracic T1 and T8, pelvis, left and right femur, etc.). Since the attention of our study focused on the head responses of the CPCBM, only the subject’s head-related experimental data (including trajectory, displacement, velocity, acceleration) was used for the validation work.

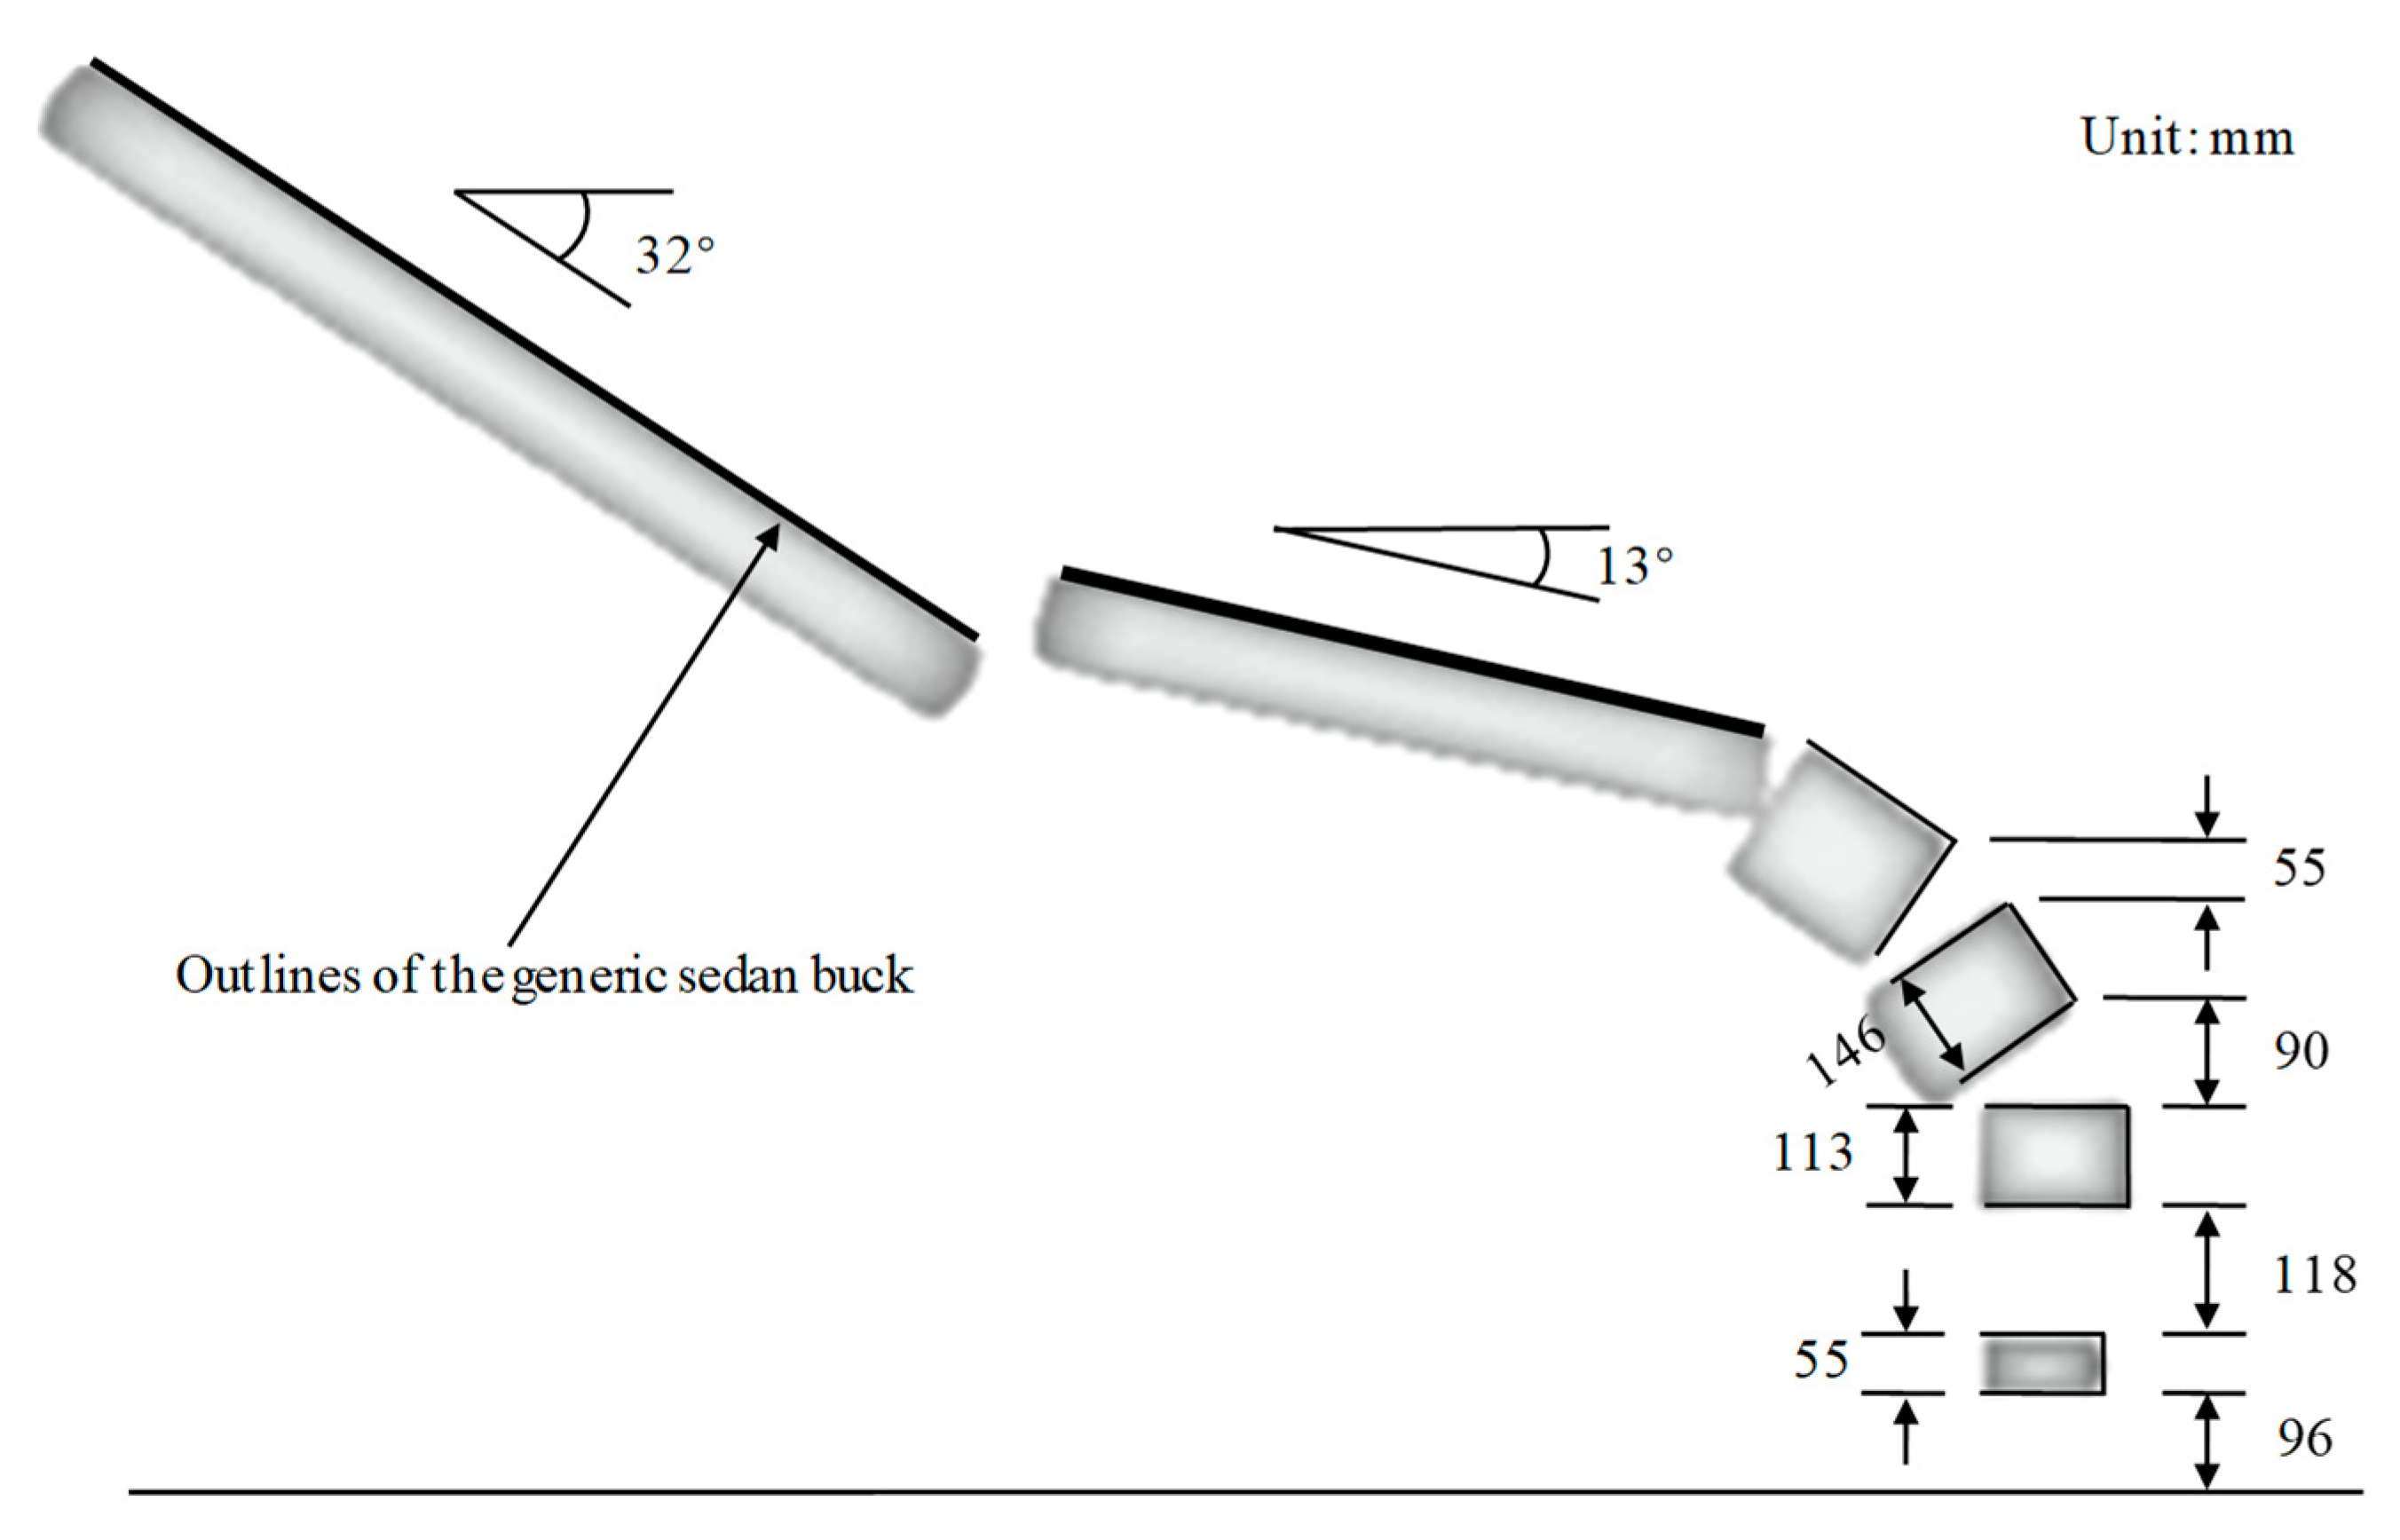
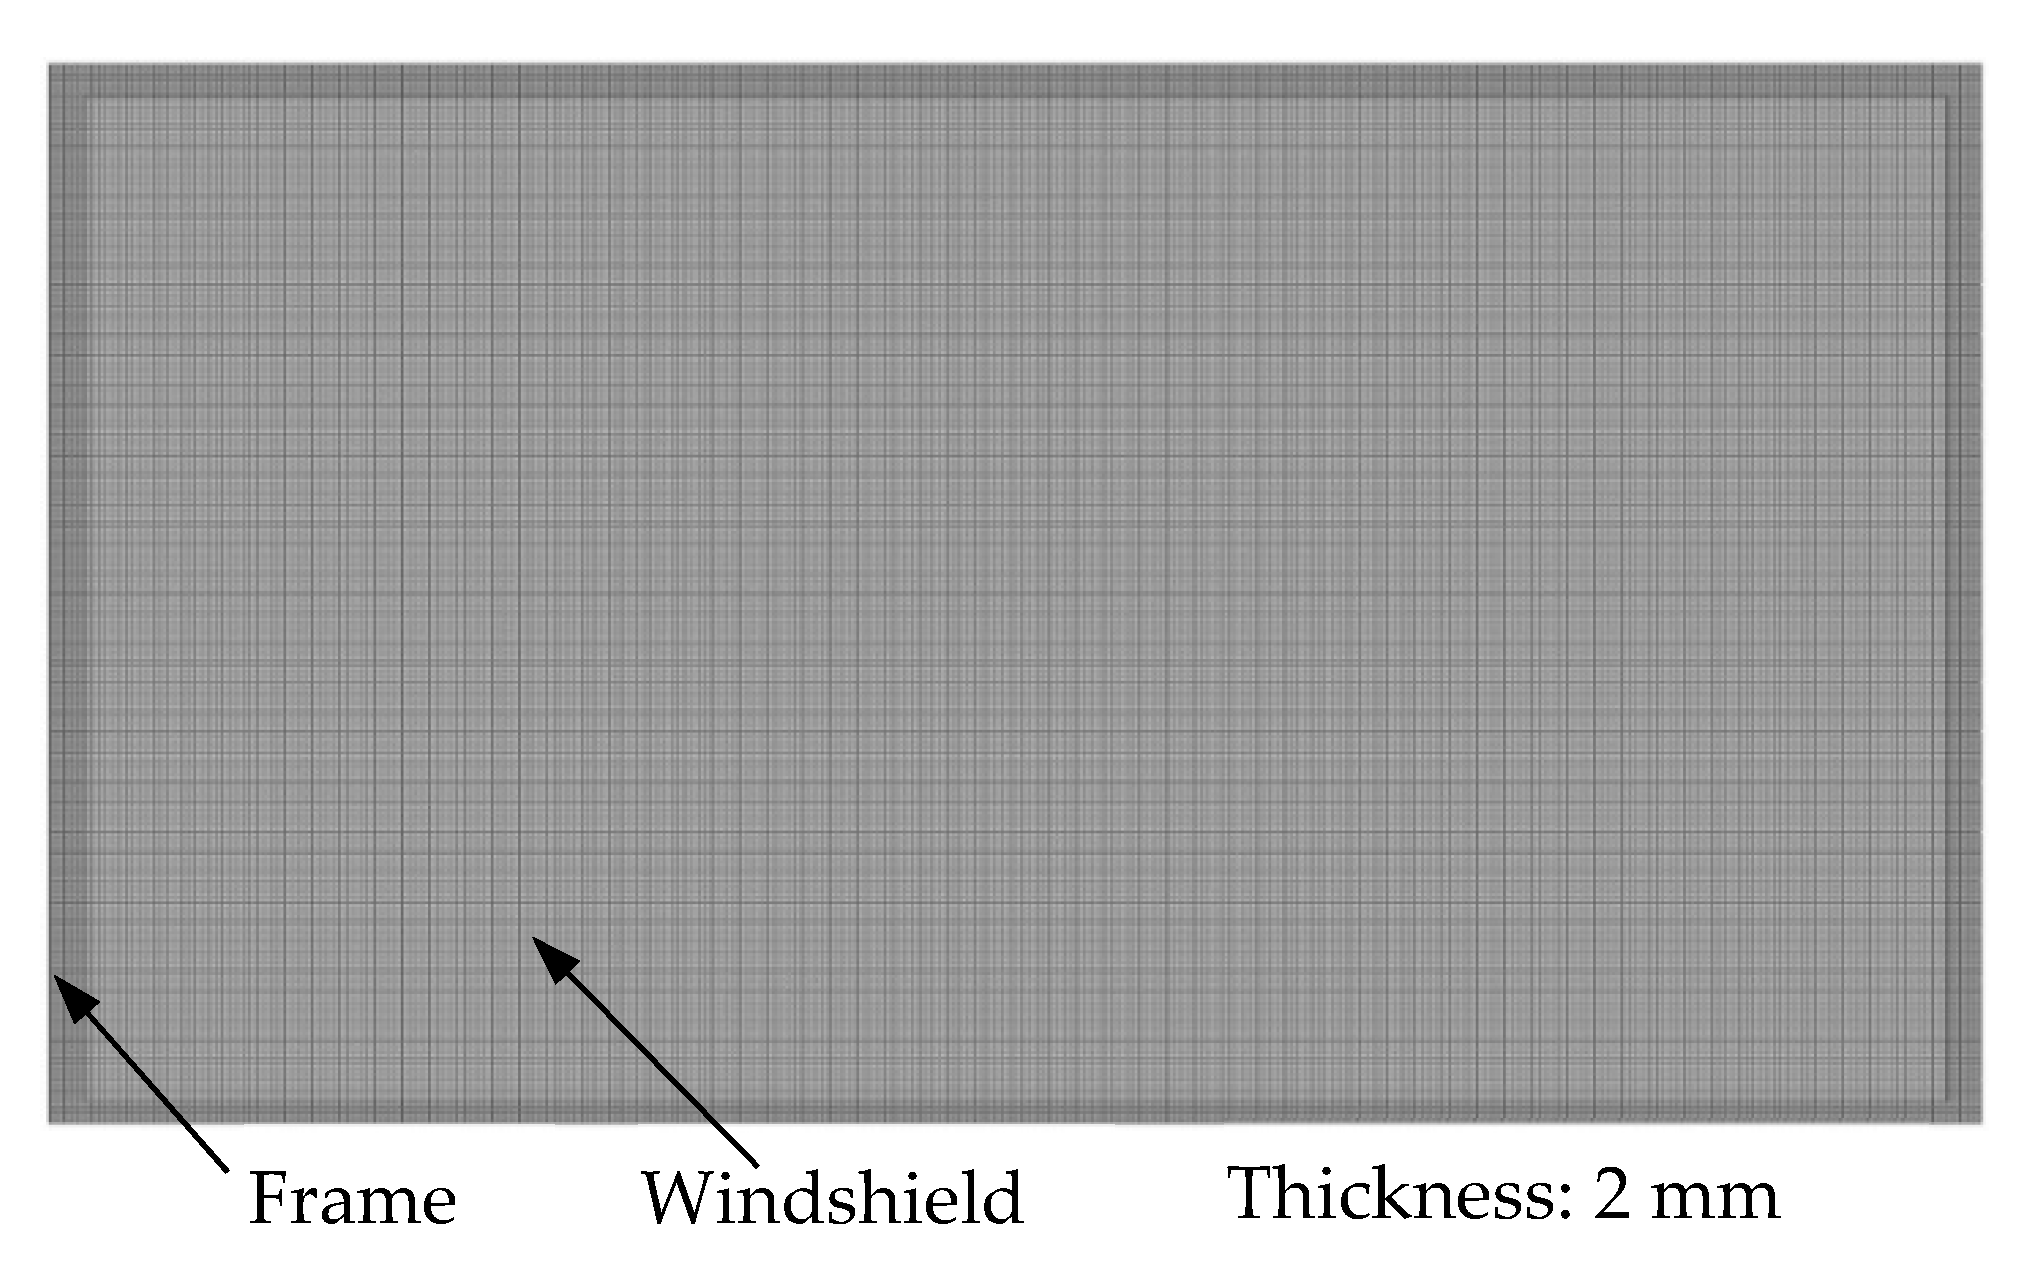
2.2.2. Modelling of the Impact Buck

The impact buck utilized in the cadaver tests was based on the sedan-type vehicle, which demonstrated a good pedestrian protection rating [50]. By using MADYMO software, an MB impact buck was built according to the detailed dimensions and the stiffness curves of the buck components described in the literature [50]. In order to simulate the impact between the FE head of the CPCBM and the windshield of the buck, we added an FE buck windshield to the buck model; the stress–strain curve of this FE windshield model was also from the literature [50]. Similarly, the FE windshield was also coupled with the MB impact buck in the same way the finite elements of the head–neck FE model and the rigid bodies of the MB model (of the remaining segments of the pedestrian) was connected during the coupling procedure of the CPCBM pedestrian model (see Section 2.1.2). The details of the impact buck model can be seen in Appendix A.

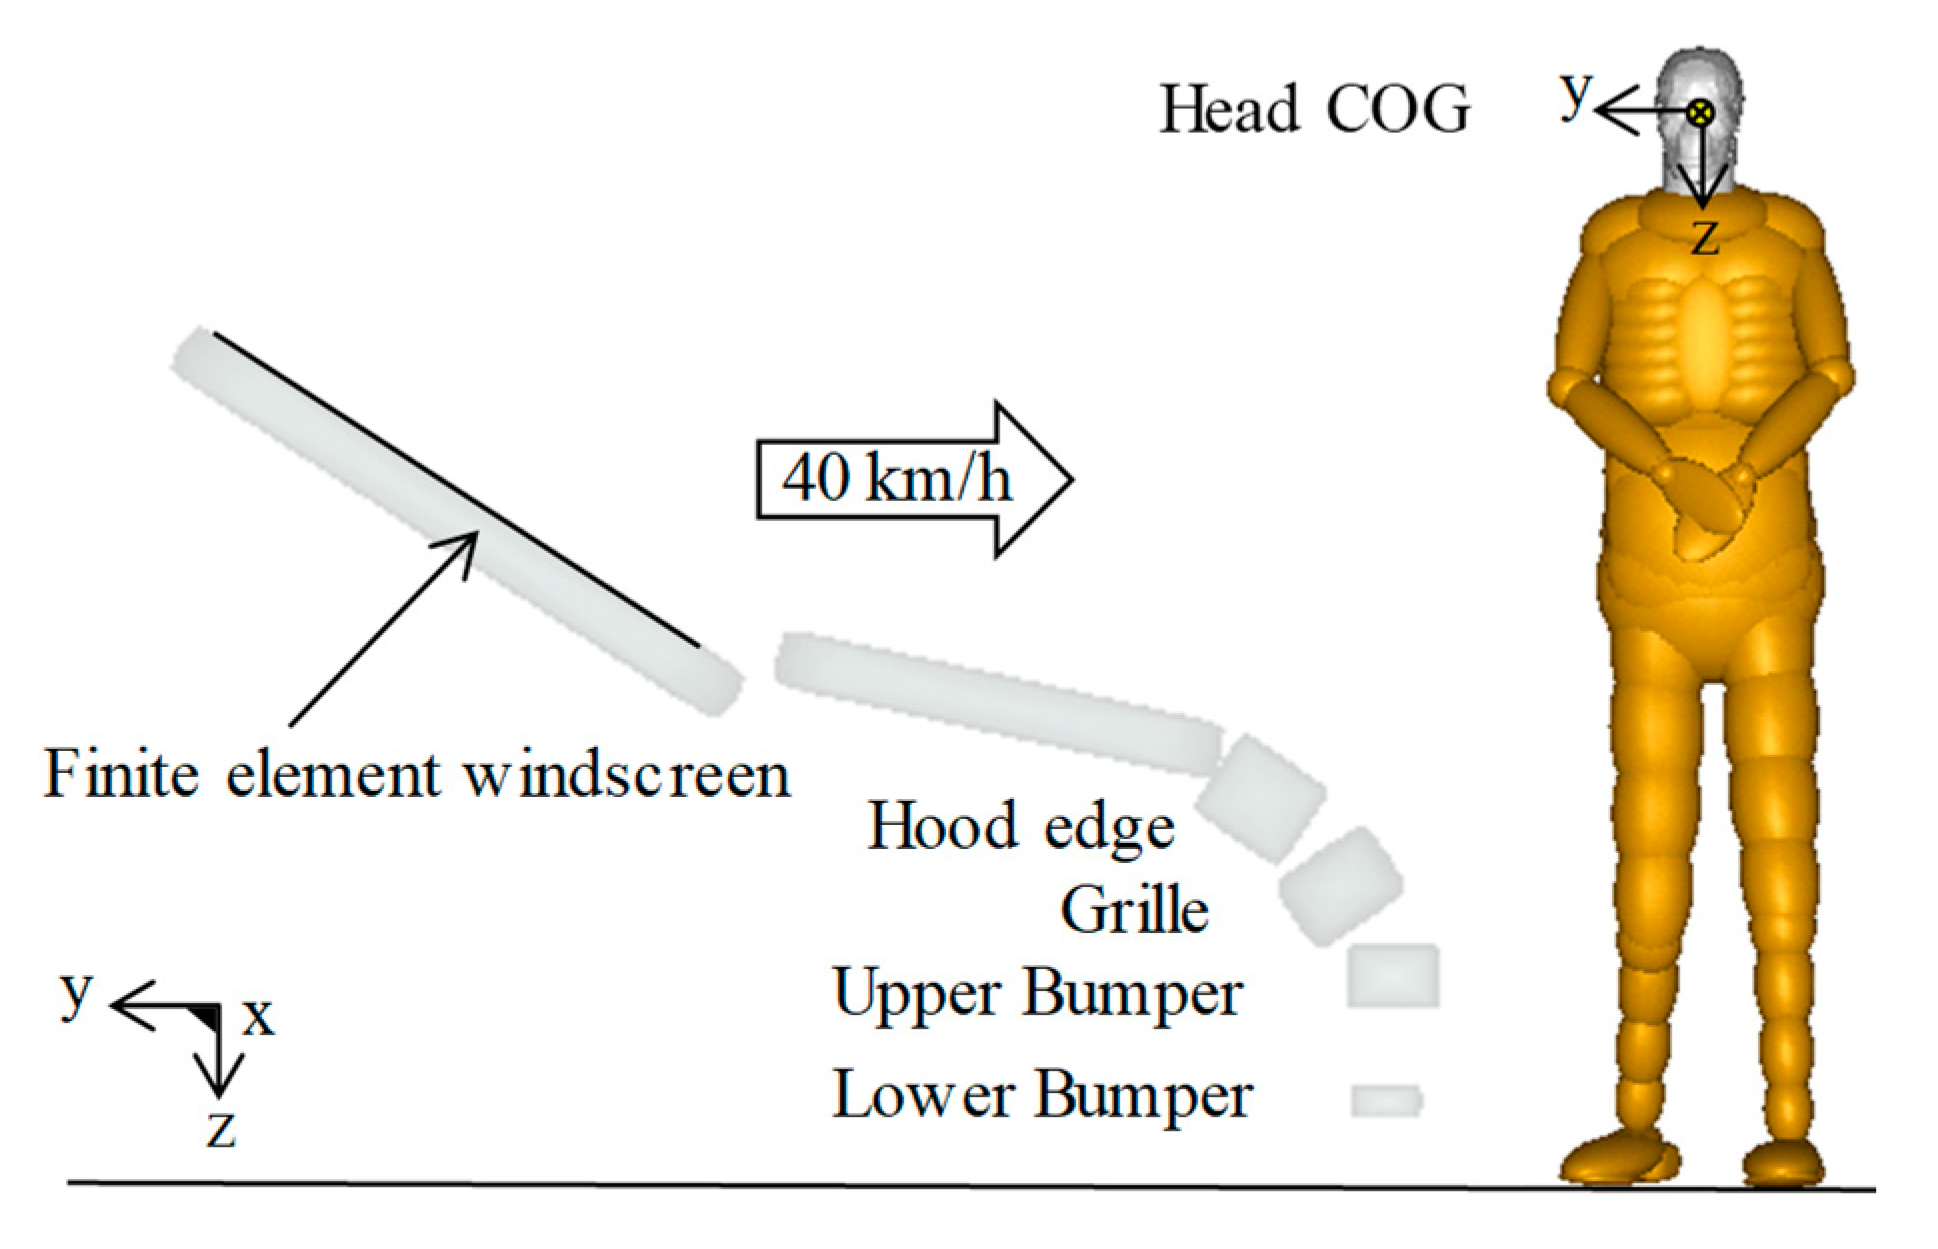
2.2.3. Setting Up the Impact Simulation Between the Buck and PMHSs

Model Scaling and the Initial Posture Adjustment

The subjects’ biomechanical responses were found to be substantially influenced by their pre-impact posture and anthropometry [15,51]. In order to reduce the anthropometric differences between the CPCBM and the subjects, we scaled the TNO 50th percentile adult male pedestrian model to match the subjects in the tests, by defining detailed anthropometric parameters in the MADYSCALE module available in the MADYMO software package [31]. These signals are derived from the actual measurement data of the three subjects in the tests (see Table 2). Although the scaled TNO models are already similar to the tested subjects, some minor differences still exist between the scaled models and subjects. For example, the shoulder height of all the scaled TNO models is about 20 ± 5 mm smaller than those of the subjects, and the crotch width of the scaled models is about 25 ± 5 mm smaller than those of the subjects. Therefore, according to the actual anthropometric parameters, we appropriately double-adjusted the scaled TNO models. Afterward, following the reported information about the pre-crash posture of the subjects [49], the scaled TNO models were positioned by comparing the marking points between the scaled TNO models and the subjects (Figure 3). Finally, the subject-specific full-scale CPCBMs were created based on the scaled TNO models, following the coupling procedure in Section 2.1.1 and Section 2.1.2.

Buck–Pedestrian Impact Modelling

In simulations, the global positions and the coordinate systems of the head model COG were set to be consistent with those of the subjects at the pre-collision stage. The motion direction of the impact buck as well as the positions and orientation of the coordinate systems in the simulation are shown in Figure 4. Similar to the tests, the simulation duration is 200 ms, starting from when the lower extremity of the CPCBM initially contacts the front of the impact buck. Following the previous study [2,17], the friction coefficients between the human model and the impact buck, and between the human model and the road surface are set to 0.3 and 0.6, respectively.
During the simulation using the CPCBM, both of the LS-DYNA solver (SMP971, LSTC, Livermore, CA, USA) and the MADYMO workplace (Version 7.5, TASS BV, Helmond, The Nether lands) were invoked by the coupling assistant module from the MADYMO software package, and the FE head–neck model and MB model (of the remaining segments of the pedestrian) were executed simultaneously using the LS-DYNA FE code and MADYMO MB code.

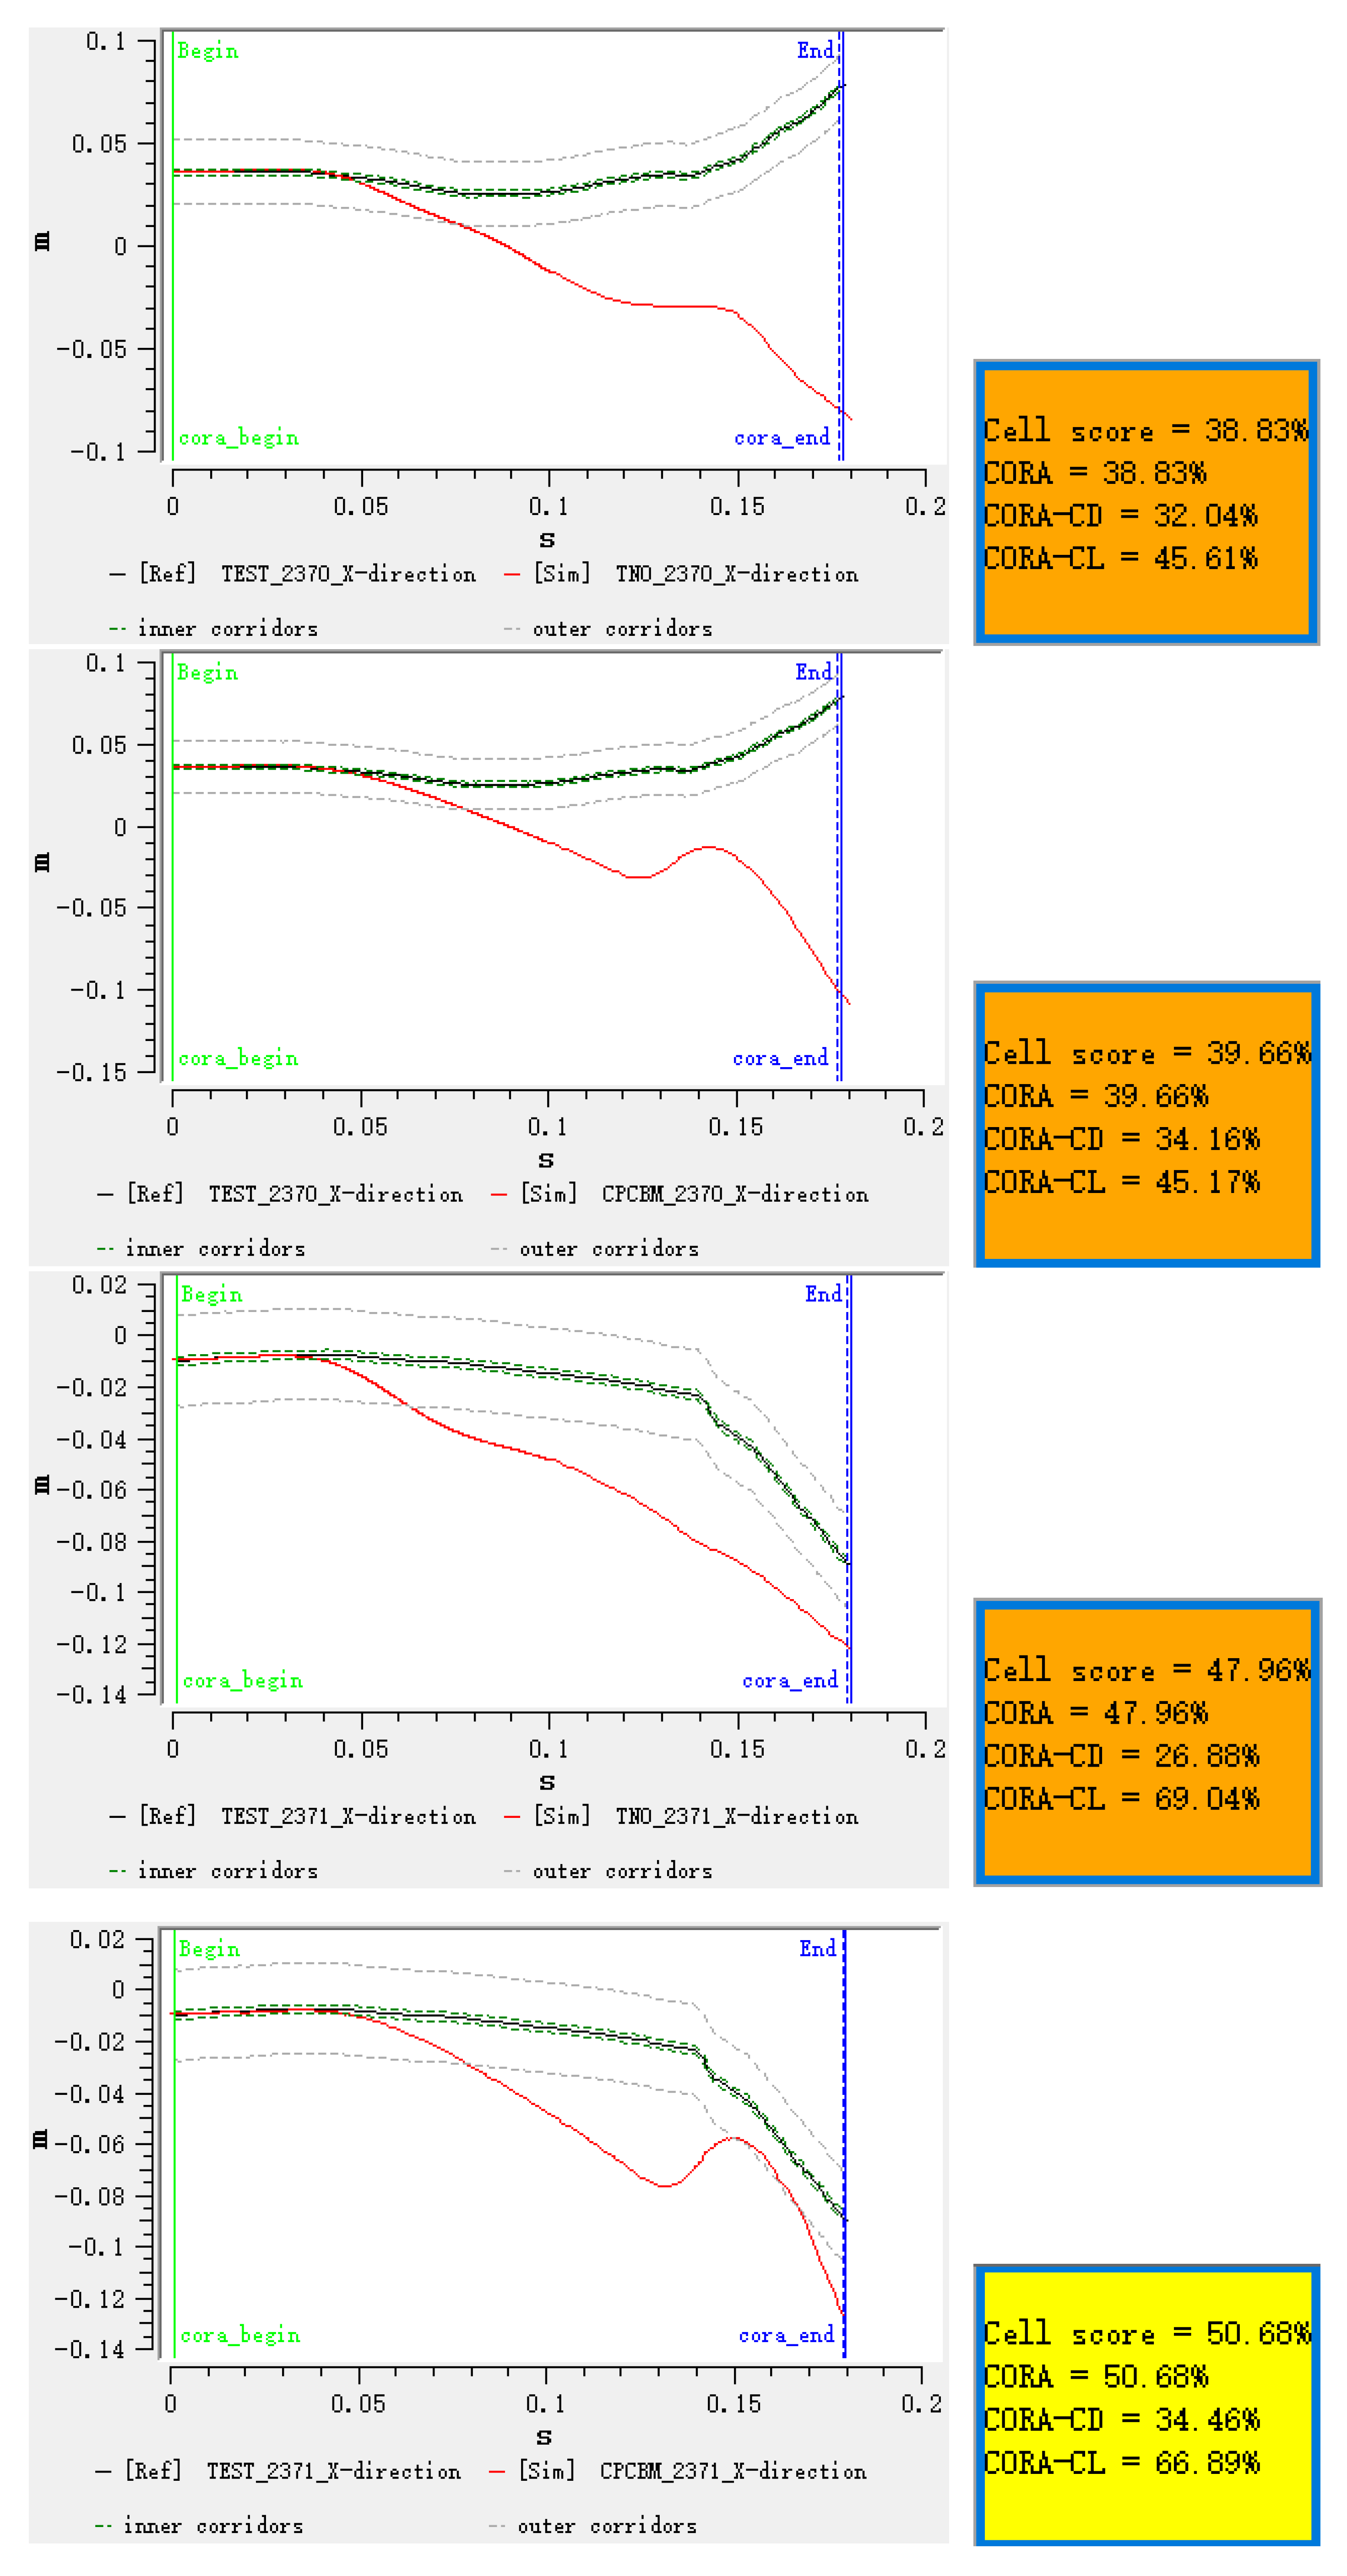
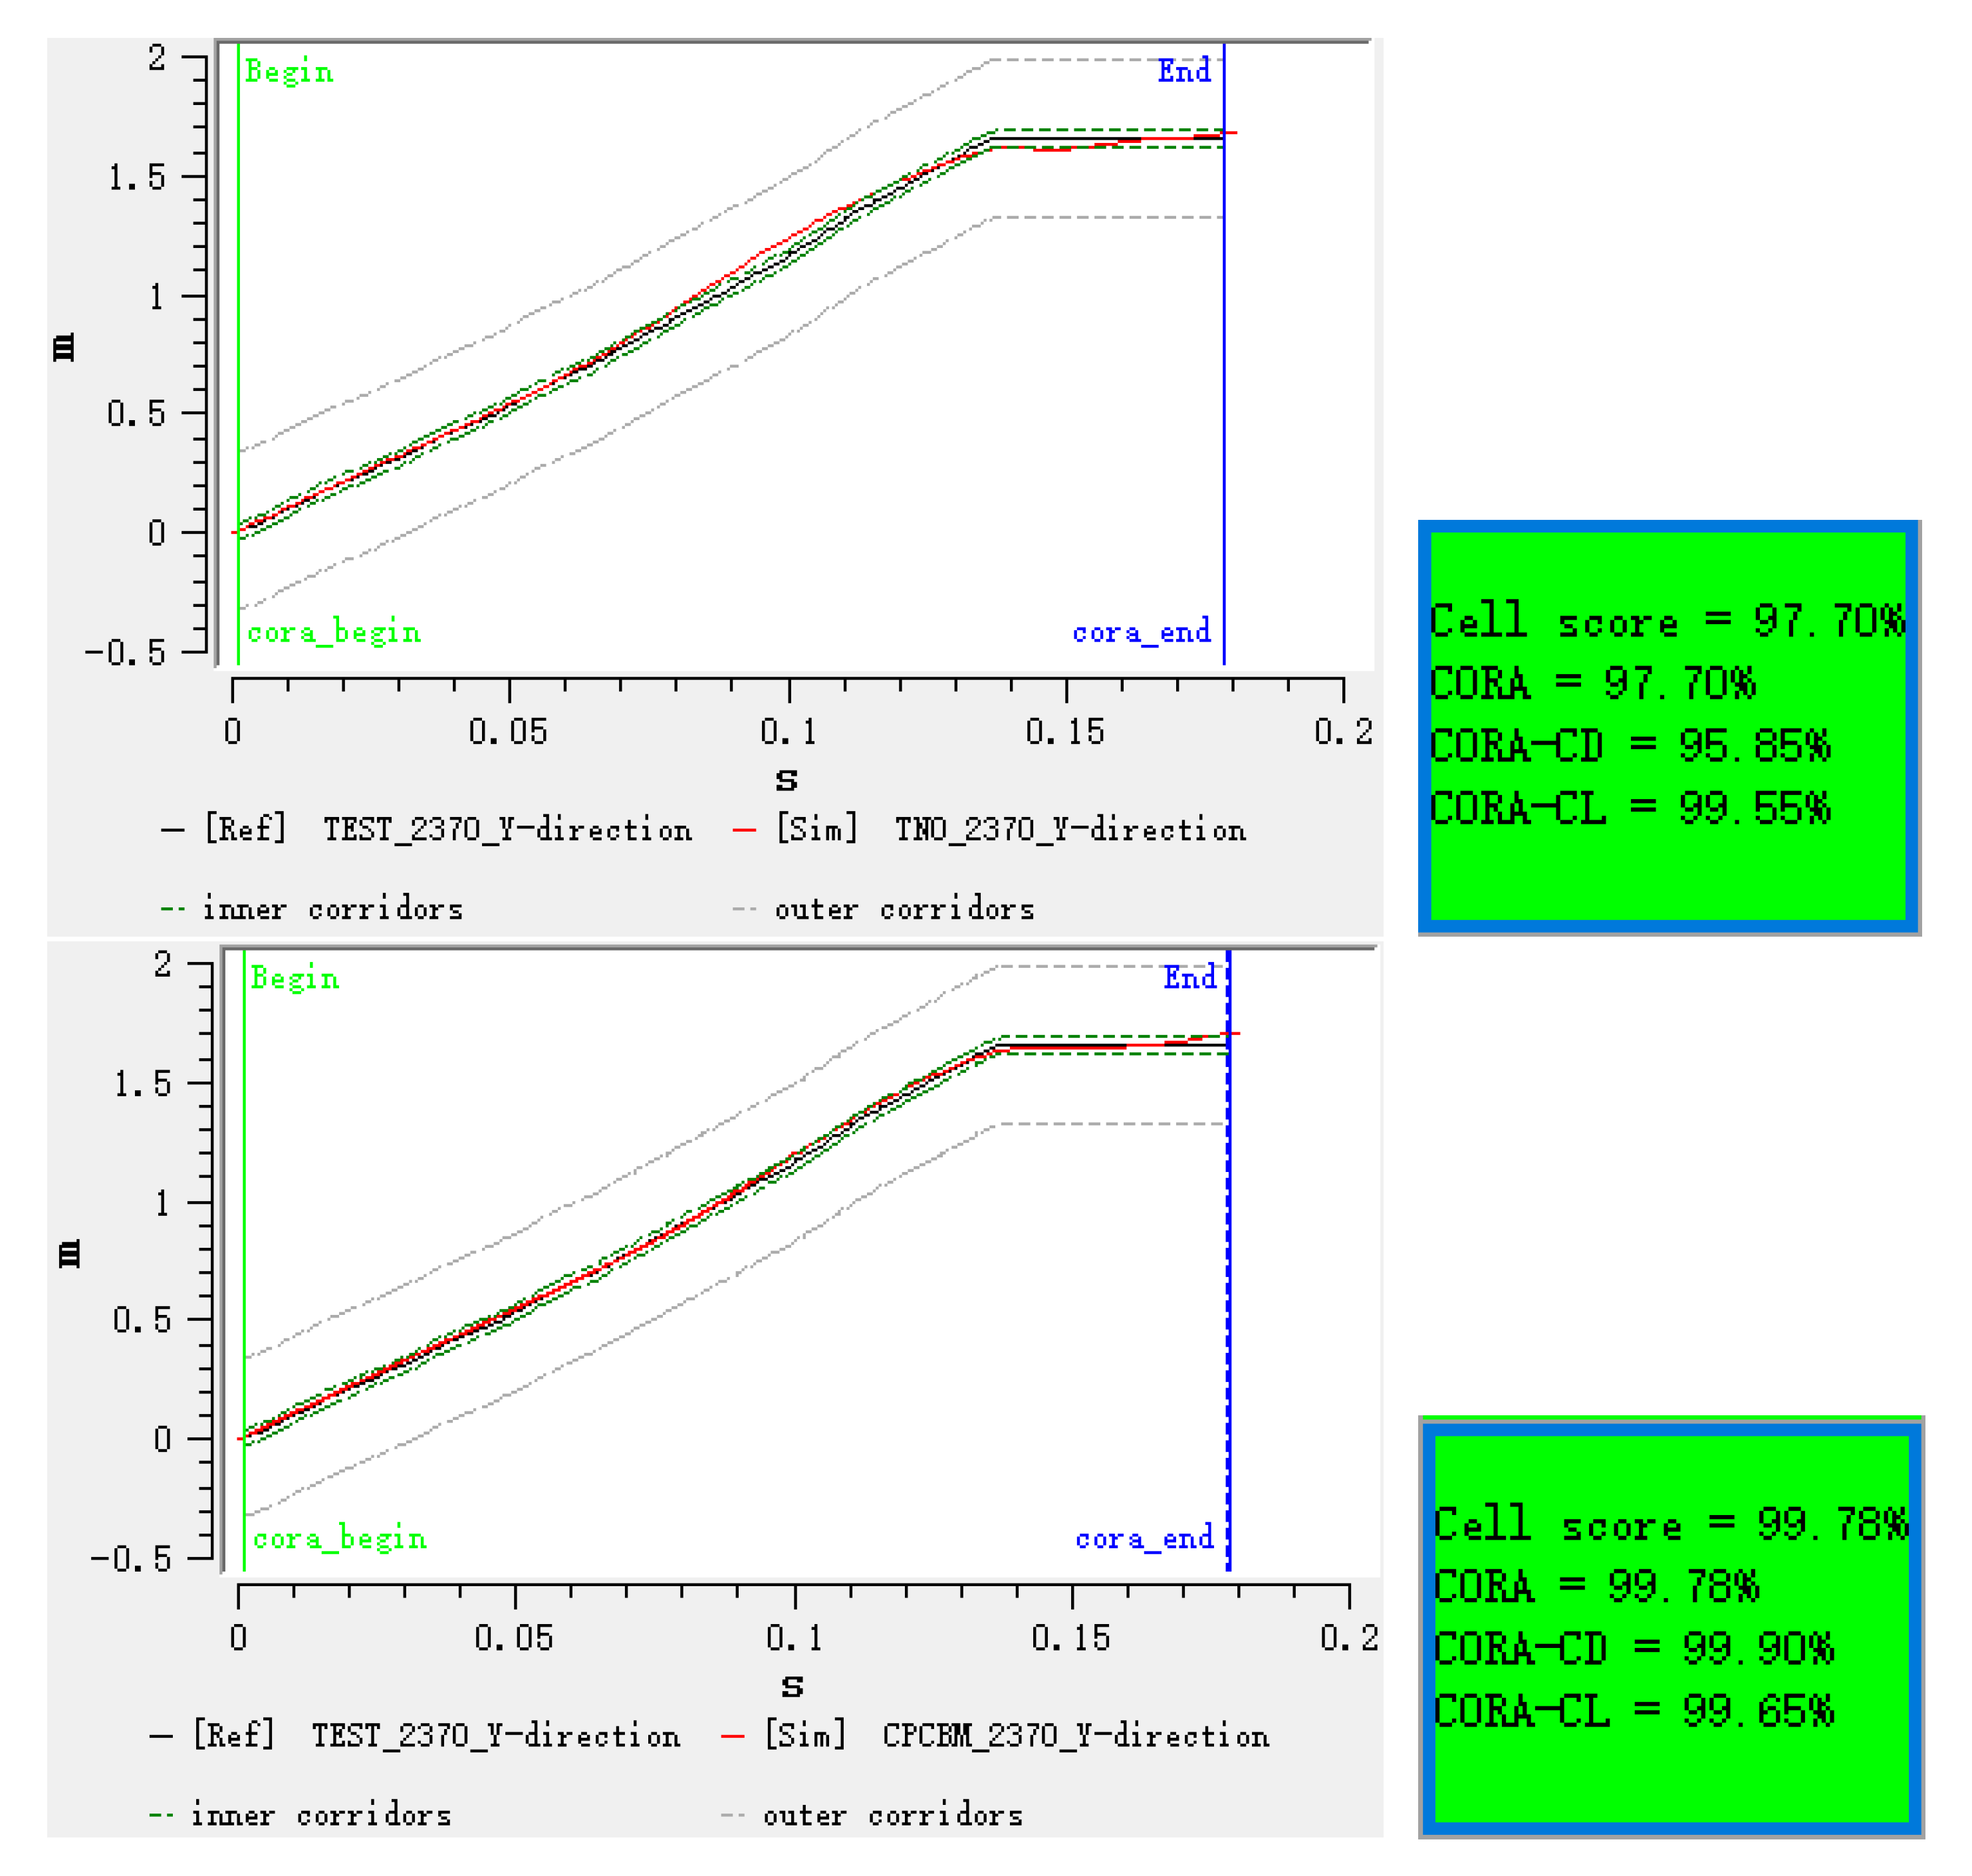
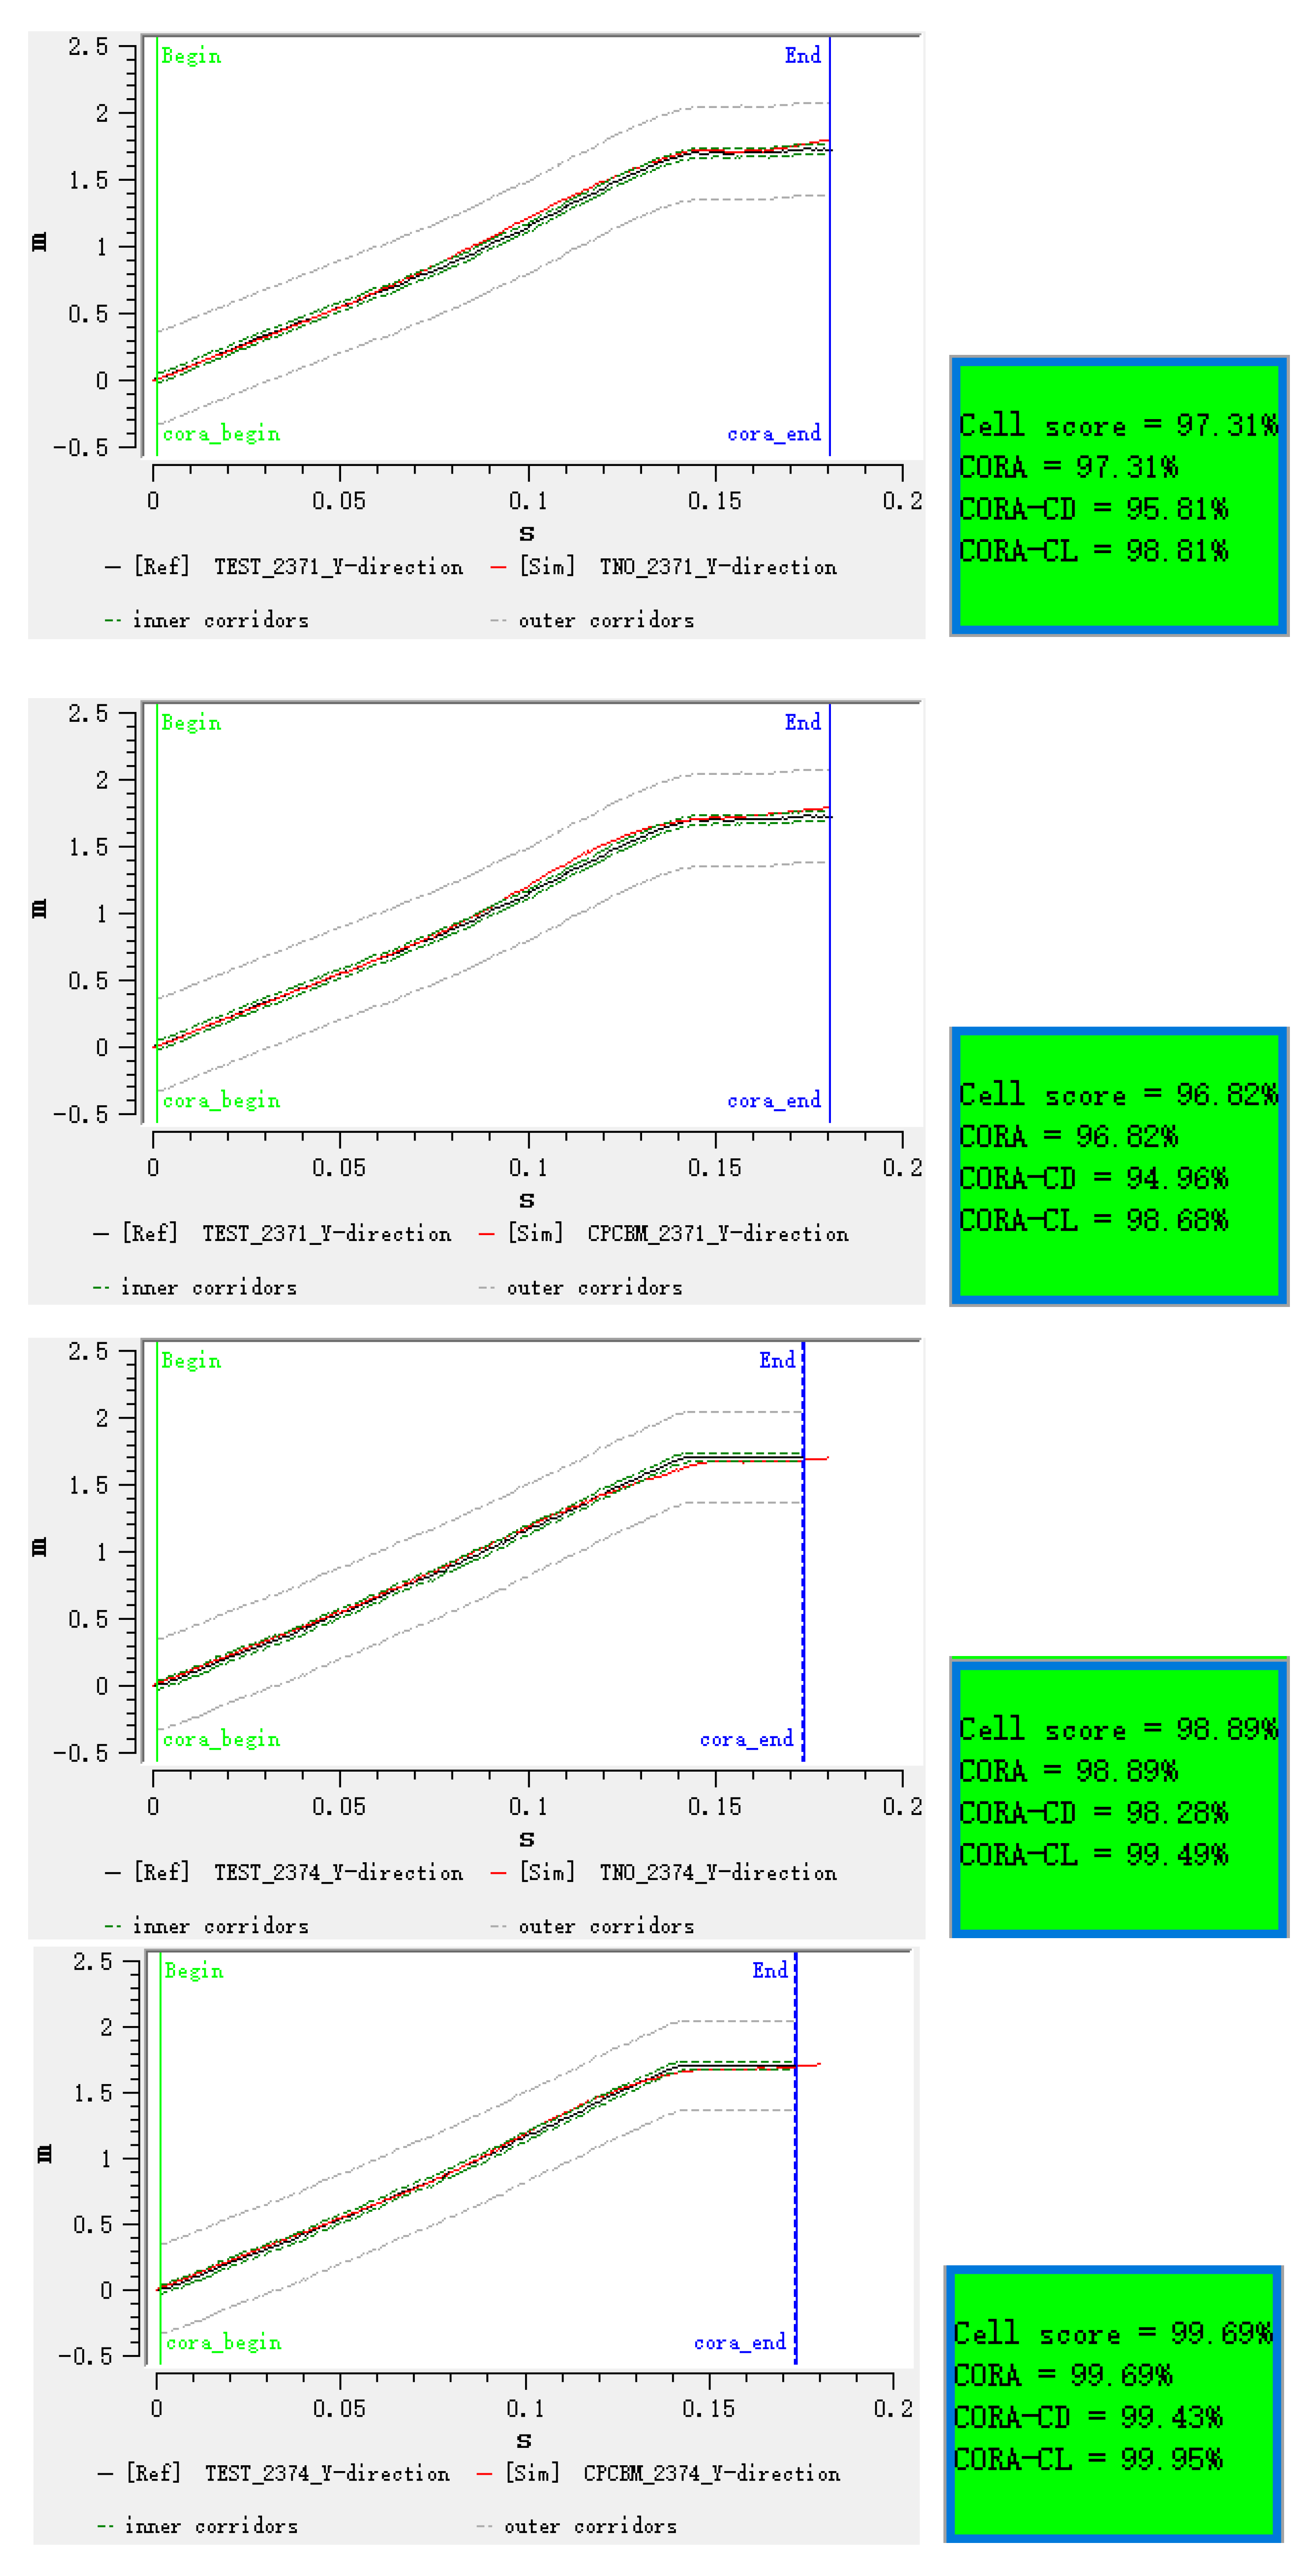
2.2.4. Objective Rating Tool Correlation and Analysis (CORA)

Here, the objective rating tool correlation and analysis CORA [52] was used to quantitatively evaluate the correlation of the analyzed head response signals between the predictions of both the adjusted TNO model and the CPCBM, and tested PMHSs [17]; such a method has been used in similar studies [53,54]. The objective rating tool CORA uses two independent sub-ratings: a corridor rating and cross-correlation rating to assess the correlation of two signals. The rating score was calculated by taking a weighted average of these two independent sub-ratings. This rating method outputs a score ranging from 0 (no correlation) to 1 (perfect match).

3. Results

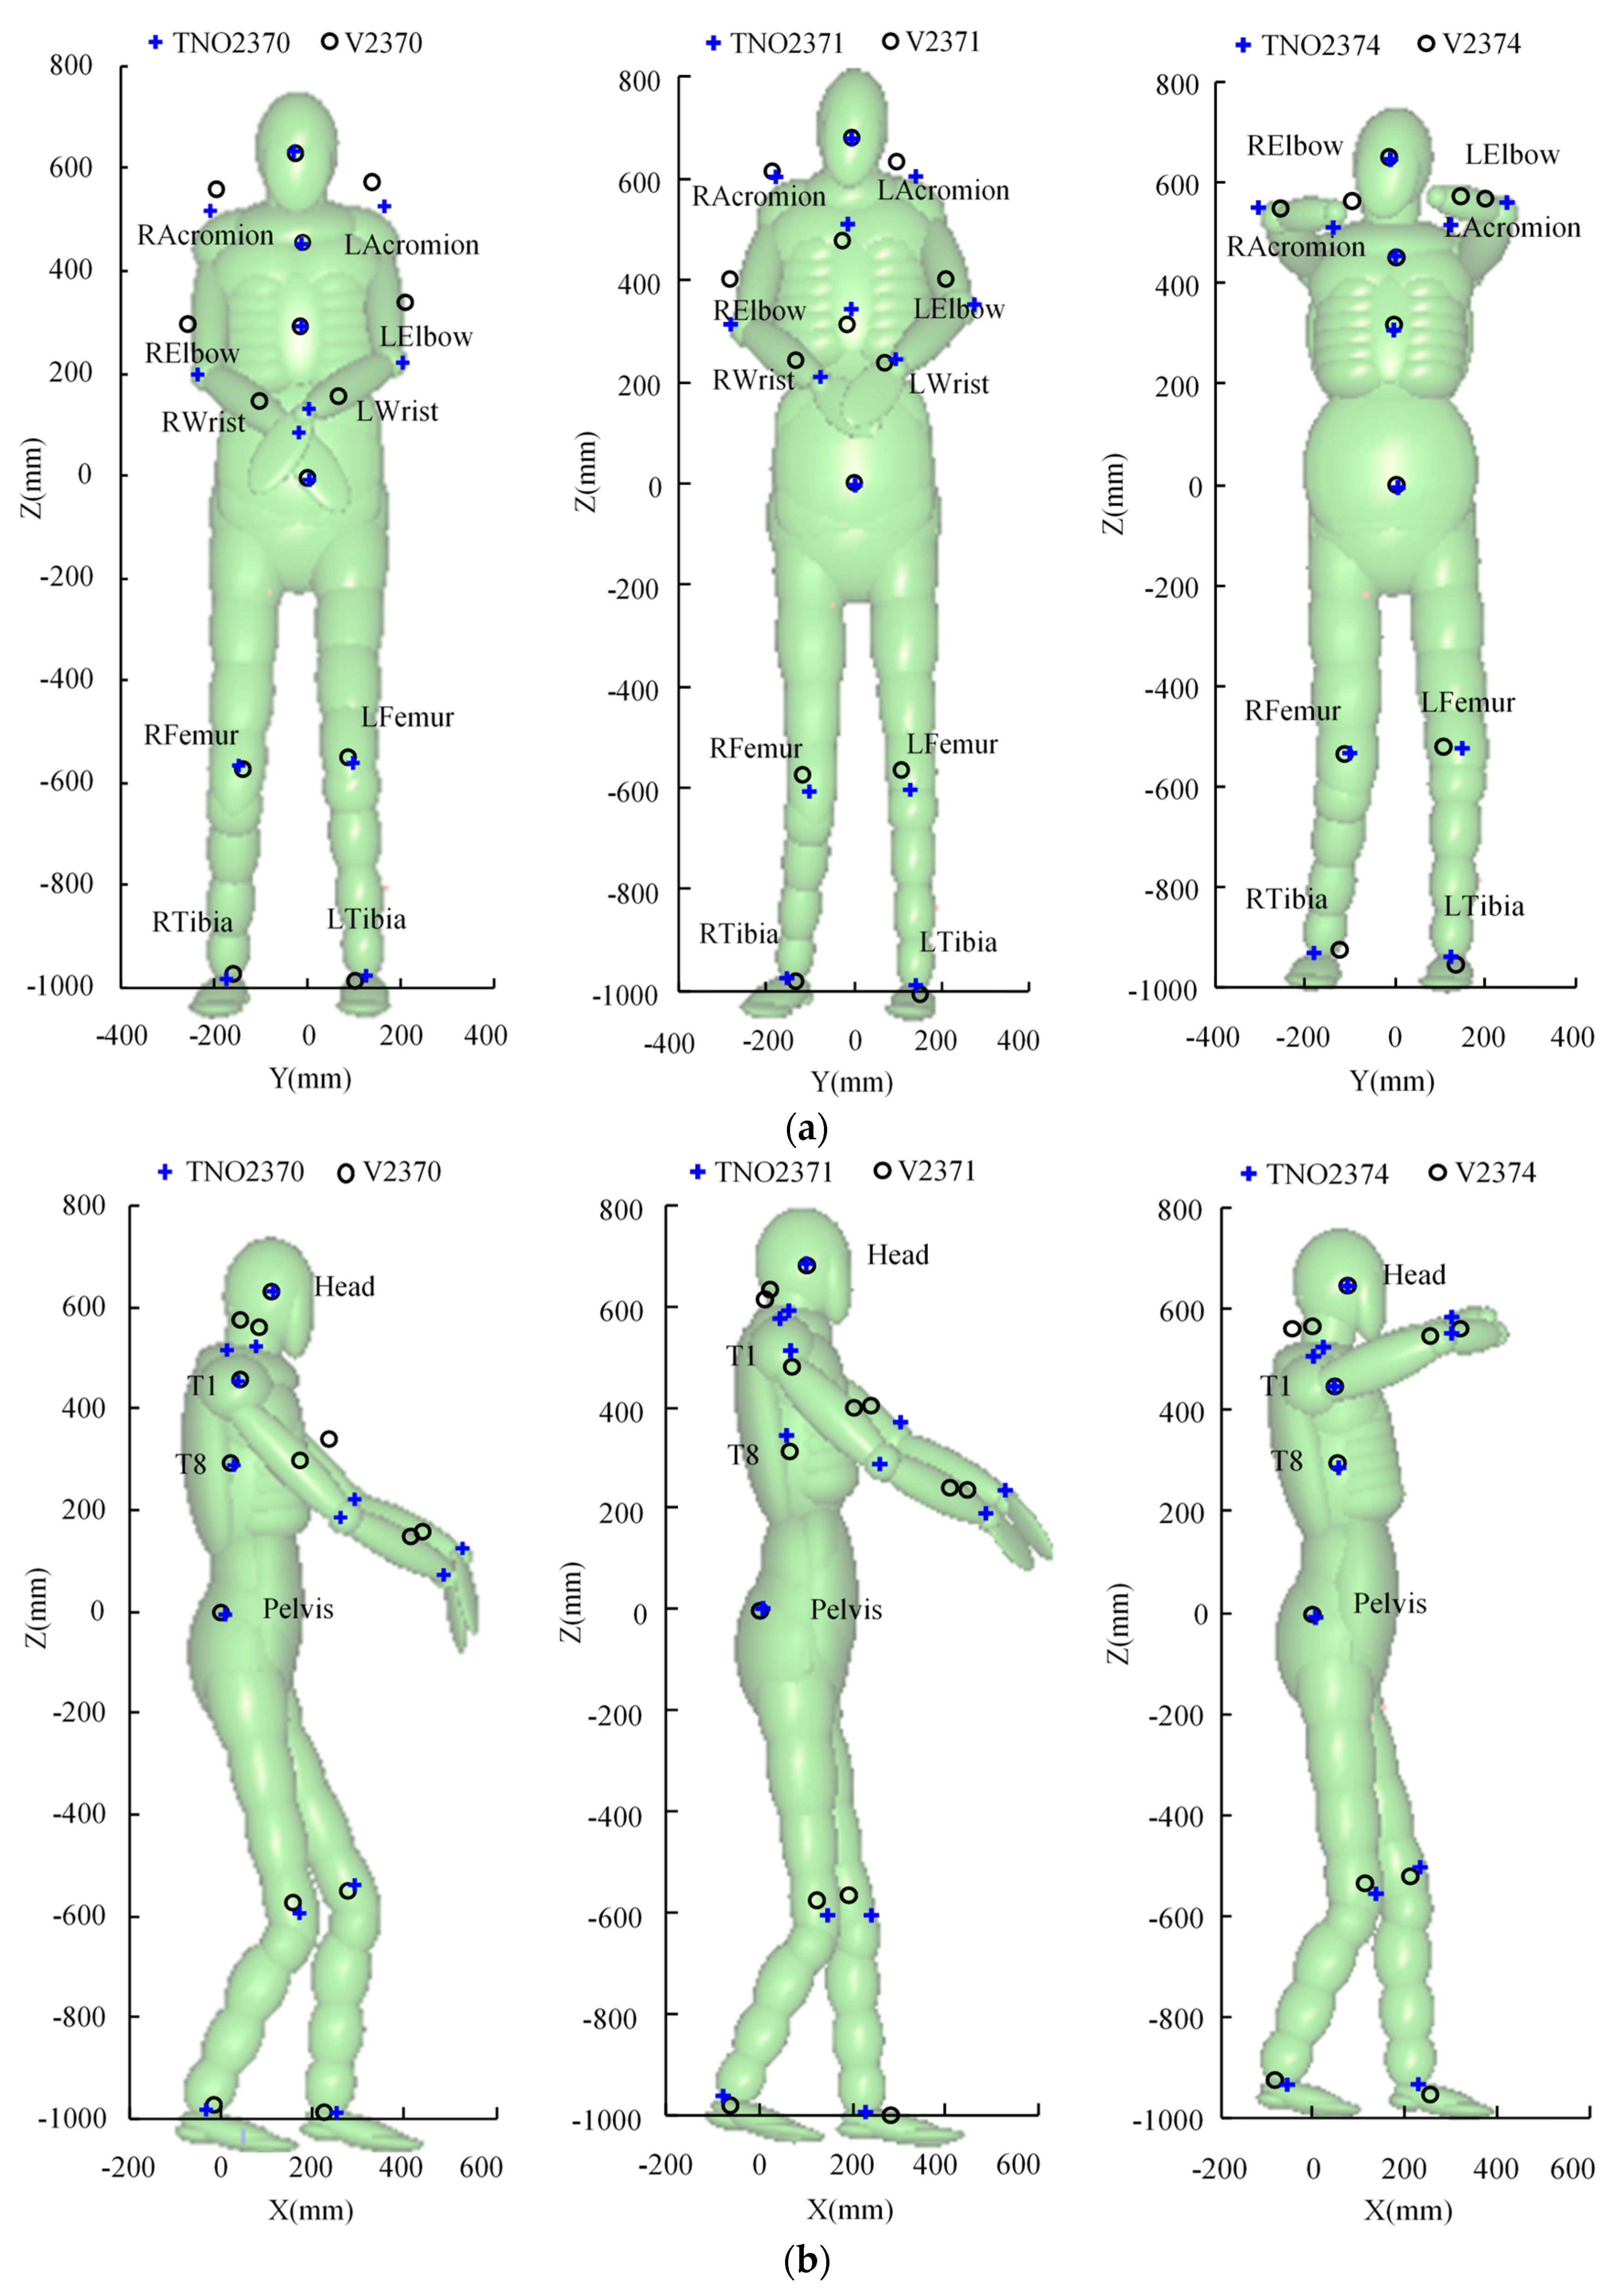
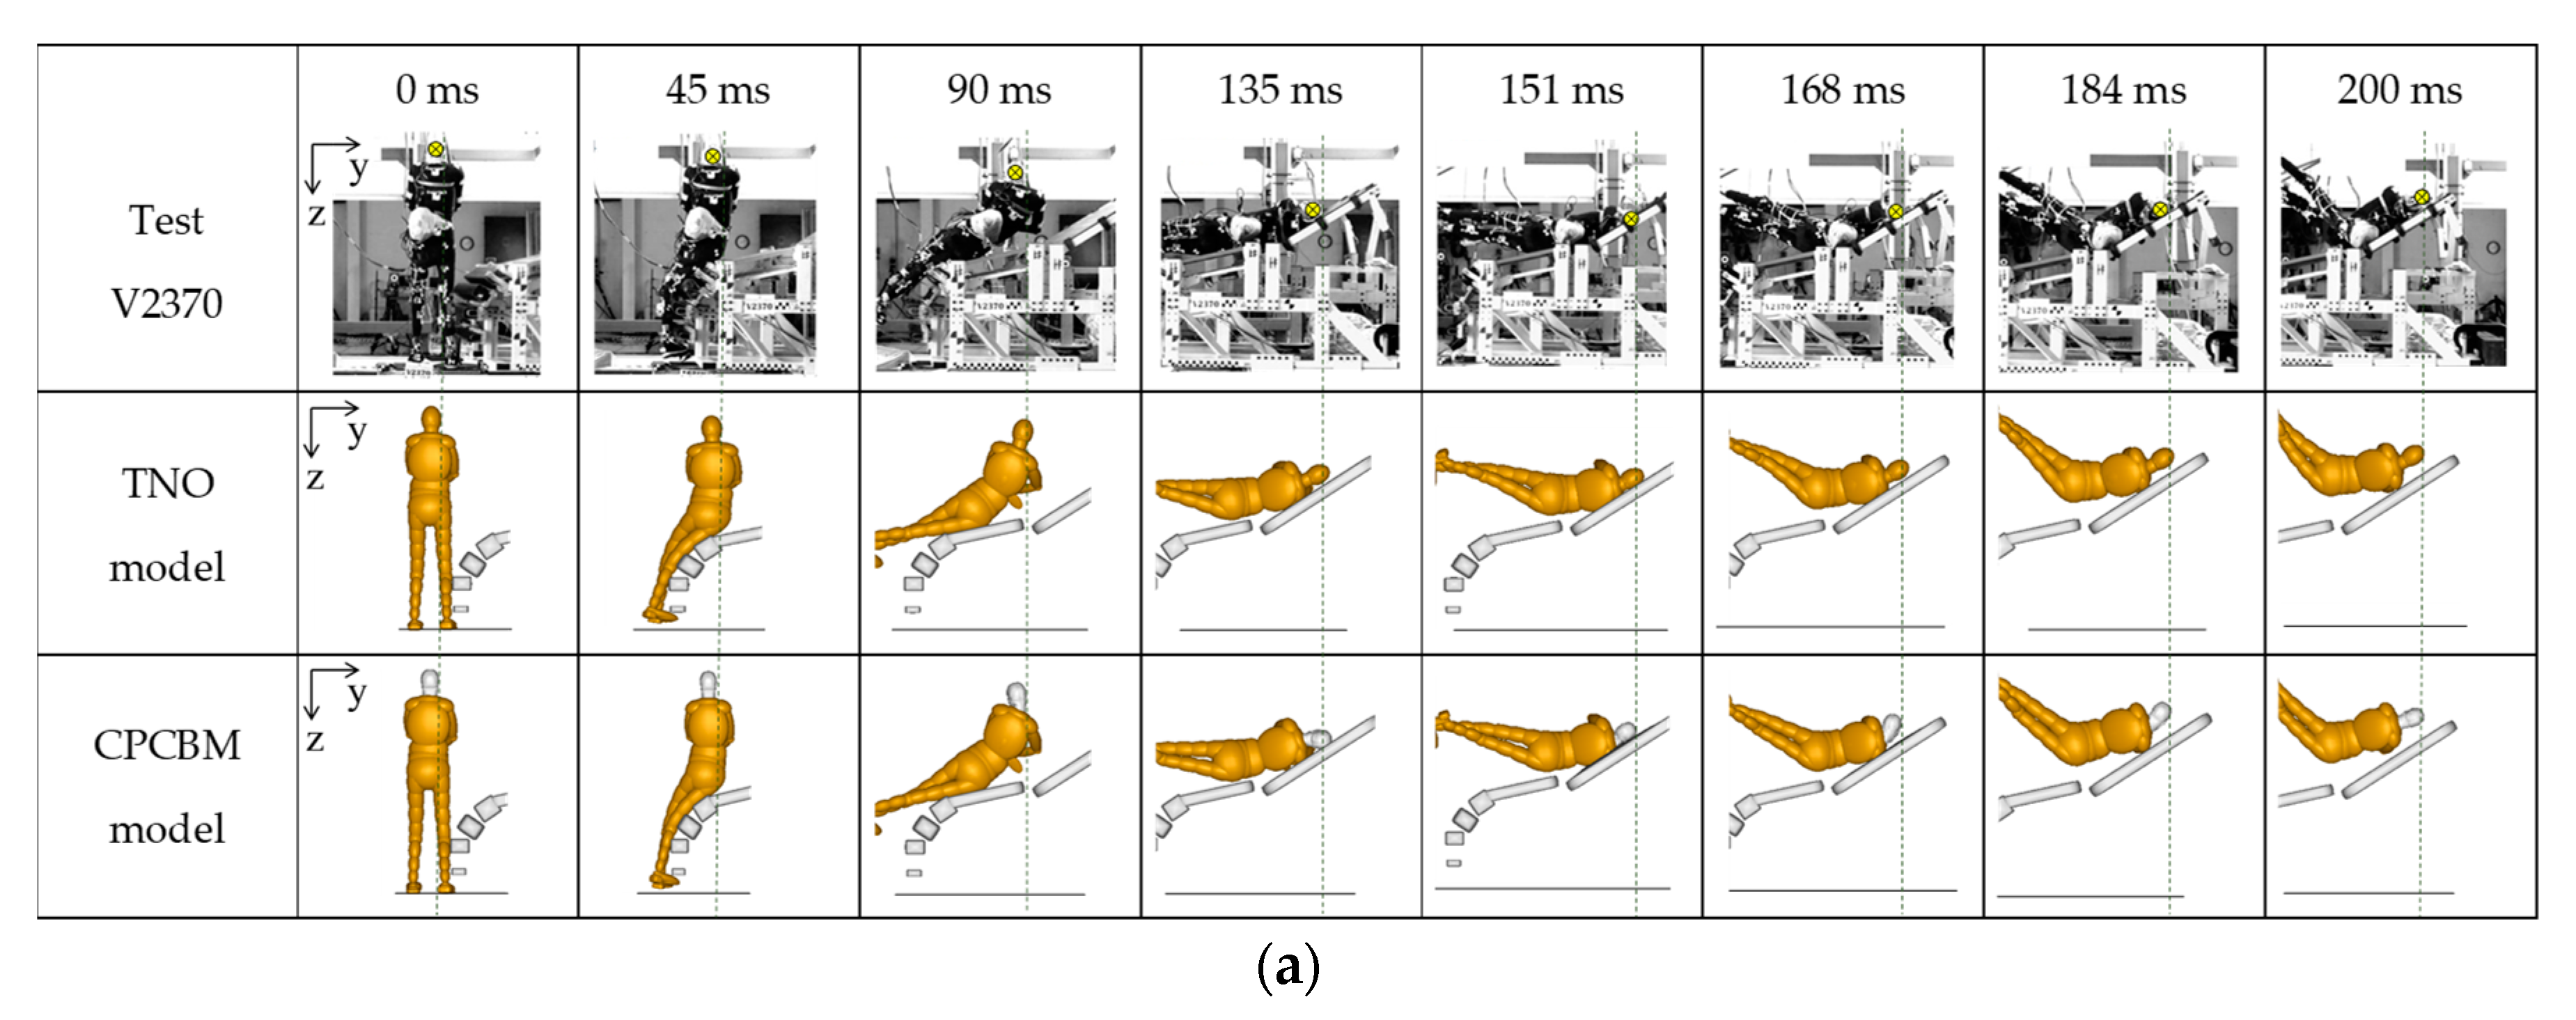
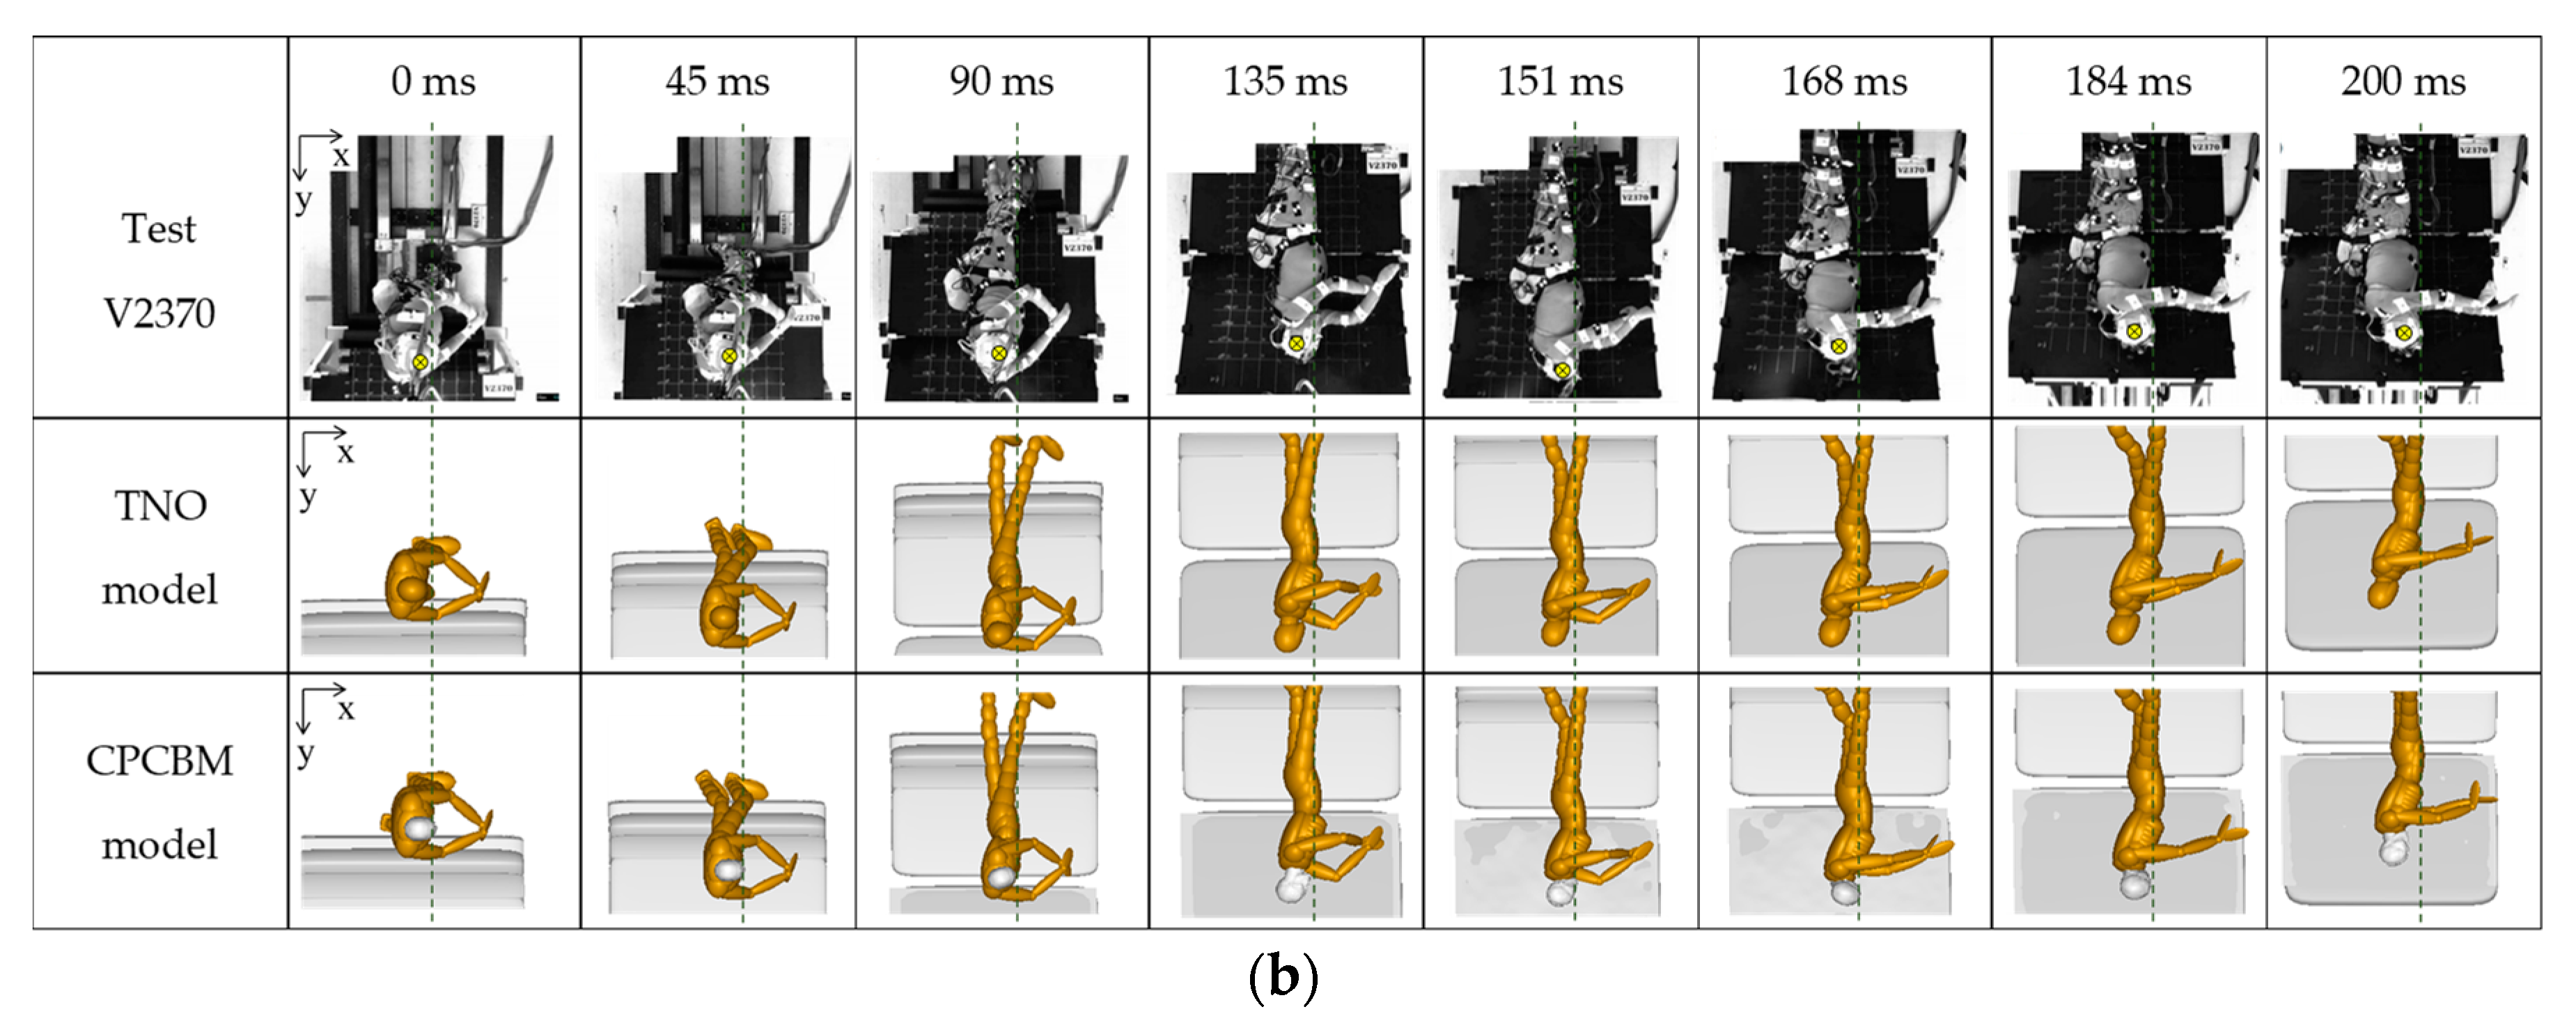
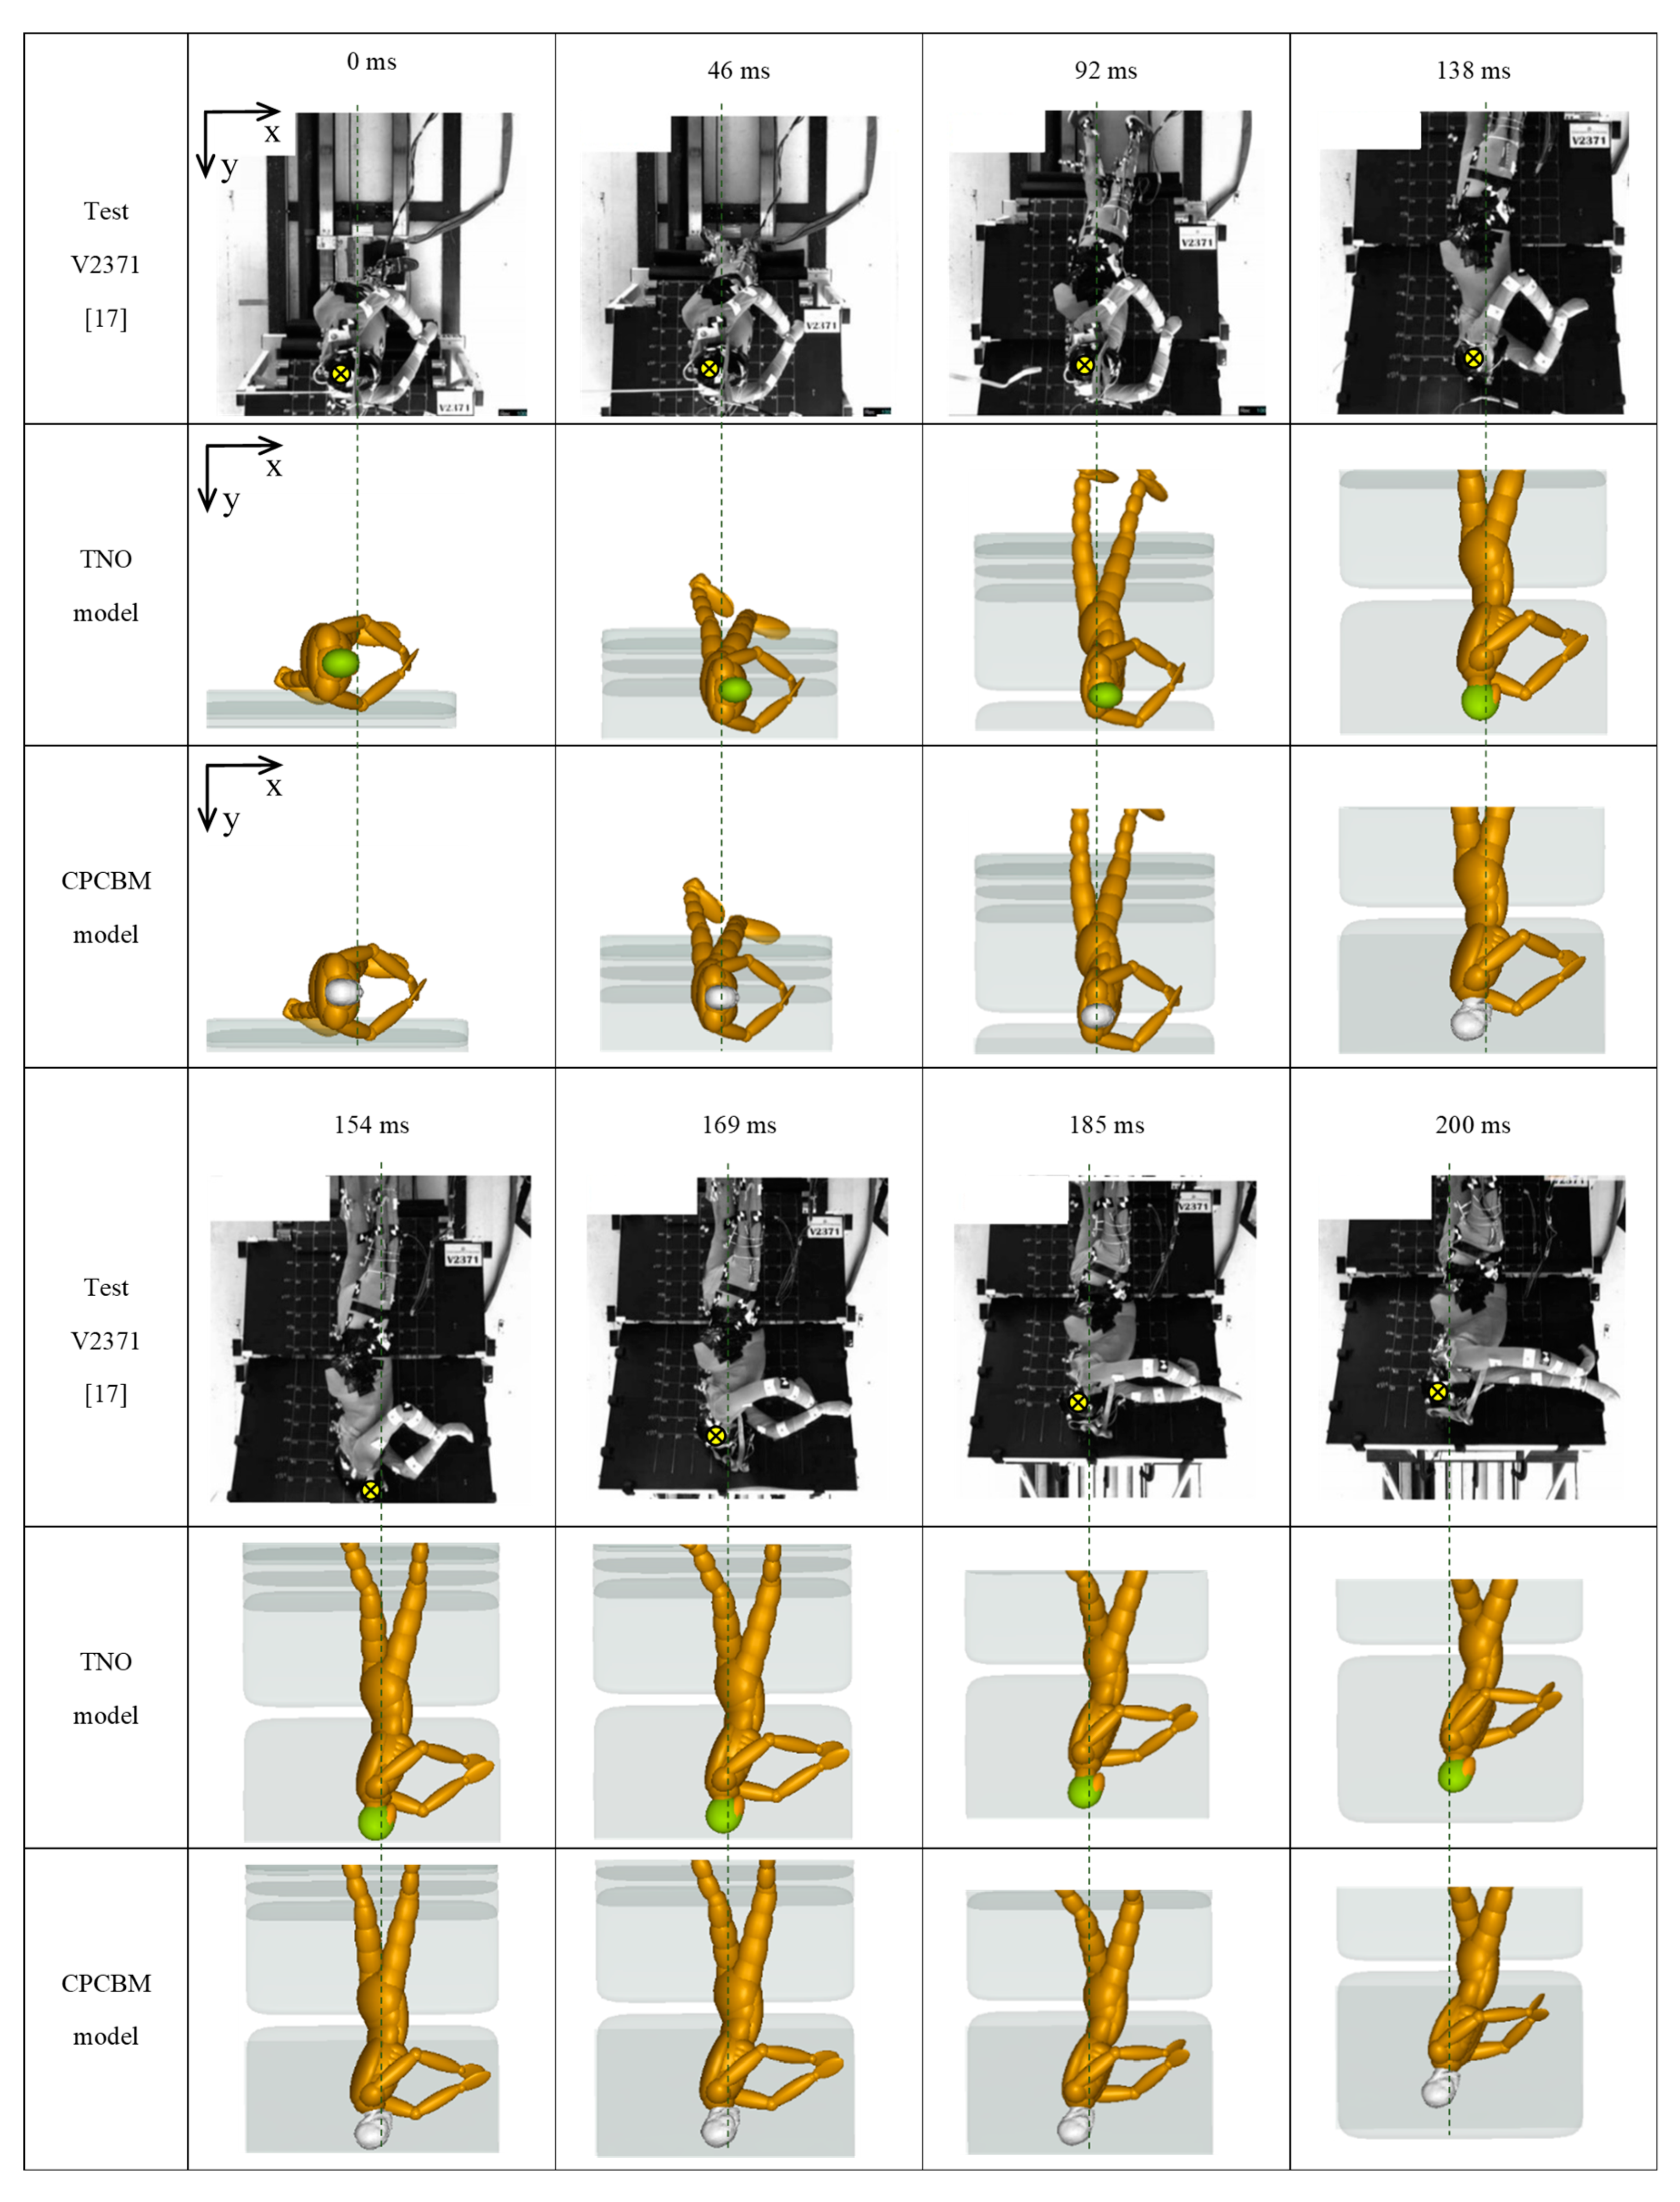
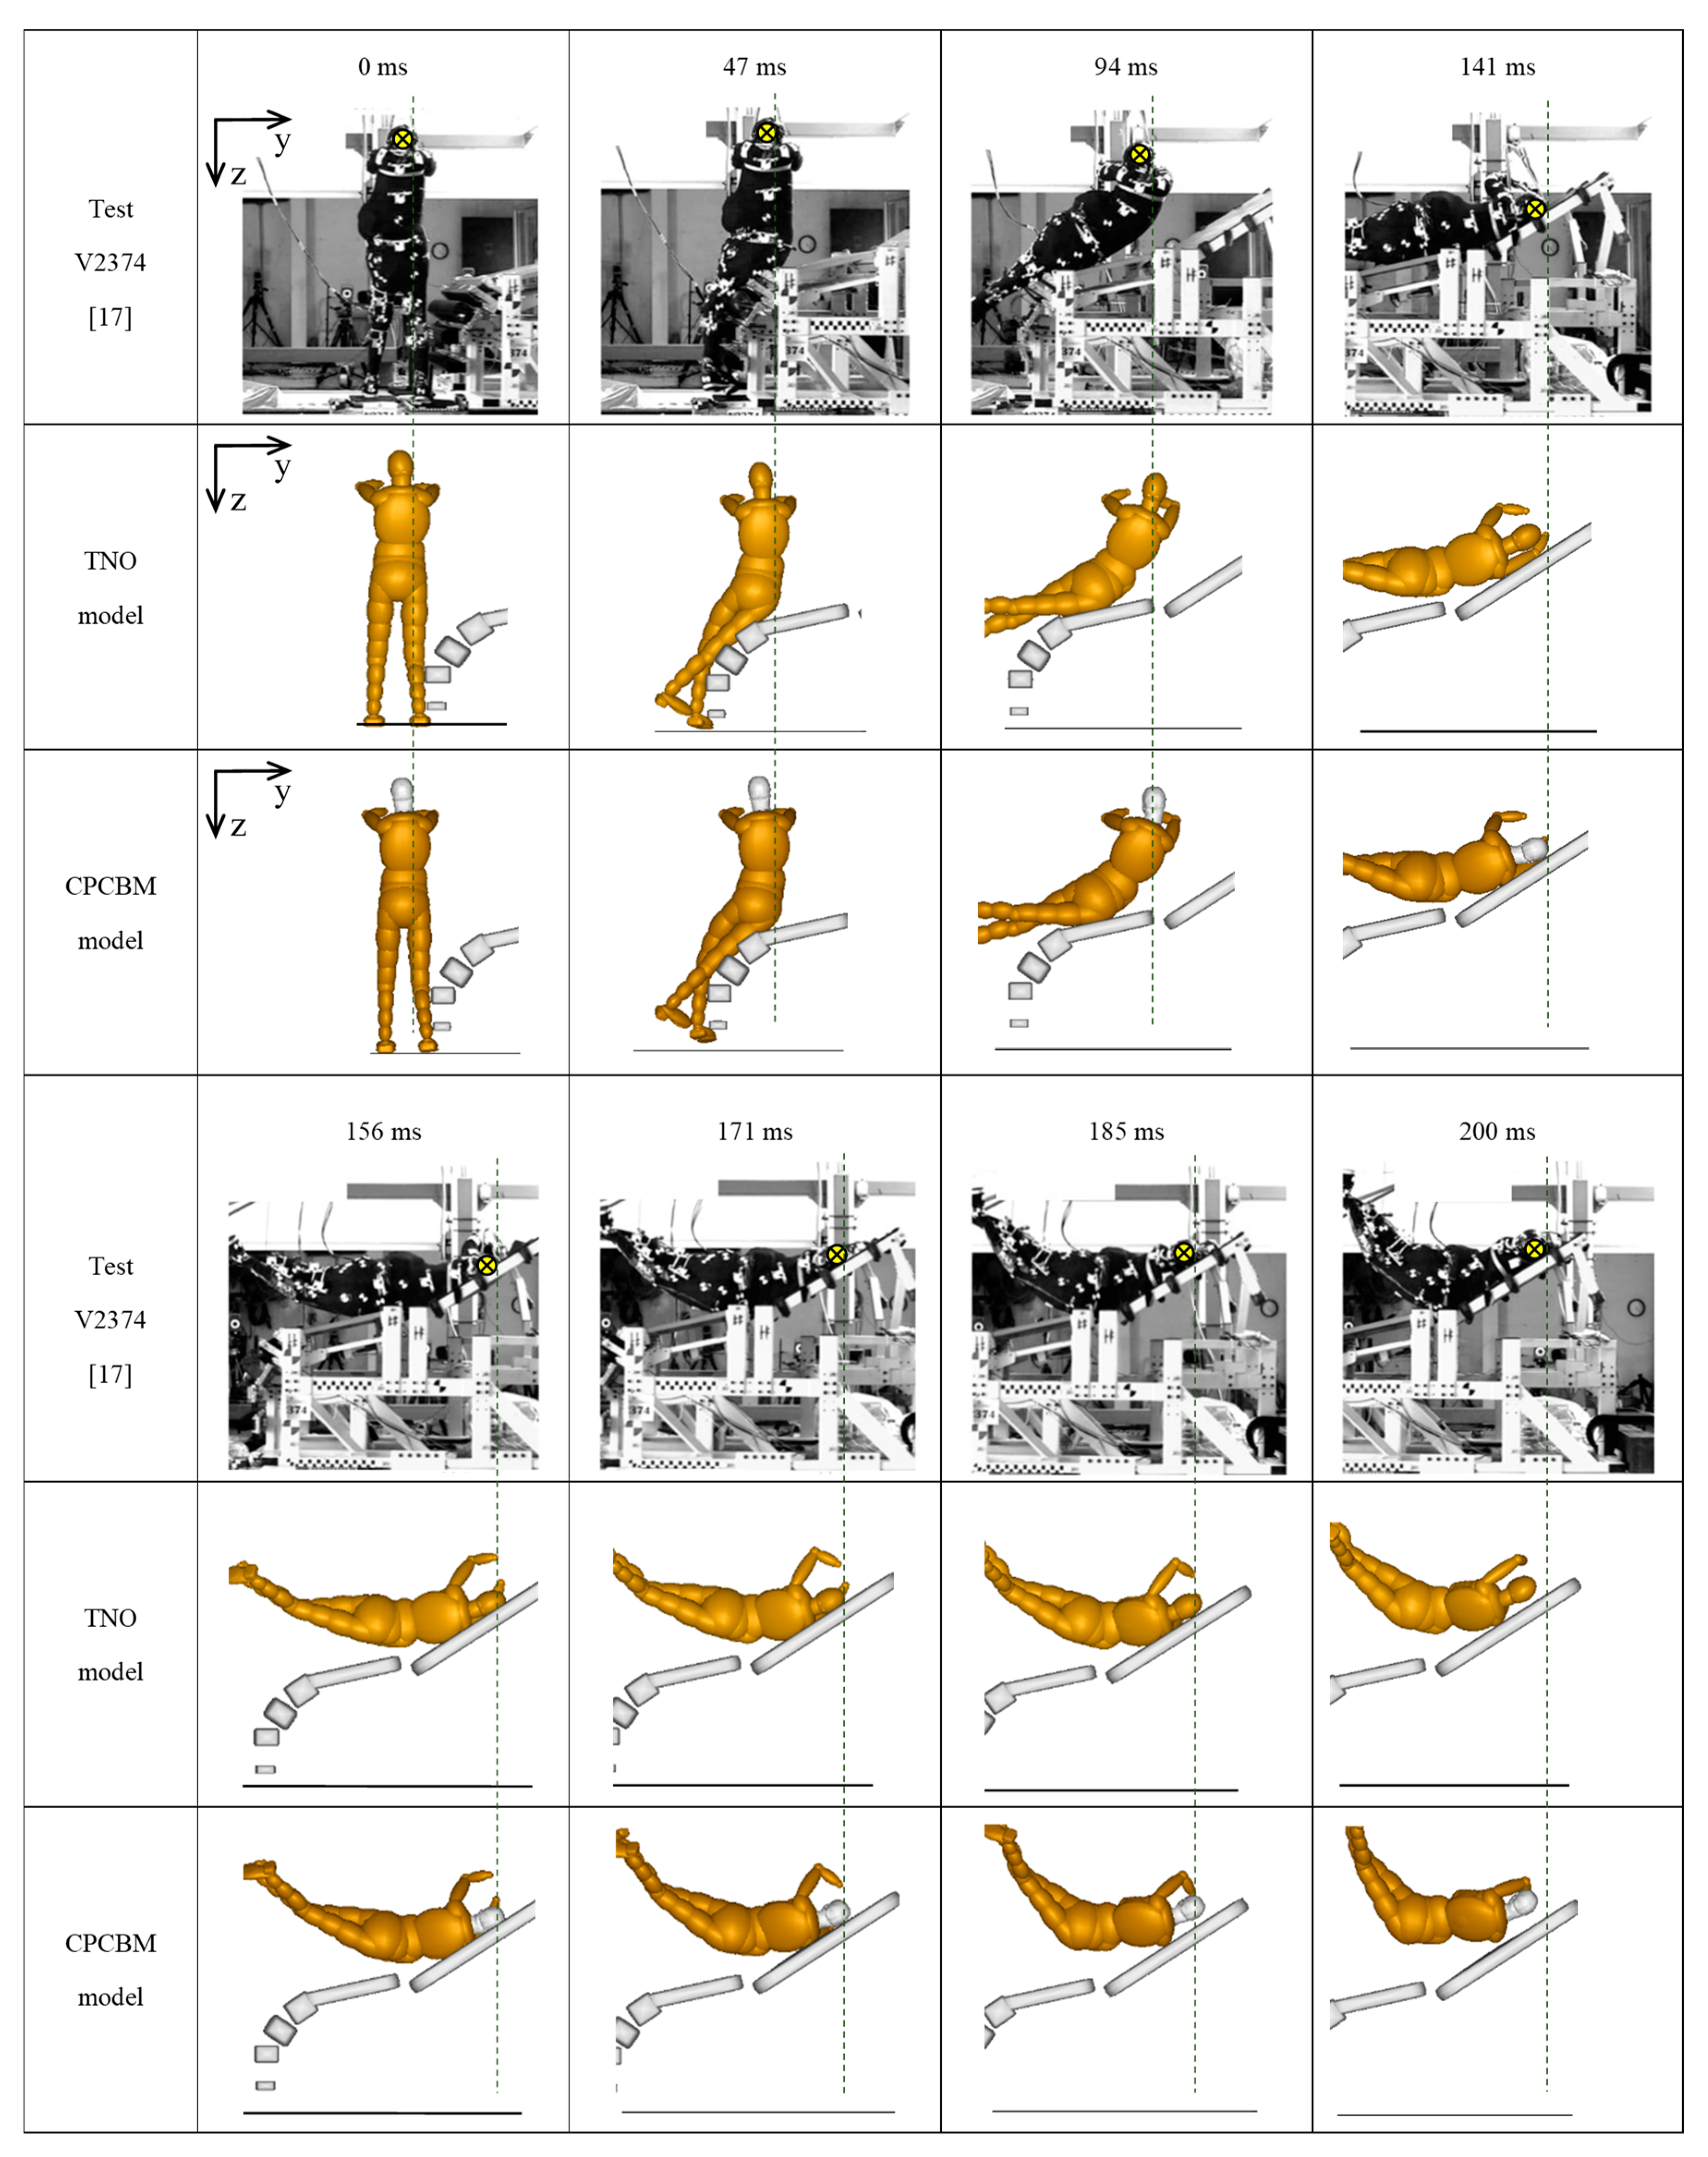
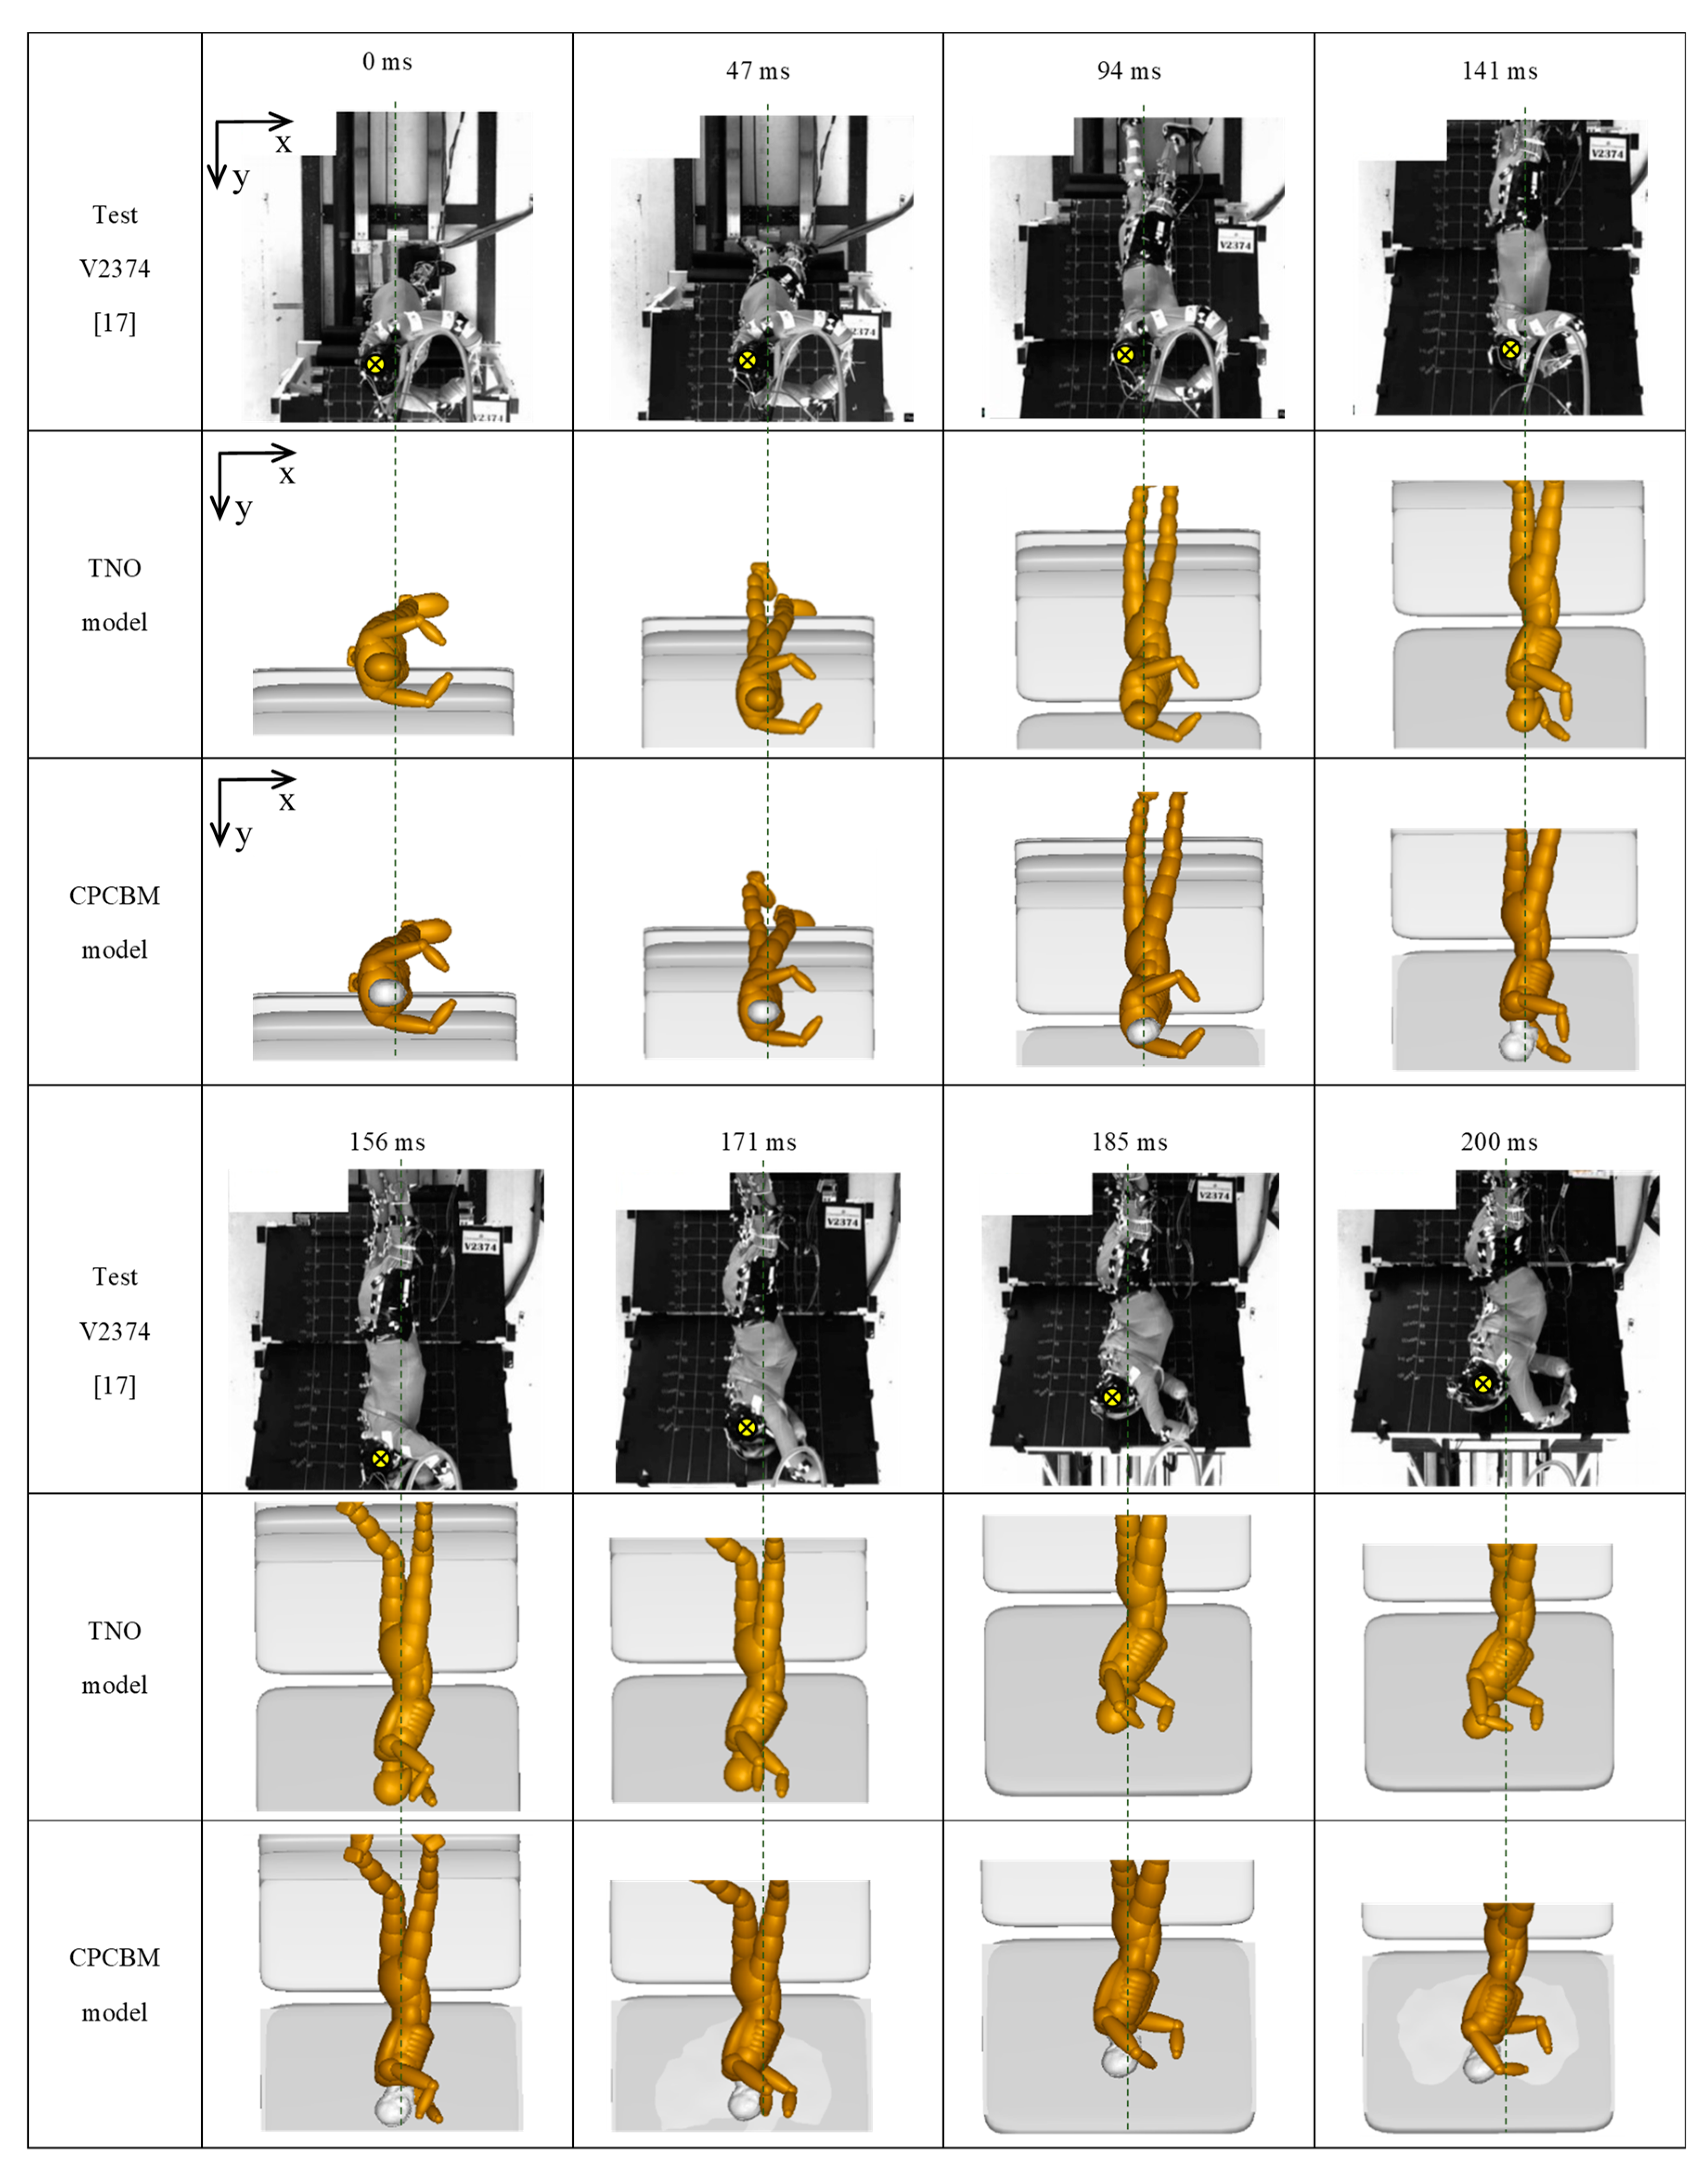
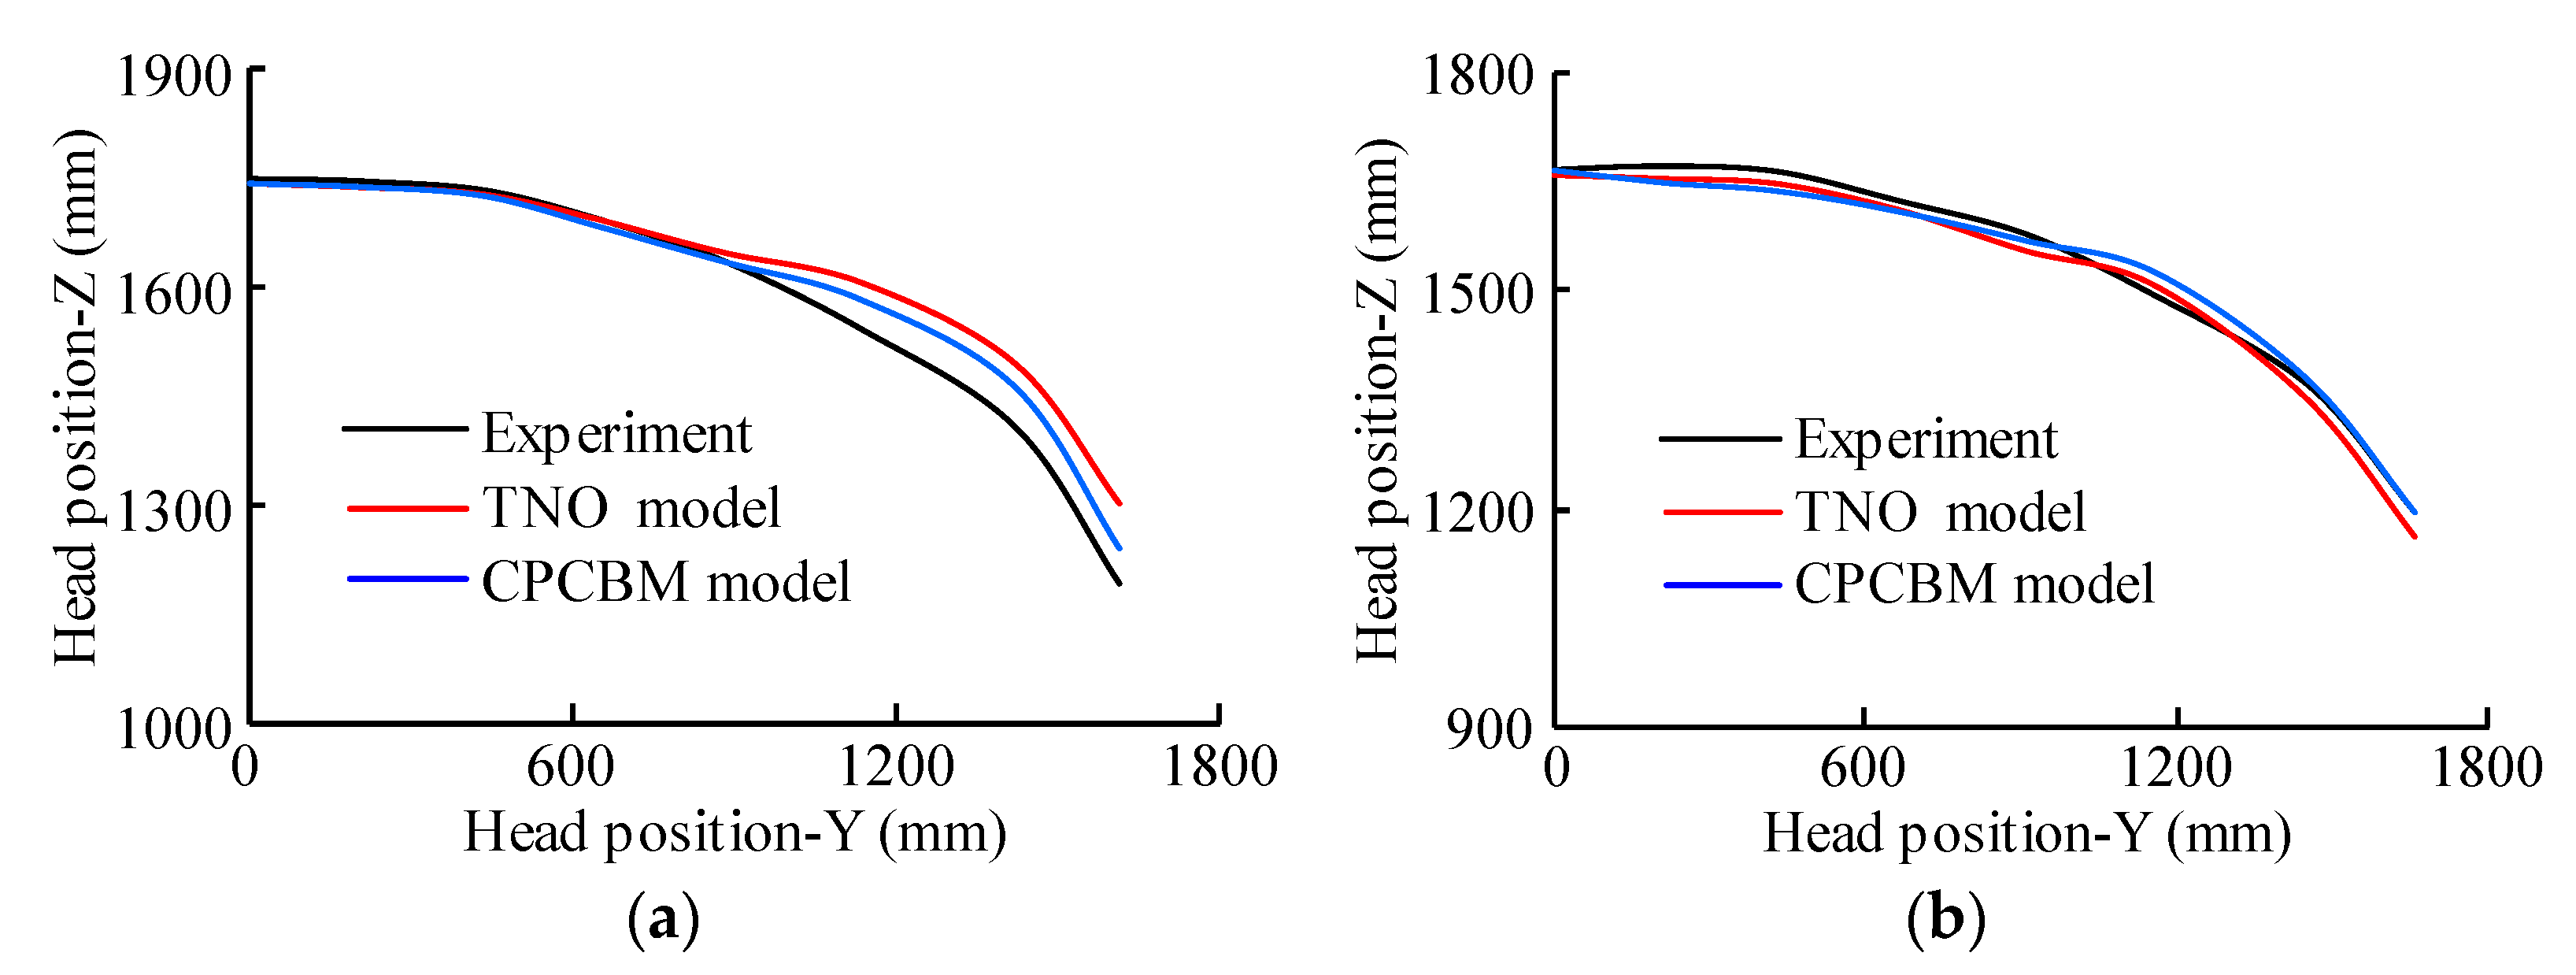
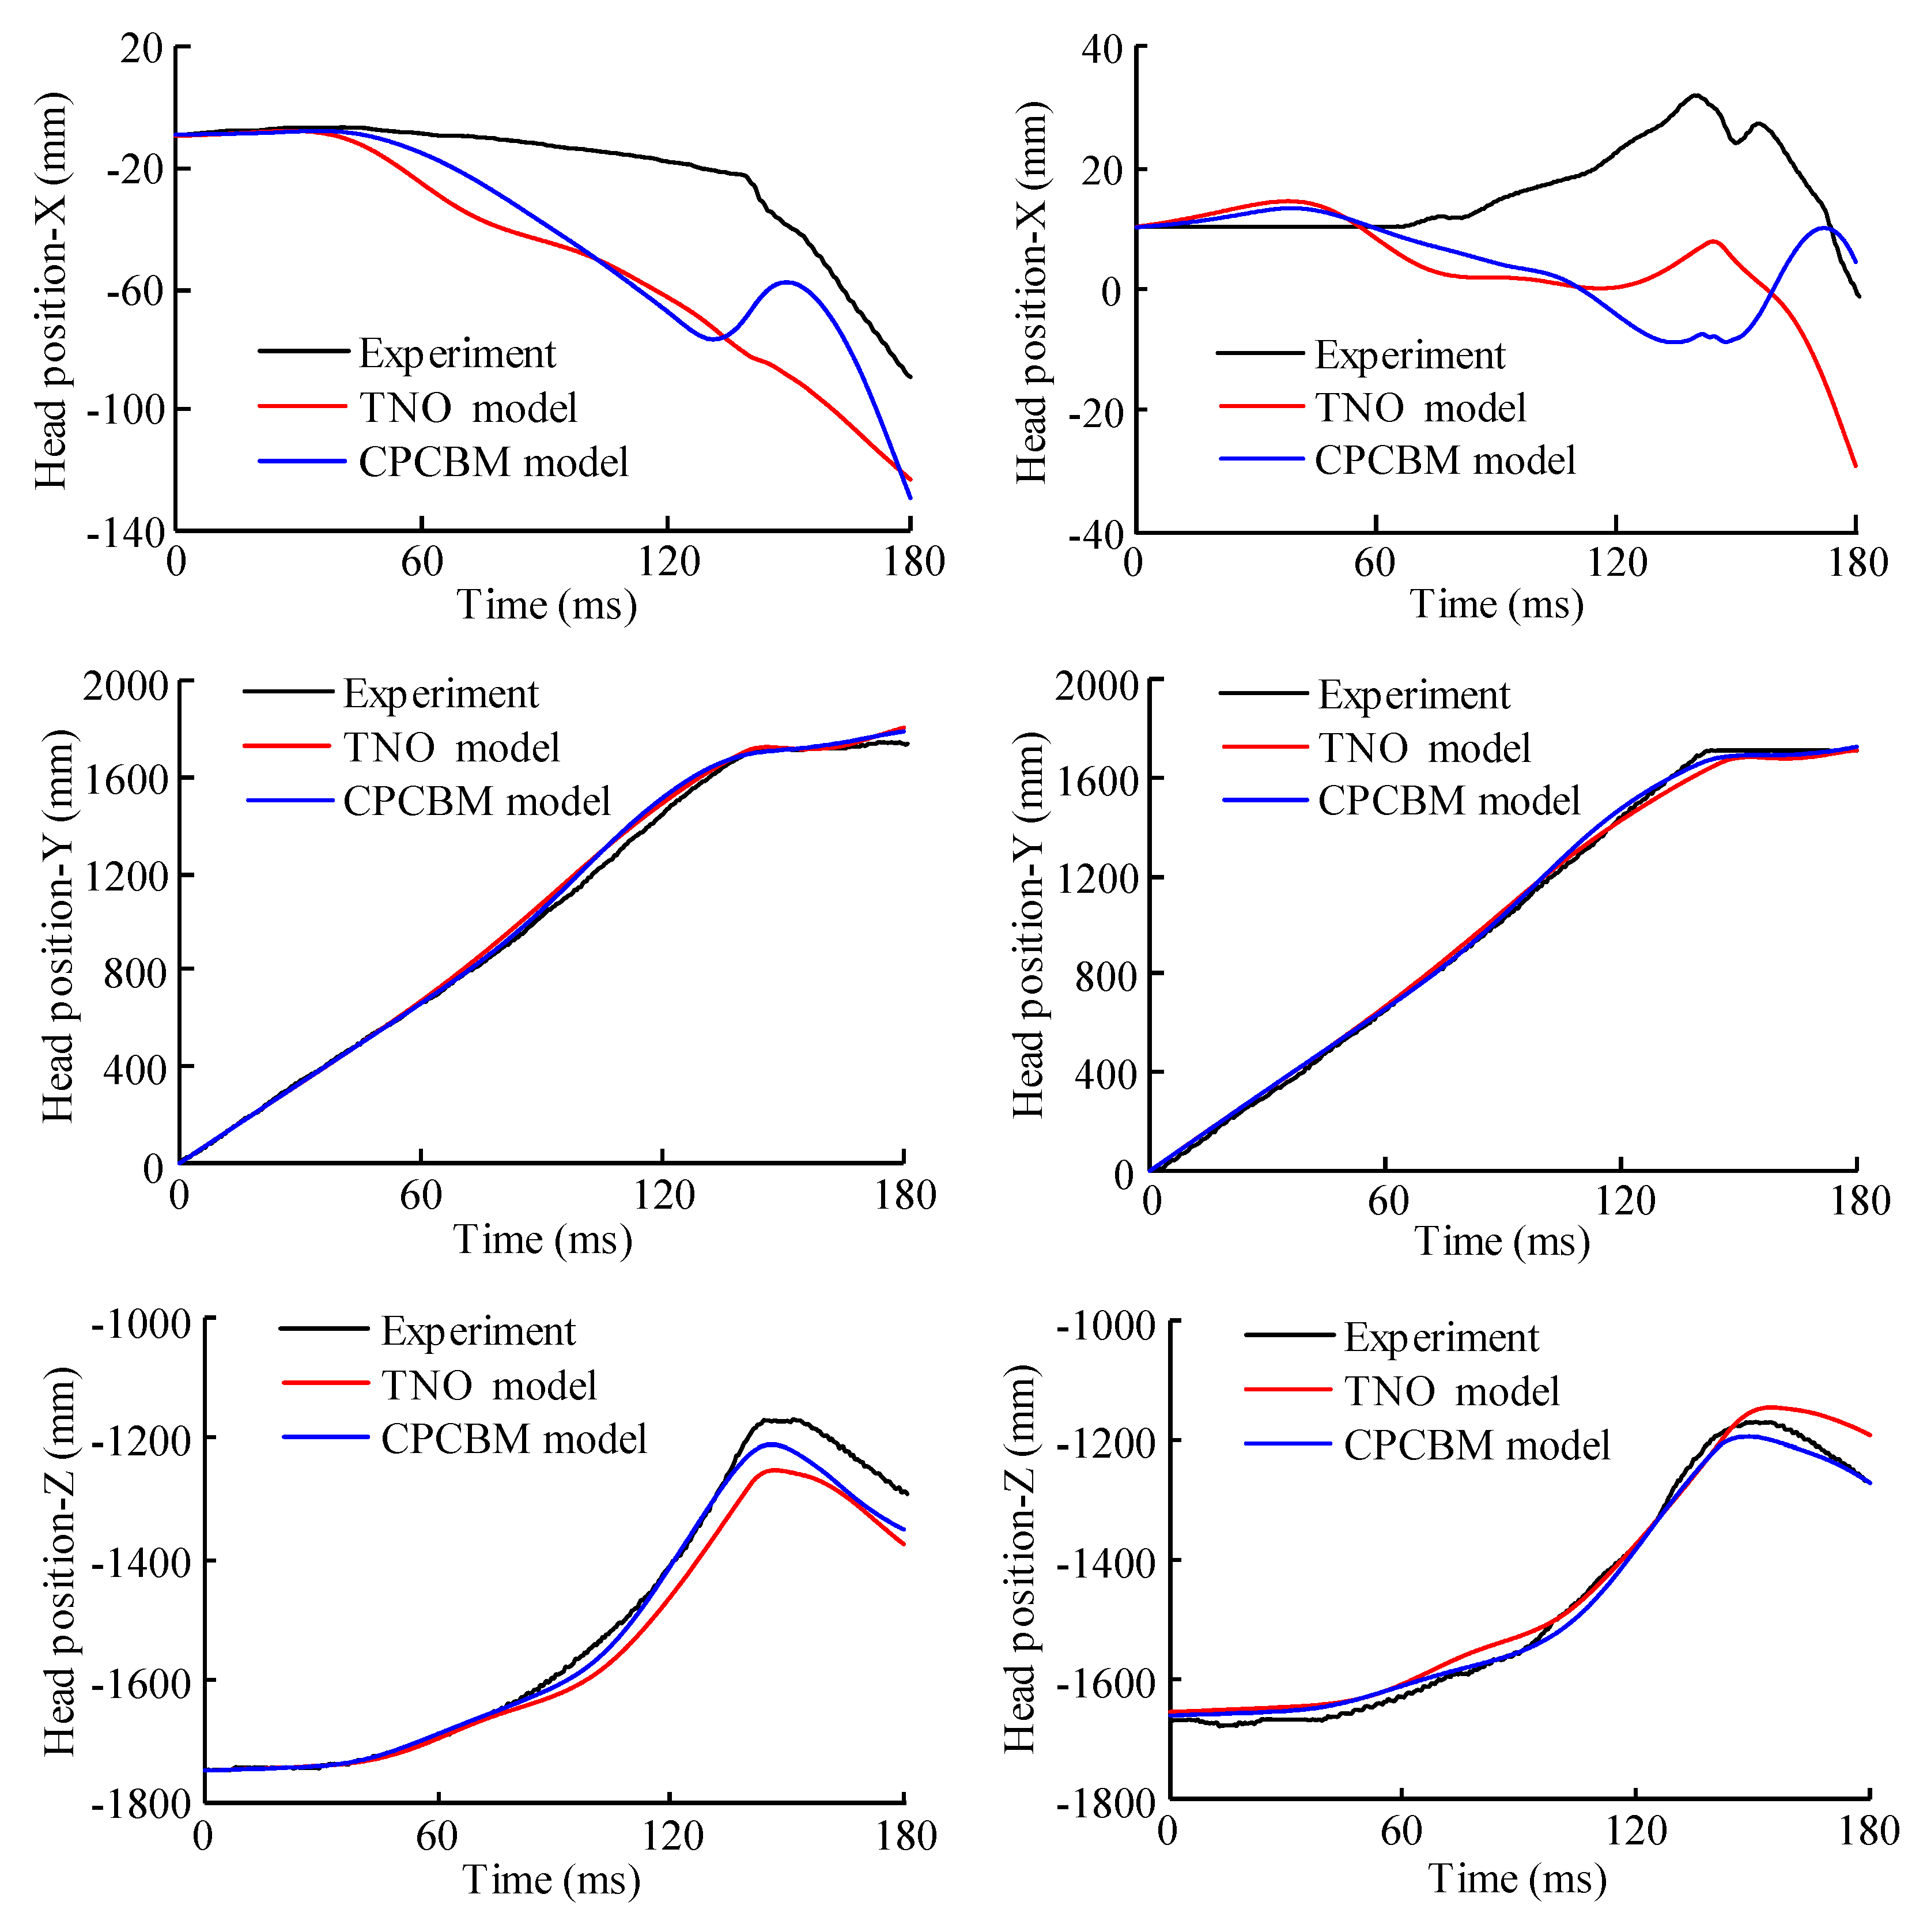
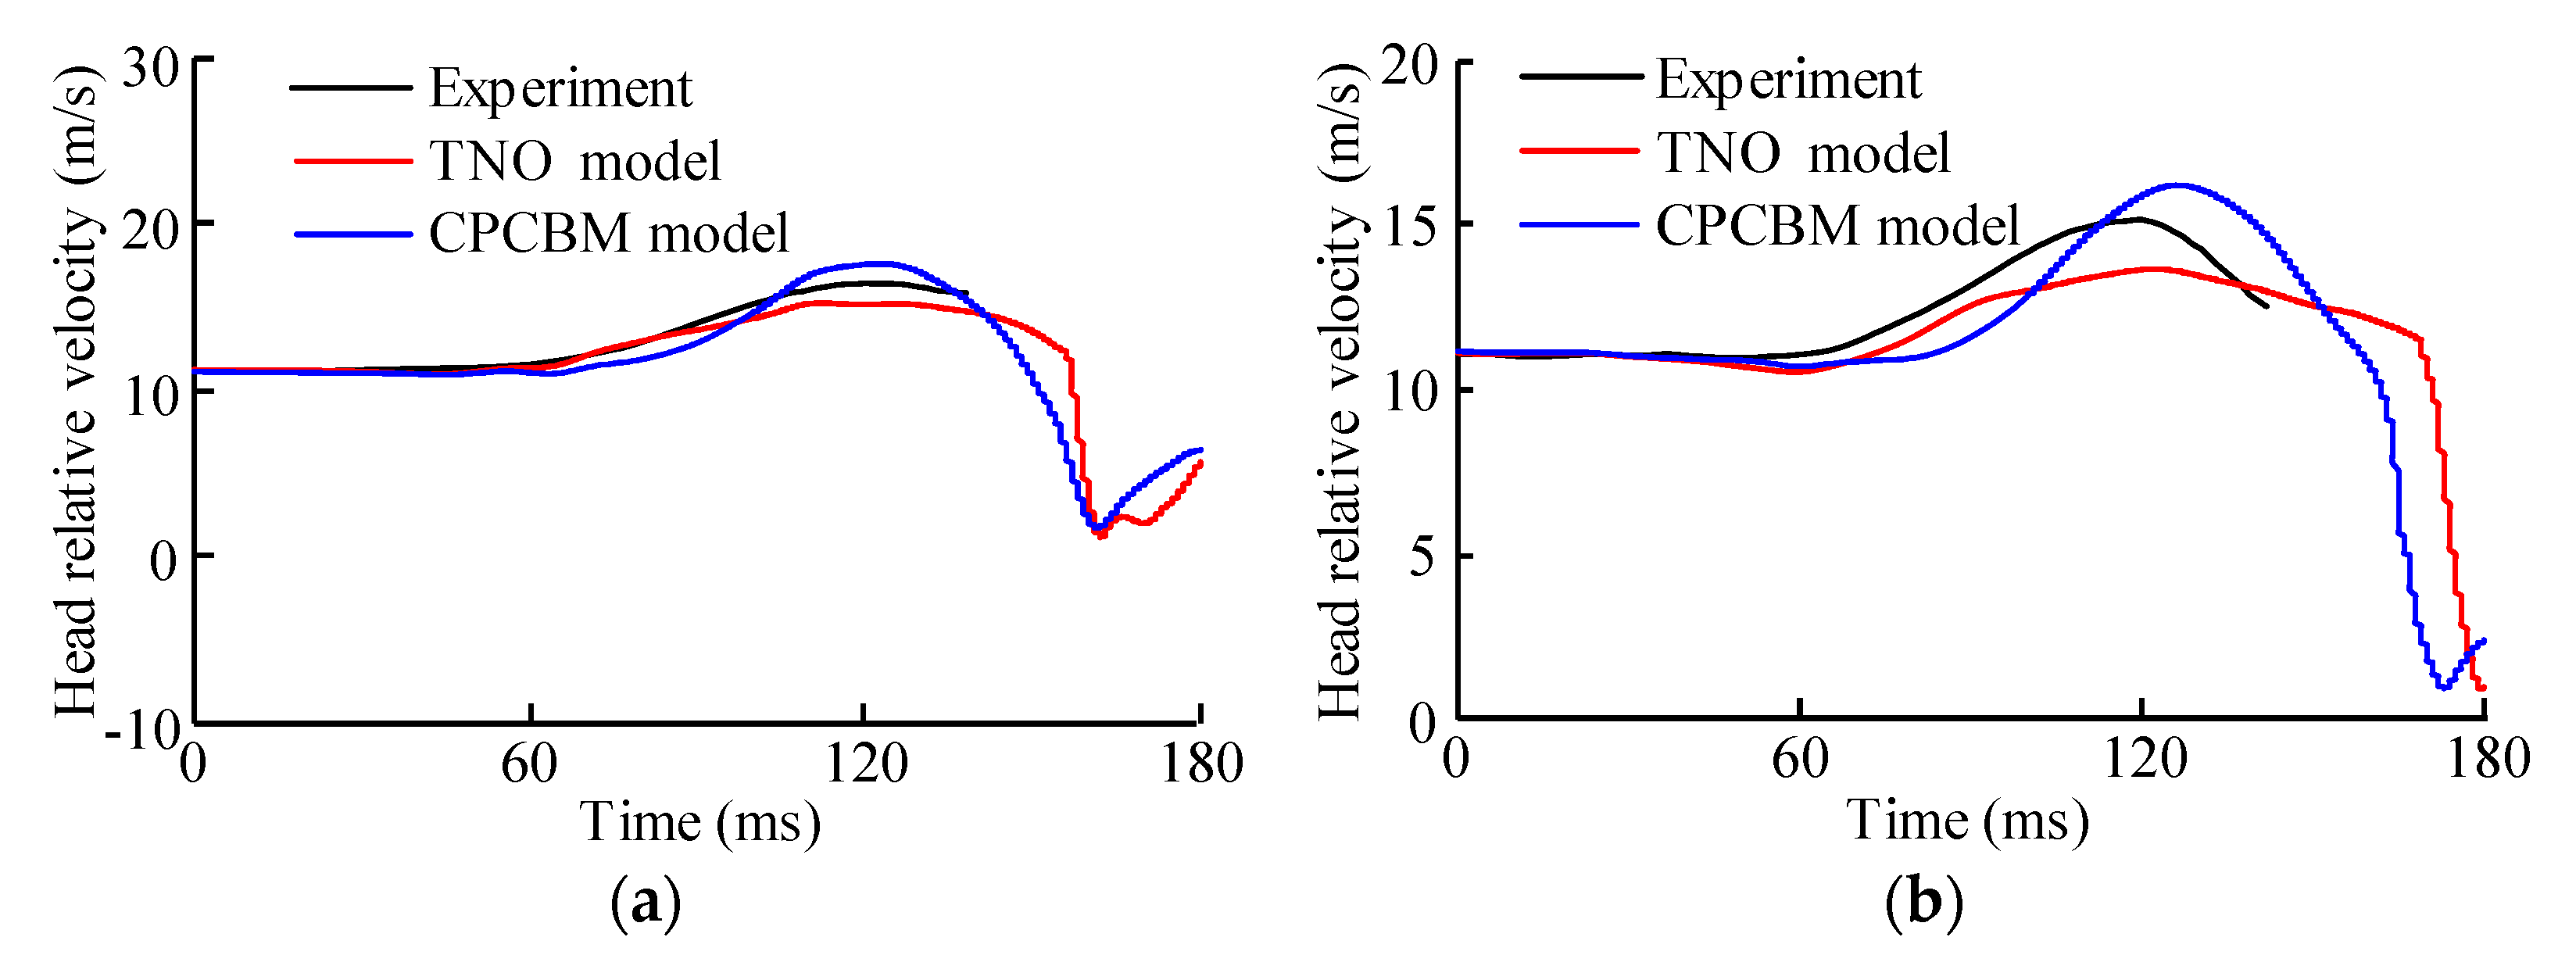
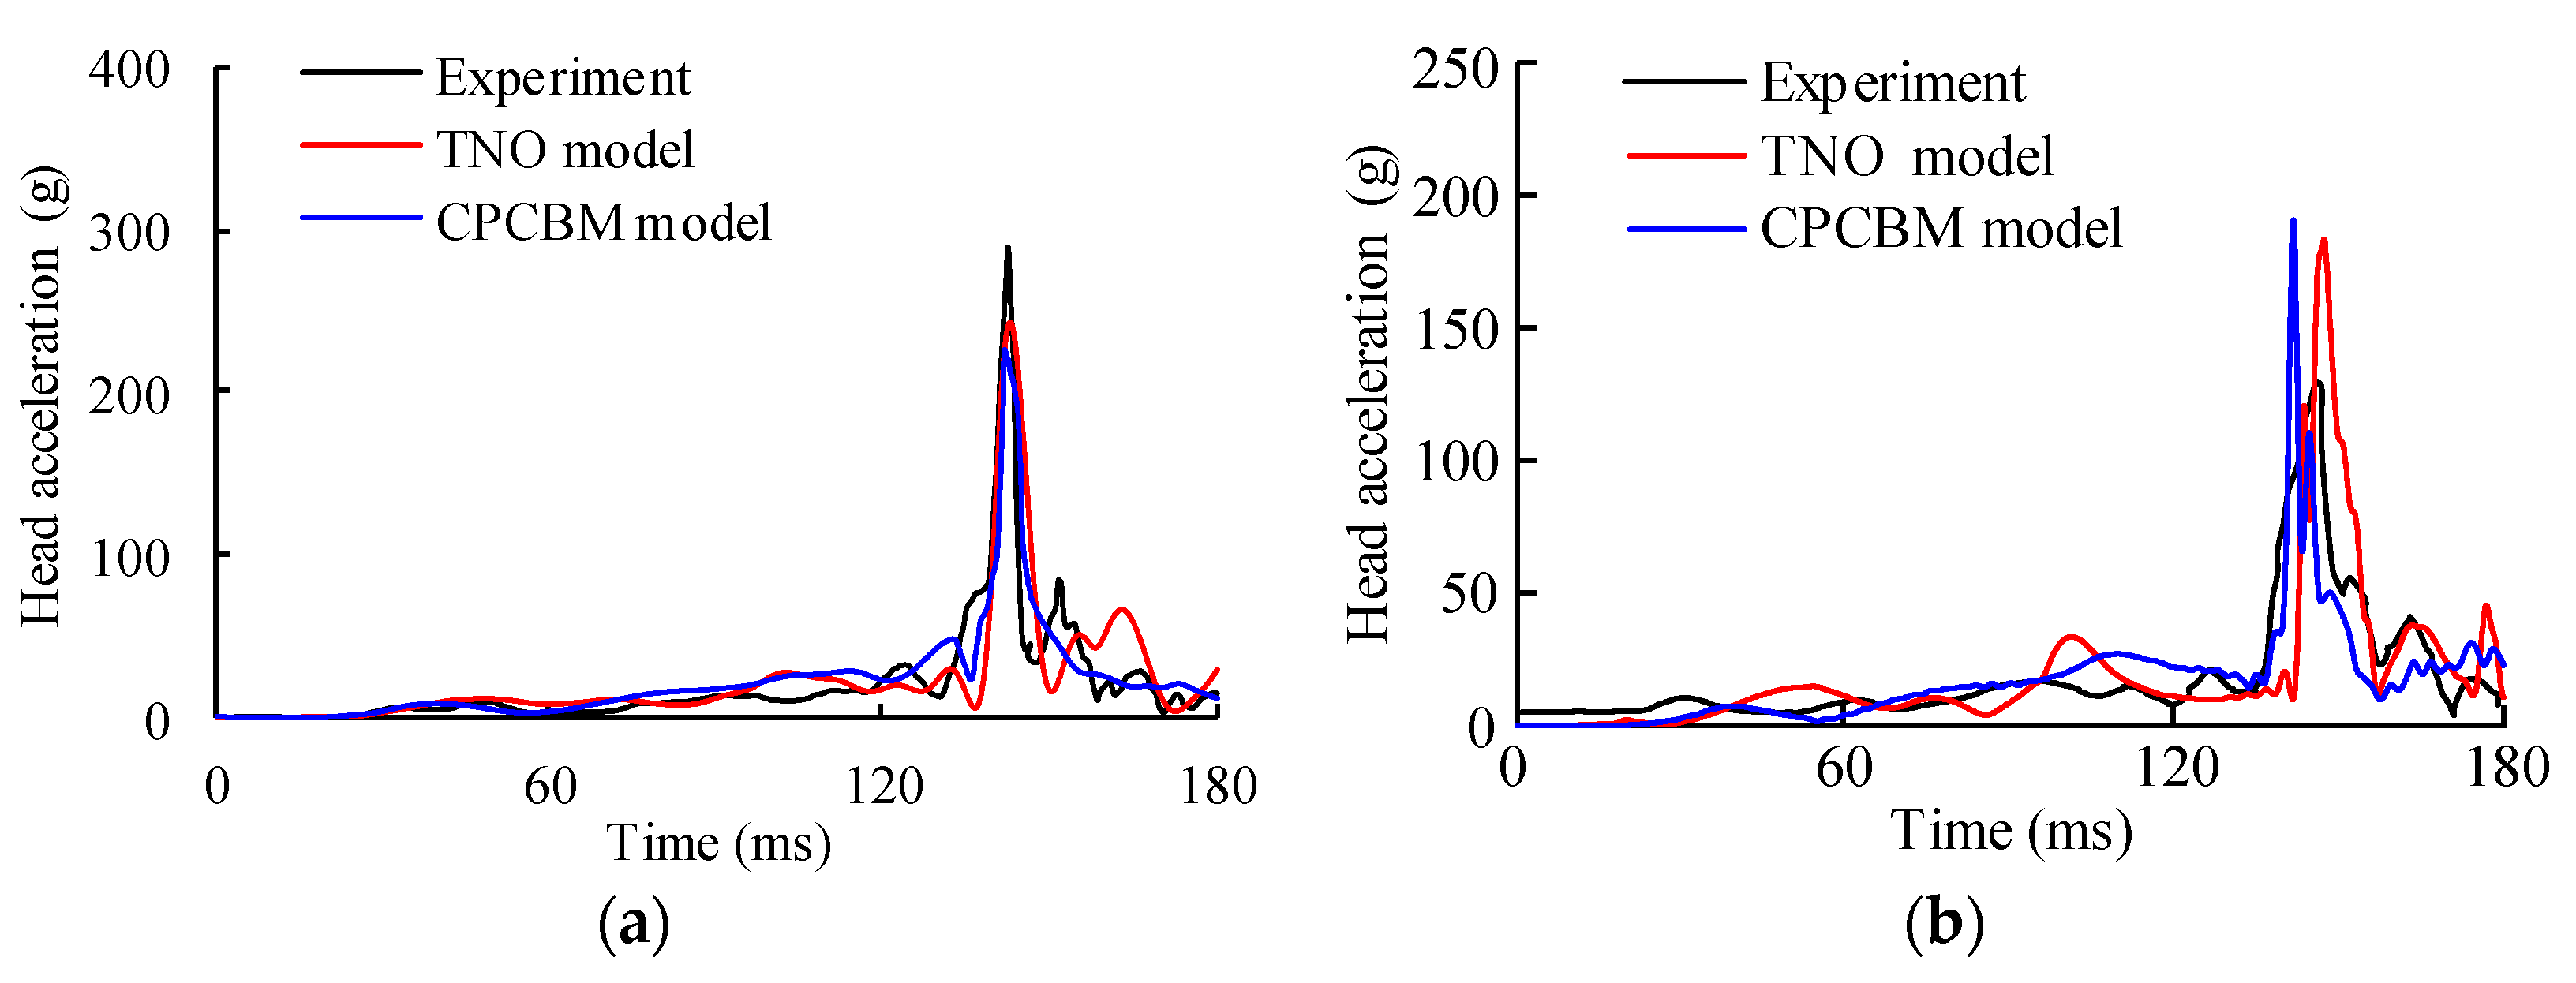
3.1. Comparison of Kinematic Response

The comparisons of the pedestrian’s overall motion between the simulation and the experimental measurements are shown in Figure 5, with the test V2370 as an example. It appears that the predicted kinematics using both the TNO model and CPCBM match well with the experimental results. The similar comparisons of tests V2371 and V2374 can be found in Appendix B.
The trajectory, displacement, and resultant velocity relative to the impact buck, and resultant acceleration time histories of the head COG, calculated with the two pedestrian models (TNO and CPCBM) were also compared with the experimental results, taking the test V2370 as an example again, as shown in Figure 6. From the comparison of the displacement (Figure 6a–c), we can see that in Y/Z directions both the TNO model and CPCBM well-predict the motion of the subject’s head COG observed in the experiment, which can also be seen in the comparison of the head COG’s trajectory in the YOZ plane (Figure 6d). In terms of the resultant velocity relative to the sedan buck (Figure 6e), the difference of head impact velocity between the experiment and simulation is small, particularly for tests V2370 and V2371 (see Appendix C). A similar phenomenon can be observed in the resultant acceleration of the pedestrian head COG (see Figure 6f). Similar comparisons for tests V2371 and V2374 are shown in Appendix C.
The correlation scores between the predictions using the TNO pedestrian model and CPCBM, and the experimental results were analyzed via the CORA method, shown in Table 3. As can be seen the TNO model and CPCBM both poorly predicted the head X direction displacement of each subject in the test. Especially, for test V2374, the Scora between the simulation and experiment in X-direction displacement are the worst. But we found that the analyzed correlations between the CPCBM and the test regarding the head displacement in Y and Z direction (CORA ratings: Y = 0.99 ± 0.01; Z = 0.98 ± 0.01), the resultant velocity relative to the sedan buck (CORA ratings: 0.85 ± 0.05), and the resultant acceleration (CORA ratings: 0.77 ± 0.06), are acceptable. Besides, the result of CORA ratings between the TNO model and the test are very close to the ratings of the CPCBM (Table 3 and Figure 7).

3.2. Comparison of Injury Prediction

For the experimental data on the head injury, only head injury criterion HIC15 was reported in the literature [17]. Thus, we also compared the HIC15 of PMHSs with those of the TNO model and CPCBM from the simulations (Figure 6). In addition, we also introduced the predicted HIC15 by the full-scale THUMS FE pedestrian model used by Wu et al. [17] as a reference (Figure 8). The predicted HIC15 of TNO model in three tests are all close to each subject suffered. However, the predicted HIC15 of the CPCBM in test V2371 is slightly smaller than the subject suffered in experiment, which has closely associated with the difference of its initial posture and anthropometric parameters. The THUMS model predicted HIC15 are closer with the subject in tests V2370 and V2371, but there is also a big difference in test V2374.

3.3. Calculation Efficiency of the Human Body Models

The calculation efficiency of a human body computational biomechanics model in predicting human injury was rarely mentioned in the literature. In our study, the time efficiency of the currently used two pedestrian models (the full-scale MB TNO pedestrian model and the CPCBM) were compared and evaluated by simulating the same typical car-to-pedestrian impact scenario (Figure 9) at 40 km/h lasting 240 ms using a PC with 8-core i7 CPU (Intel Core). Since the time efficiency disadvantage of the full-scale FE model was well-known [25], the THUMS pedestrian model was also included in the comparison (see Table 4). In order to ensure the comparability of the results of the models, the mass scaling percentage of all FE models were limited to 2%, and hourglass control algorithms were used to keep the ratio of hourglass energy to the total energy less than 10%, as per the recommendations of Yang and King [55]. From the comparison shown in Table 4, it can be seen that the TNO model shows extremely high computational efficiency, and the full-scale FE model requires significantly more computation time than the others. It is not surprising that the CPCBM takes far less time than the THUMS model. In addition, it is worth mentioning that the CPCBM takes substantially less time for model scaling and repositioning than the THUMS model, as the torso and upper/lower extremities of the CPCBM model were taken from the MB pedestrian model.

4. Discussion

4.1. Model Scaling and the Initial Posture Adjustment

The anthropometric parameters and initial posture of the pedestrian have significant influence on the predicted head kinematics and injury response [15,51], so the pedestrian model scaling and initial posture adjustment are important for accurately reproducing head responses in the simulation. In this study, the full-scale TNO pedestrian model was firstly scaled and adjusted following the anthropometry and initial posture of the tested PMHSs, and then used to form the CPCBM with the combination of FE THUMS head–neck complex. Although the subjects’ main measurement signals are available [49], some of the necessary parameters needed for scaling are still missing (see Table 2). In order to complete the scaling, these missing parameters were taken from the TNO 50th percentile adult male pedestrian model, which is believed to contribute to the differences between the adjusted TNO models and the marked points of the subjects (Figure 3), and may also cause a potential difference of the predicted head motion by the scaled TNO models from the experimental data. Another possible explanation of such a differences (Figure 3), may rely on the fact that, since the TNO model is a simplified MB pedestrian model, which means the outer surfaces of all the bodies are composed of rigid ellipsoid, it is quite difficult to accurately find the points of the exact same locations as the marker points of the corresponding subjects (see Figure 3).

4.2. Comparisons of the Dynamics Responses

In the simulations of all the chosen PHMS tests, the overall motion responses of the CPCBM and TNO models match well with the experimental results, however, it is obvious that both the CPCBM and TNO models rebound off the bonnet of the impact buck earlier than the subjects. The separate times are basically the same: it can be found from the still captures of the motion responses (Figure 5 and Appendix B) that the MB pedestrian separate with the bonnet at 135 ms, 138 ms, 141 ms when simulating tests V2370, V2371, and V2374, respectively, while in experiments, the upper torso of subjects keep in contact with the impact buck during the impact.
Both the CPCBM and TNO models predicted well the head motions of the tested subjects, the head COG trajectories in the YOZ plane predicted using the CPCBM and TNO model are basically consistent with the experimental results (see Figure 6 and Appendix C Figure A8). However, the differences in the displacement of the head COG were observed between the predictions of the CPCBM and TNO models and the experimental results in the X direction (see Figure 6a), which was also reflected by the observation of the correlation evaluation CORA scores in Table 3. Specifically, the correlation evaluation score Scora between the predictions of TNO model and CPCBM and the experimental results for test V2374 are 0.244 and 0.297, respectively, and for tests V2370 and V2371, the scores are slightly higher (see Table 3). The differences may be caused by three factors: first, there are slight differences in the anthropometric parameters and the initial posture between the subject-specific TNO pedestrian models and tested subjects, as described above; secondly, the TNO pedestrian model has a limited biofidelity; lastly, as shown in the Table A1 in Appendix D, there are clear differences between head–neck systems from the TNO model and the THUMS model. The moment of inertia of the head–neck systems scaled from the TNO model according to the PMHSs tested in three chosen experiments are larger than the THUMS head–neck model. These differences may potentially influence the head kinematics of the pedestrian models.
Though both CPCBM and TNO models showed difference in overall motion and head kinematics responses from the experimental results, the predictions of the two models for all the subjects are quite close to each other (see Table 3, Figure 7, and Appendix C). Such similarity could be largely expected since the main body regions except the head–neck complex of the CPCBM and TNO model are the same. From this perspective, a particular emphasis could be paid on the observing the differences in the predicted head kinematics between the CPCBM and the TNO pedestrian model by simulating the same cadaver tests, for the evaluation of the reliability of the CPCBM. Specifically, Figure 7 shows that the CORA ratings of the CPCBM and TNO model with the experimental results for a chosen test are quite similar, and the head motion and trajectories predicted using the two models are almost the same before the head-buck windshield contact (see Figure 6); the differences occur only when the head rebounds off. Such differences possibly contribute to the differences in the neck stiffness between the MB and FE human body models. The previous studies have already identified that the FE neck model is softer than the real human neck [25].

4.3. Head Injury Prediction

As the available data in the literature about the cadaver head injuries was limited [17], only the HIC15 was analyzed for the effectiveness evaluation of the head injury prediction of the CPCBM. The comparison of HIC15 between the predictions using the different pedestrian models and the test data shown in Figure 8 appears to indicate that the predictions by both the CPCBM and TNO model generally agree with the experimental results, especially for tests V2371 and V2374. In addition, the HIC15 values of the CPCBM and TNO model are also close to the THUMS model, except for the test V2374. Overall, the CPCBM can reproduce HIC of the pedestrians used in the experiments [17].

4.4. Quantitative Evaluation Method CORA

In this paper, the total ratings (Scora) for each type of signal (that include the head’s COG’s trajectory, displacement, and resultant velocity relative to the sedan buck and resultant acceleration) were calculated in Table 3, we can more objectively evaluate the correlation between the simulated and the experimental signals. However, it should be noted that there are some shortcomings. For example, the selection of the signal interval for evaluation and the setting of the weighting factors of its two sub-ratings during the evaluation process would affect the predicted Scora. In the present work, we used the start and end points of each signal as the endpoints of the signal evaluation interval, and adjusted the default weighting factor to make the evaluation process stricter. The settings used in each signal evaluation process are the same, and the details of all signals’ CORA evaluation process are shown in Appendix E.

4.5. Limitations

There are some limitations existing in this work. Firstly, since the TNO multibody pedestrian model does not represent the detailed human anatomic structure, it is difficult to exactly find the output points corresponding to the subjects’ anatomical marking points (e.g., T1, T8, Tibia, etc.) from the TNO model. Therefore, this paper didn’t analyze the differences in human body motion response between the CPCBM and the subjects, and only analyzed the head motion response of the CPCBM. Secondly, considering that the difference in body size between the PMHSs (the medium values in Table 5) in the tests we used and the THUMS model (see Table 5) is not significant, and the specific data of the heads of the cadavers were not reported [17,48,49], we did not scale the THUMS head–neck model during the coupling procedure, which may influence the head kinematics responses of the CPCBM. Finally, the brain injury prediction of the CPCBM is not reconfirmed in this work, due to the absence of brain injury information about the PMHSs used in the tests we referenced [17,48,49], and the fact that the THUMS head–neck model has already been validated in the literature in terms of brain injury prediction [56,57,58,59]. However, further application of the CPCBM into real-world car-to-pedestrian impact accident brain injury prediction evaluation is needed in the future.

5. Conclusions

A new coupled pedestrian computational biomechanics model (CPCBM) was developed by coupling existing commercial FE and MB pedestrian models, and the predicted head kinematics and injury responses obtained by simulating three previously published cadaver impact tests were compared with the experimental results for the validation of the CPCBM. Based on the results of the current study, the following conclusions can be drawn:
(1)
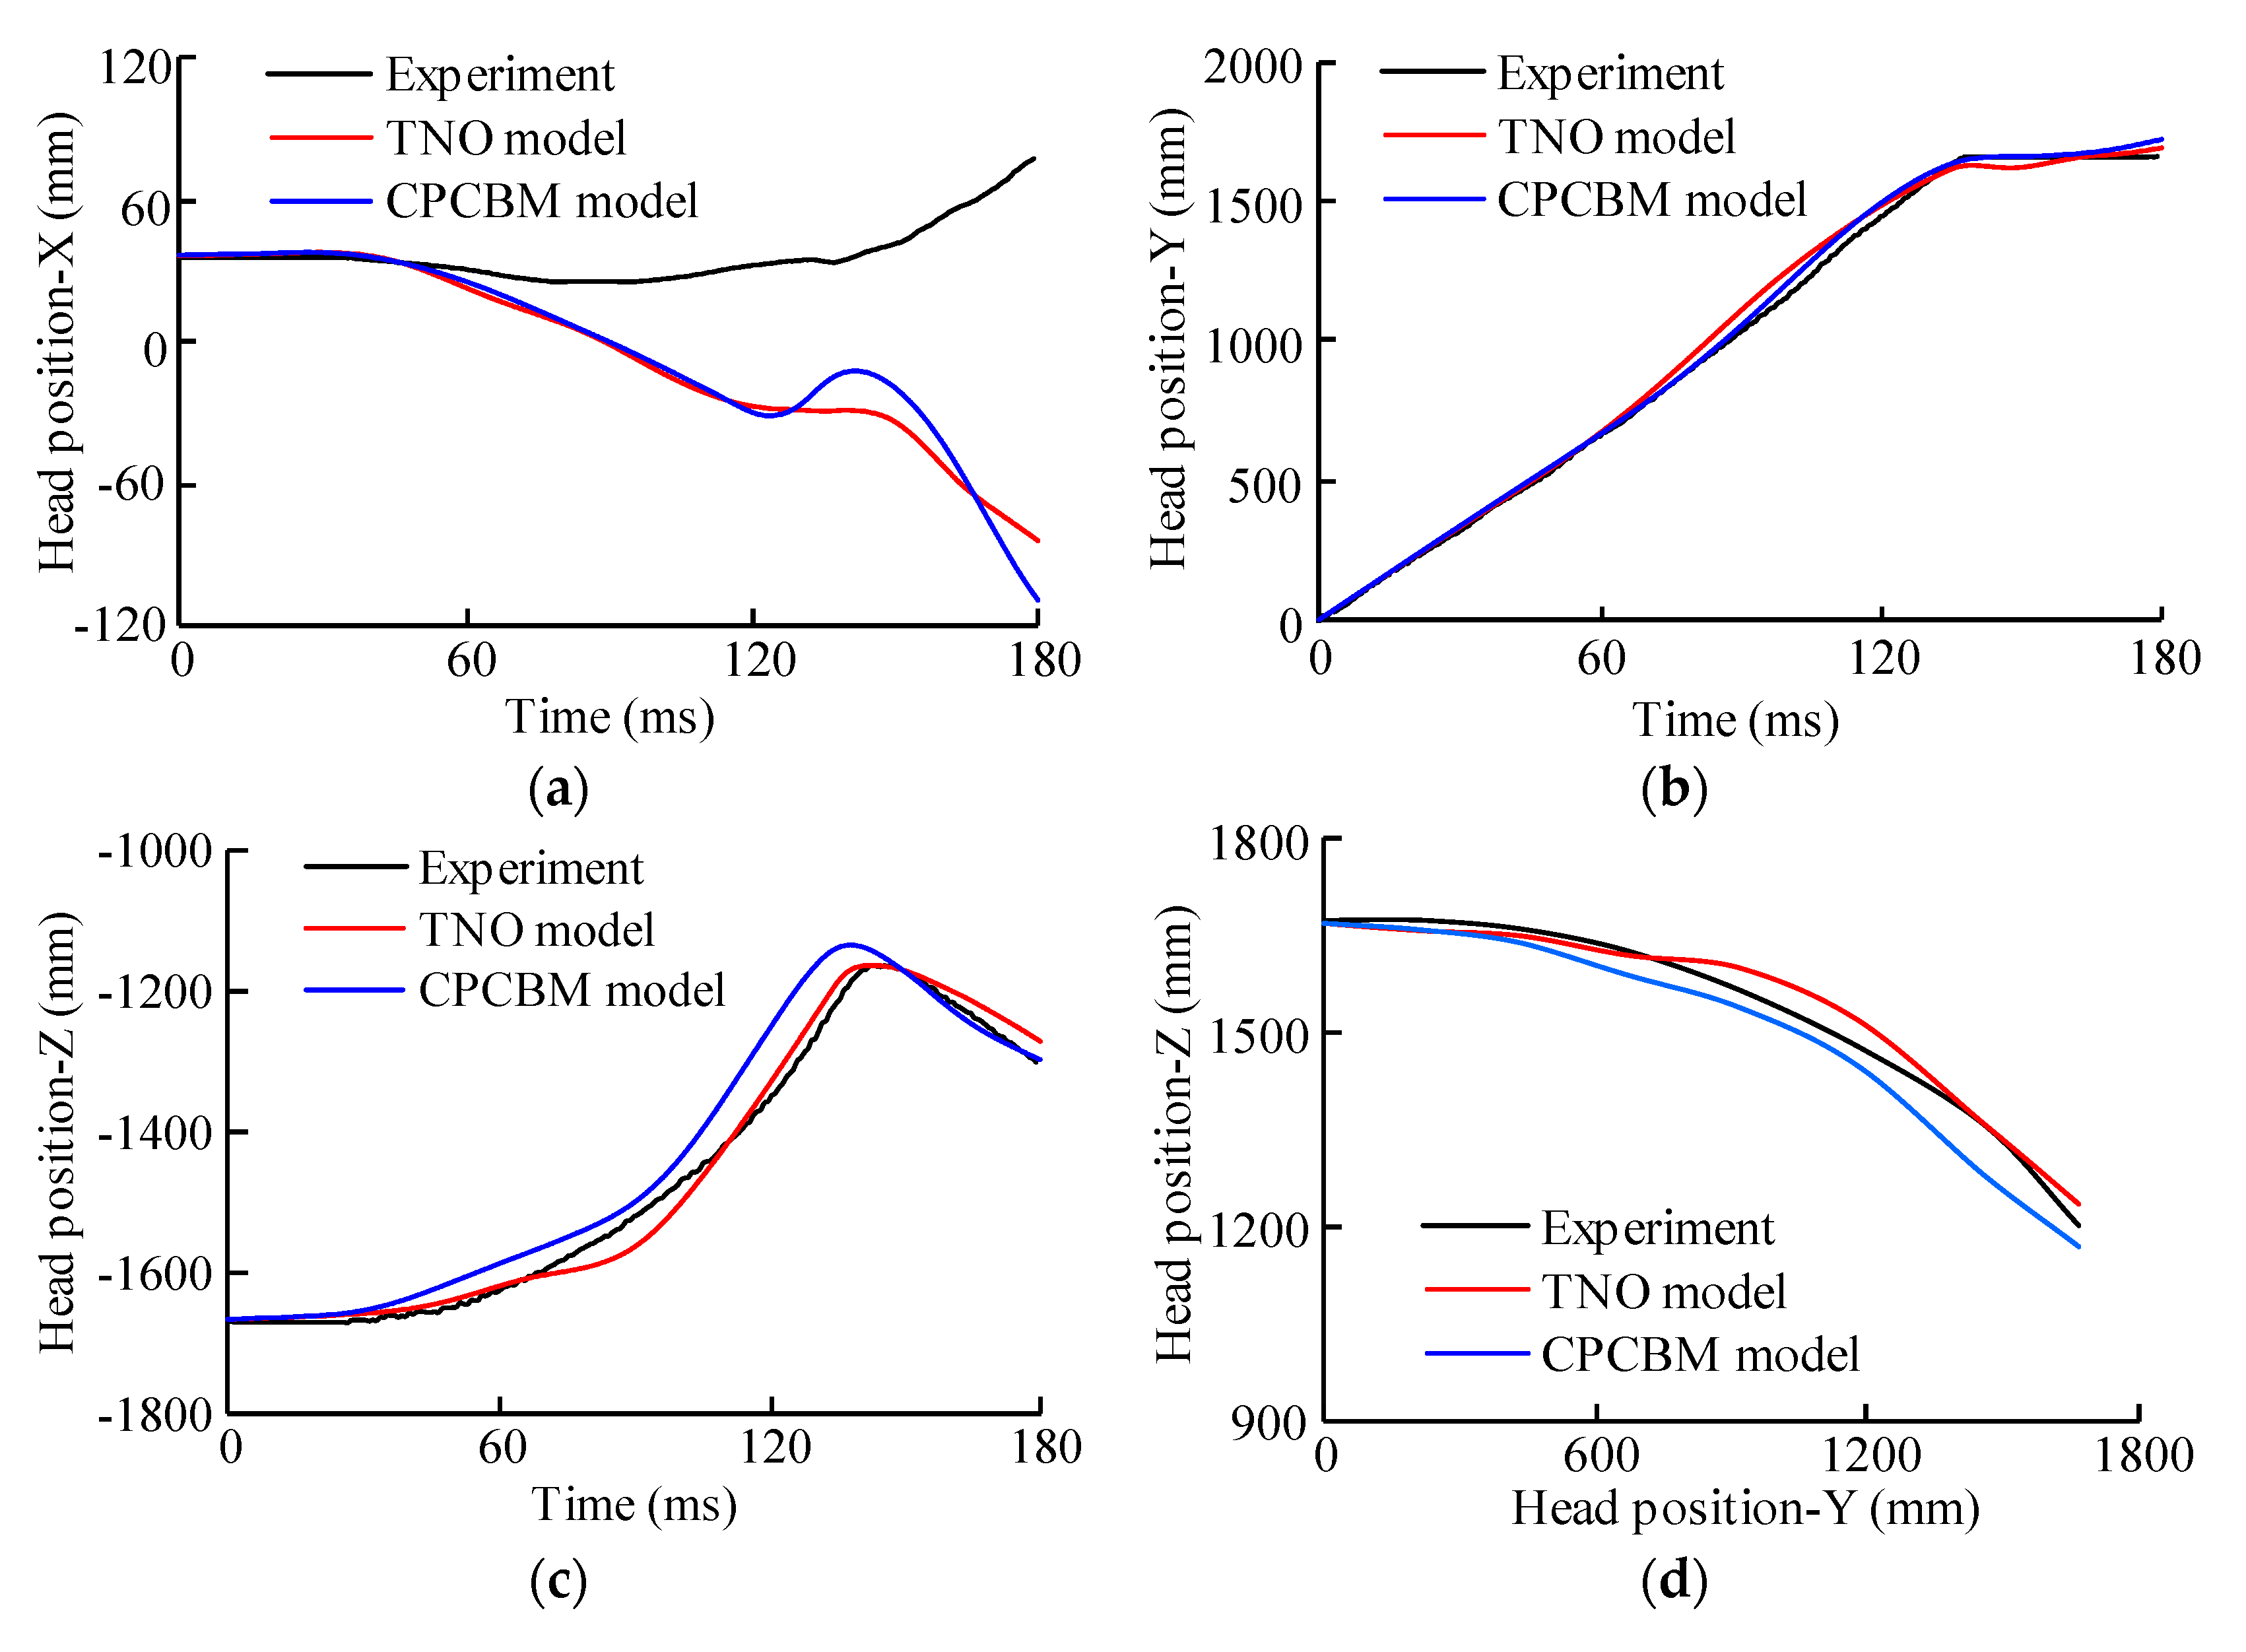
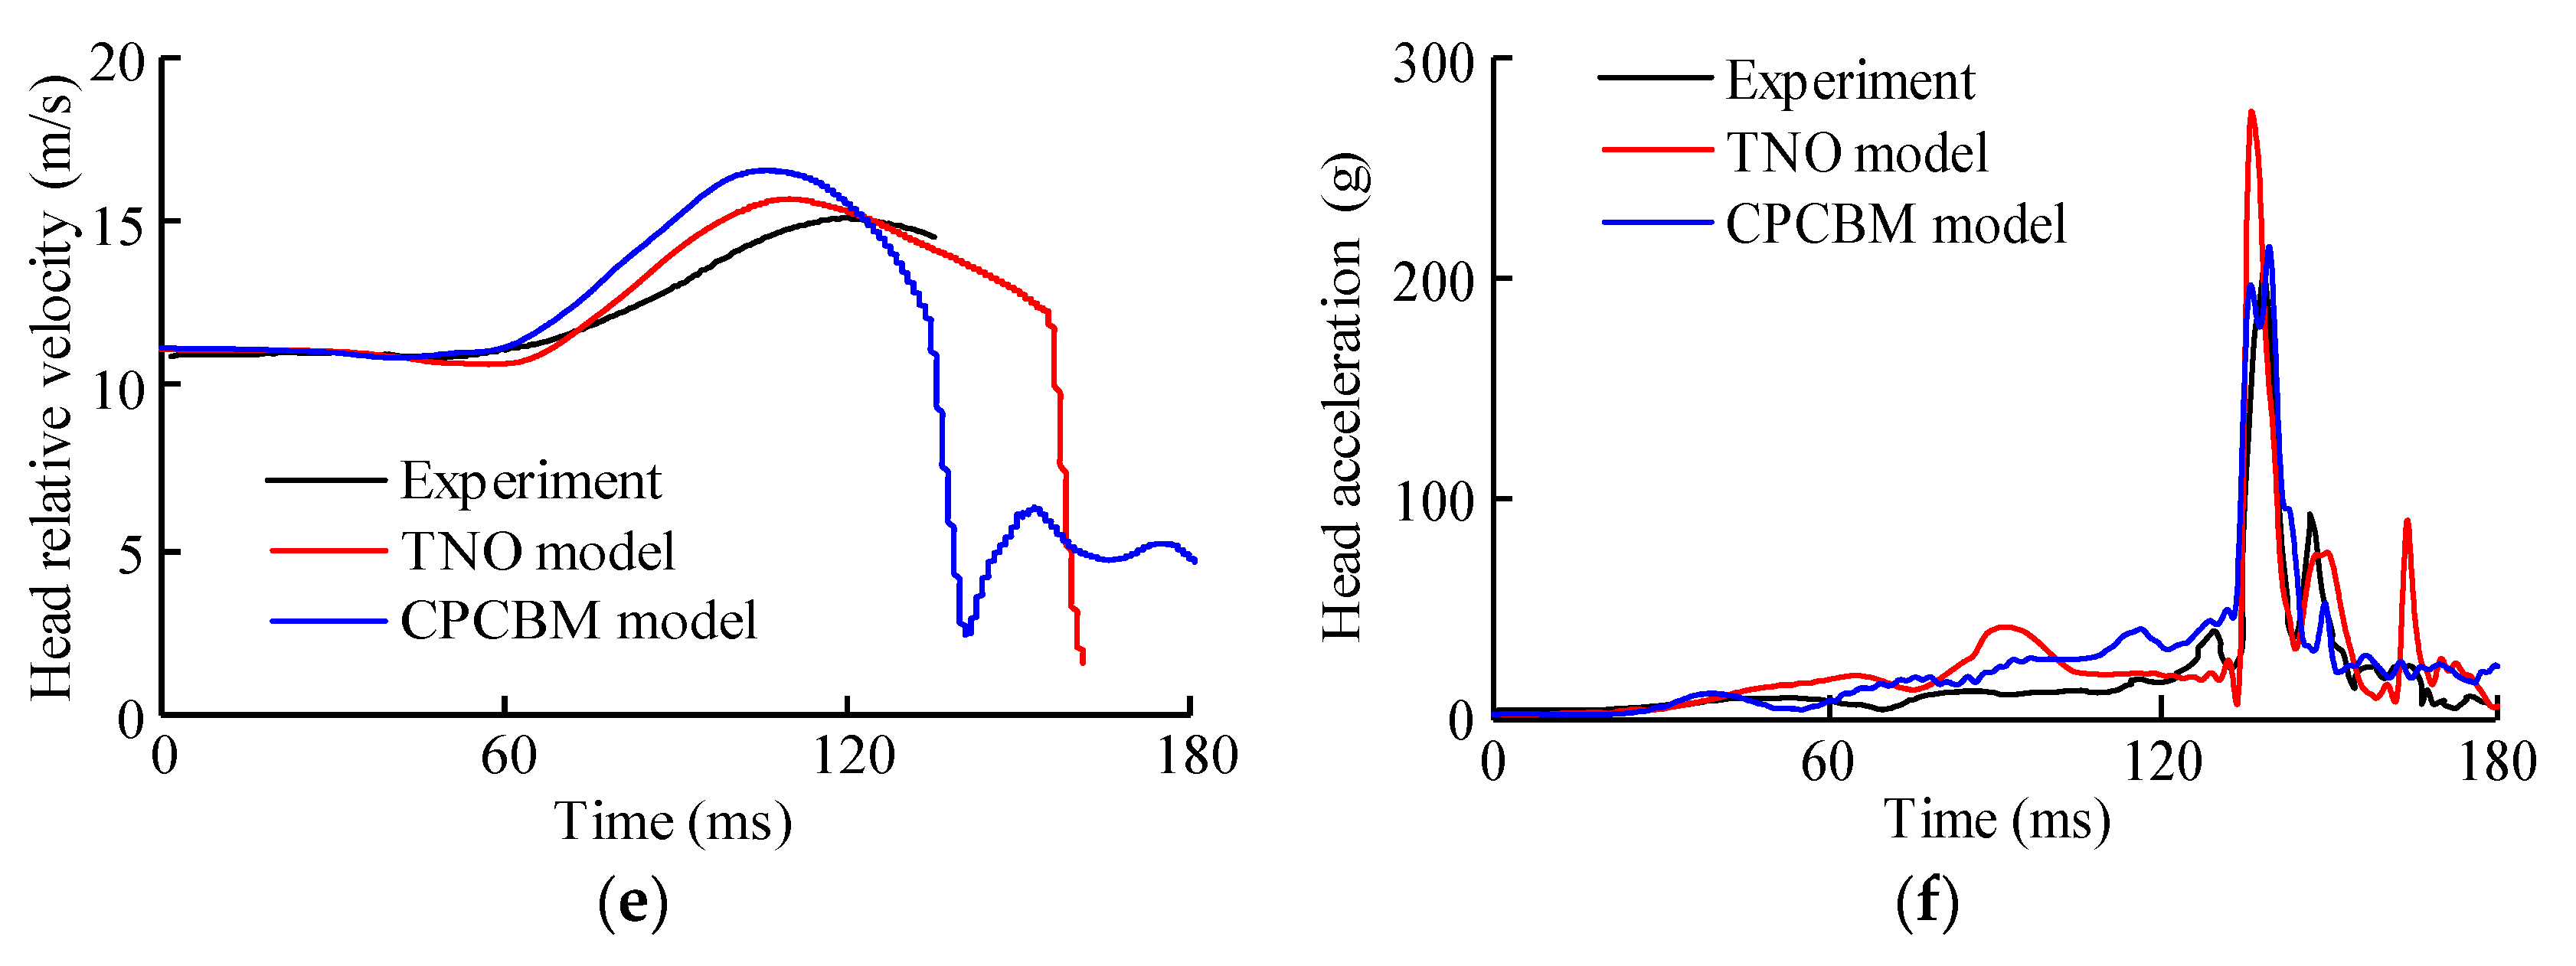
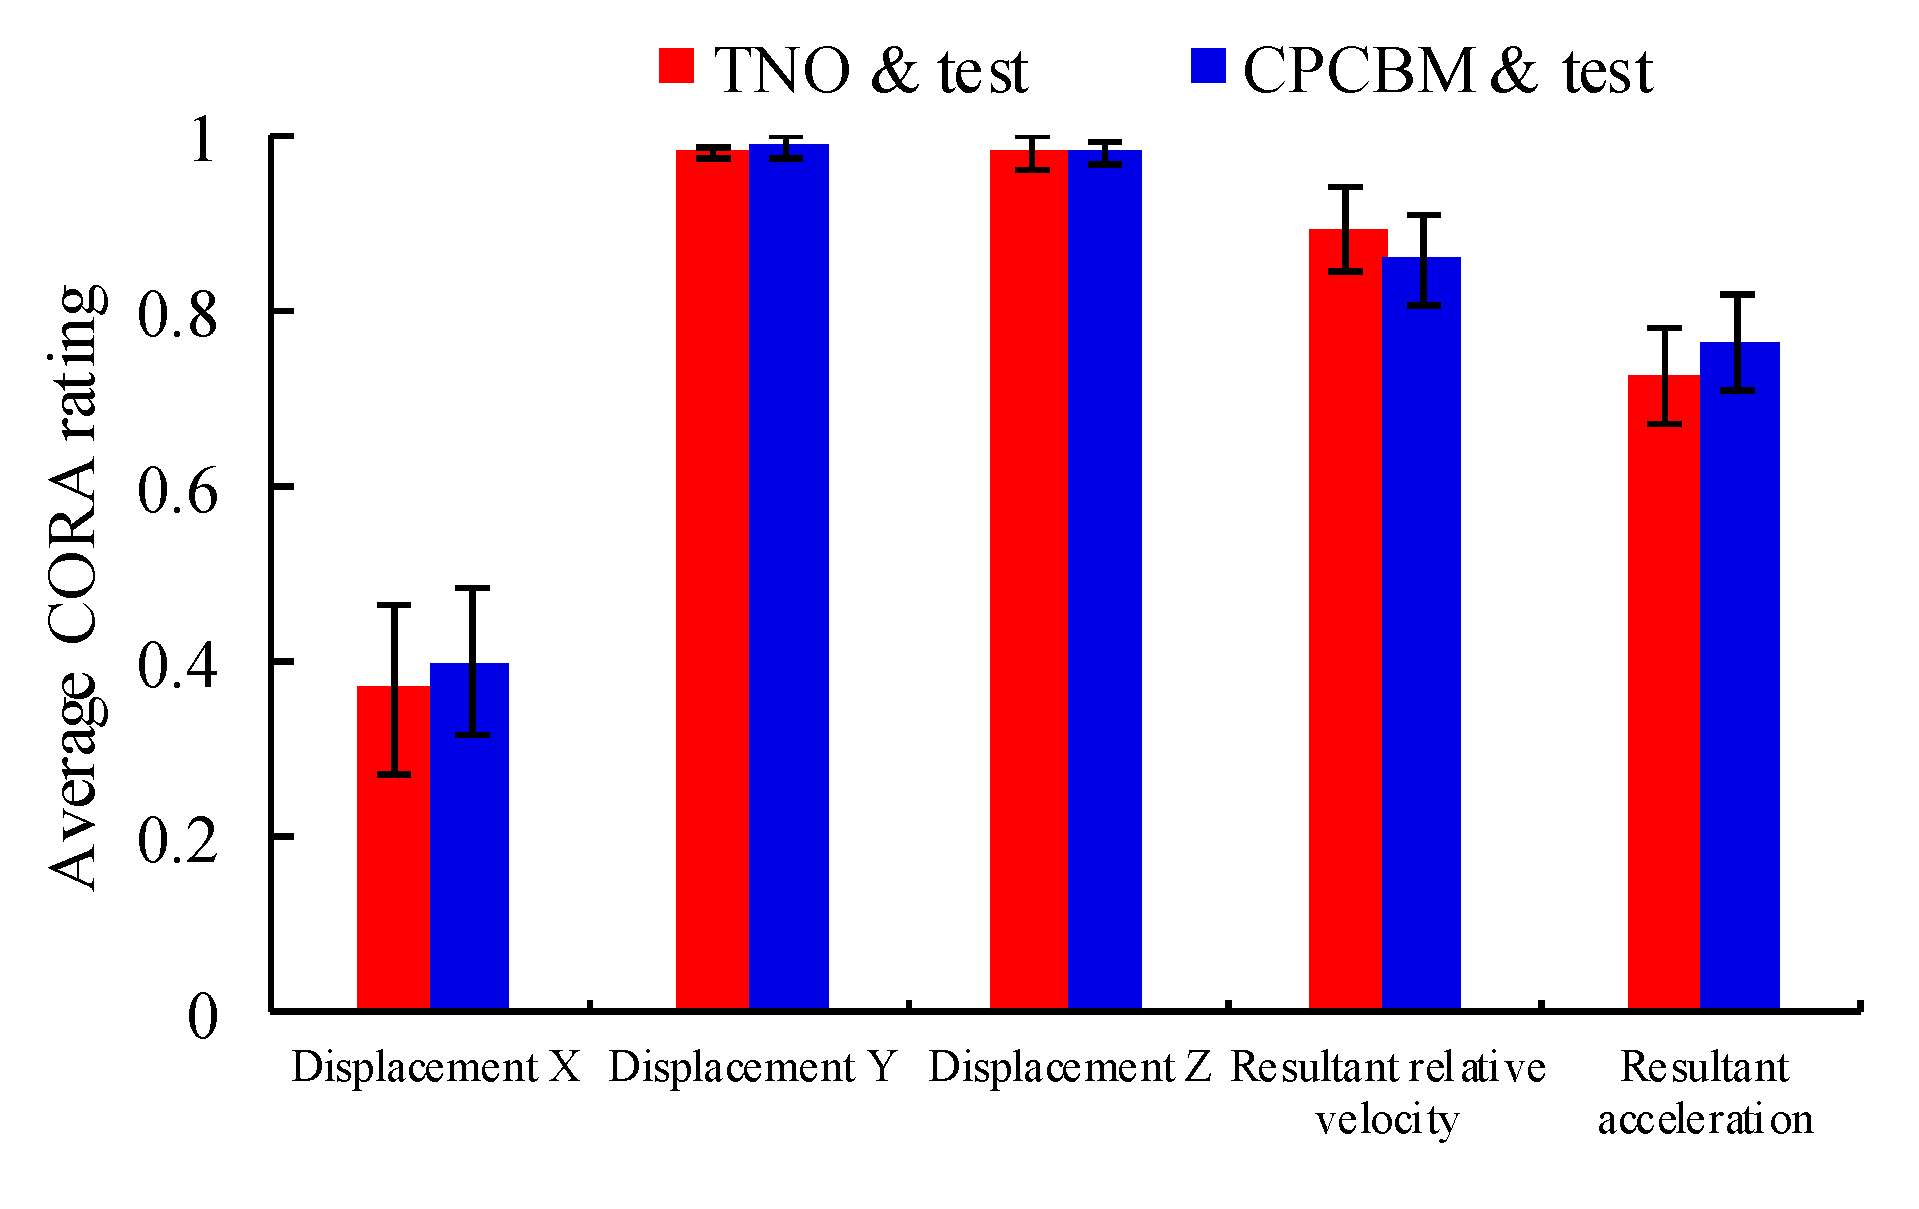
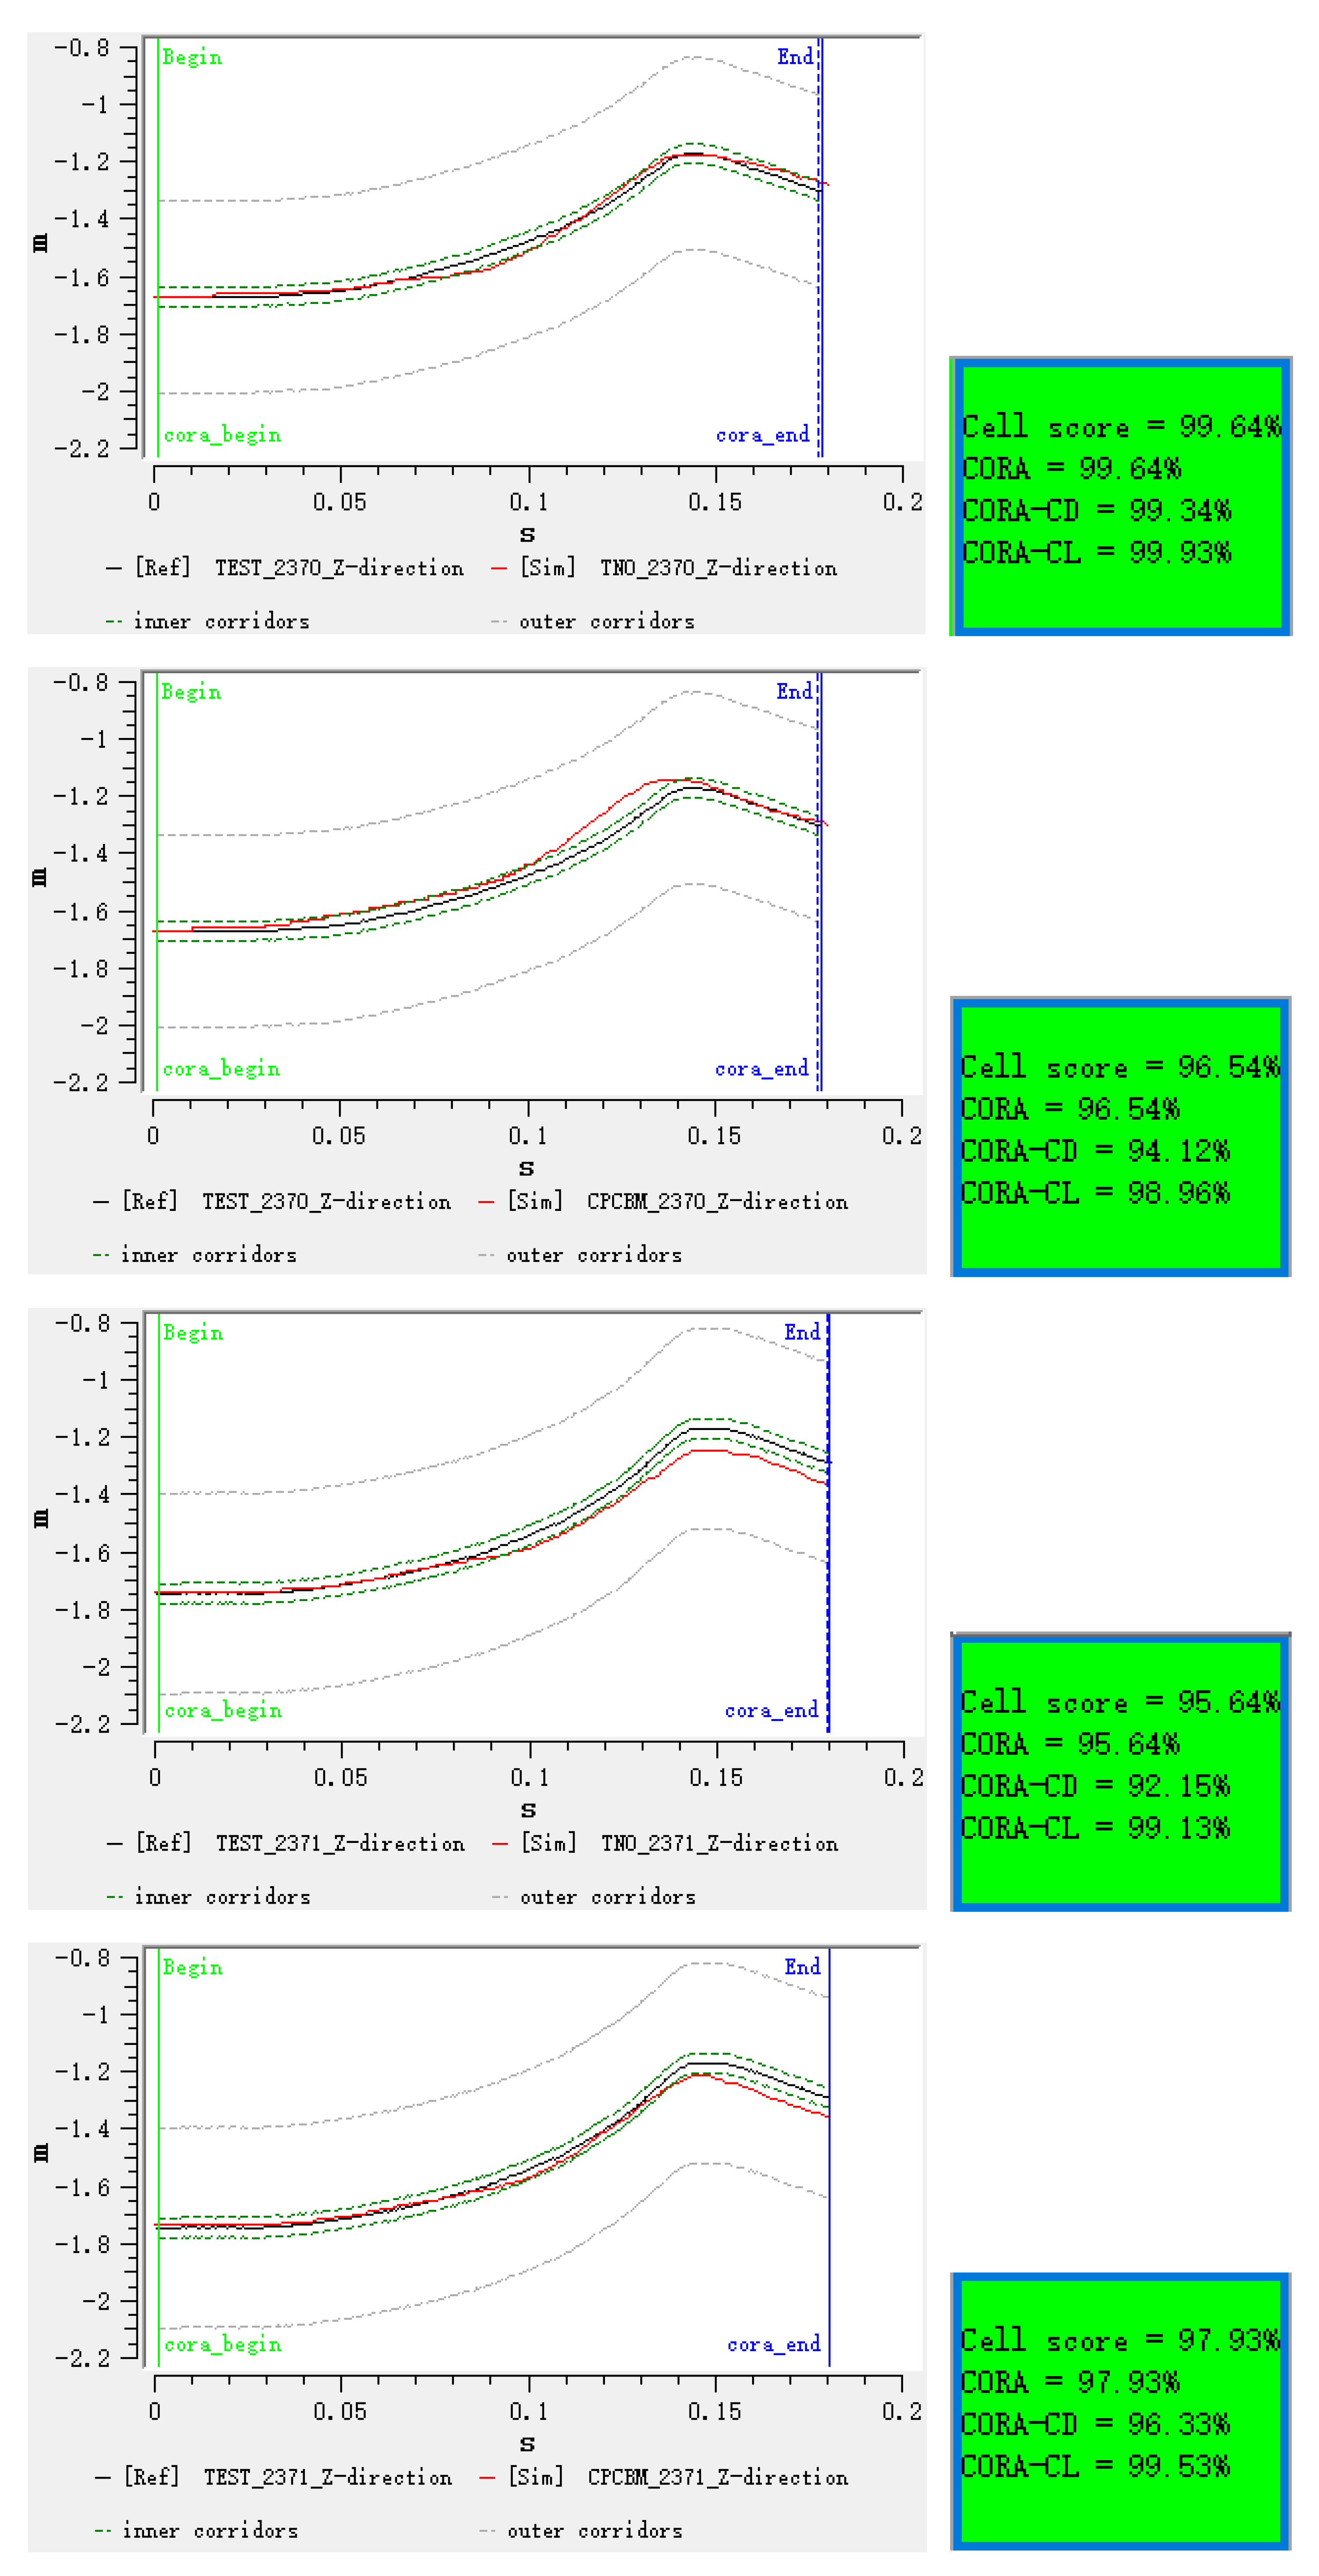
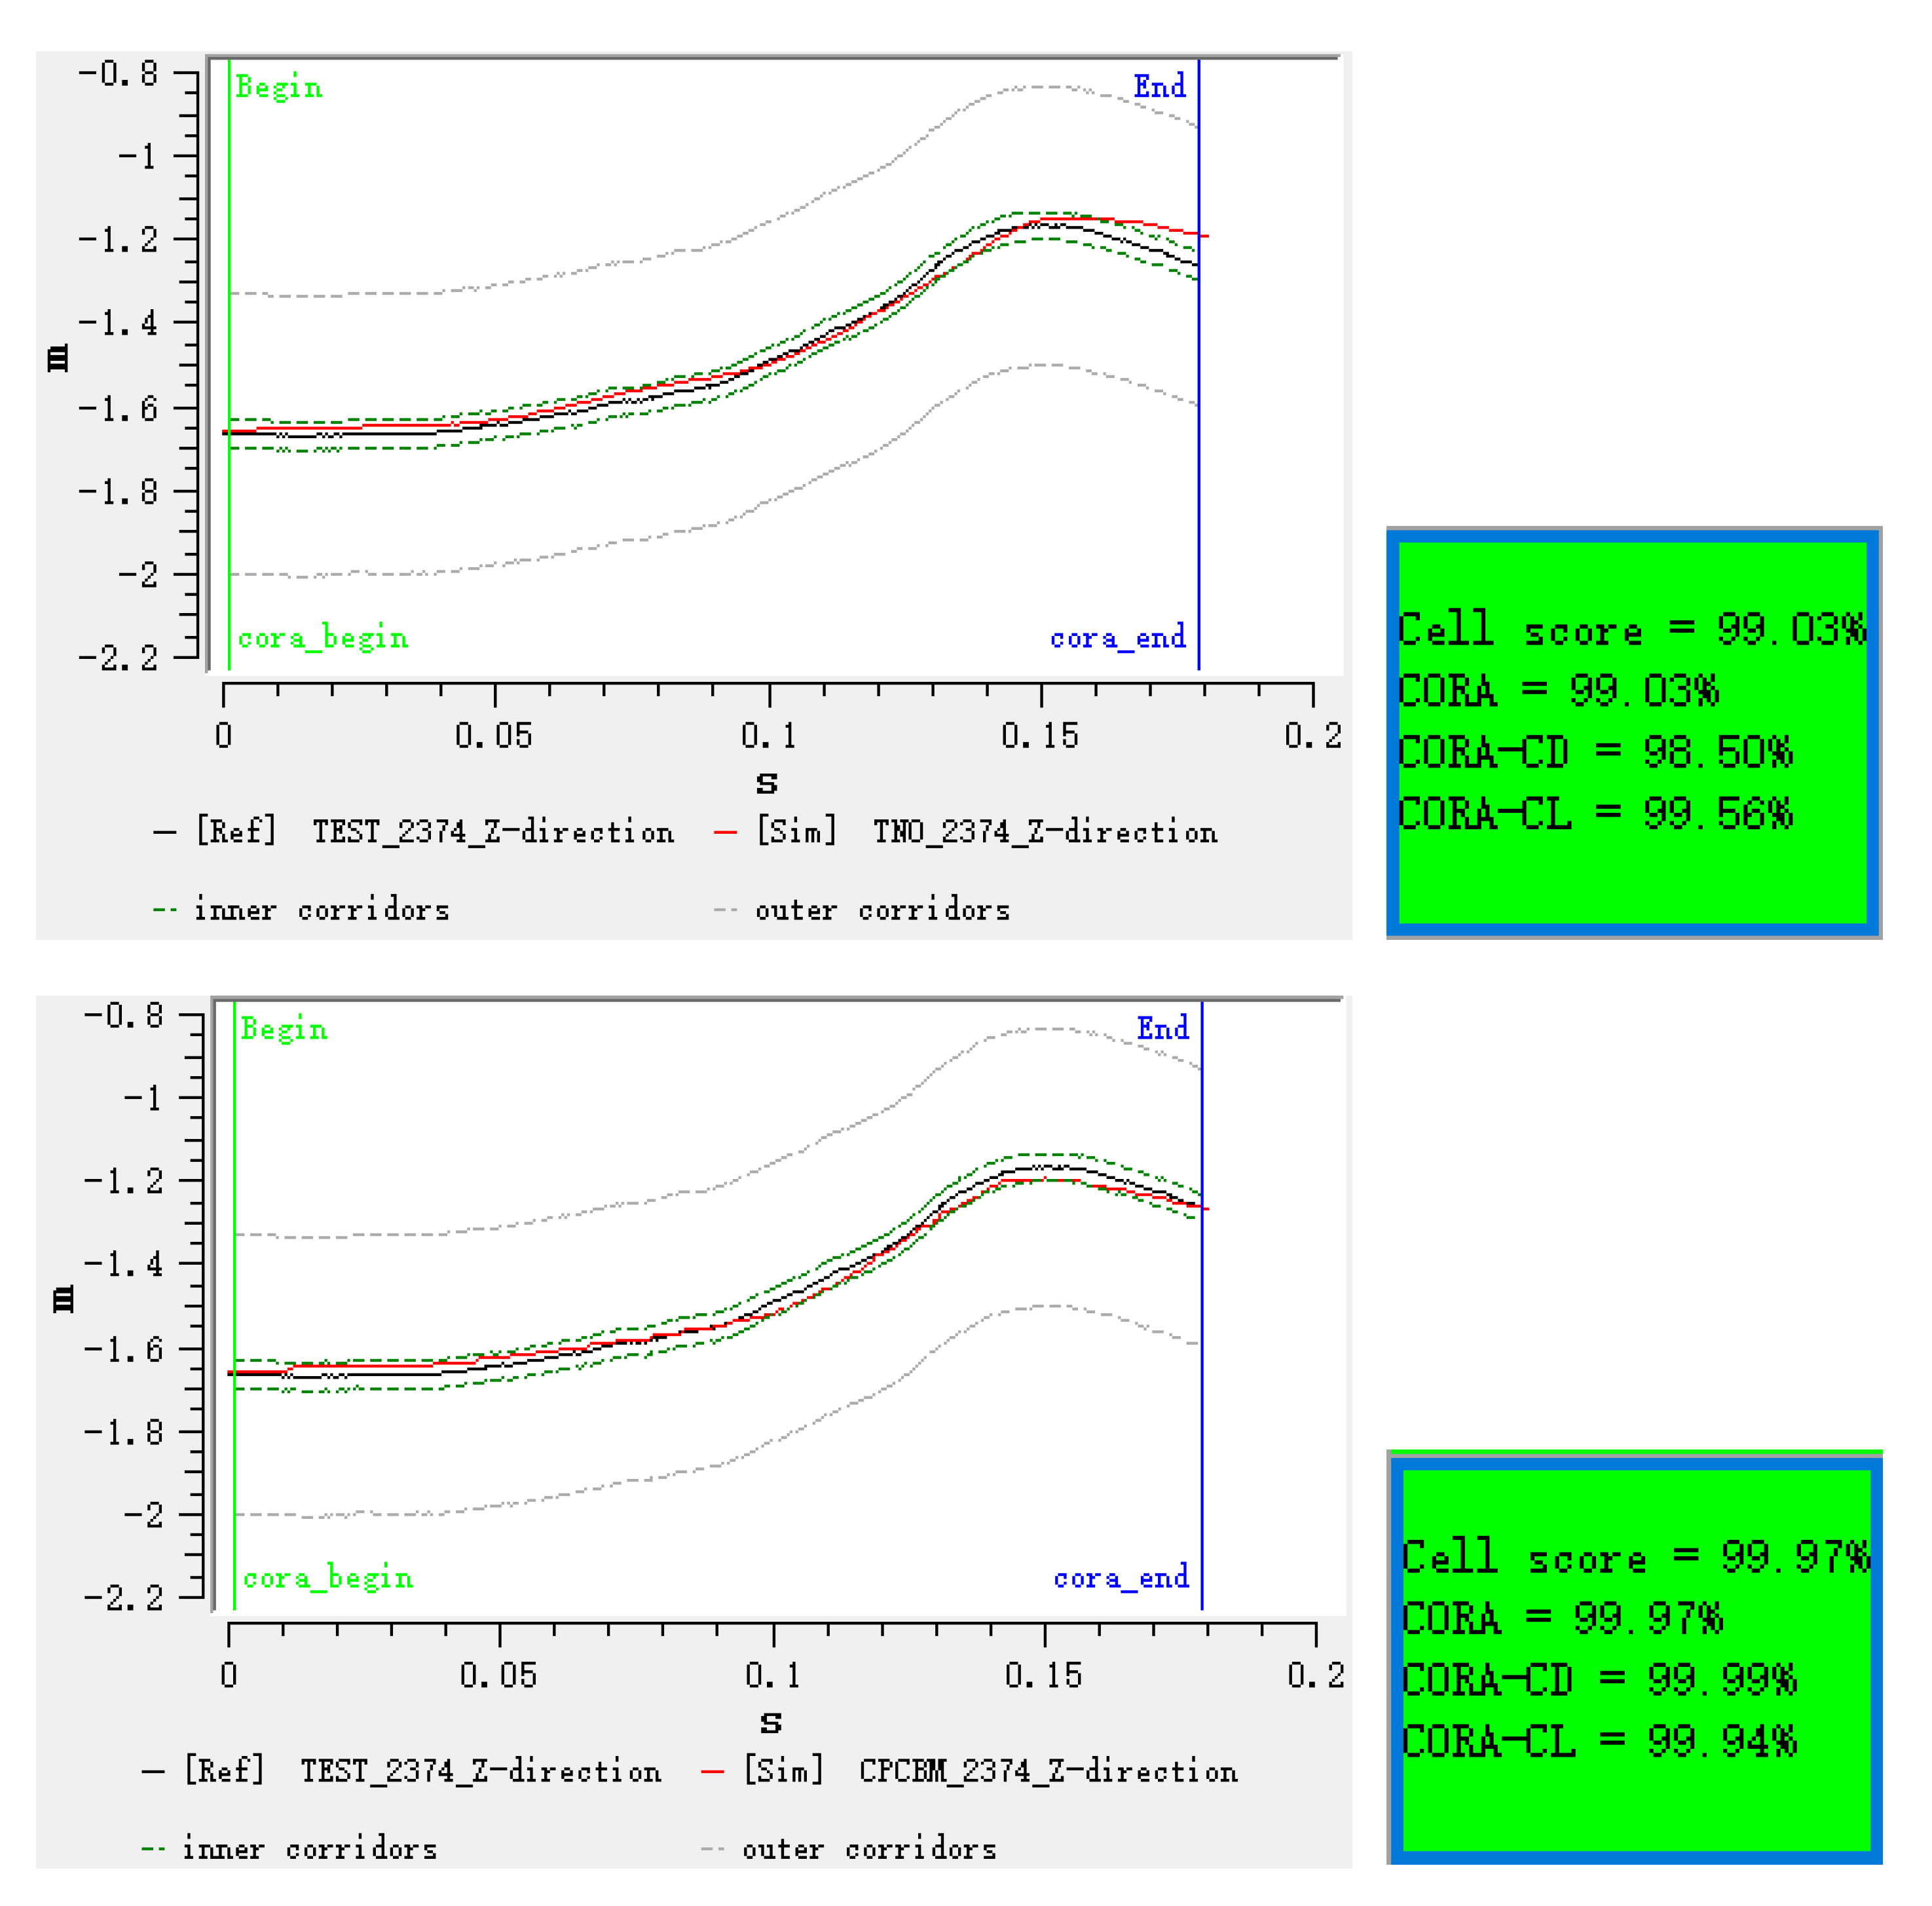
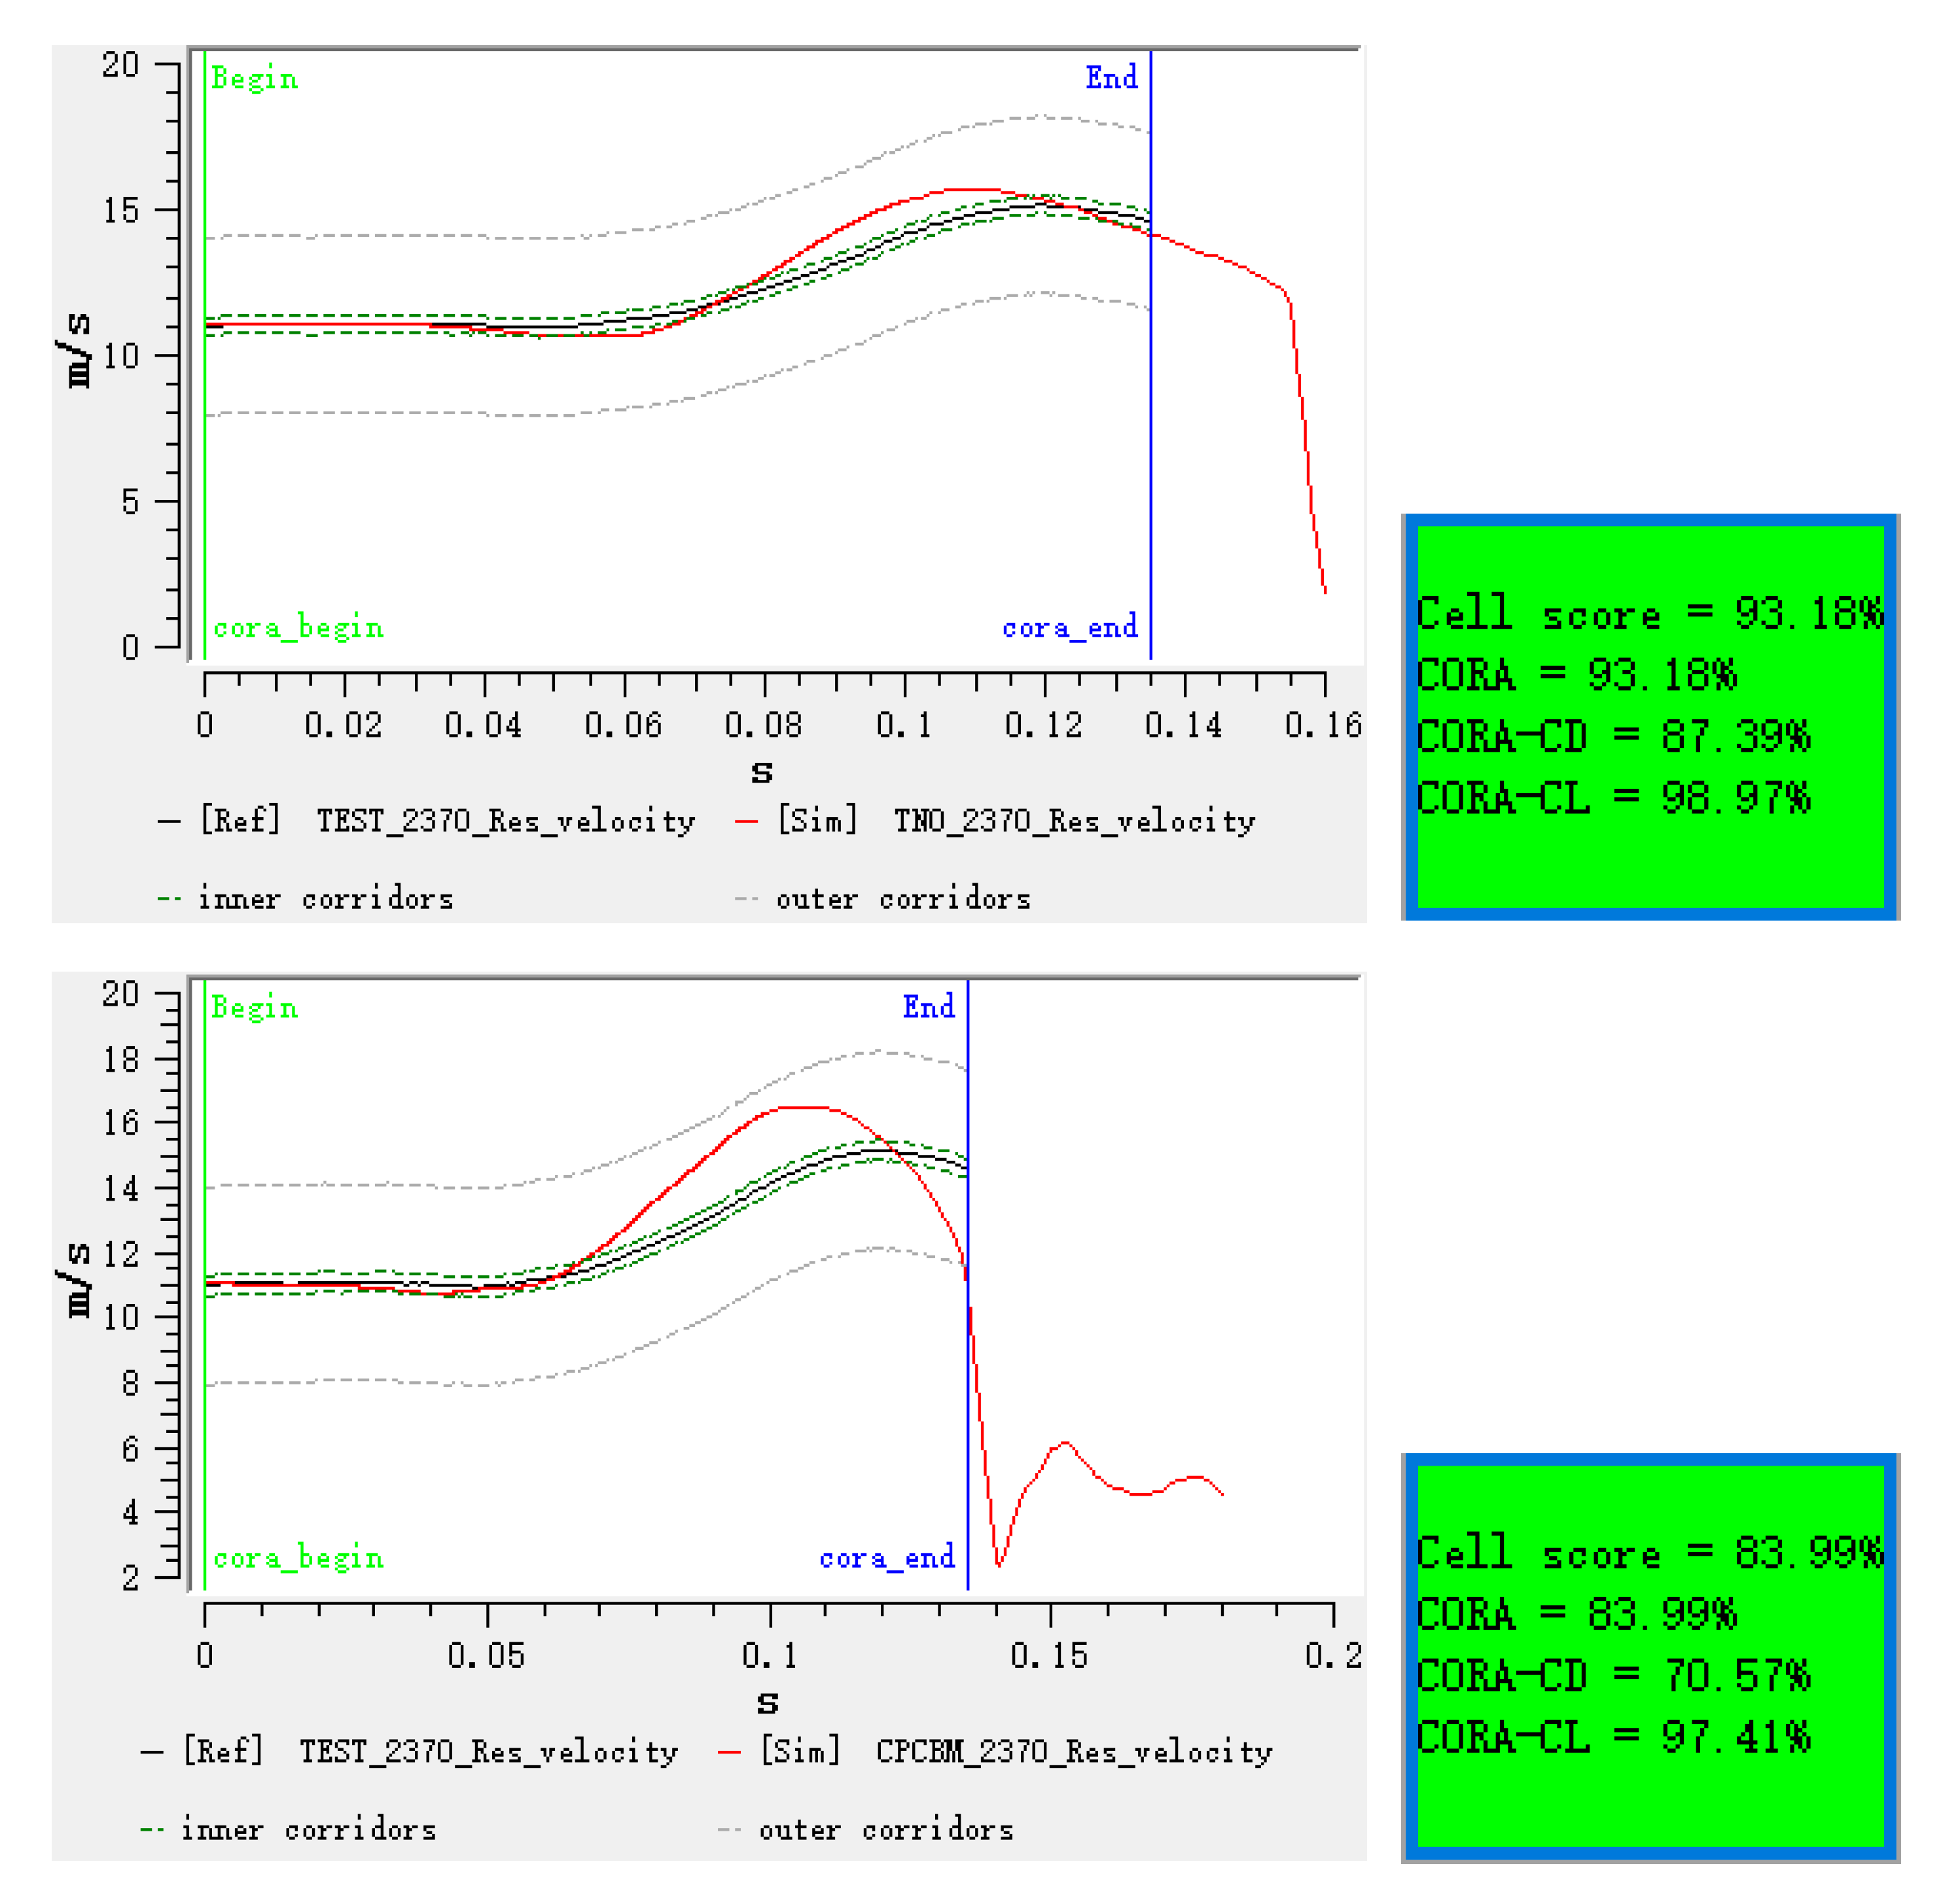
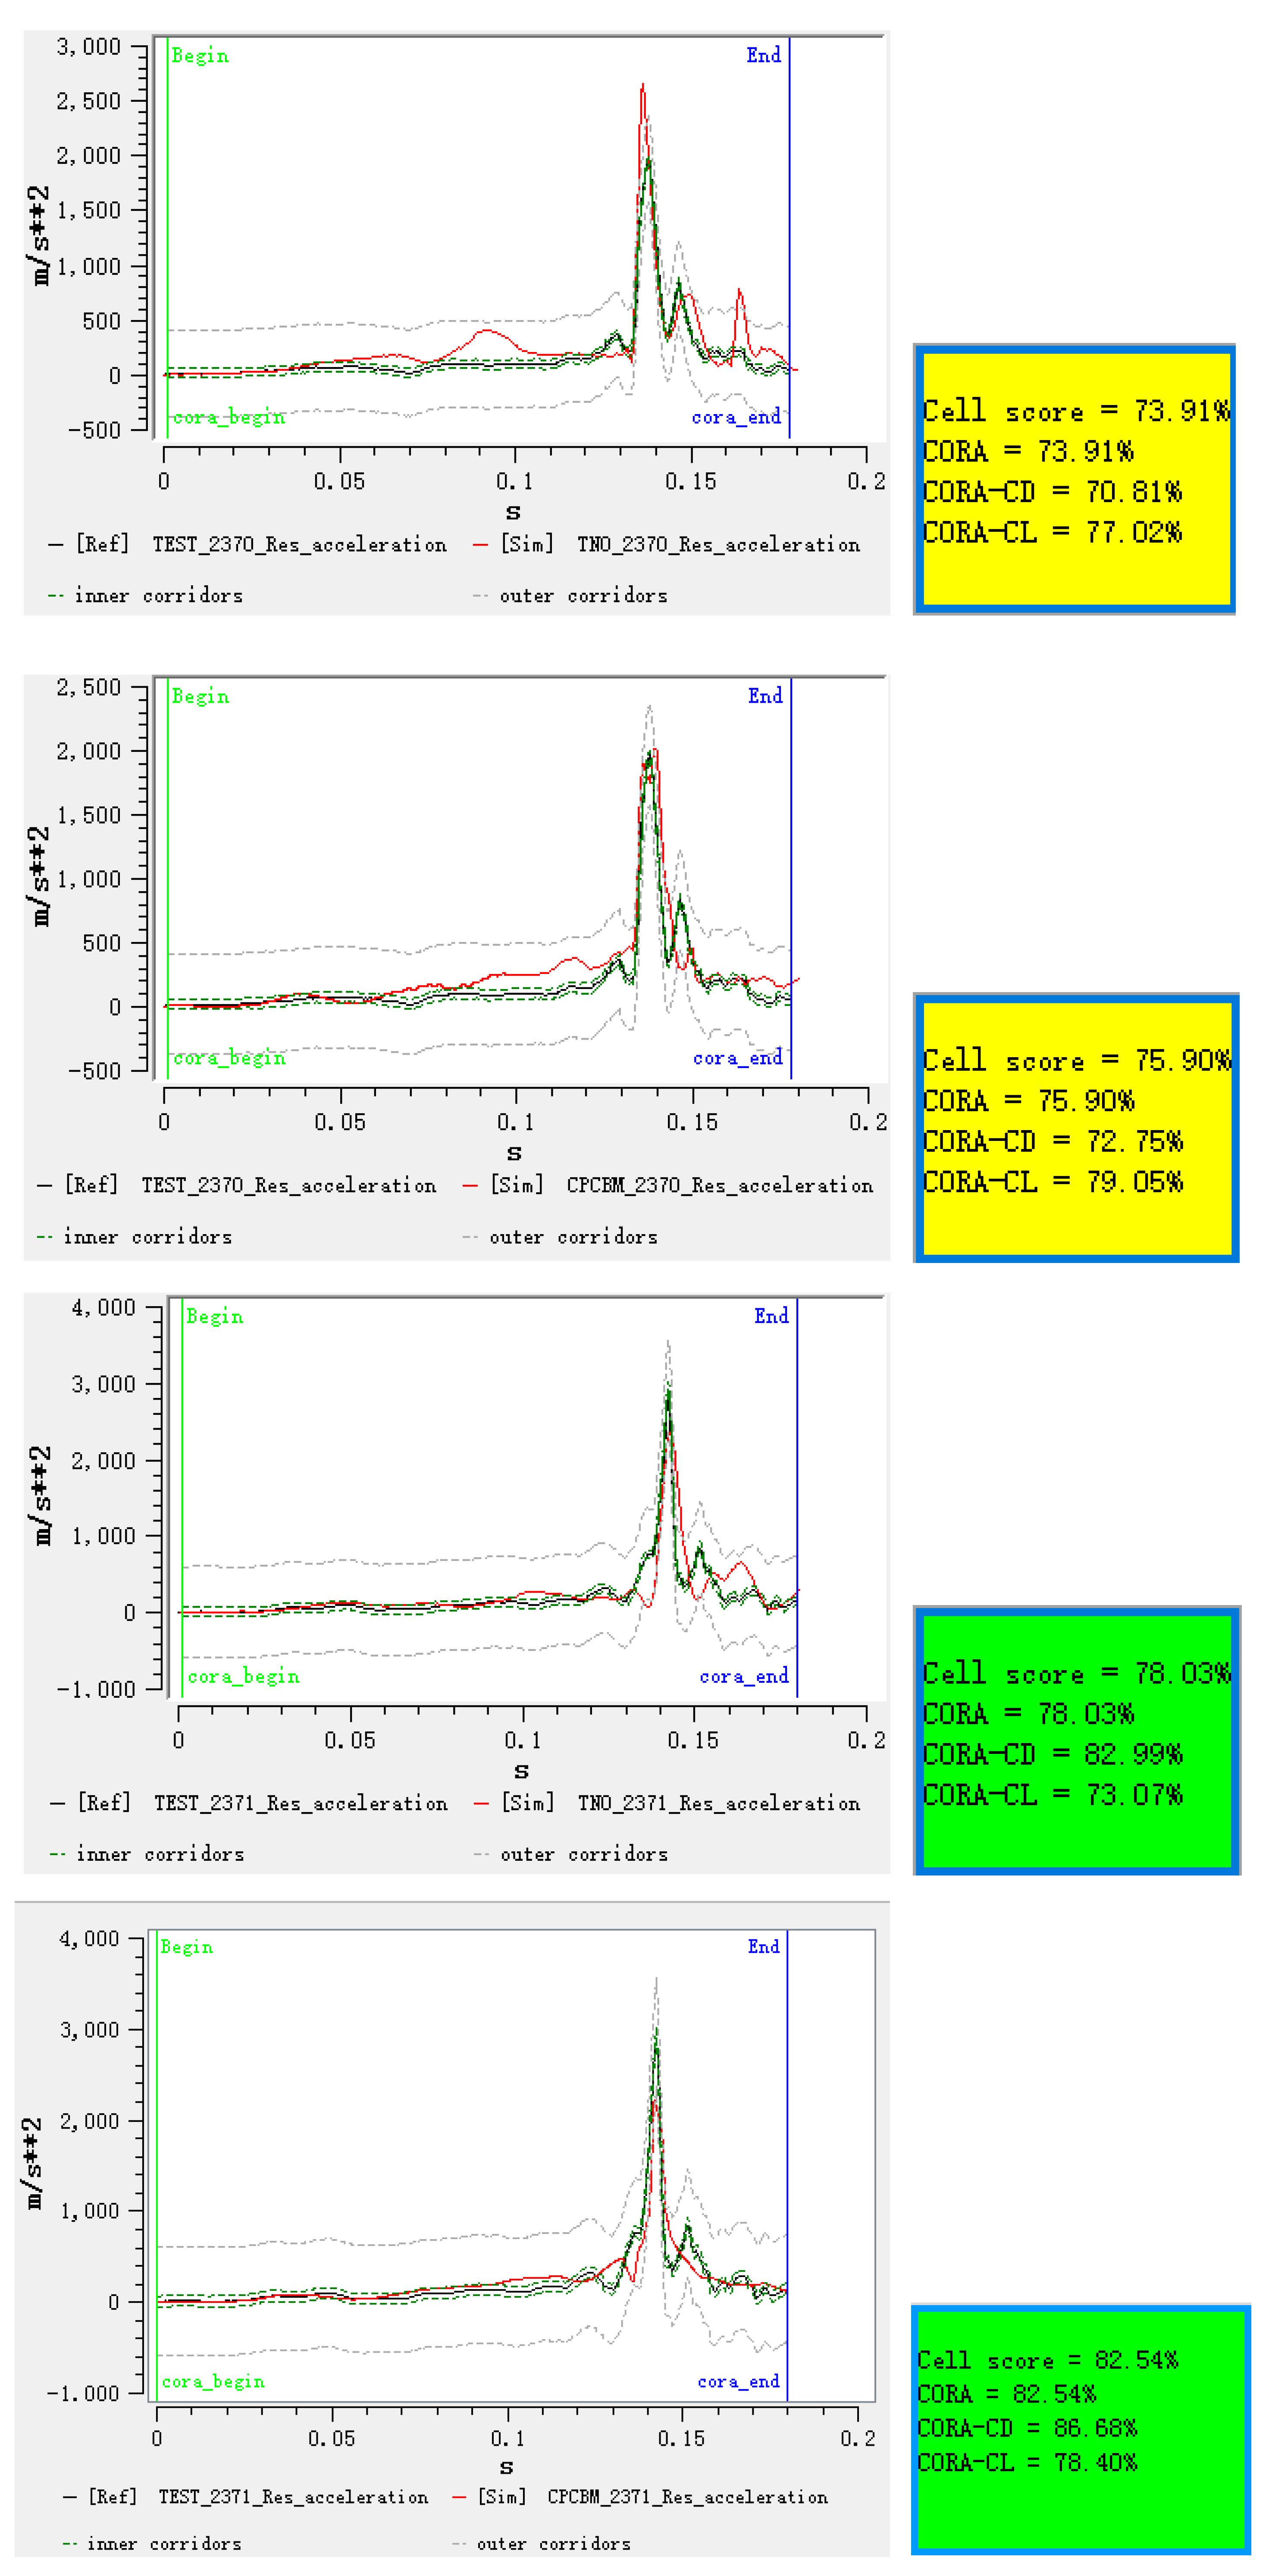
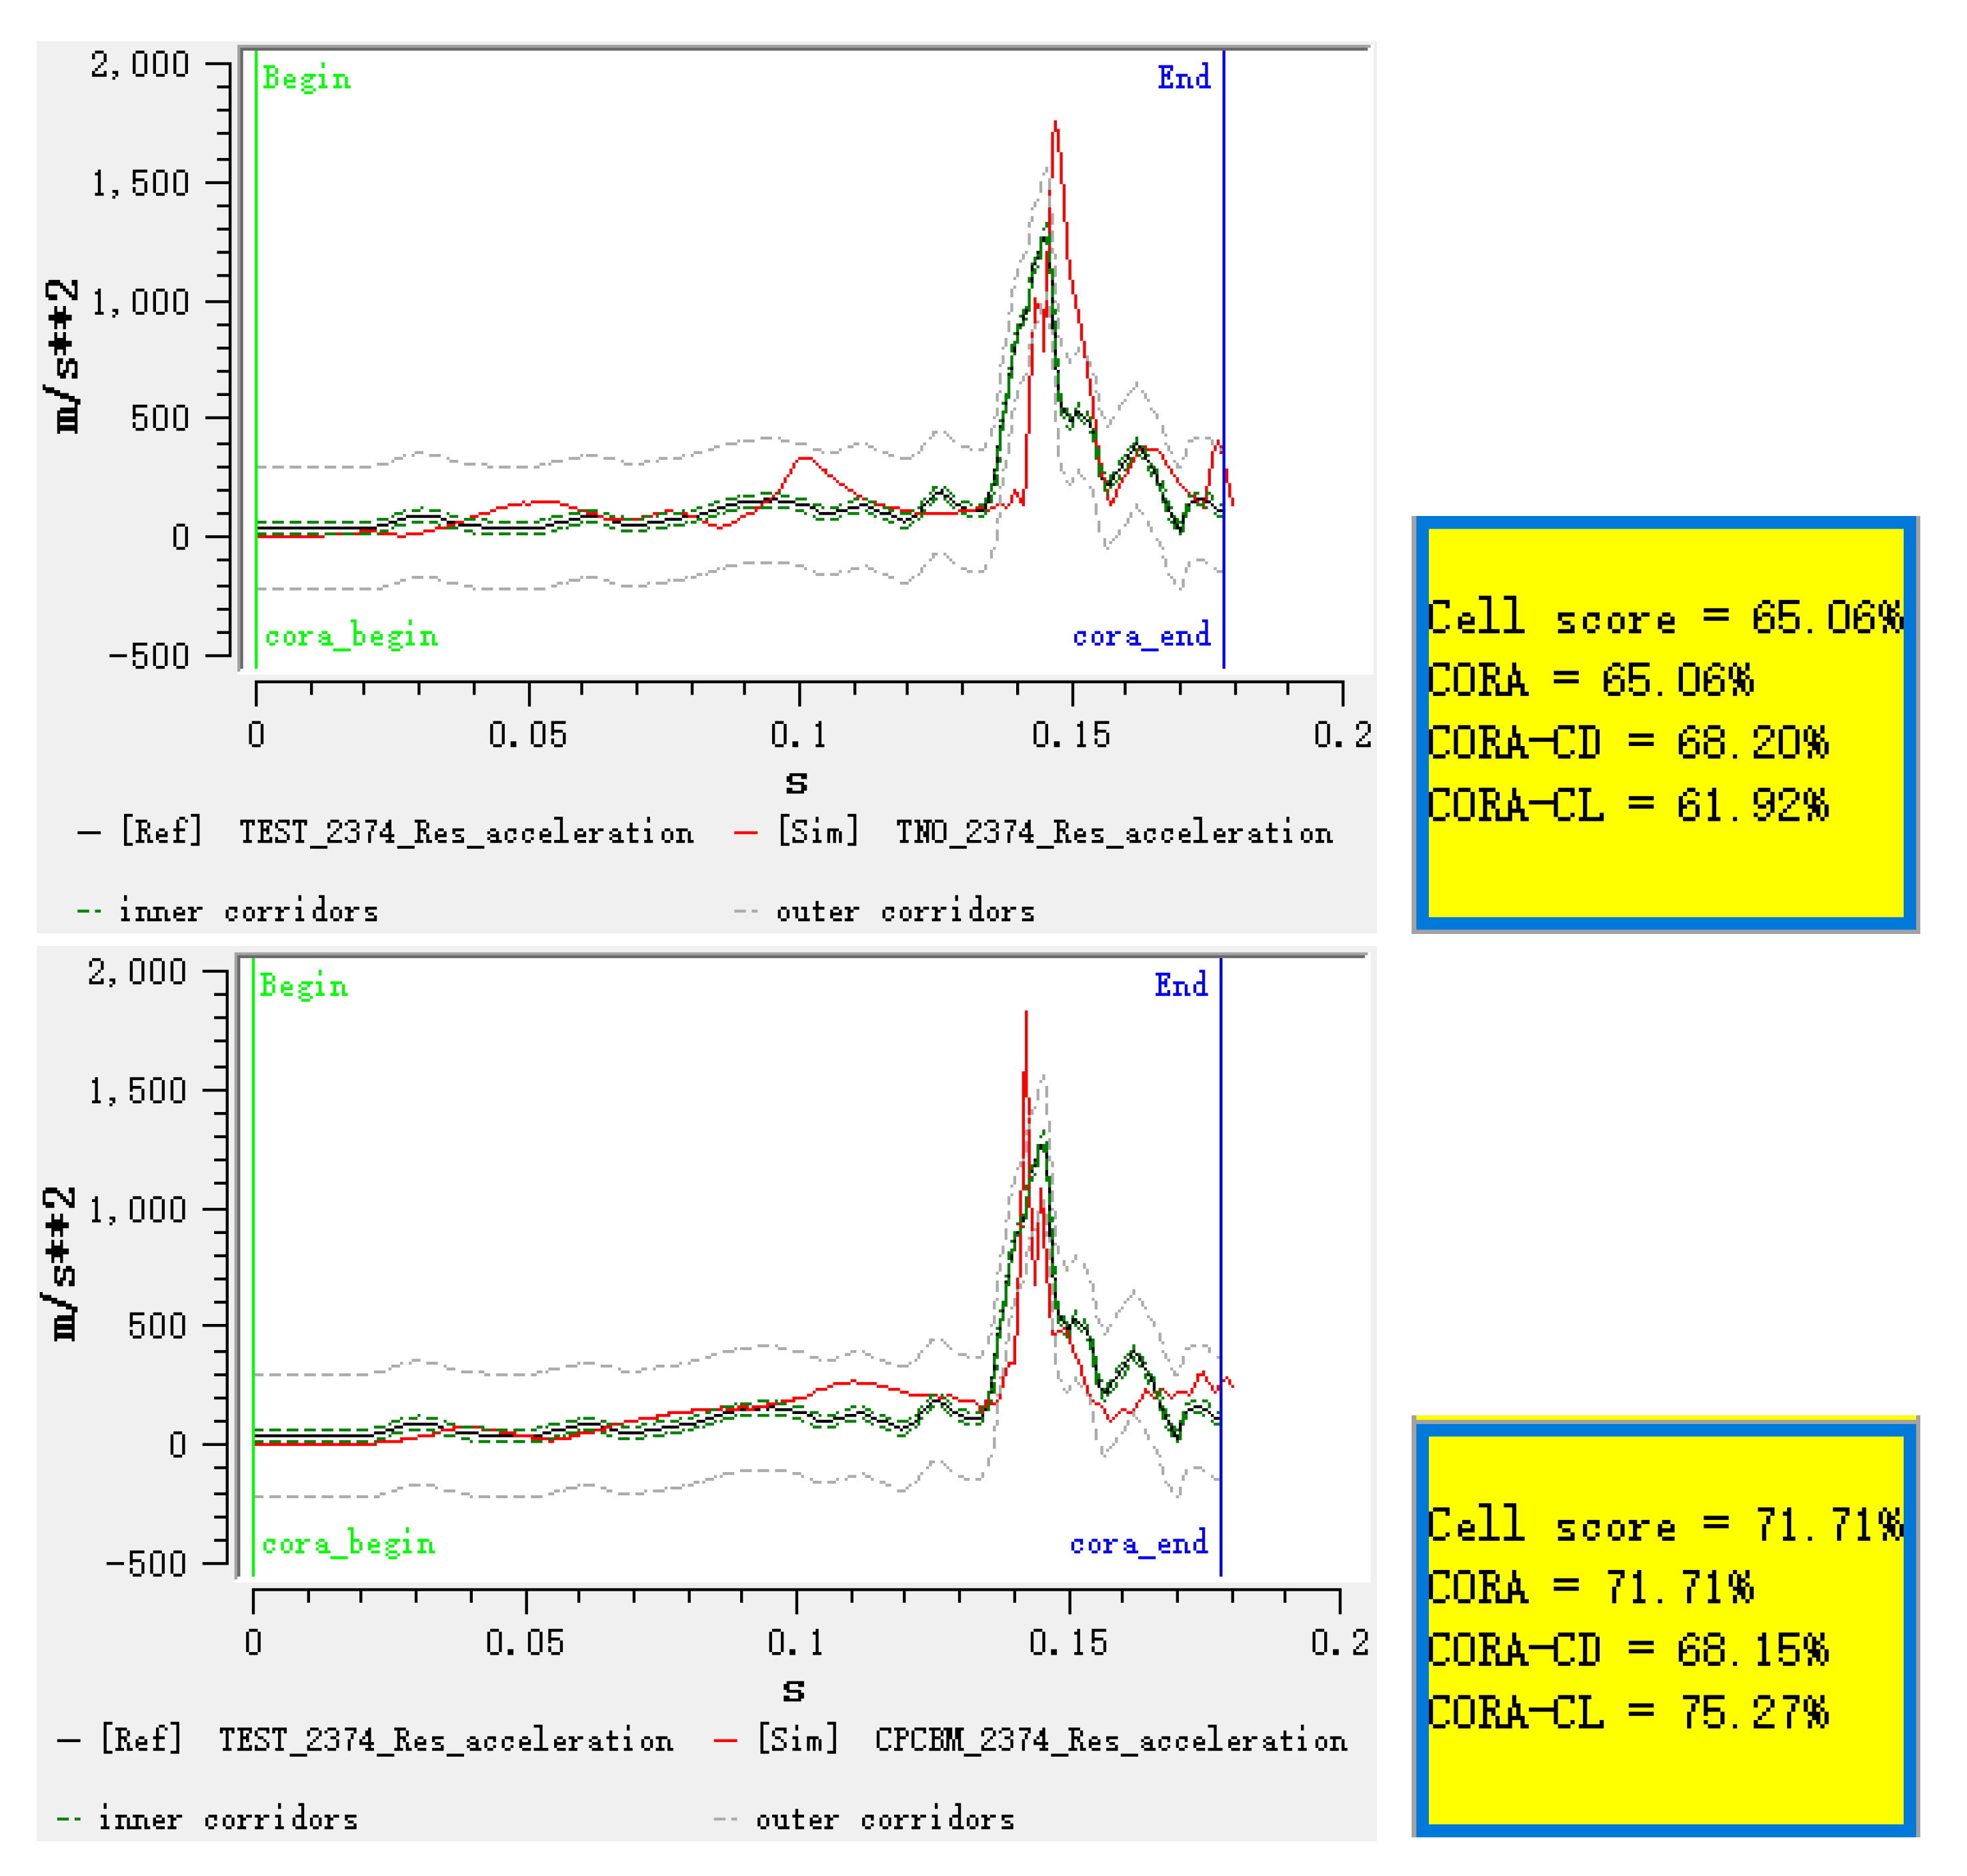
The comparative analysis and the correlation evaluation via the CORA method indicate that the CPCBM can reasonably predict the head center of gravity (COG) kinematics and injury response of the pedestrian due to car impact in the impact direction. The predicted trajectories in the impact direction (YOZ plane) strongly agree with the experimental results (CORA ratings: Y = 0.99 ± 0.01; Z = 0.98 ± 0.01); the resultant velocity relative to the impact buck correlates well with the test data (CORA ratings: 0.85 ± 0.05); however, the correlation of the acceleration is less strong (CORA ratings: 0.747 ± 0.06).
(2)
The CPCBM performed quite similarly to the full-scale TNO multibody pedestrian model in predicting the head COG kinematics and injury response of the tested subjects, which means the CPCBM carried over the pedestrian kinematics prediction performance of the TNO model that has been already widely verified, despite the replacement of the head–neck complex with the FE model.
(3)
Compared to the full-scale THUMS model, the CPCBM showed a remarkable advantage in the time efficiency of the scaling, posture adjustment, and impact simulation computation when used to calculate the pedestrian brain tissue level injury during a complex accident, which suggests that the CPCBM may serve as an efficient tool for pedestrian head/brain injury research due to car impact.

Author Contributions

Conceptualization, F.W.; Data curation, G.L.; formal analysis, C.Y.; investigation, F.L.; methodology, B.W.; resources, G.L.; supervision, F.W.; visualization, F.L.; writing – original draft, C.Y.; writing – review & editing, F.W. All authors have read and agreed to the published version of the manuscript.

Funding

This research was funded by the National Natural Science Foundation of China, grant numbers 51605407, 51805162.

Acknowledgments

Chao Yu would like to thank Arcady Dyskin from the University of Western Australia (UWA) for making language corrections.

Conflicts of Interest

The authors declare no conflict of interest.

Appendix A. Generic Sedan Buck Model

The outlines of the multibody generic sedan buck were extracted from the literature [50], in which detailed parameters and stiffness curves of the buck were mentioned. So, we can accurately reproduce the buck with rigid bodies that used in the PMHS tests (Figure A1). Additionally, a simplified finite element windshield model matched the stress–strain curve from the work is also coupled with the multibody buck. The finite element windshield model is shown in Figure A2. The multibody impact buck model used in this work includes bumper lower and bumper, grille, hood edge and hood, and windshield. The finite element windshield model consists of about 54,000 nodes and 58,000 elements, and the element size is 5 mm. The force-displacement characteristics of multibody components and material properties of the FE windshield model are all from the literature [50].
Figure A1. Schematic diagram of the structure of the generic sedan buck, modified from [50].
Ijerph 17 00492 g0a1
Figure A2. Schematic diagram of the simplified finite element windshield model.
Ijerph 17 00492 g0a2

Appendix B. Still Captures

Figure A3, Figure A4, Figure A5 and Figure A6 show still captures from the posterior and superior view. The PMHS motion captured by high-speed video cameras (grayscale) are compared to the TNO model and CPCBM respectively. In the motion comparison, the first frame is the frame of leg contact and final frame is t = 200 ms.
Figure A3. Motion responses of PMHS, the TNO model (gold color), and CPCBM (mixed color) for test V2371 (posterior view) [17].
Ijerph 17 00492 g0a3
Figure A4. Motion responses of PMHS, the TNO model (gold color), and CPCBM (mixed color) for test V2371 (superior view) [17].
Ijerph 17 00492 g0a4
Figure A5. Motion responses of PMHS, the TNO model (gold color), and CPCBM (mixed color) for test V2374 (posterior view) [17].
Ijerph 17 00492 g0a5
Figure A6. Motion responses of PMHS, the TNO model (gold color), and CPCBM (mixed color) for test V2374 (superior view) [17].
Ijerph 17 00492 g0a6

Appendix C. Trajectories, Displacement, Relative Resultant Velocity, Resultant Acceleration

Figure A7. The trajectory of the head COG in the YOZ plane: (a) test V2371 and (b) test V2374.
Ijerph 17 00492 g0a7
Figure A8. The displacement of the head COG in the X/Y/Z directions for test V2371 (left) and test V2374 (right).
Ijerph 17 00492 g0a8
Figure A9. The resultant velocity of the head COG relative to the sedan buck: (a) test V2371; (b) test V2374.
Ijerph 17 00492 g0a9
Figure A10. The resultant acceleration of the head COG: (a) test V2371; (b) test V2374.
Ijerph 17 00492 g0a10

Appendix D. The Comparison of Anthropometry Parameter

Table A1. Comparison of inertial properties of the head–neck system from the THUMS and TNO models.
ModelsThe THUMS Head-Neck ModelThe TNO Head-Neck Model
Ijerph 17 00492 i001 Ijerph 17 00492 i002
Total mass5.66 kg6.21/6.39/6.3 kg
Moment of inertia of the Head-neck system model for test V2370Ixx = 1.5126 × 10⁻² kg·m2
Iyy = 1.7991 × 10⁻² kg·m2
Izz = 1.0557 × 10⁻² kg·m2
Ixx = 1.7090 × 10⁻² kg·m2
Iyy = 1.8274 × 10⁻² kg·m2
Izz = 1.3113 × 10⁻² kg·m2
Moment of inertia of the Head-neck system model for test V2371Ixx = 2.5004 × 10⁻² kg·m2
Iyy = 2.8844 × 10⁻² kg·m2
Izz = 1.7861 × 10⁻² kg·m2
Moment of inertia of the Head-neck system model for test V2374Ixx = 2.1877 × 10⁻² kg·m2
Iyy = 2.4686 × 10⁻² kg·m2
Izz = 1.6003 × 10⁻² kg·m2

Appendix E. CORA Data

Figure A11. X-direction displacement signals between experiment and simulation.
Ijerph 17 00492 g0a11aIjerph 17 00492 g0a11b
Figure A12. Y-direction displacement signals between experiment and simulation.
Ijerph 17 00492 g0a12aIjerph 17 00492 g0a12b
Figure A13. Z-direction displacement signals between experiment and simulation.
Ijerph 17 00492 g0a13aIjerph 17 00492 g0a13b
Figure A14. Resultant velocity signals relative to the sedan buck between experiment and simulation.
Ijerph 17 00492 g0a14aIjerph 17 00492 g0a14b
Figure A15. Resultant acceleration signals between experiment and simulation.
Ijerph 17 00492 g0a15aIjerph 17 00492 g0a15b

References

  1. WHO. Global Status Report on Road Safety; World Health Organization: Geneva, Switzerland, 2015. [Google Scholar]
  2. Elliott, J.R.; Lyons, M.; Kerrigan, J.; Wood, D.; Simms, C. Predictive capabilities of the MADYMO multibody pedestrian model: Three-dimensional head translation and rotation, head impact time and head impact velocity. J. Multi Body Dyn. 2012, 226, 266–277. [Google Scholar] [CrossRef]
  3. TASS. MADYMO Human Body Models Manual Release 7.5; TASS: Helmand, The Netherlands, 2013; pp. 88–107. [Google Scholar]
  4. Watanabe, R.; Miyazaki, H.; Kitagawa, Y.; Yasuki, T. Research of collision speed dependency of pedestrian head and chest injuries using human FE model (THUMS Version 4). Accid. Reconstr. J. 2012, 22, 31–40. [Google Scholar]
  5. Shigeta, K.; Kitagawa, Y.; Yasuki, T. Development of next generation human FE model capable of organ injury prediction. In Proceedings of the 21st International Technical Conference on the Enhanced Safety of Vehicles (ESV), Stuttgart, Germany, 15–18 June 2009; National Highway Traffic Safety Administration: Stuttgart, Germany, 2009. [Google Scholar]
  6. Hoof, J.V.; Lange, R.D.; Wismans, J.S. Improving pedestrian safety using numerical human models. Stapp Car Crash J. 2003, 47, 401–436. [Google Scholar] [PubMed]
  7. Yang, J.K.; Lovsund, P.; Cavallero, C.; Bonnoit, J. A Human-Body 3D Mathematical Model for Simulation of Car-Pedestrian Impacts. Int. J. Crash Prev. Inj. Control 2000, 2, 131–149. [Google Scholar] [CrossRef]
  8. Yao, J.; Yang, J.; Otte, D. Investigation of head injuries by reconstructions of real-world vehicle-versus-adult-pedestrian accidents. Saf. Sci. 2008, 46, 1103–1114. [Google Scholar] [CrossRef]
  9. Linder, A.; Douglas, C.; Clark, A.; Fildes, B.; Yang, J.; Otte, D. Mathematical simulations of real-world pedestrian-vehicle collisions. In Proceedings of the 19th International Technical Conference on the Enhanced Safety of Vehicles (ESV), Washington, DC, USA, 6–9 June 2005; National Highway Traffic Safety Administration: Washington, DC, USA, 2005. [Google Scholar]
  10. Ishikawa, H.; Kajzer, J.; Schroeder, G. Computer simulation of impact response of the human body in car-pedestrian accidents. In Proceedings of the 37th Stapp Car Crash Conference, San Atonio, TX, USA, 7–8 November 1993; Society of Automotive Engineers: Warrendale, PA, USA, 1993. [Google Scholar]
  11. Maeno, T.; Hasegawa, J. Development of a finite element model of the total human model for safety (THUMS) and application to car-pedestrian impacts. In Proceedings of the International Technical Conference on the Enhanced Safety of Vehicles (ESV) Conference, Amsterdam, The Netherlands, 4–7 June 2001. [Google Scholar]
  12. Masami, I.; Yoshikatsu, K.; Isao, W.; Katsuya, F.; Kazuo, M. Development of a finite element model of the total human model for safety (THUMS) and application to car-pedestrian impacts. In Proceedings of the International Research Council on the Biokinetics of Impacts (IRCOBI) Conferences, Munich, Germany, 18–20 September 2002. [Google Scholar]
  13. Chen, H.; Poulard, D.; Crandall, J.R.; Panzer, M. Pedestrian response with different initial positions during impact with a mid-sized sedan. In Proceedings of the 24th International Technical Conference on the Enhanced Safety of Vehicles (ESV), Gothenburg, Sweden, 8–11 June 2015; National Highway Traffic Safety Administration: Gothenburg, Sweden, 2015. [Google Scholar]
  14. Poulard, D.; Chen, H.; Panzer, M. Geometrical Personalization of Pedestrian Finite Element Models Using Morphing Increases the Biofidelity of Their Impact Kinematics. In Proceedings of the SAE 2016 World Congress and Exhibition, Detroit, MI, USA, 12–14 April 2016. Technical Paper. [Google Scholar]
  15. Paas, R.; Östh, J.; Davidsson, J. Which Pragmatic Finite Element Human Body Model Scaling Technique Can Most Accurately Predict Head Impact Conditions in Pedestrian-Car Crashes? In Proceedings of the 2015 International Research Council on Biomechanics of Injury Conference, Lyon, France, 9–11 September 2015. [Google Scholar]
  16. Watanabe, R.; Katsuhara, T.; Miyazaki, H.; Kitagawa, Y.; Yasuki, T. Research of the relationship of pedestrian injury to collision speed, car-type, impact location and pedestrian sizes using human FE model (THUMS Version 4). Stapp Car Crash J. 2012, 56, 269–321. [Google Scholar]
  17. Wu, T.; Kim, T.; Bollapragada, V.; Poulard, D.; Chen, H. Evaluation of biofidelity of THUMS pedestrian model under a whole-body impact conditions with a generic sedan buck. Traffic Inj. Prev. 2017, 18, S148–S154. [Google Scholar] [CrossRef] [Green Version]
  18. Shi, L.; Han, Y.; Huang, H.; Li, Q.; Wang, B.; Mizuno, K. Analysis of pedestrian-to-ground impact injury risk in vehicle-to-pedestrian collisions based on rotation angles. J. Saf. Res. 2018, 64, 37–47. [Google Scholar] [CrossRef]
  19. Li, G.; Yang, J.; Simms, C. Safer passenger car front shapes for pedestrians: A computational approach to reduce overall pedestrian injury risk in realistic impact scenarios. Accid. Anal. Prev. 2017, 100, 97–110. [Google Scholar] [CrossRef]
  20. Li, G.; Lyons, M.; Wang, B.; Yang, J.; Otte, D.; Simms, C. The influence of passenger car front shape on pedestrian injury risk observed from German in-depth accident data. Accid. Anal. Prev. 2017, 101, 11–21. [Google Scholar] [CrossRef]
  21. Crocetta, G.; Piantini, S.; Pierini, M.; Simms, C. The influence of vehicle front-end design on pedestrian ground impact. Accid. Anal. Prev. 2015, 79, 56–69. [Google Scholar] [CrossRef] [PubMed]
  22. Lyons, M.; Simms, C.K. Predicting the Influence of Windscreen Design on Pedestrian Head Injuries. In Proceedings of the 2012 International Research Council on Biomechanics of Injury, Dublin, Ireland, 9–14 September 2012. [Google Scholar]
  23. Yin, S.; Li, J.; Xu, J. Exploring the mechanisms of vehicle front-end shape on pedestrian head injuries caused by ground impact. Accid. Anal. Prev. 2017, 106, 285–296. [Google Scholar] [CrossRef] [PubMed]
  24. Katsuhara, T.; Miyazaki, H.; Kitagawa, Y.; Yasuki, T. Impact kinematics of cyclist and head injury mechanism in car-to-bicycle collision. In Proceedings of the 2014 International Research Council on the Biomechanics of Injury Conference, Berlin, Germany, 10–12 September 2014. [Google Scholar]
  25. Fahlstedt, M.; Halldin, P.; Kleiven, S. Comparison of Multibody and Finite Element Human Body Models in Pedestrian Accidents with the Focus on Head Kinematics. Traffic Inj. Prev. 2016, 17, 320–327. [Google Scholar] [CrossRef] [PubMed]
  26. Li, G.; Wang, F.; Otte, D.; Simms, C. Characteristics of pedestrian head injuries observed from real world collision data. Accid. Anal. Prev. 2019, 129, 362–366. [Google Scholar] [CrossRef] [PubMed]
  27. Li, G.; Wang, F.; Otte, D.; Cai, Z.; Simms, C. Have pedestrian subsystem tests improved passenger car front shape? Accid. Anal. Prev. 2018, 115, 143–150. [Google Scholar] [CrossRef] [PubMed]
  28. Xu, J.; Li, Y.; Lu, G.; Zhou, W. Reconstruction model of vehicle impact speed in pedestrian–vehicle accident. Int. J. Impact Eng. 2009, 36, 783–788. [Google Scholar] [CrossRef]
  29. Mackay, M. Global priorities for vehicle safety. Traffic Inj. Prev. 2003, 4, 1–4. [Google Scholar] [CrossRef] [Green Version]
  30. Jones, D.A.; Urban, J.E.; Weaver, A.A.; Stitzel, J.D. Investigation of head injury mechanisms through multivariate finite element simulation. In Proceedings of the 12th Ohio State University Injury Biomechanics Symposium, Columbus, OH, USA, 5–7 June 2016. [Google Scholar]
  31. TASS. MADYMO Manual Version 7.5. Available online: https://tass.plm.automation.siemens.com/madymo (accessed on 9 January 2020).
  32. Wang, F.; Wang, B.; Han, Y.; Peng, Q.; Li, F.; Wittek, A. Reconstruction of Real-World Car-to-Pedestrian Accident Using Computational Biomechanics Model: Effects of the Choice of Boundary Conditions of the Brain on Brain Injury Risk. In Proceedings of the International Conference on Medical Image Computing and Computer-Assisted Intervention, Quebec City, QC, Canada, 11–13 September 2017; Springer: Cham, Switzerland, 2017. [Google Scholar]
  33. Li, F.; Li, H.; Xiao, Z.; Lu, R.; Zhang, Z.; Zhu, H.; Ren, L. A Review on Injury Mechanism of Intracerebral Hemorrhage in Vehicle Accidents. Curr. Pharm. Des. 2017, 23, 2177–2192. [Google Scholar] [CrossRef]
  34. Marjoux, D.; Baumgartner, D.; Deck, C.; Willinger, R. Head injury prediction capability of the HIC, HIP, SIMon and ULP criteria. Accid. Anal. Prev. 2008, 40, 1135–1148. [Google Scholar] [CrossRef]
  35. Fernandes, F.A.O.; Sousa, R.J.A.d.; Ptak, M. Application of Numerical Methods for Accident Reconstruction and Forensic Analysis. In Head Injury Simulation in Road Traffic Accidents; Springer: Cham, Switzerland, 2018; pp. 59–98. [Google Scholar]
  36. Takhounts, E.G.; Craig, M.J.; Moorhouse, K.; McFadden, J.; Hasija, V. Development of brain injury criteria (BrIC). Stapp Car Crash J. 2013, 57, 243–266. [Google Scholar]
  37. Kleiven, S. Predictors for traumatic brain injuries evaluated through accident reconstructions. Stapp Car Crash J. 2007, 51, 81–114. [Google Scholar] [PubMed]
  38. Fahlstedt, M.; Halldin, P.; Alvarez, V.S.; Kleiven, S. Influence of the Body and Neck on Head Kinematics and Brain Injury Risk in Bicycle Accident Situations. In Proceedings of the 2016 International Research Council on the Biomechanics of Injury Conference, Malaga, Spain, 14–16 September 2016. [Google Scholar]
  39. Munsch, M.; Anderson, R.; Deck, C.; Ludes, B.; Willinger, R. Influence of head boundary conditions in pedestrian real world head trauma simulations. In Proceedings of the 2009 International Research Council on the Biomechanics of Injury Conference, York, UK, 9–11 Septemcer 2009. [Google Scholar]
  40. Alvarez, V.S.; Kleiven, S.; Halldin, P.H. The Influence of Neck Muscle Tonus and Posture on Brain Tissue Strain in Pedestrian Head Impacts. Stapp Car Crash J. 2014, 58, 63–101. [Google Scholar] [PubMed]
  41. Su, Y. Research on the modeling and impact injury of obese children based on mesh morphing method. In Automotive Collaborative Innovation Center of Chongqing; Chongqing University: Chongqing, China, 2017. [Google Scholar]
  42. Sieger, D.; Menzel, S.; Botsch, M. High Quality Mesh Morphing Using Triharmonic Radial Basis Functions. In Proceedings of the 21st International Meshing Roundtable, San Jose, CA, USA, 7–10 October 2013; Springer: San Jose, CA, USA, 2013. [Google Scholar]
  43. Michler, A.K. Aircraft control surface deflection using RBF-based mesh deformation. Int. J. Numer. Methods Eng. 2011, 88, 986–1007. [Google Scholar] [CrossRef]
  44. Lalwala, M.; Chawla, A.; Thomas, P.; Mukherjee, S. Finite element reconstruction of real-world pedestrian accidents using THUMS pedestrian model. Int. J. Crashworthiness 2019. [Google Scholar] [CrossRef]
  45. Li, G.; Tan, Z.; Lv, X.; Ren, L. A Computationally Efficient Finite Element Pedestrian Model for Head Safety: Development and Validation. Appl. Bionics Biomech. 2019, 2019, 4930803. [Google Scholar] [CrossRef] [Green Version]
  46. Chai, X.; Jin, X.; Zhang, X.; Hou, X. The application for skull injury in vehicle-pedestrian accident. Int. J. Crash Worthiness 2011, 16, 11–24. [Google Scholar]
  47. TASS. Coupling Manual Version 7.5; TASS: Helmand, The Netherlands, 2013; pp. 19–25. [Google Scholar]
  48. Forman, J.L.; Joodaki, H.; Forghani, A.; Riley, P.O.; Bollapragada, V.; Lessley, D.J.; Overby, B.; Heltzel, S.; Kerrigan, J.R.; Crandall, J.R. Whole-body Response for Pedestrian Impact with a Generic Sedan Buck. Stapp Car Crash J. 2015, 59, 401–444. [Google Scholar]
  49. Forman, J.L.; Joodaki, H.; Forghani, A.; Riley, P.; Bollapragada, V.; Lessley, D.; Overby, B.; Heltzel, S.; Crandall, J.R. Biofidelity Corridors for Whole-Body Pedestrian Impact with a Generic Buck. In Proceedings of the 2015 International Research Council on Biomechanics of Injury Conference, Lyon, France, 9–11 September 2015. [Google Scholar]
  50. Pipkorn, B.; Forsberg, C.; Takahashi, Y.; Ikeda, M.; Fredriksson, R.; Svensson, C.; Thesleff, A. Development and component validation of a generic vehicle front buck for pedestrian impact evaluation. In Proceedings of the 2014 International Research Council on Biomechanics of Injury Conference, Berlin, Germany, 10–12 September 2014. [Google Scholar]
  51. Kerrigan, J.; Subit, D.; Untaroi, C.; Crandall, J.; Rudd, R. . Pedestrian Lower Extremity Response and Injury: A Small Sedan vs. A Large Sport Utility Vehicle. In Proceedings of the SAE World Congress & Exhibition, Detroit, MI, USA, 14–17 April 2008; SAE International: Detroit, MI, USA, 2008. [Google Scholar]
  52. Gehre, C.; Gades, H.; Wernicke, P. Objective Rating of Signals Using Test and Simulation Responses. In Proceedings of the 21st International Technical Conference on the Enhanced Safety of Vehicles, Stuttgart, Germany, 15–18 June 2009; National Highway Traffic Safety Administration: Stuttgart, Germany, 2009. [Google Scholar]
  53. Chen, H.; Poulard, D.; Forman, J.; Crandall, J.; Panzer, M.B. Evaluation of geometrically personalized thums pedestrian model response against sedan-pedestrian pmhs impact test data. Traffic Inj. Prev. 2018, 19, 542–548. [Google Scholar] [CrossRef]
  54. Vavalle, N.A.; Jelen, B.C.; Moreno, D.P.; Stitzel, J.D.; Gayzik, F.S. An evaluation of objective rating methods for full-body finite element model comparison to PMHS tests. Traffic Inj. Prevation 2013, 14, S87–S94. [Google Scholar] [CrossRef] [Green Version]
  55. Miller, K.; King, A.I. Modeling of the Brain for Injury Simulation and Prevation. In Biomechanics of the Brain; Miller, K., Ed.; Spinger: New York, NY, USA, 2011; pp. 91–100. [Google Scholar]
  56. Yoganandan, N.; Zhang, J.; Pintar, F. Force and acceleration corridors from lateral head impact. Traffic Inj. Prevation 2004, 5, 368–373. [Google Scholar] [CrossRef]
  57. Kleiven, S.; Hardy, W.N. Correlation of an FE Model of the Human Head with Local Brain Motion--Consequences for Injury Prediction. Stapp Car Crash J. 2002, 46, 123–144. [Google Scholar] [PubMed] [Green Version]
  58. Hardy, W.N.; Foster, C.D.; Mason, M.J.; Yang, K.H.; King, A.I.; Tashman, S. Investigation of Head Injury Mechanisms Using Neutral Density Technology and High-Speed Biplanar X-ray. Stapp Car Crash J. 2001, 45, 337–368. [Google Scholar] [PubMed]
  59. Nahum, A.M.; Smith, R.; Ward, C.C. Intracranial Pressure Dynamics During Head Impact. In Proceedings of the 21st Stapp Car Crash Conference, New Orleans, LA, USA, 19–21 October 1977. SAE Technical Paper 770922. [Google Scholar]
Figure 1. (a) Extracted head–neck finite element (FE) model; (b) extracted pedestrian multibody model.
Ijerph 17 00492 g001
Figure 2. (a) Schematic diagram of the coupling process; (b) the full-scale coupled pedestrian computational biomechanics model (CPCBM).
Ijerph 17 00492 g002
Figure 3. Postures over-plotted with Vicon marker positions from the experiments (aligned with the pelvis position with the model in the background) in case V2370, case V2370, and case V2374 [17]: (a) Y-Z plan; (b) X-Z plan.
Ijerph 17 00492 g003
Figure 4. Initial condition of the buck–-pedestrian impact simulation.
Ijerph 17 00492 g004
Figure 5. Overall kinematics comparison for test V2370 [17] between the TNO model, CPCBM, and the experimental data: (a) posterior view, (b) superior view.
Ijerph 17 00492 g005aIjerph 17 00492 g005b
Figure 6. Comparisons of analyzed responses for test V2370 [17] between the TNO model, CPCBM and the experimental data: (a) the head center of gravity (COG) displacement in X direction, (b) the head COG displacement in Y direction, (c) the head COG displacement in Z direction, (d) the head COG trajectory in the YOZ plane, (e) The head COG resultant velocity relative to the impact buck, (f) the head COG resultant acceleration.
Ijerph 17 00492 g006aIjerph 17 00492 g006b
Figure 7. Average correlation and analysis (CORA) ratings of the correlations between the experimental results and the simulations using the TNO model and CPCBM, for all the analyzed signals.
Ijerph 17 00492 g007
Figure 8. Head injury criterion 15 (HIC15) recorded in the experiment and obtained from different human models in the simulation.
Ijerph 17 00492 g008
Figure 9. Initial conditions of car-to-pedestrian impact scenarios: (a) full-scale TNO multibody (MB) pedestrian model, (b) CPCBM, (c) full-scale Total Human Model for Safety (THUMS) finite element (FE) pedestrian model.
Ijerph 17 00492 g009aIjerph 17 00492 g009b
Table 1. Anthropometries and injuries of the tested subjects.
Test No.AgeGenderHeight (mm)Weight (kg)Cause of Death
V237073male179572.6Heart Failure
V237154male187081.6Colon Cancer
V2374 167male178078COPD 2
1 This subject had its distal upper extremities amputated bilaterally at the mid-forearm; 2 Chronic obstructive pulmonary disease.
Table 2. Subjects anthropometry parameters used to scale in MADYSCALE.
No.Body ParametersUnitV2370TNO2370V2371TNO2371V2374TNO2374
1Weightkg72.672.681.681.678.078.0
2Standing heightmm1795.01795.01870.01870.01780.01780.0
3Shoulder height 1mm1555.01534.21620.01611.81550.01553.2
4Armpit heightmm1400.01434.11470.01498.91400.01139.3
5Waist heightmm1090.01128.11123.01163.21070.01125.6
6Seated heightmm957.2949.81037.21029.5970.0964.4
7Head lengthmm185.0185.6205.0195.6198.0181.1
8Head breadthmm161.0156.6157.0153.4158.0154.2
9Head to chin height 1mm208.5226.9238.5237.4228.0225.9
10Neck circumferencemm452.0408.2352.0395.6445.0398.6
11Shoulder breadthmm393.0389.5404.0403.5381.0367.3
12Chest depthmm234.0243.9208.0218.6225.0249.6
13Chest breadthmm321.0316.8330.0341.7293.0298.4
14Waist depthmm180.0179.8190.0201.1190.0199.2
15Waist breadthmm313.0296.6360.0348.8321.6298.3
16Buttock depthmm228.9214.5237.2232.2240.5237.9
17Hip breadth, standing 1mm345.5339.0345.5368.4310.0328.8
18Shoulder to elbow lengthmm390.0388.2370.0356.2355.0356.7
19Forearm-hand lengthmm487.0463.2500.0488.7451.0446.3
20Biceps circumferencemm247.0301.4265.0282.6275.0301.4
21Elbow circumferencemm239.0219.8254.0250.6258.0219.8
22Forearm circumferencemm226.0229.2233.0241.4210.7232.3
23Wrist circumferencemm165.0148.2175.0167.8165.0144.4
24Knee height, seatedmm585.0569.8570.0522.7565.0553.8
25Thigh circumferencemm499.0414.5530.0496.1510.0496.1
26Upper leg circumferencemm395.0376.8362.0401.9415.0414.5
27Knee circumferencemm349.0332.4380.0376.8386.0345.4
28Calf circumferencemm334.0314.3305.0332.8327.0364.2
29Ankle circumferencemm190.0257.5245.0282.6238.0282.6
30Ankle height, outsidemm92.0102.390.0101.688.097.6
31Foot breadthmm90.099.887.0108.286.0102.9
32Foot lengthmm238.0241.5238.0254.4198.0217.7
33Hand breadth 1mm88.689.588.693.689.196.6
34Hand length 1mm192.1187.5192.1188.6191.6182.3
35Hand depth 1mm27.428.127.430.427.630.3
1 This parameter was not given in Forman et al. [49], but it is essential for the scale process. This parameter was calculated by another scale process where only height and weight of the samples were used to scale the Netherlands Organisation for Applied Scientific Research (TNO) 50th percentile adult male pedestrian model into the target models.
Table 3. Detailed CORA rating scores (Scora) between simulations and experimental results.
SignalTest V2370Test V2371Test V2374
TNO & TestCPCBM & TestTNO & TestCPCBM & TestTNO & TestCPCBM & Test
Displacement-X0.3880.3970.4790.5070.2440.297
Displacement-Y0.9770.9980.9730.9680.9890.997
Displacement-Z0.9960.9650.9560.9790.9900.999
Resultant relative velocity0.9320.8400.9210.9240.8210.808
Resultant acceleration0.7390.7590.7800.8250.6510.717
Table 4. Comparison of the computation time needed by different models.
Model TypeImpact DurationCalculation TimeSolver
Full-scale TNO model240 ms1 minMADYMO
Full-scale THUMS model240 ms42 hLS-DYNA
CPCBM 240 ms7.5 hLS-DYNA & MADYMO
Table 5. The comparison of anthropometry parameters between the subjects [17] we chose and the THUMS model.
ParameterV2370V2371V2374Mean ± StandardTHUMS Model
Weight (kg)72.681.67877.4 ± 3.777
Height (cm)179.5187.0187.0181.5 ± 3.9175

