Analysis of Driving Behavior Based on Dynamic Changes of Personality States


Abstract
1. Introduction
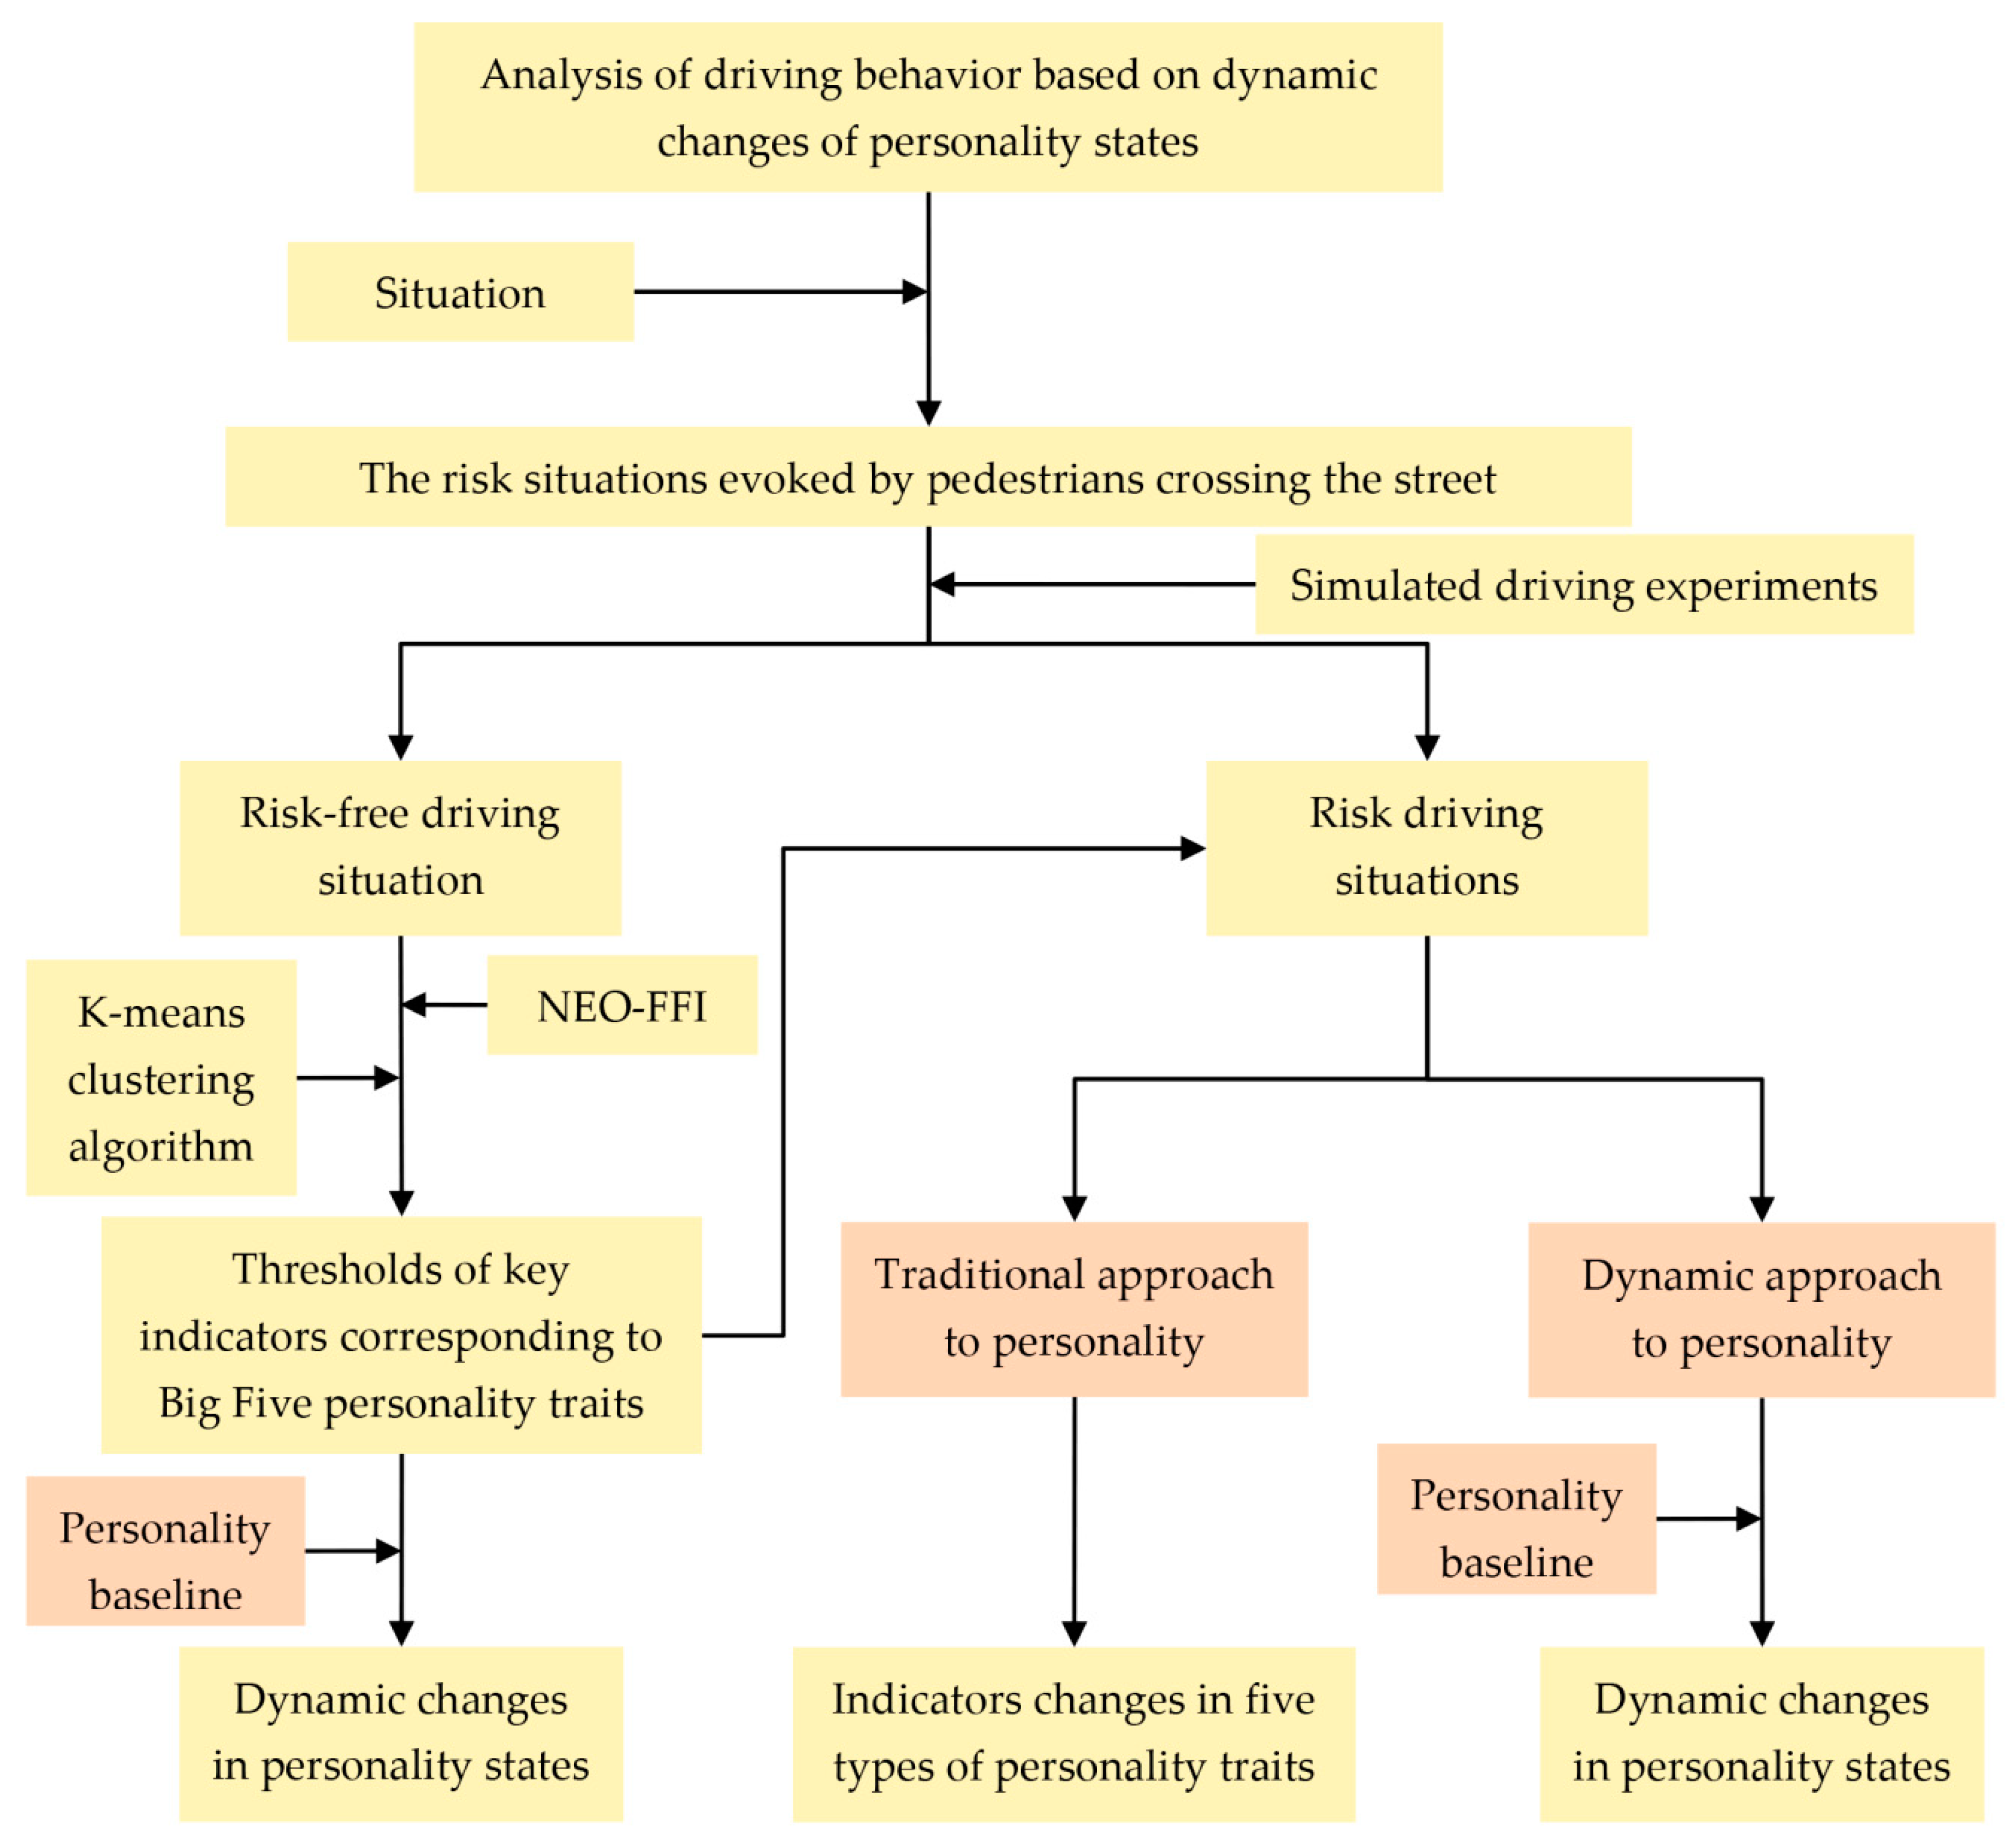
- In the risk-free scenario, personality baselines were firstly measured by the NEO-FFI questionnaire. We aimed to establish the correspondence between driving indicators and the “Big Five” personality traits in a quantitative manner using the K-means clustering method.
- In the risk scenarios, the objective was to analyze the influence of specific driving situations and time on the personality states of different drivers from a dynamic perspective, combined with the thresholds of each indicator.
2. Methods
2.1. Sample
2.2. NEO-FFI
2.3. The Theory of K-Means Clustering
- There is no or minimum number of data objects reassigned to different clusters;
- There is no or minimum number of clustering centers changing again;
- The square of the local error is the smallest.
2.4. Analysis of Driving Behavior
3. Design of the Experiments
3.1. Design of Typical Driving Scenarios
3.1.1. Risk-Free Scenario
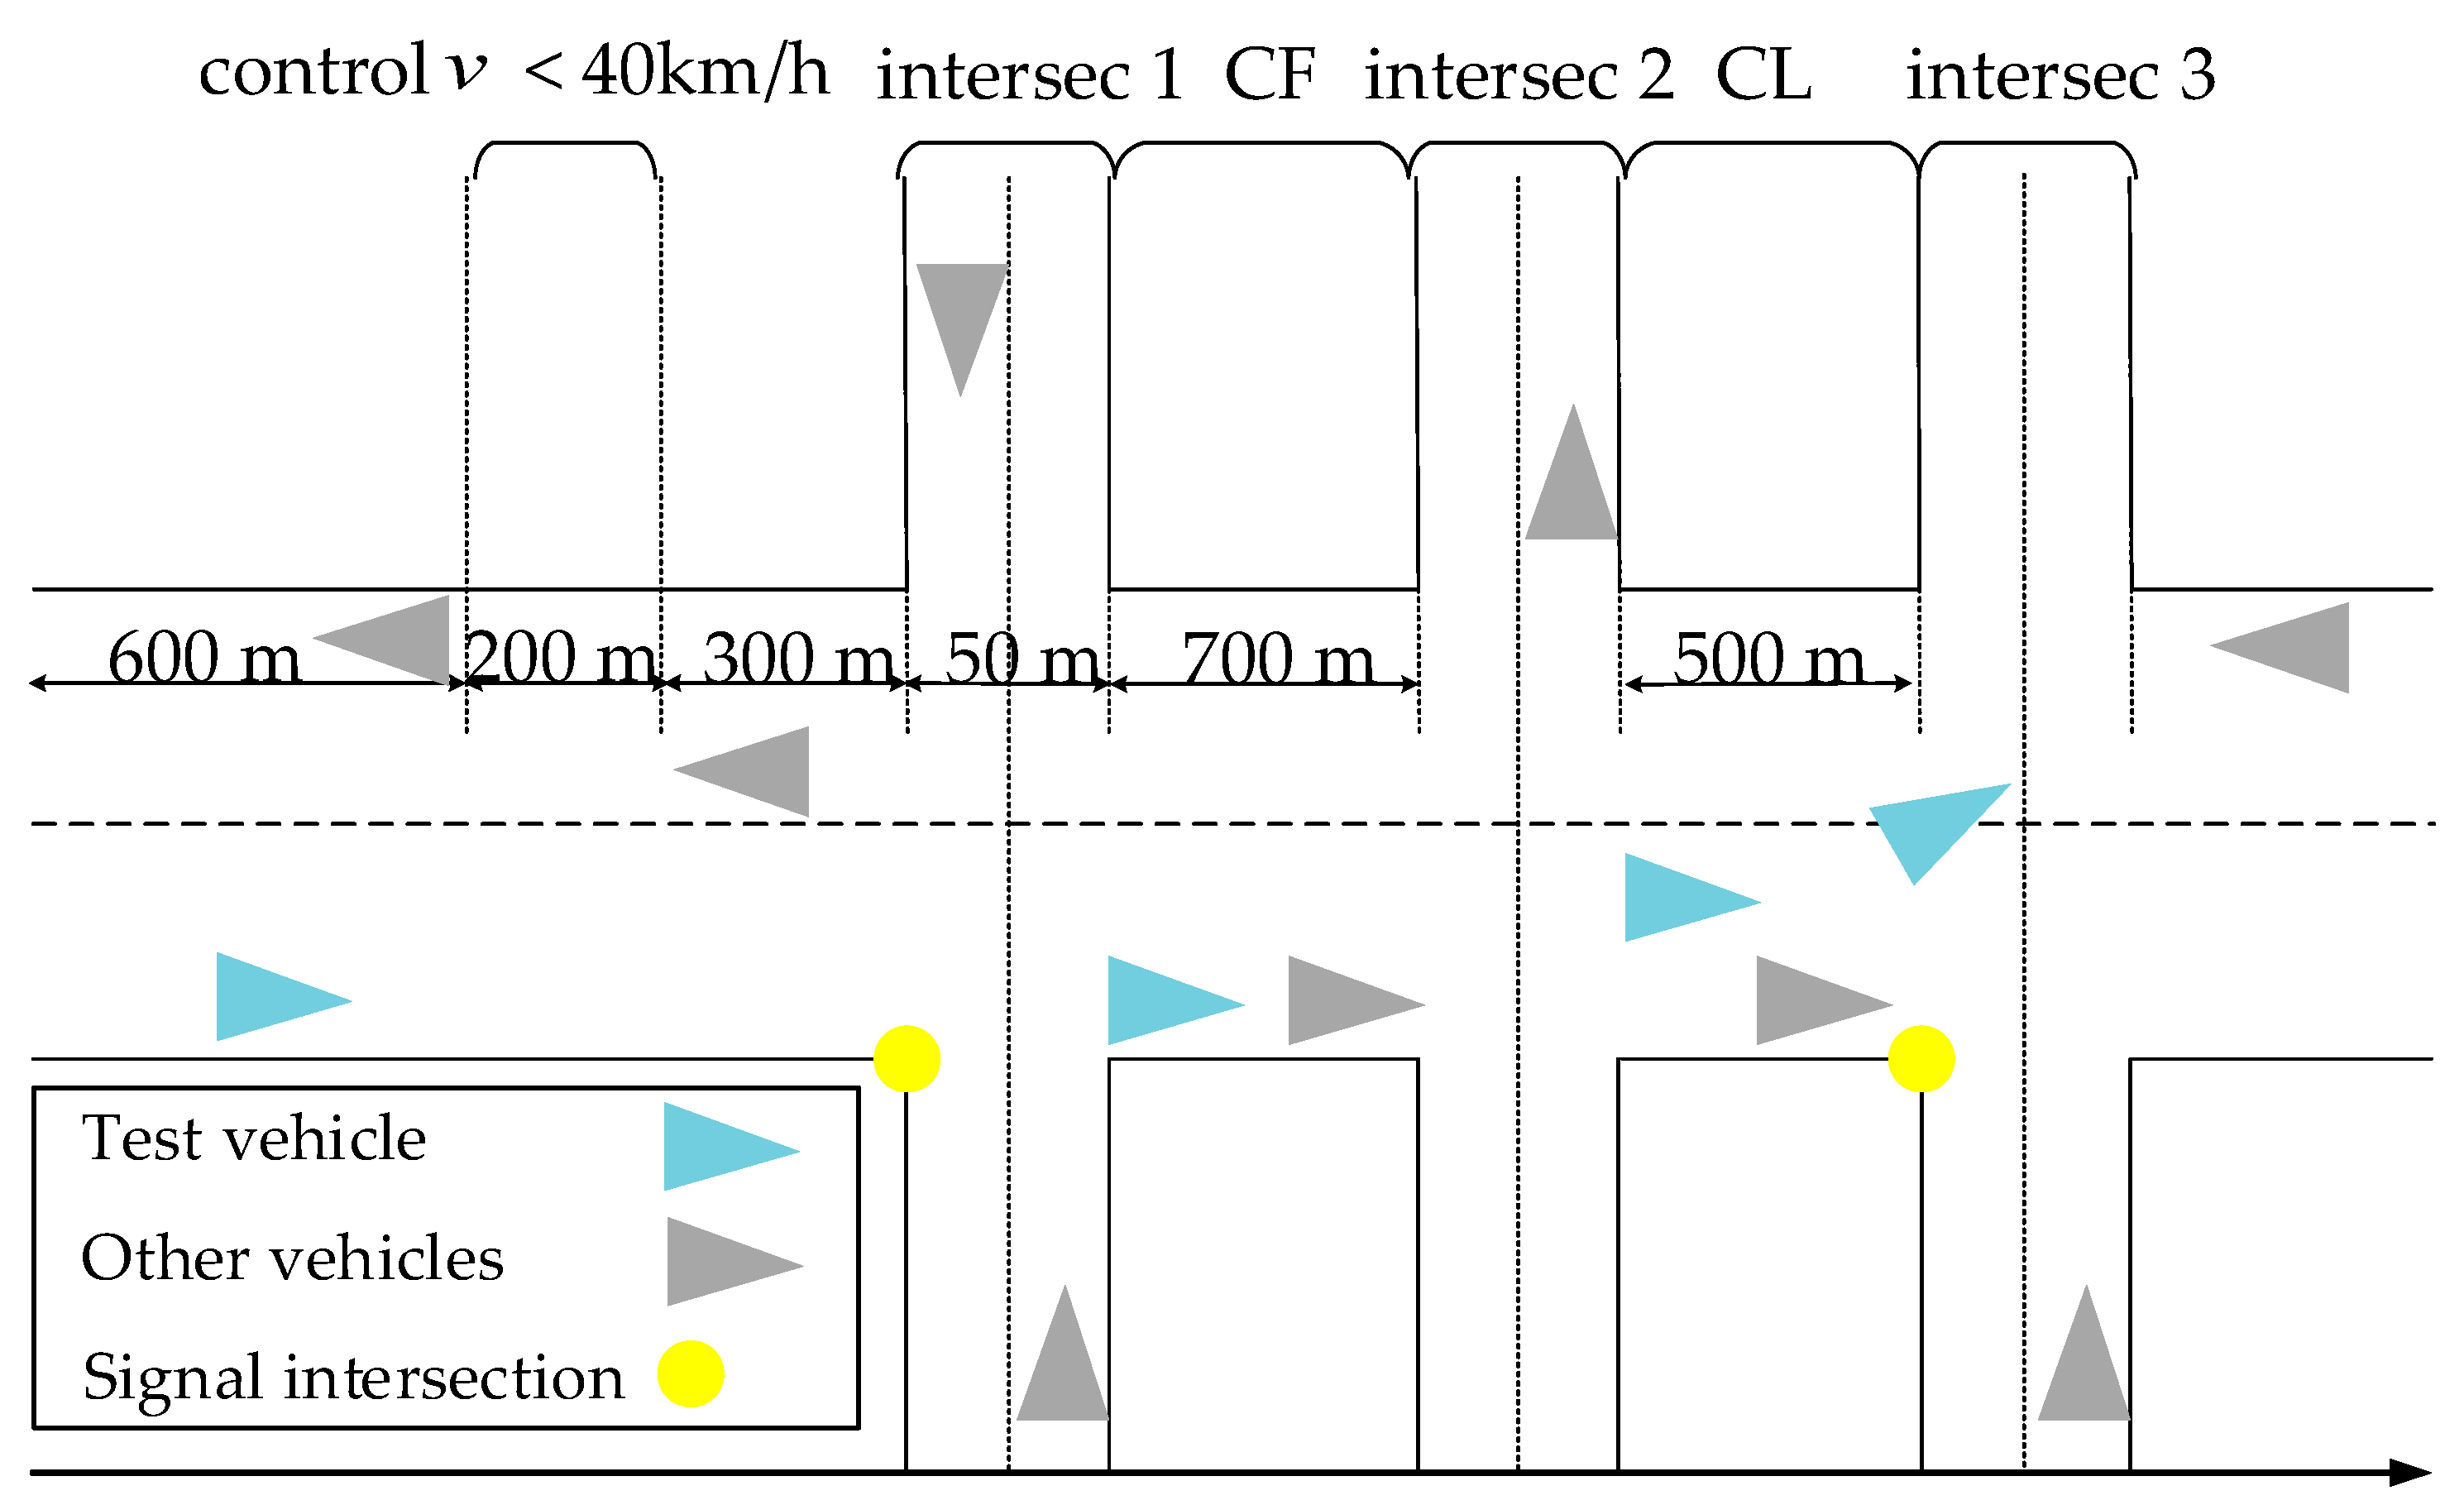
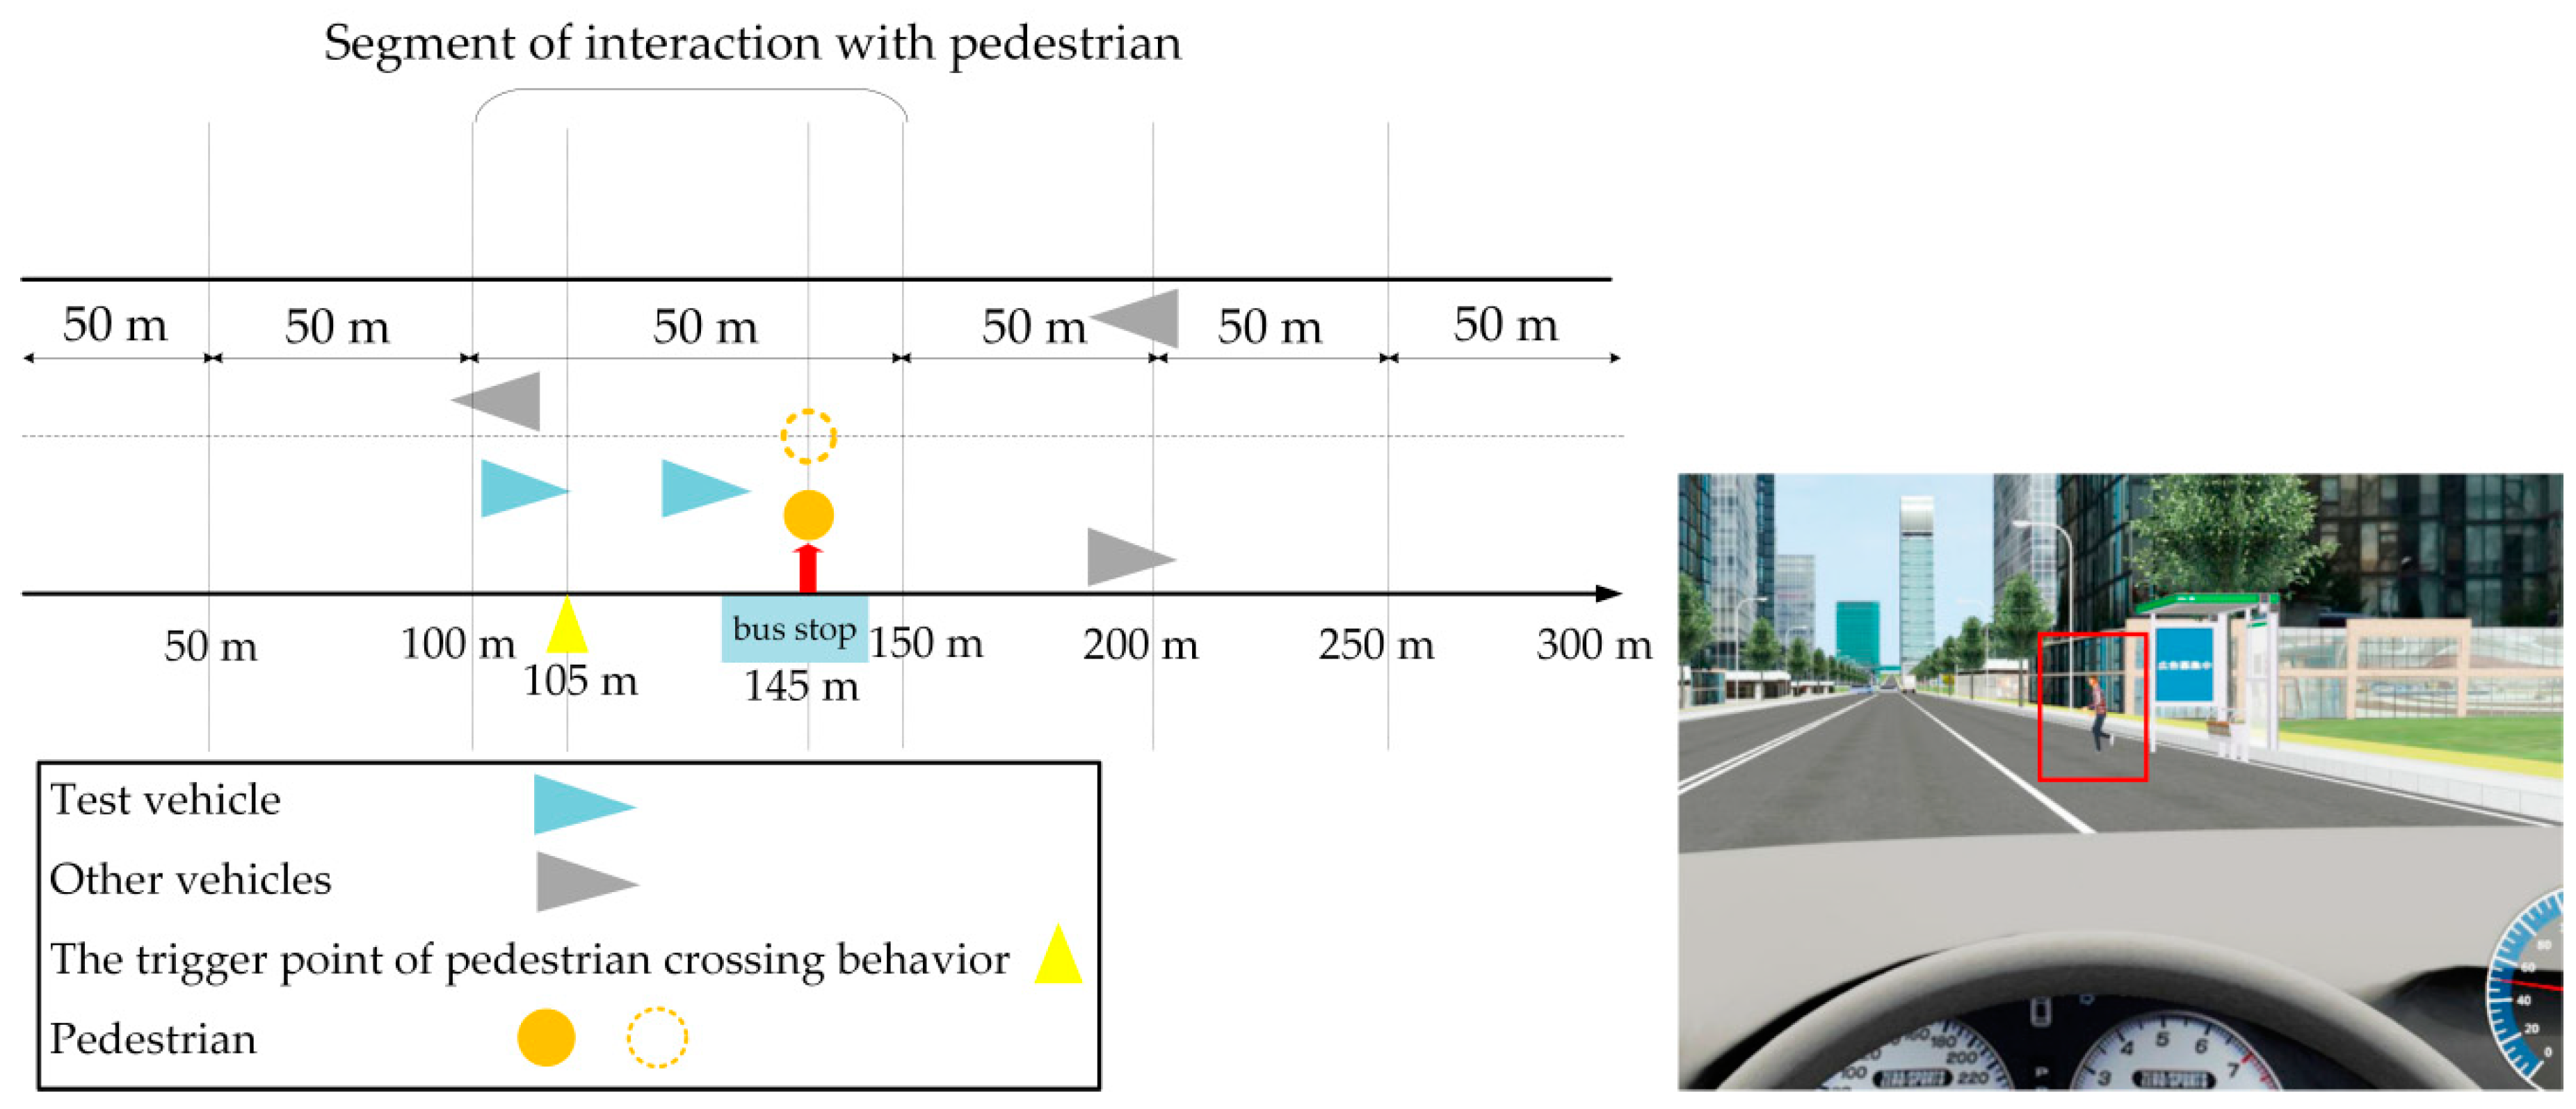
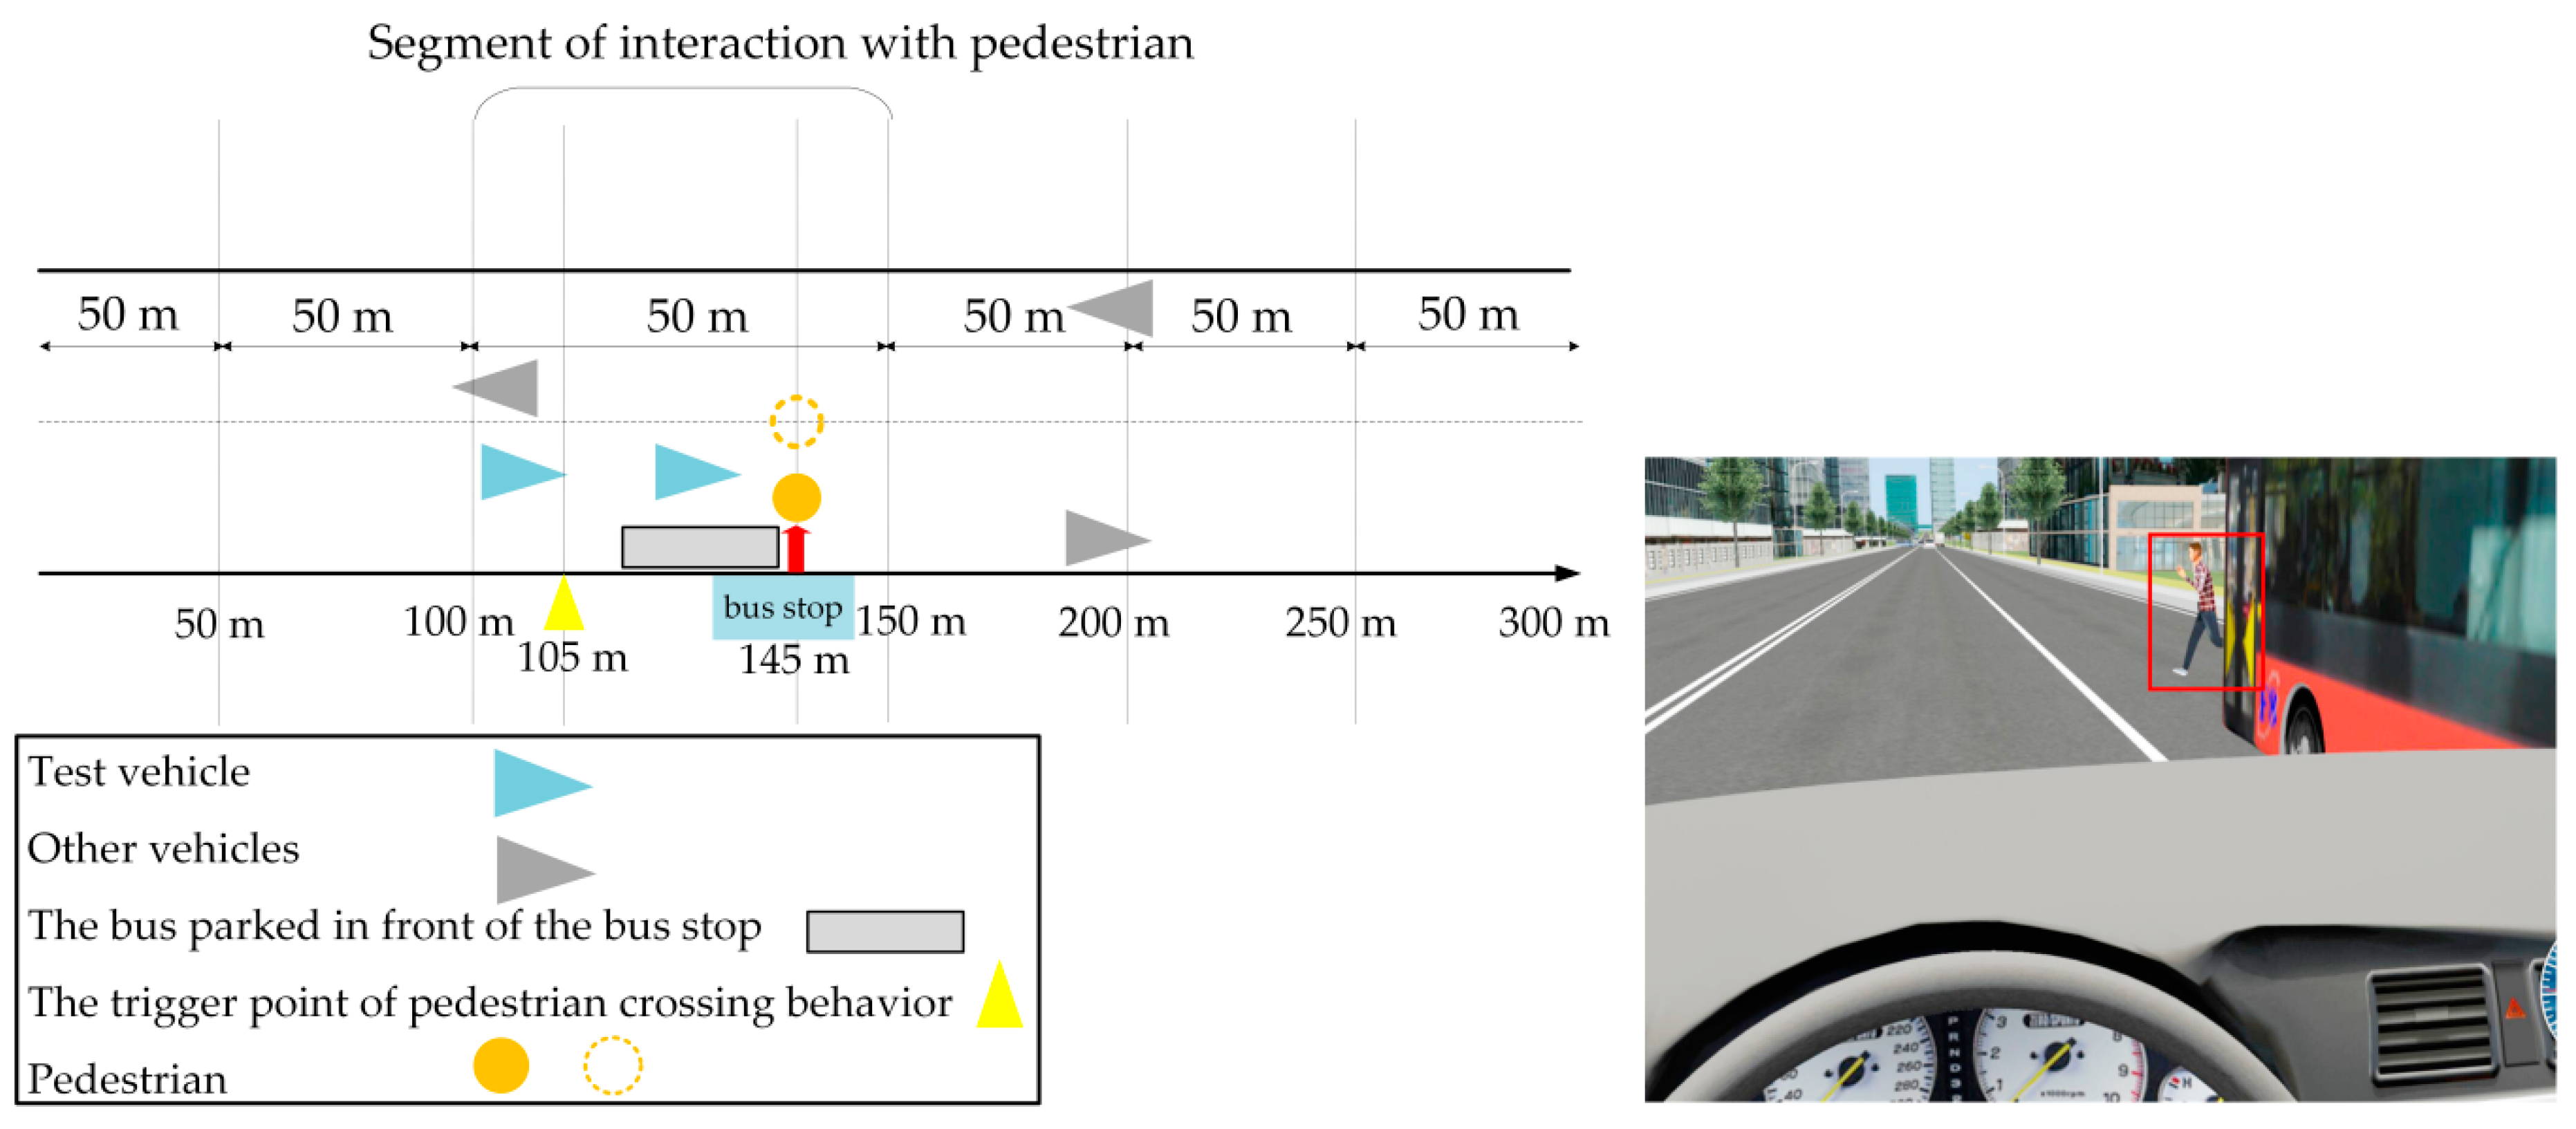
3.1.2. Risk Scenarios
3.2. Experimental Procedure
4. Discussion
4.1. Risk-Free Driving Scenario
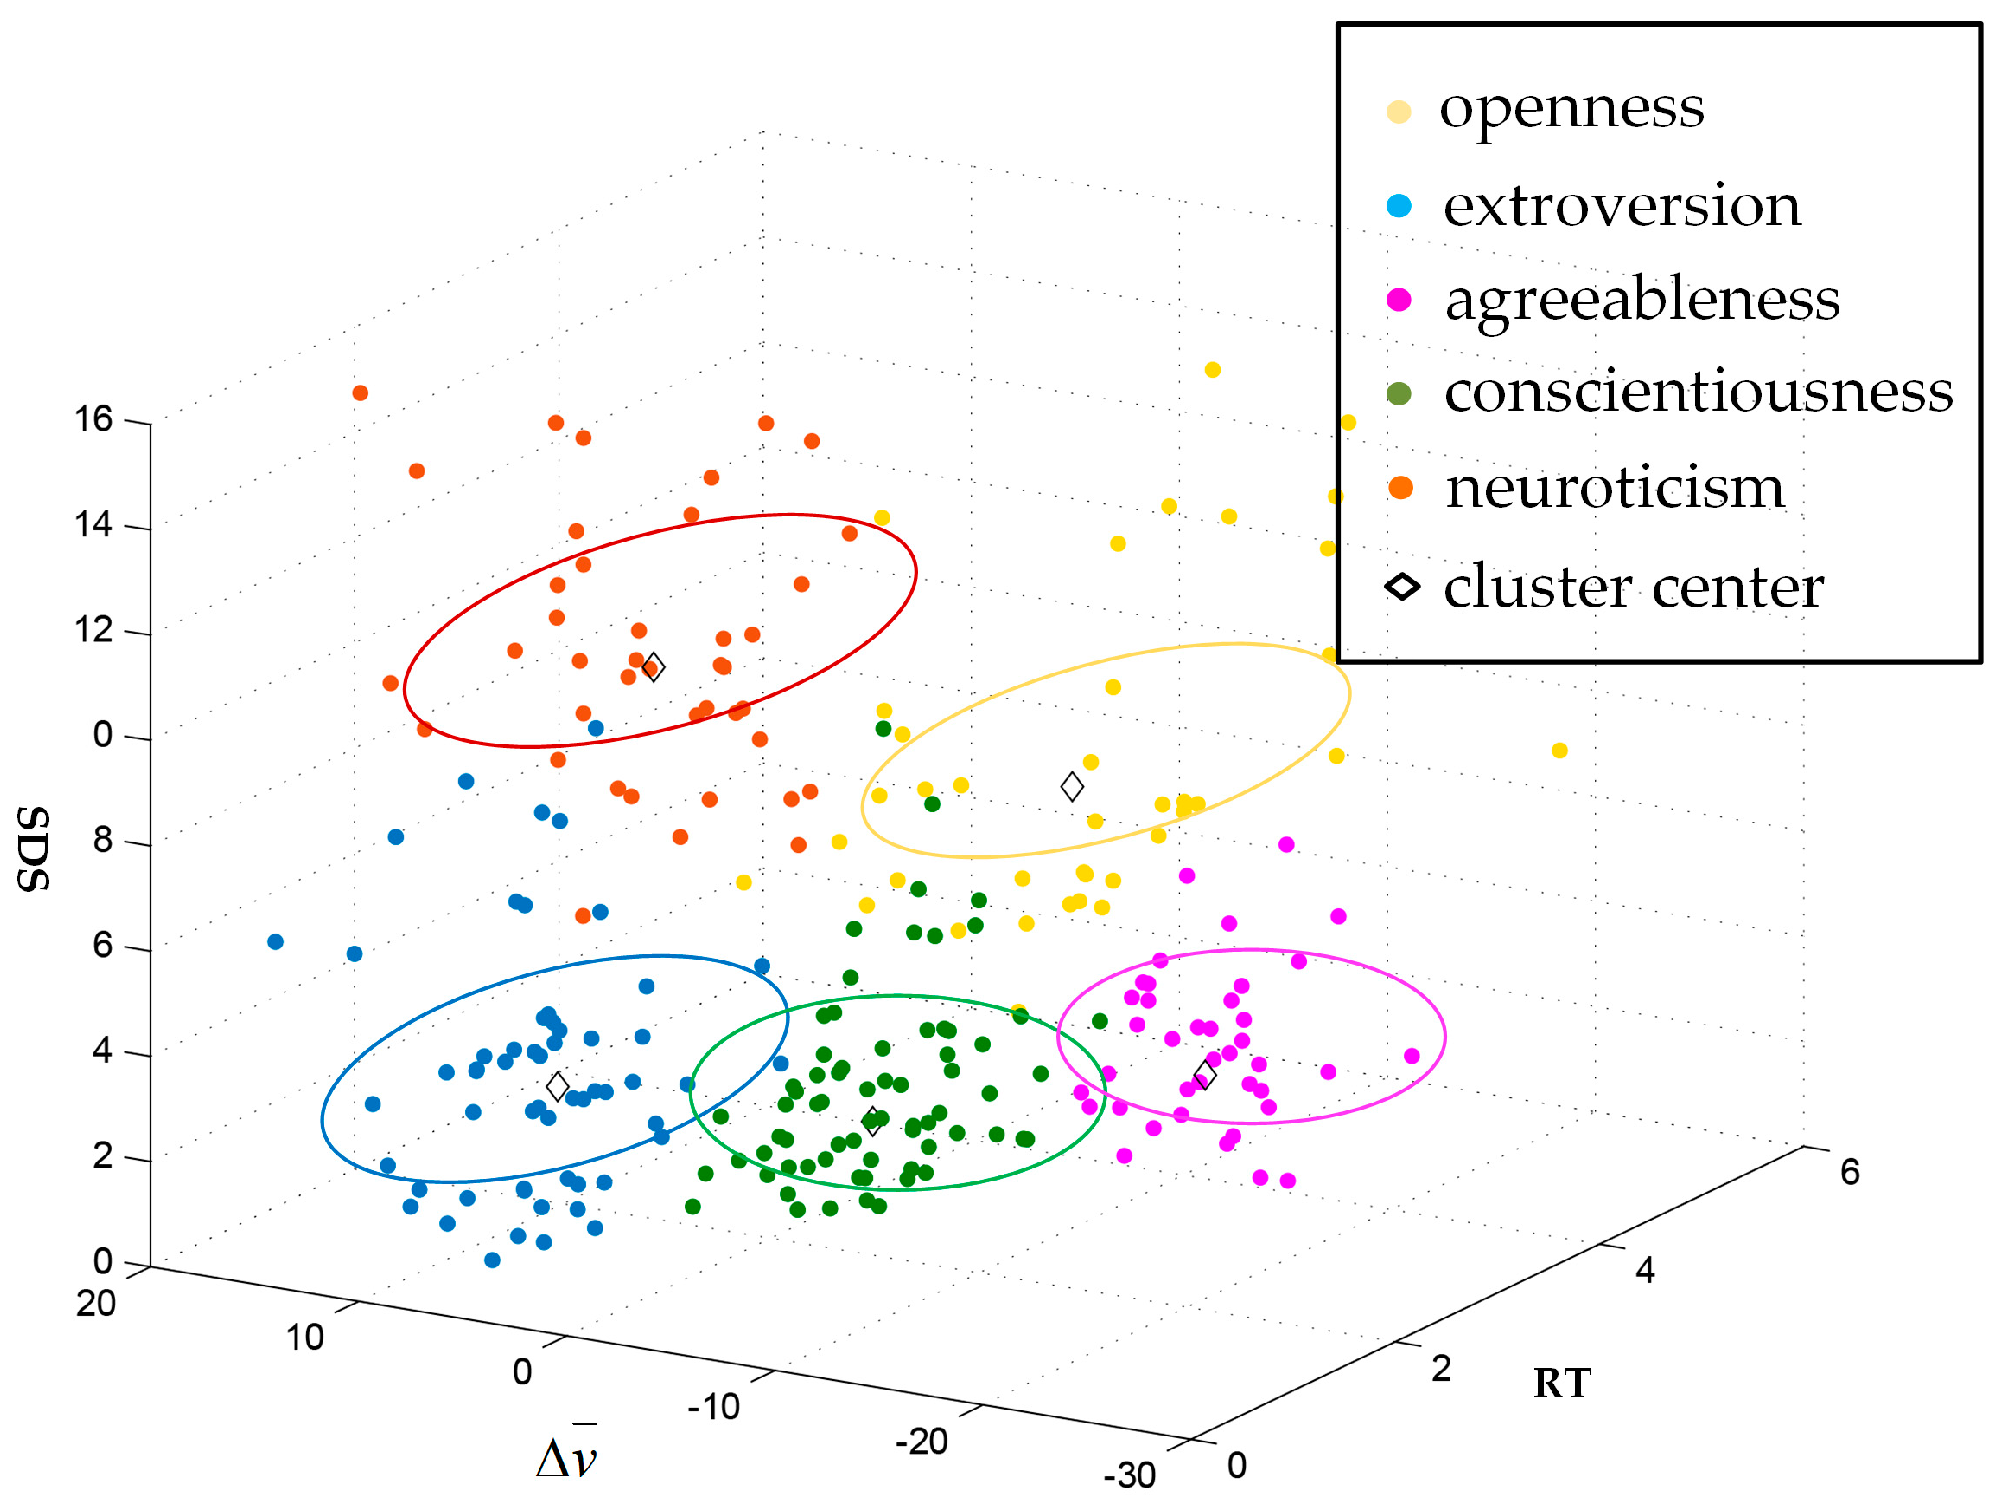
4.1.1. Analysis of Driving Characteristics Based on K-Means Clustering Algorithm
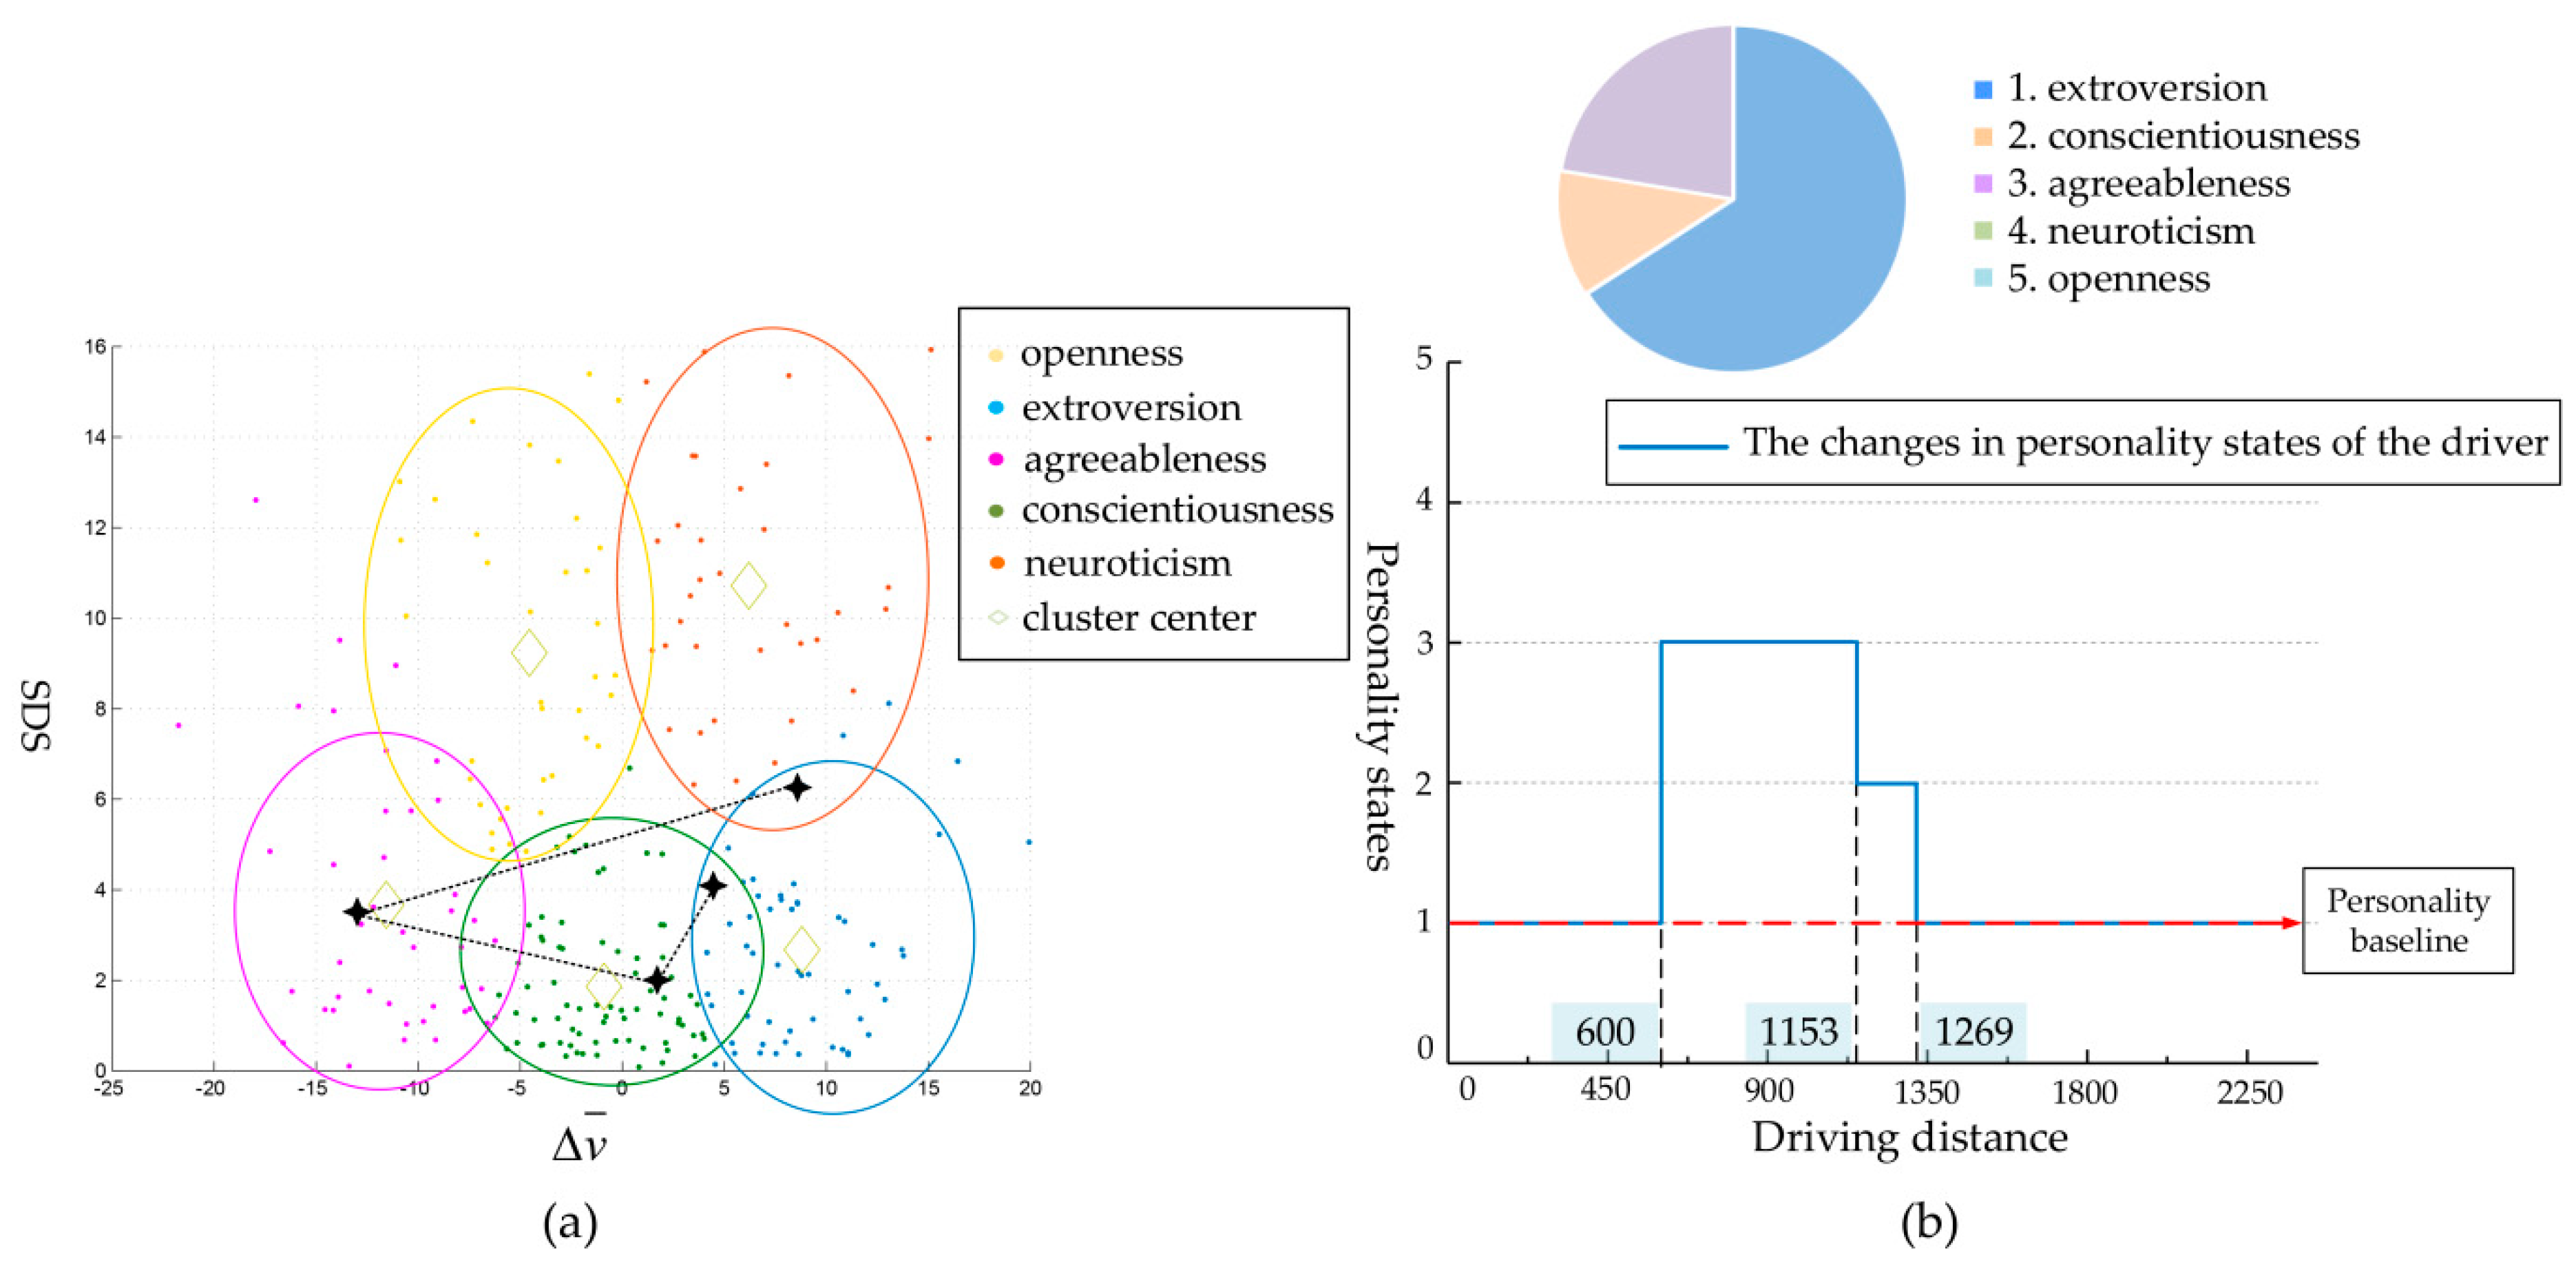
4.1.2. Analysis of Dynamic Personality Based on Personality Baseline
4.2. Risky Driving Scenarios
4.2.1. The Traditional Approach to Personality in High- and Low-Risk Scenarios
4.2.2. Analysis of Dynamic Changes of Personality States in High- and Low-Risk Scenarios
5. Conclusions
Author Contributions
Funding
Conflicts of Interest
References
- National Bureau of Statistics of China. National Data 2018. Available online: http://data.stats.gov.cn/easyquery.htm?cn=C01&zb=A0S0D02&sj=2014 (accessed on 4 July 2019).
- Hayashi, Y.; Friedel, J.E.; Foreman, A.M.; Wirth, O. A behavioral economic analysis of demand for texting while driving. Psychol. Rec. 2019, 69, 225–237. [Google Scholar] [CrossRef] [PubMed]
- Monteiro, R.P.; Coelho, G.L.D.H.; Hanel, P.H.P.; Pimentel, C.E.; Gouveia, V.V. Personality, dangerous driving, and involvement in accidents: Testing a contextual mediated model. Transp. Res. Part F Traffic Psychol. Behav. 2018, 58, 106–114. [Google Scholar] [CrossRef]
- Mao, X.; Yuan, C.; Gan, J.; Zhang, S. Risk factors affecting traffic accidents at urban weaving sections: Evidence from China. Int. J. Environ. Res. Public Health 2019, 16, 1542. [Google Scholar] [CrossRef] [PubMed]
- Hu, J.; Xu, L.; He, X.; Meng, W. Abnormal driving detection based on normalized driving behavior. IEEE Trans. Veh. Technol. 2017, 66, 6645–6652. [Google Scholar] [CrossRef]
- Sun, Z.; Wang, J.; Chen, Y.; Lu, H. Influence factors on injury severity of traffic accidents and differences in urban functional zones: The empirical analysis of Beijing. Int. J. Environ. Res. Public Health 2018, 15, 2722. [Google Scholar] [CrossRef]
- Starkey, N.J.; Isler, R.B. The role of executive function, personality and attitudes to risks in explaining self-reported driving behaviour in adolescent and adult male drivers. Transp. Res. Part F Traffic Psychol. Behav. 2016, 38, 127–136. [Google Scholar] [CrossRef]
- Zivkovic, S.; Nikolic, V.; Markic, M. Influence of professional drivers’ personality traits on road traffic safety: Case study. Int. J. Inj. Control. Saf. Promot. 2015, 22, 100–110. [Google Scholar] [CrossRef]
- Yang, J.; Du, F.; Qu, W.; Gong, Z.; Sun, X. Effects of personality on risky driving behavior and accident involvement for Chinese drivers. Traffic Inj. Prev. 2013, 14, 565–571. [Google Scholar] [CrossRef]
- Schindler, S.; Querengässer, J. Coping with sadness—How personality and emotion regulation strategies differentially predict the experience of induced emotions. Personal. Individ. Differ. 2019, 136, 90–95. [Google Scholar] [CrossRef]
- Steinbakk, R.T.; Ulleberg, P.; Sagberg, F.; Fostervold, K.I. Speed preferences in work zones: The combined effect of visible roadwork activity, personality traits, attitudes, risk perception and driving style. Transp. Res. Part F Traffic Psychol. Behav. 2019, 62, 390–405. [Google Scholar] [CrossRef]
- Hopwood, C.J. Interpersonal dynamics in personality and personality disorders. Eur. J. Personal. 2018, 32, 499–524. [Google Scholar] [CrossRef]
- Cervone, D.; Little, B.R. Personality architecture and dynamics: The new agenda and what’s new about it. Personal. Individ. Differ. 2019, 136, 12–23. [Google Scholar] [CrossRef]
- Tao, D.; Zhang, R.; Qu, X. The role of personality traits and driving experience in self-reported risky driving behaviors and accident risk among Chinese drivers. Accid. Anal. Prev. 2017, 99, 228–235. [Google Scholar] [CrossRef] [PubMed]
- Li, S.; Zhang, J.; Li, P.; Wang, Y.; Wang, Q. Influencing factors of driving decision-making under the moral dilemma. IEEE Access 2019, 7, 104132–104142. [Google Scholar] [CrossRef]
- Wen, H.; Sze, N.N.; Zeng, Q.; Hu, S. Effect of music listening on physiological condition, mental workload, and driving performance with consideration of driver temperament. Int. J. Environ. Res. Public Health 2019, 16, 2766. [Google Scholar] [CrossRef] [PubMed]
- Montoro, L.; Useche, S.; Alonso, F.; Cendales, B. Work environment, stress, and driving anger: A structural equation model for predicting traffic sanctions of public transport drivers. Int. J. Environ. Res. Public Health 2018, 15, 497. [Google Scholar] [CrossRef] [PubMed]
- Ge, Y.; Qu, W.; Jiang, C.; Du, F.; Sun, X.; Zhang, K. The effect of stress and personality on dangerous driving behavior among Chinese drivers. Accid. Anal. Prev. 2014, 73, 34–40. [Google Scholar] [CrossRef] [PubMed]
- Šucha, M.; Černochová, D. Driver personality as a valid predictor of risky driving. Transp. Res. Procedia 2016, 14, 4286–4295. [Google Scholar] [CrossRef]
- Xu, J.; Liu, J.; Sun, X.; Zhang, K.; Qu, W.; Ge, Y. The relationship between driving skill and driving behavior: Psychometric adaptation of the driver skill inventory in China. Accid. Anal. Prev. 2018, 120, 92–100. [Google Scholar] [CrossRef]
- Qu, W.; Ge, Y.; Xiong, Y.; Carciofo, R.; Zhao, W.; Zhang, K. Dangerous driving in a Chinese sample: Associations with morningness-eveningness preference and personality. PLoS ONE 2015, 10, e116717. [Google Scholar]
- Parr, M.N.; Ross, L.A.; McManus, B.; Bishop, H.J.; Wittig, S.M.O.; Stavrinos, D. Differential impact of personality traits on distracted driving behaviors in teens and older adults. Accid. Anal. Prev. 2016, 92, 107–112. [Google Scholar] [CrossRef]
- Zhang, H.; Qu, W.; Ge, Y.; Sun, X.; Zhang, K. Effect of personality traits, age and sex on aggressive driving: Psychometric adaptation of the driver aggression indicators scale in China. Accid. Anal. Prev. 2017, 103, 29–36. [Google Scholar] [CrossRef] [PubMed]
- Dahlen, E.R.; Edwards, B.D.; Tubré, T.; Zyphur, M.J.; Warren, C.R. Taking a look behind the wheel: An investigation into the personality predictors of aggressive driving. Accid. Anal. Prev. 2012, 45, 1–9. [Google Scholar] [CrossRef] [PubMed]
- Eboli, L.; Mazzulla, G.; Pungillo, G. How to define the accident risk level of car drivers by combining objective and subjective measures of driving style. Transp. Res. Part F Traffic Psychol. Behav. 2017, 49, 29–38. [Google Scholar] [CrossRef]
- Eboli, L.; Mazzulla, G.; Pungillo, G. How drivers’ characteristics can affect driving style. Transp. Res. Procedia 2017, 27, 945–952. [Google Scholar] [CrossRef]
- Nogueira, X.R.; Mennis, J. The effect of brick and granite block paving materials on traffic speed. Int. J. Environ. Res. Public Health 2019, 16, 3704. [Google Scholar] [CrossRef] [PubMed]
- Alavi, S.S.; Mohammadi, M.R.; Souri, H.; Mohammadi, K.S.; Jannatifard, F.; Sepahbodi, G. Personality, driving behavior and mental disorders factors as predictors of road traffic accidents based on logistic regression. Iran. J. Med. Sci. 2017, 42, 24–31. [Google Scholar] [PubMed]
- Gao, G.; Sun, H.; Wu, J. Activity-based trip chaining behavior analysis in the network under the parking fee scheme. Transportation 2019, 46, 647–669. [Google Scholar] [CrossRef]
- Gao, G.; Wang, Z.; Liu, X.; Li, Q.; Wang, W.; Zhang, J. Travel behavior analysis using 2016 Qingdao’s household traffic surveys and Baidu electric map API data. J. Adv. Transp. 2019, 2019, 1–18. [Google Scholar] [CrossRef]
- Linkov, V.; Zaoral, A.; Řezáč, P.; Pai, C. Personality and professional drivers’ driving behavior. Transp. Res. Part F Traffic Psychol. Behav. 2019, 60, 105–110. [Google Scholar] [CrossRef]
- Zicat, E.; Bennett, J.M.; Chekaluk, E.; Batchelor, J. Cognitive function and young drivers: The relationship between driving, attitudes, personality and cognition. Transp. Res. Part F Traffic Psychol. Behav. 2018, 55, 341–352. [Google Scholar] [CrossRef]
- Riendeau, J.; Stinchcombe, A.; Weaver, B.; Bédard, M. Personality factors are associated with simulated driving outcomes across the driving lifespan. Transp. Res. Part F Traffic Psychol. Behav. 2018, 54, 171–187. [Google Scholar] [CrossRef]
- Pham, G.; Lee, S.; Kwon, O.; Kwon, K. A watermarking method for 3D printing based on menger curvature and K-Mean clustering. Symmetry 2018, 10, 97. [Google Scholar] [CrossRef]
- Ye, L.; Zhang, X. Social network types and health among older adults in rural China: The mediating role of social support. Int. J. Environ. Res. Public Health 2019, 16, 410. [Google Scholar] [CrossRef]
- Sosnowska, J.; Kuppens, P.; De Fruyt, F.; Hofmans, J. A dynamic systems approach to personality: The personality dynamics (PersDyn) model. Personal. Individ. Differ. 2019, 144, 11–18. [Google Scholar] [CrossRef]
- Rauthmann, J.F.; Beckmann, N.; Noftle, E.E.; Sherman, R.A. Personality dynamics: A new frontier in personality psychology. Personal. Individ. Differ. 2019, 136, 1. [Google Scholar] [CrossRef]
- Hopwood, C.J.; Zimmermann, J.; Pincus, A.L.; Krueger, R.F. Connecting personality structure and dynamics: Towards a more evidence-based and clinically useful diagnostic scheme. J. Personal. Disord. 2015, 29, 431–448. [Google Scholar] [CrossRef][Green Version]
- Sulam, J.; Romano, Y.; Talmon, R. Dynamical system classification with diffusion embedding for ECG-based person identification. Signal Process. 2017, 130, 403–411. [Google Scholar] [CrossRef]
- Orom, H.; Cervone, D. Personality dynamics, meaning, and idiosyncrasy: Identifying cross-situational coherence by assessing personality architecture. J. Res. Personal. 2009, 43, 228–240. [Google Scholar] [CrossRef]
- Gao, G.; Sun, H.; Wu, J.; Liu, X.; Chen, W. Park-and-ride service design under a price-based tradable credits scheme in a linear monocentric city. Transp. Policy 2018, 68, 1–12. [Google Scholar] [CrossRef]
- Christensen, D.S.; Flensborg-Madsen, T.; Garde, E.; Hansen, A.M.; Mortensen, E.L. Big Five personality traits and allostatic load in midlife. Psychol. Health 2019, 34, 1011–1028. [Google Scholar] [CrossRef] [PubMed]
- Alavi, S.S.; Mohammadi, M.R.; Soori, H.; Ghanizadeh, M. The cognitive and psychological factors (personality, driving behavior, and mental illnesses) as predictors in traffic violations. Iran. J. Psychiatry 2017, 12, 78–86. [Google Scholar] [PubMed]
- Costa, P.T., Jr.; McCrae, R.R. Normal personality assessment in clinical practice: The NEO personality inventory. Psychol. Assess. 1992, 4, 5–13. [Google Scholar] [CrossRef]
- McCrae, R.R.; Costa, P.T., Jr. Personality trait structure as a human universal. Am. Psychol 1997, 52, 509–516. [Google Scholar] [CrossRef] [PubMed]


| Personality | Characteristics |
|---|---|
| Neuroticism | Anxiety, hostility, and impulsiveness [44] |
| Extroversion | Excitement seeking, activity, and warmth [44] |
| Openness | Fantasy, actions, and ideas [44] |
| Conscientiousness | Order, dutifulness, and self-discipline [45] |
| Agreeableness | Trust, altruism, and compliance [45] |
| Index | Symbolic Representation | Description |
|---|---|---|
| Response time | RT | This index was used to represent the driver’s reaction ability. The reaction time specifically refers to the time interval experienced by the driver from the time of the start of the stimulation to the time when he makes response. For example, the reaction time can refer to the time interval from the time when the brake light of front vehicle is on to when the driver steps on the brake pedal. |
| Standard deviation of speed | SDS | This indicator was used to characterize the degree of speed fluctuations in each segment, specifically the standard deviation. |
| Difference of average velocity | This indicator was used to characterize the difference in mean velocity between each segment and the entire driving process. |
| K-Mean | Center of the Cluster | Minimum/Maximum of the Indexes | ||||
|---|---|---|---|---|---|---|
| Personality | RT | SDS | RT | SDS | ||
| Conscientiousness | 2.570 | 2.342 | −1.947 | 2.15/3.91 | 0/6.787 | −4.941/4.749 |
| Extroversion | 2.043 | 3.862 | 8.962 | 0.6/2.81 | 0.625/8.956 | 4.876/16.189 |
| Agreeableness | 2.987 | 2.797 | −9.107 | 3.45/5.1 | 0.842/14.031 | −15.457/−5.007 |
| Neuroticism | 2.525 | 12.543 | 11.392 | 0.8/3.03 | 7.672/15.497 | −4.032/18.607 |
| Openness | 3.314 | 10.945 | −1.529 | 2.8/5.44 | 6.579/12.864 | −9.762/4.897 |
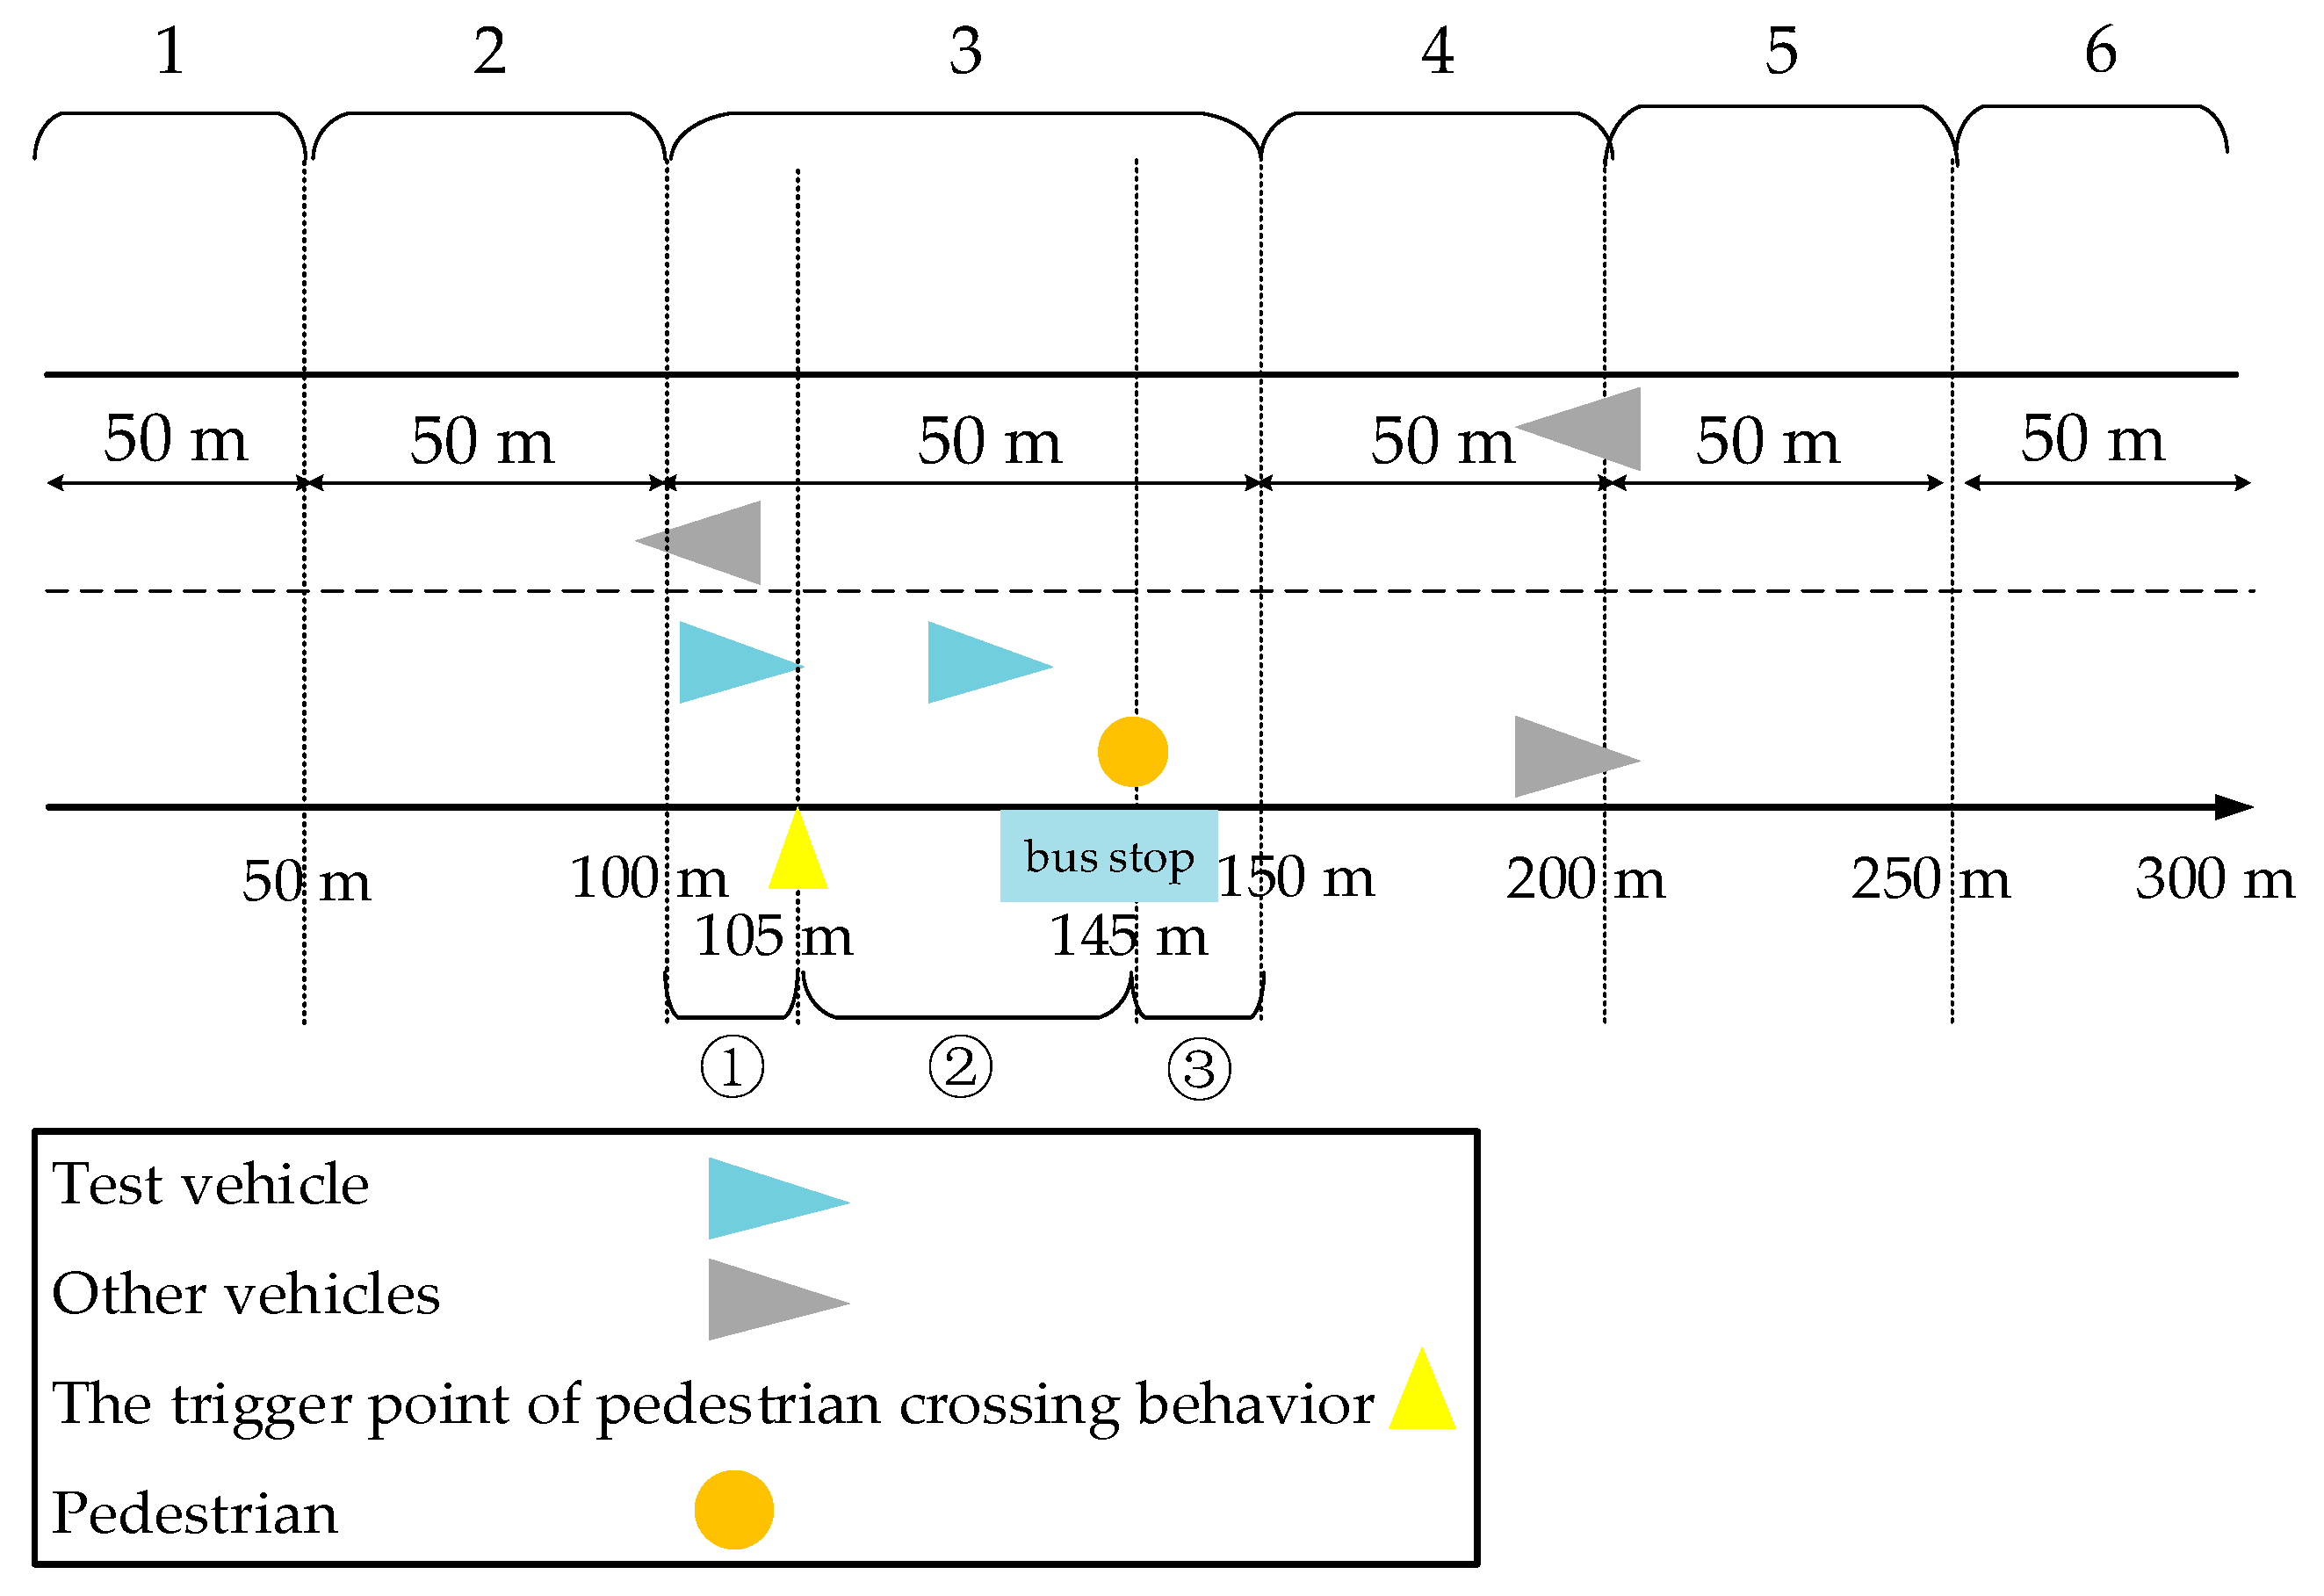
| Segment | Description |
|---|---|
| 1 | The tested driver starts to drive with speed limit of 50 km/h |
| 2 | Maintain or adjust speed |
| 3 | ① When the driver reaches 105 m, the pedestrian starts to cross the street ② The interaction stage between driver and pedestrian. The driver adjusts driving behavior to Avoid collision ③ The interaction is completed, and the driver continuously slows down or maintains the original behavior |
| 4 | Return to acceleration |
| 5 | Continue driving |
| 6 | Continue driving |
| Index | Segment | Extroversion | Conscientiousness | Agreeableness | Neuroticism | Openness | |||||
|---|---|---|---|---|---|---|---|---|---|---|---|
| Risk Scenario | Risk Scenario | Risk Scenario | Risk Scenario | Risk Scenario | |||||||
| Low | High | Low | High | Low | High | Low | High | Low | High | ||
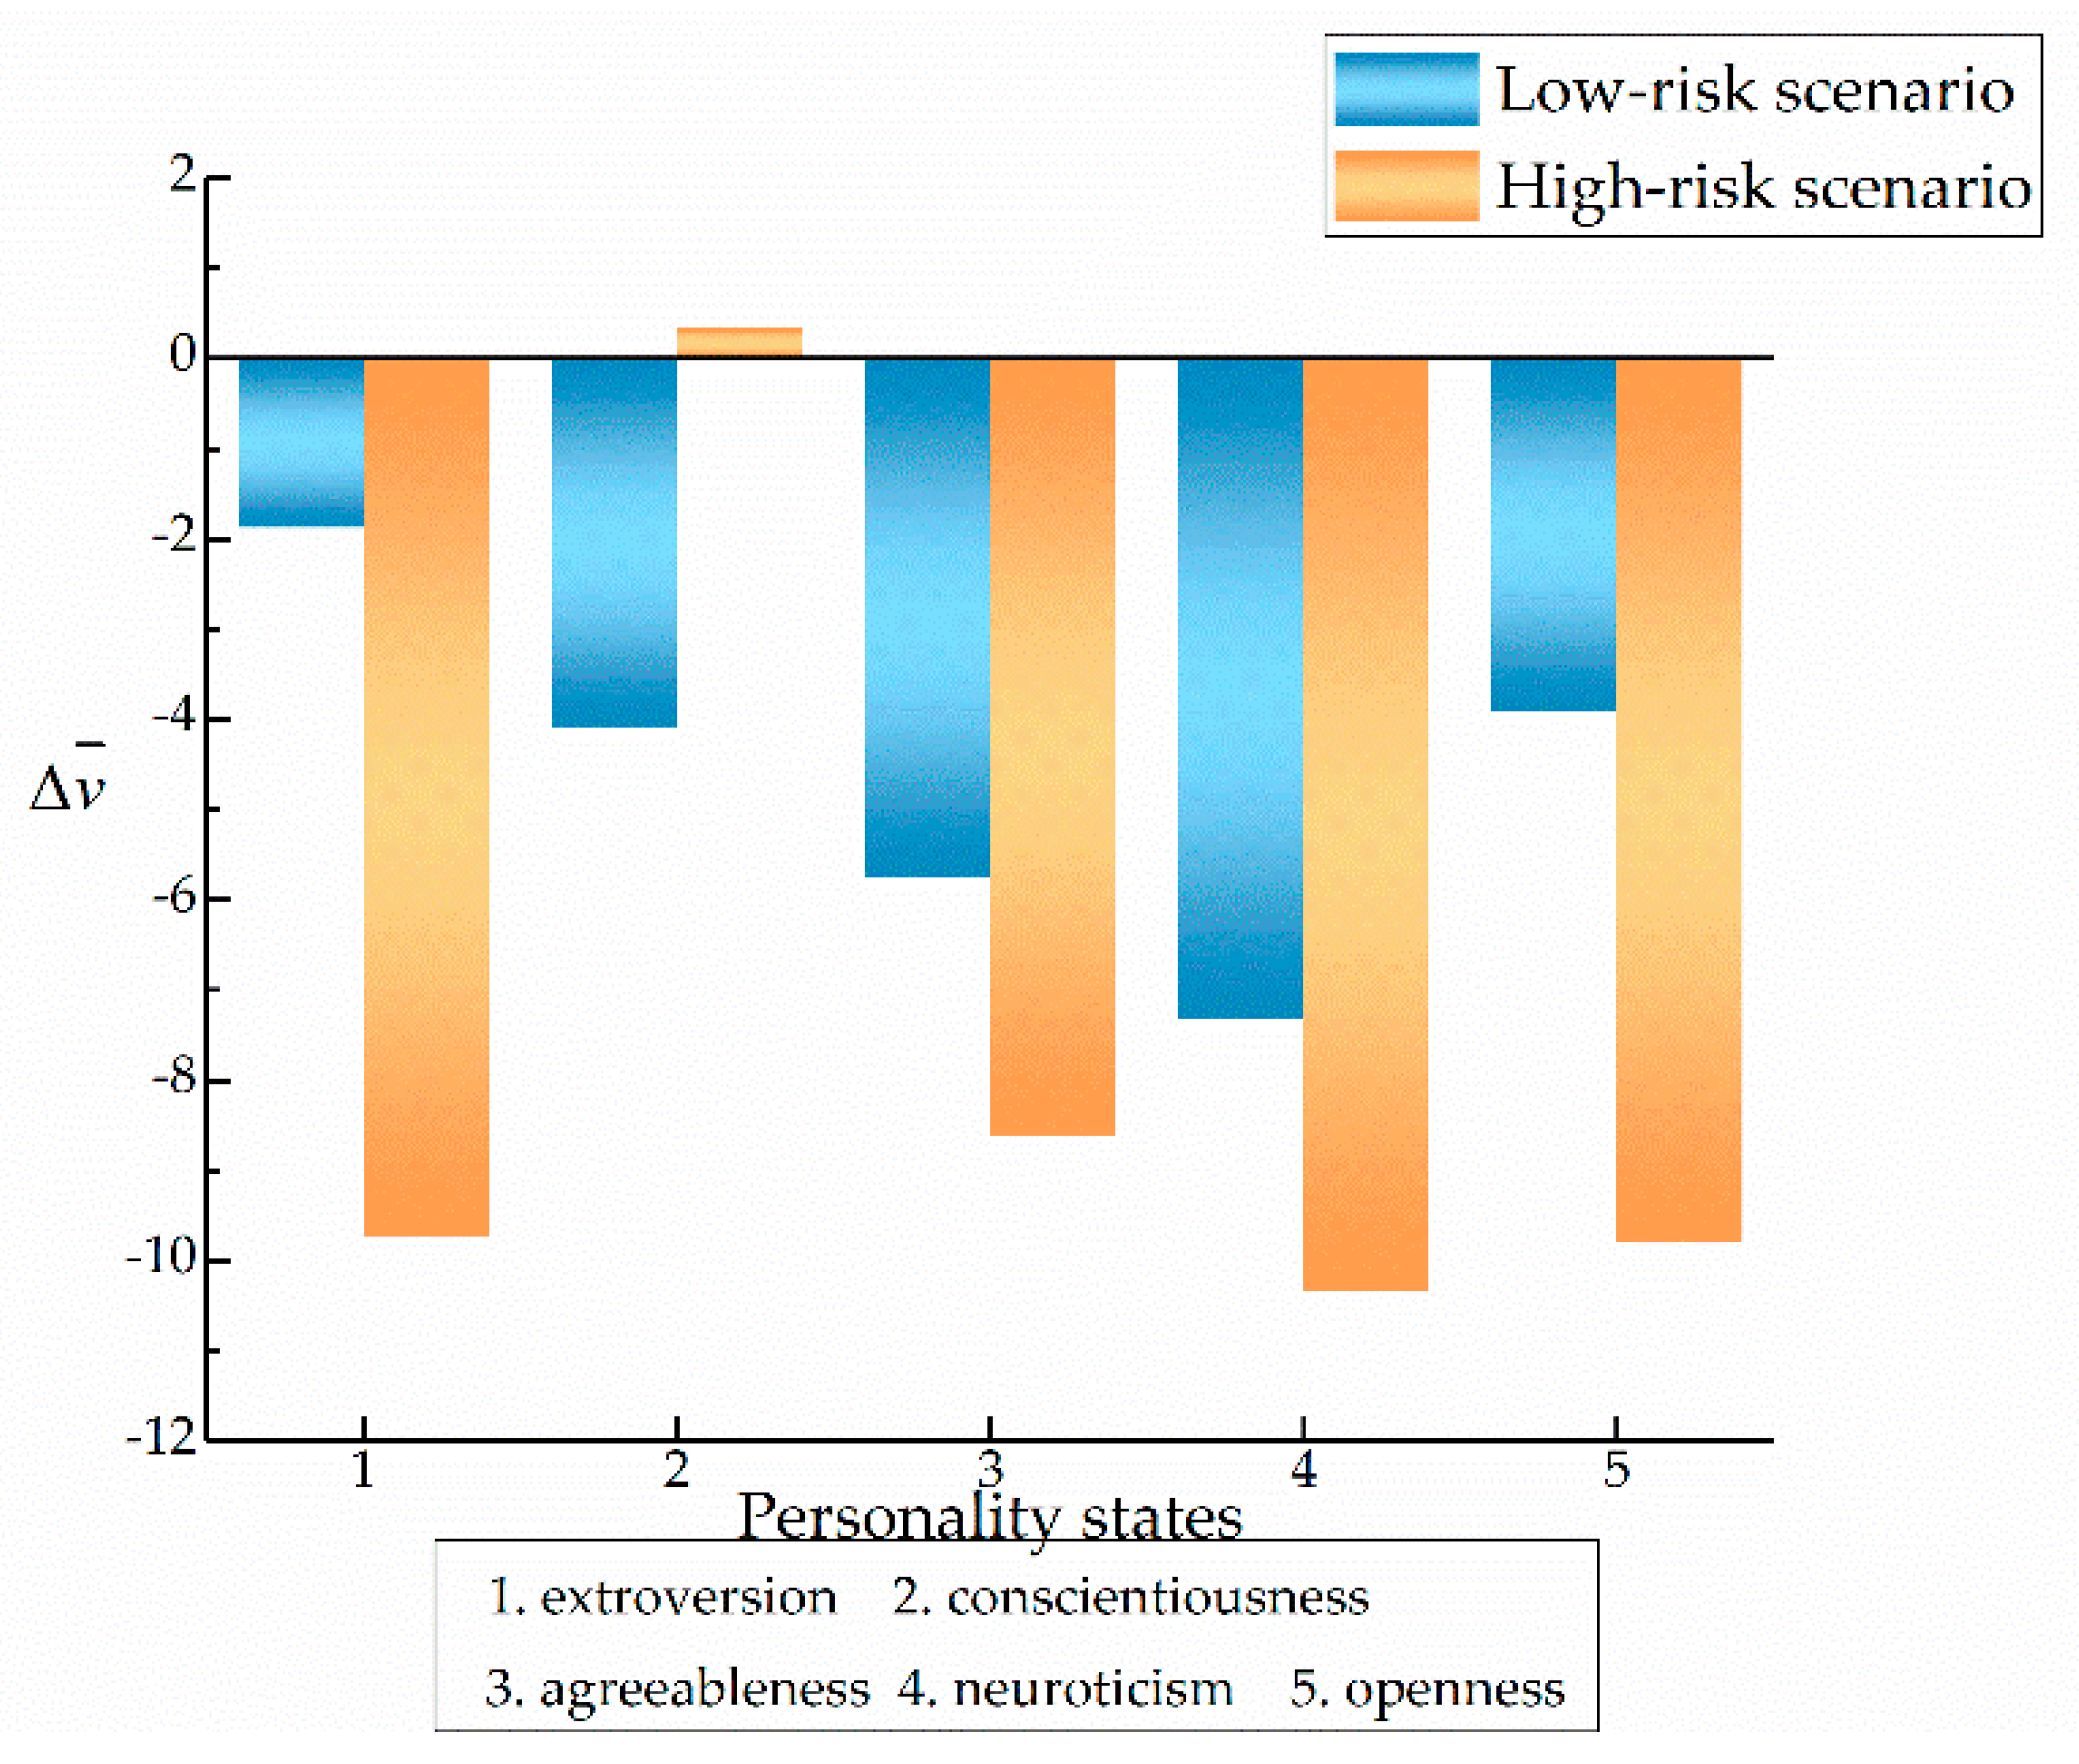
| Difference of average velocity () | 2 | 9.89 | 11.774 | 5.111 | 9.565 | 15.742 | 14.117 | 12.475 | 12.913 | 12.45 | 15.742 |
| 3 | −1.874 | −9.734 | −4.083 | 0.358 | −5.759 | −8.607 | −7.324 | −10.332 | −3.9 | −9.794 | |
| 4 | −12.597 | 2.221 | −0.542 | −11.67 | −4.43 | 2.65 | −2.009 | 0.843 | −8.328 | −2.192 | |
| 5 | 7.695 | 15.208 | 6.123 | 1.032 | 5.964 | 13.488 | 11.981 | 17.24 | 7.579 | 15.832 | |
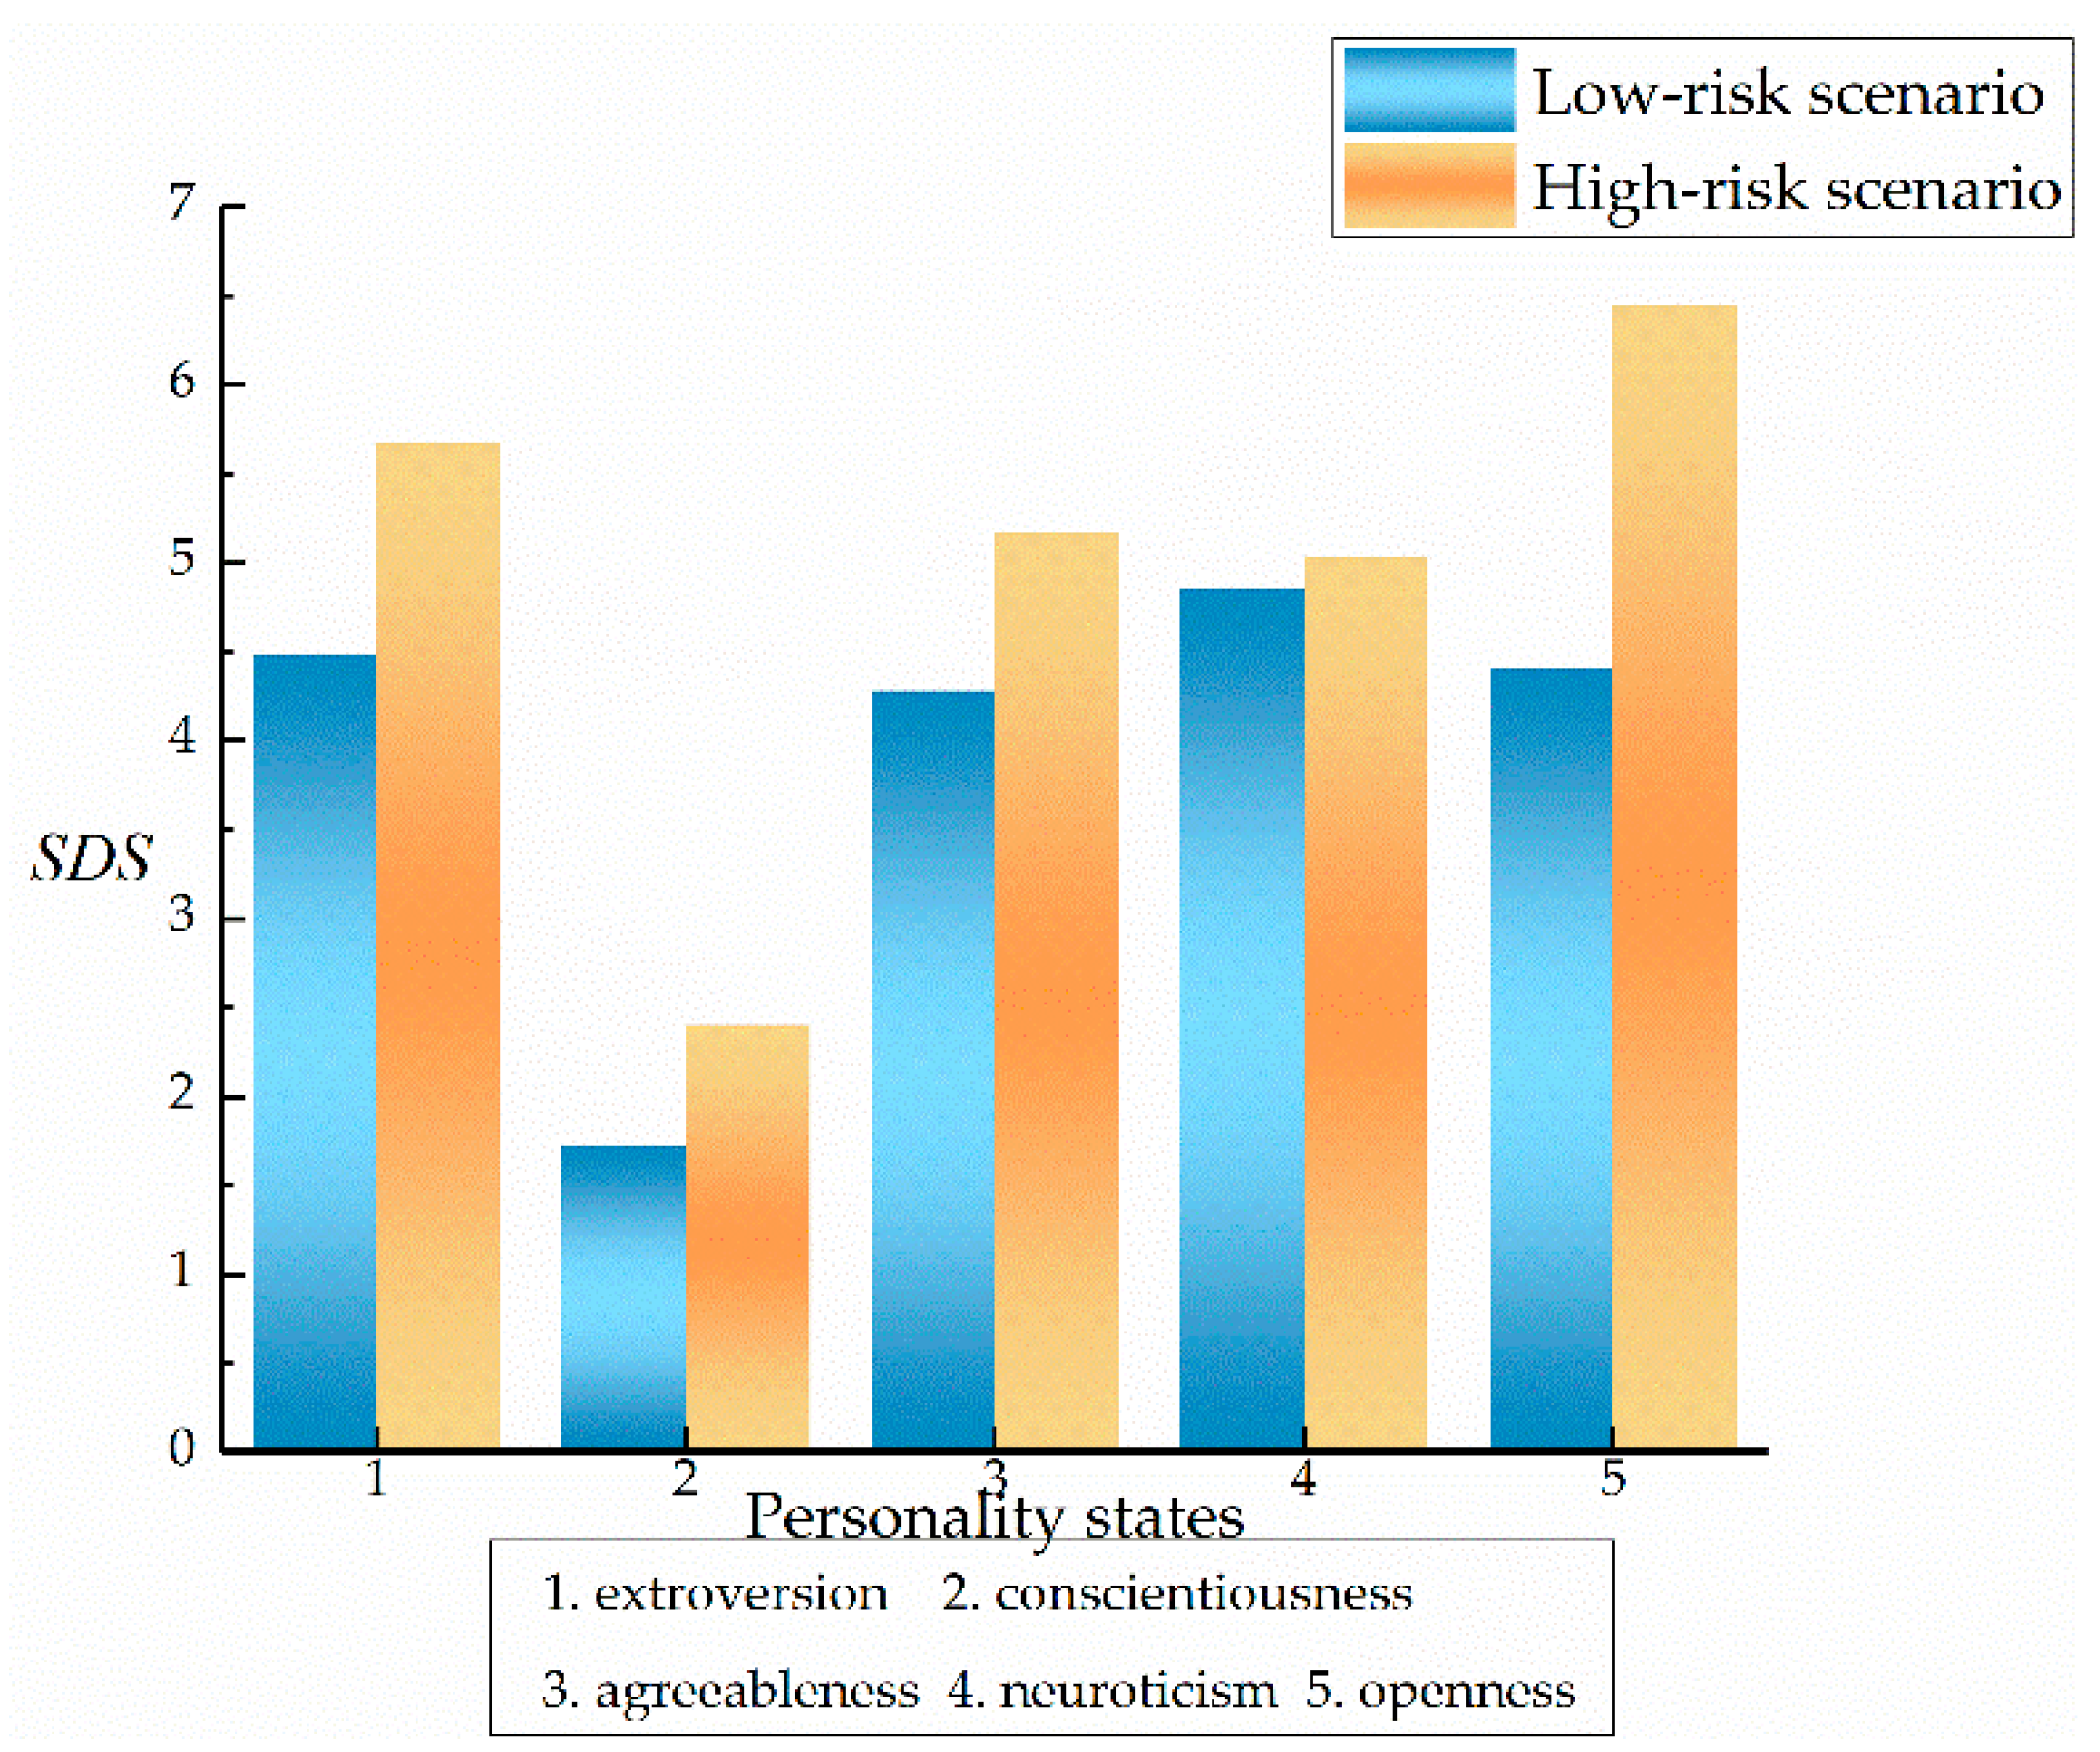
| Standard deviation of speed (SDS) | 2 | 0.741 | 0.657 | 2.082 | 0.589 | 0.594 | 1.356 | 0.301 | 4.669 | 0.76 | 0.829 |
| 3 | 4.483 | 5.669 | 1.722 | 2.403 | 4.28 | 5.166 | 4.86 | 5.035 | 4.413 | 6.452 | |
| 4 | 9.254 | 8.073 | 2.542 | 6.566 | 6.085 | 8.135 | 8.638 | 8.501 | 8.576 | 7.12 | |
| 5 | 1.77 | 1.062 | 2.331 | 2.982 | 1.534 | 1.941 | 1.574 | 1.867 | 1.996 | 2.529 | |
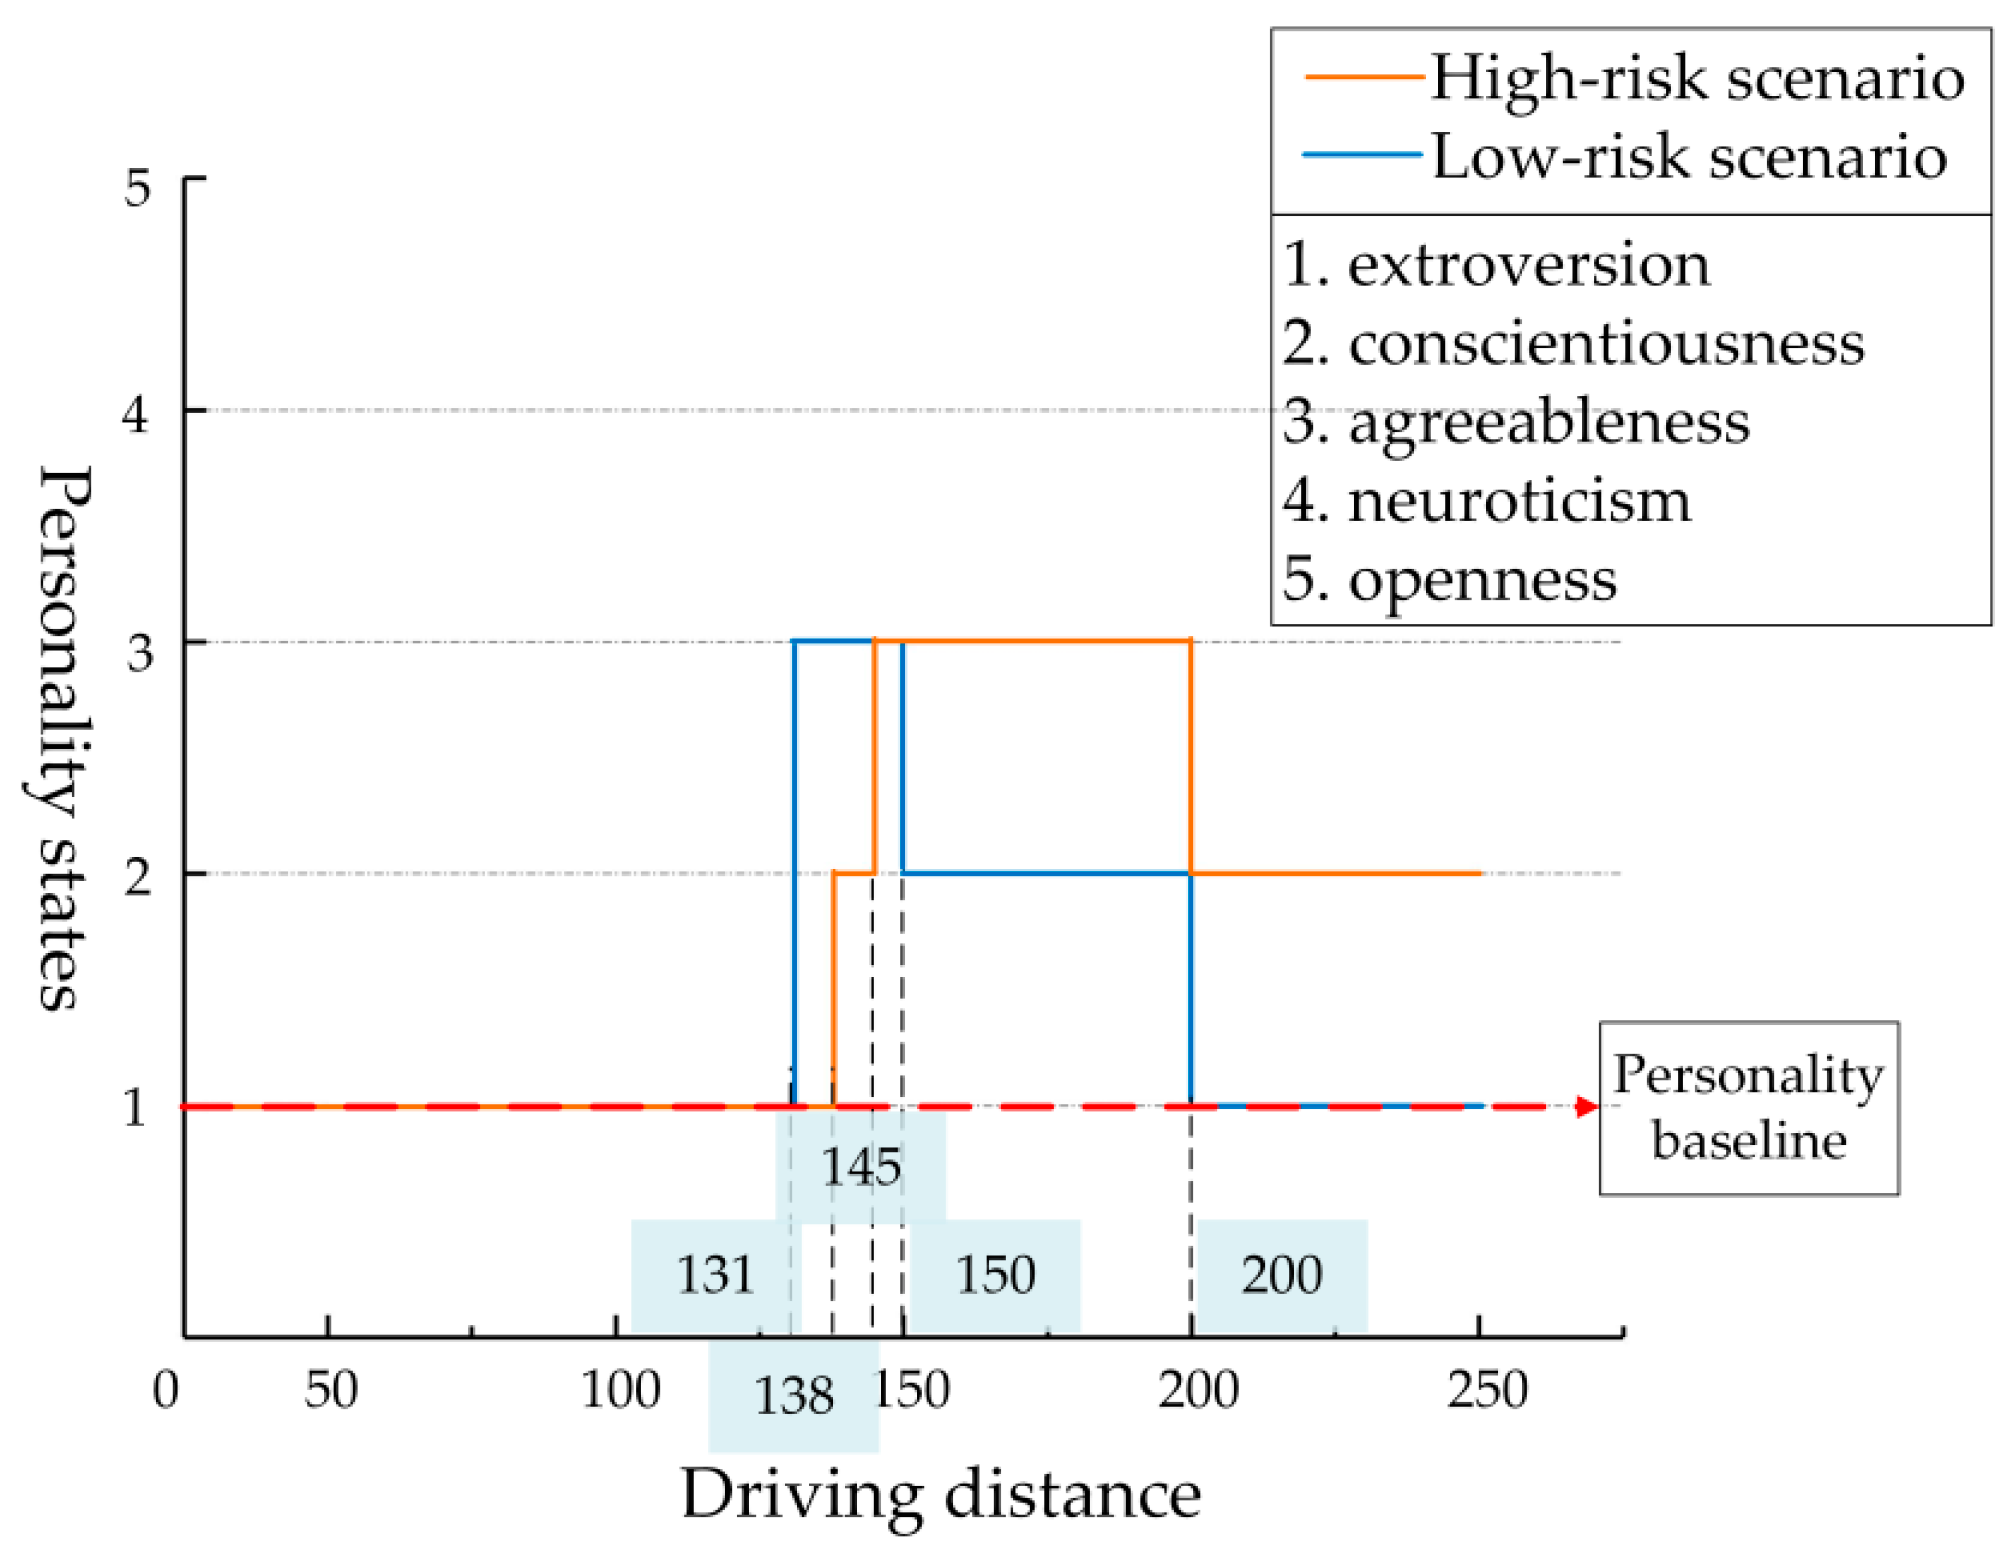
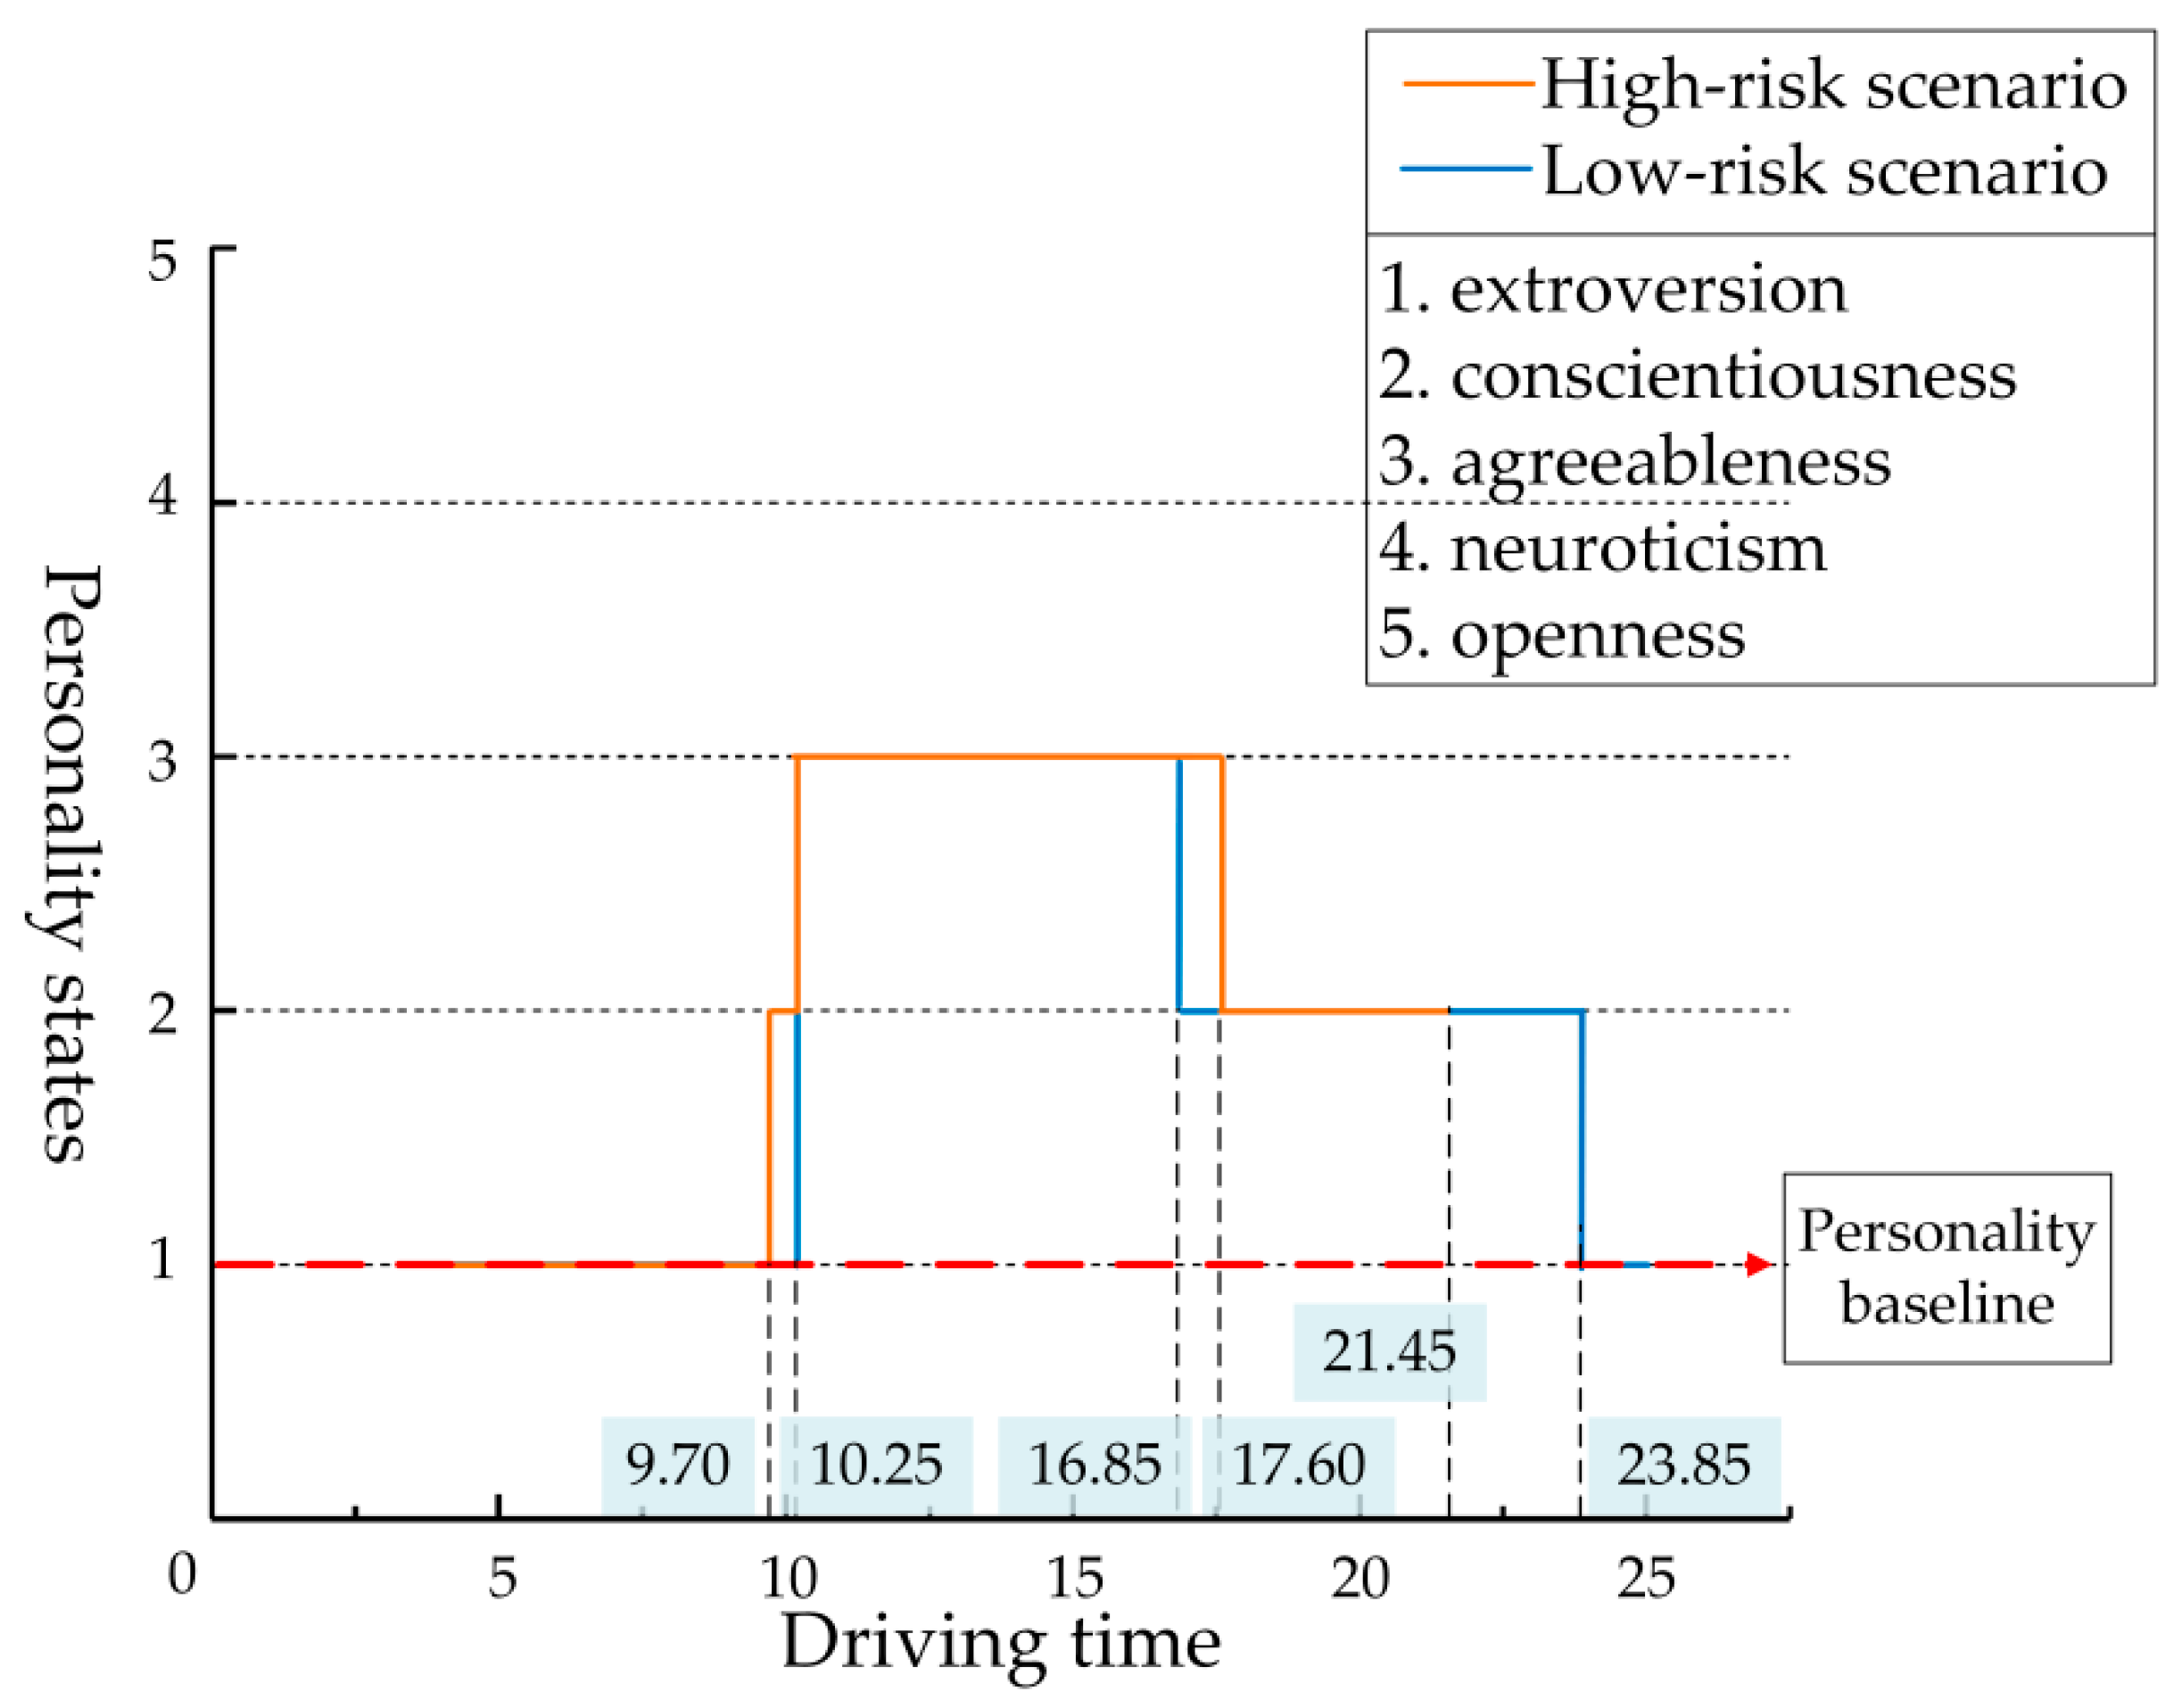
| Scenario | Segment | Distance | Time | Personality State | SDS | Average Speed | Max. Speed | Min. Speed | |
|---|---|---|---|---|---|---|---|---|---|
| High-risk scenario | 2 | 100 | 3.5–7.05 | Extroversion | 0.565 | 51.475 | 52.402 | 50.571 | |
| 3 | ② | 138 | 9.70 | Extroversion | 0.366 | 52.227 | 52.593 | 51.231 | |
| 145 | 10.25 | Conscientiousness | 3.819 | 45.100 | 50.410 | 39.037 | |||
| ③ | 150 | 10.77 | Agreeableness | 4.522 | 30.544 | 37.247 | 23.750 | ||
| 4 | 200 | 17.60 | Agreeableness | 9.306 | 26.815 | 43.303 | 13.210 | ||
| 5 | 250 | 21.45 | Conscientiousness | 1.960 | 47.052 | 50.385 | 43.509 | ||
| Low-risk scenario | 2 | 100 | 3.57–7.25 | Extroversion | 1.858 | 48.358 | 49.426 | 42.766 | |
| 3 | ② | 131 | 10.25 | Extroversion | 1.598 | 38.307 | 42.498 | 36.860 | |
| 145 | 15.35 | Agreeableness | 9.217 | 9.178 | 36.161 | 0.000 | |||
| ③ | 150 | 16.85 | Agreeableness | 1.137 | 12.355 | 14.248 | 10.451 | ||
| 4 | 200 | 23.85 | Conscientiousness | 6.679 | 25.719 | 34.637 | 14.389 | ||
| 5 | 250 | 28.57 | Extroversion | 1.826 | 38.339 | 40.839 | 34.720 | ||
© 2020 by the authors. Licensee MDPI, Basel, Switzerland. This article is an open access article distributed under the terms and conditions of the Creative Commons Attribution (CC BY) license (http://creativecommons.org/licenses/by/4.0/).
Share and Cite
Wang, F.; Zhang, J.; Wang, S.; Li, S.; Hou, W. Analysis of Driving Behavior Based on Dynamic Changes of Personality States. Int. J. Environ. Res. Public Health 2020, 17, 430. https://doi.org/10.3390/ijerph17020430
Wang F, Zhang J, Wang S, Li S, Hou W. Analysis of Driving Behavior Based on Dynamic Changes of Personality States. International Journal of Environmental Research and Public Health. 2020; 17(2):430. https://doi.org/10.3390/ijerph17020430
Chicago/Turabian StyleWang, Fanyu, Junyou Zhang, Shufeng Wang, Sixian Li, and Wenlan Hou. 2020. "Analysis of Driving Behavior Based on Dynamic Changes of Personality States" International Journal of Environmental Research and Public Health 17, no. 2: 430. https://doi.org/10.3390/ijerph17020430
APA StyleWang, F., Zhang, J., Wang, S., Li, S., & Hou, W. (2020). Analysis of Driving Behavior Based on Dynamic Changes of Personality States. International Journal of Environmental Research and Public Health, 17(2), 430. https://doi.org/10.3390/ijerph17020430