Prediction Model for Airborne Microorganisms Using Particle Number Concentration as Surrogate Markers in Hospital Environment


Abstract
1. Introduction
2. Materials and Methods
2.1. Monitoring Campaign
2.2. Airborne Bacteria and Fungi
2.3. Size-Segregated Particle Counting
2.4. Statistical Analysis
3. Results
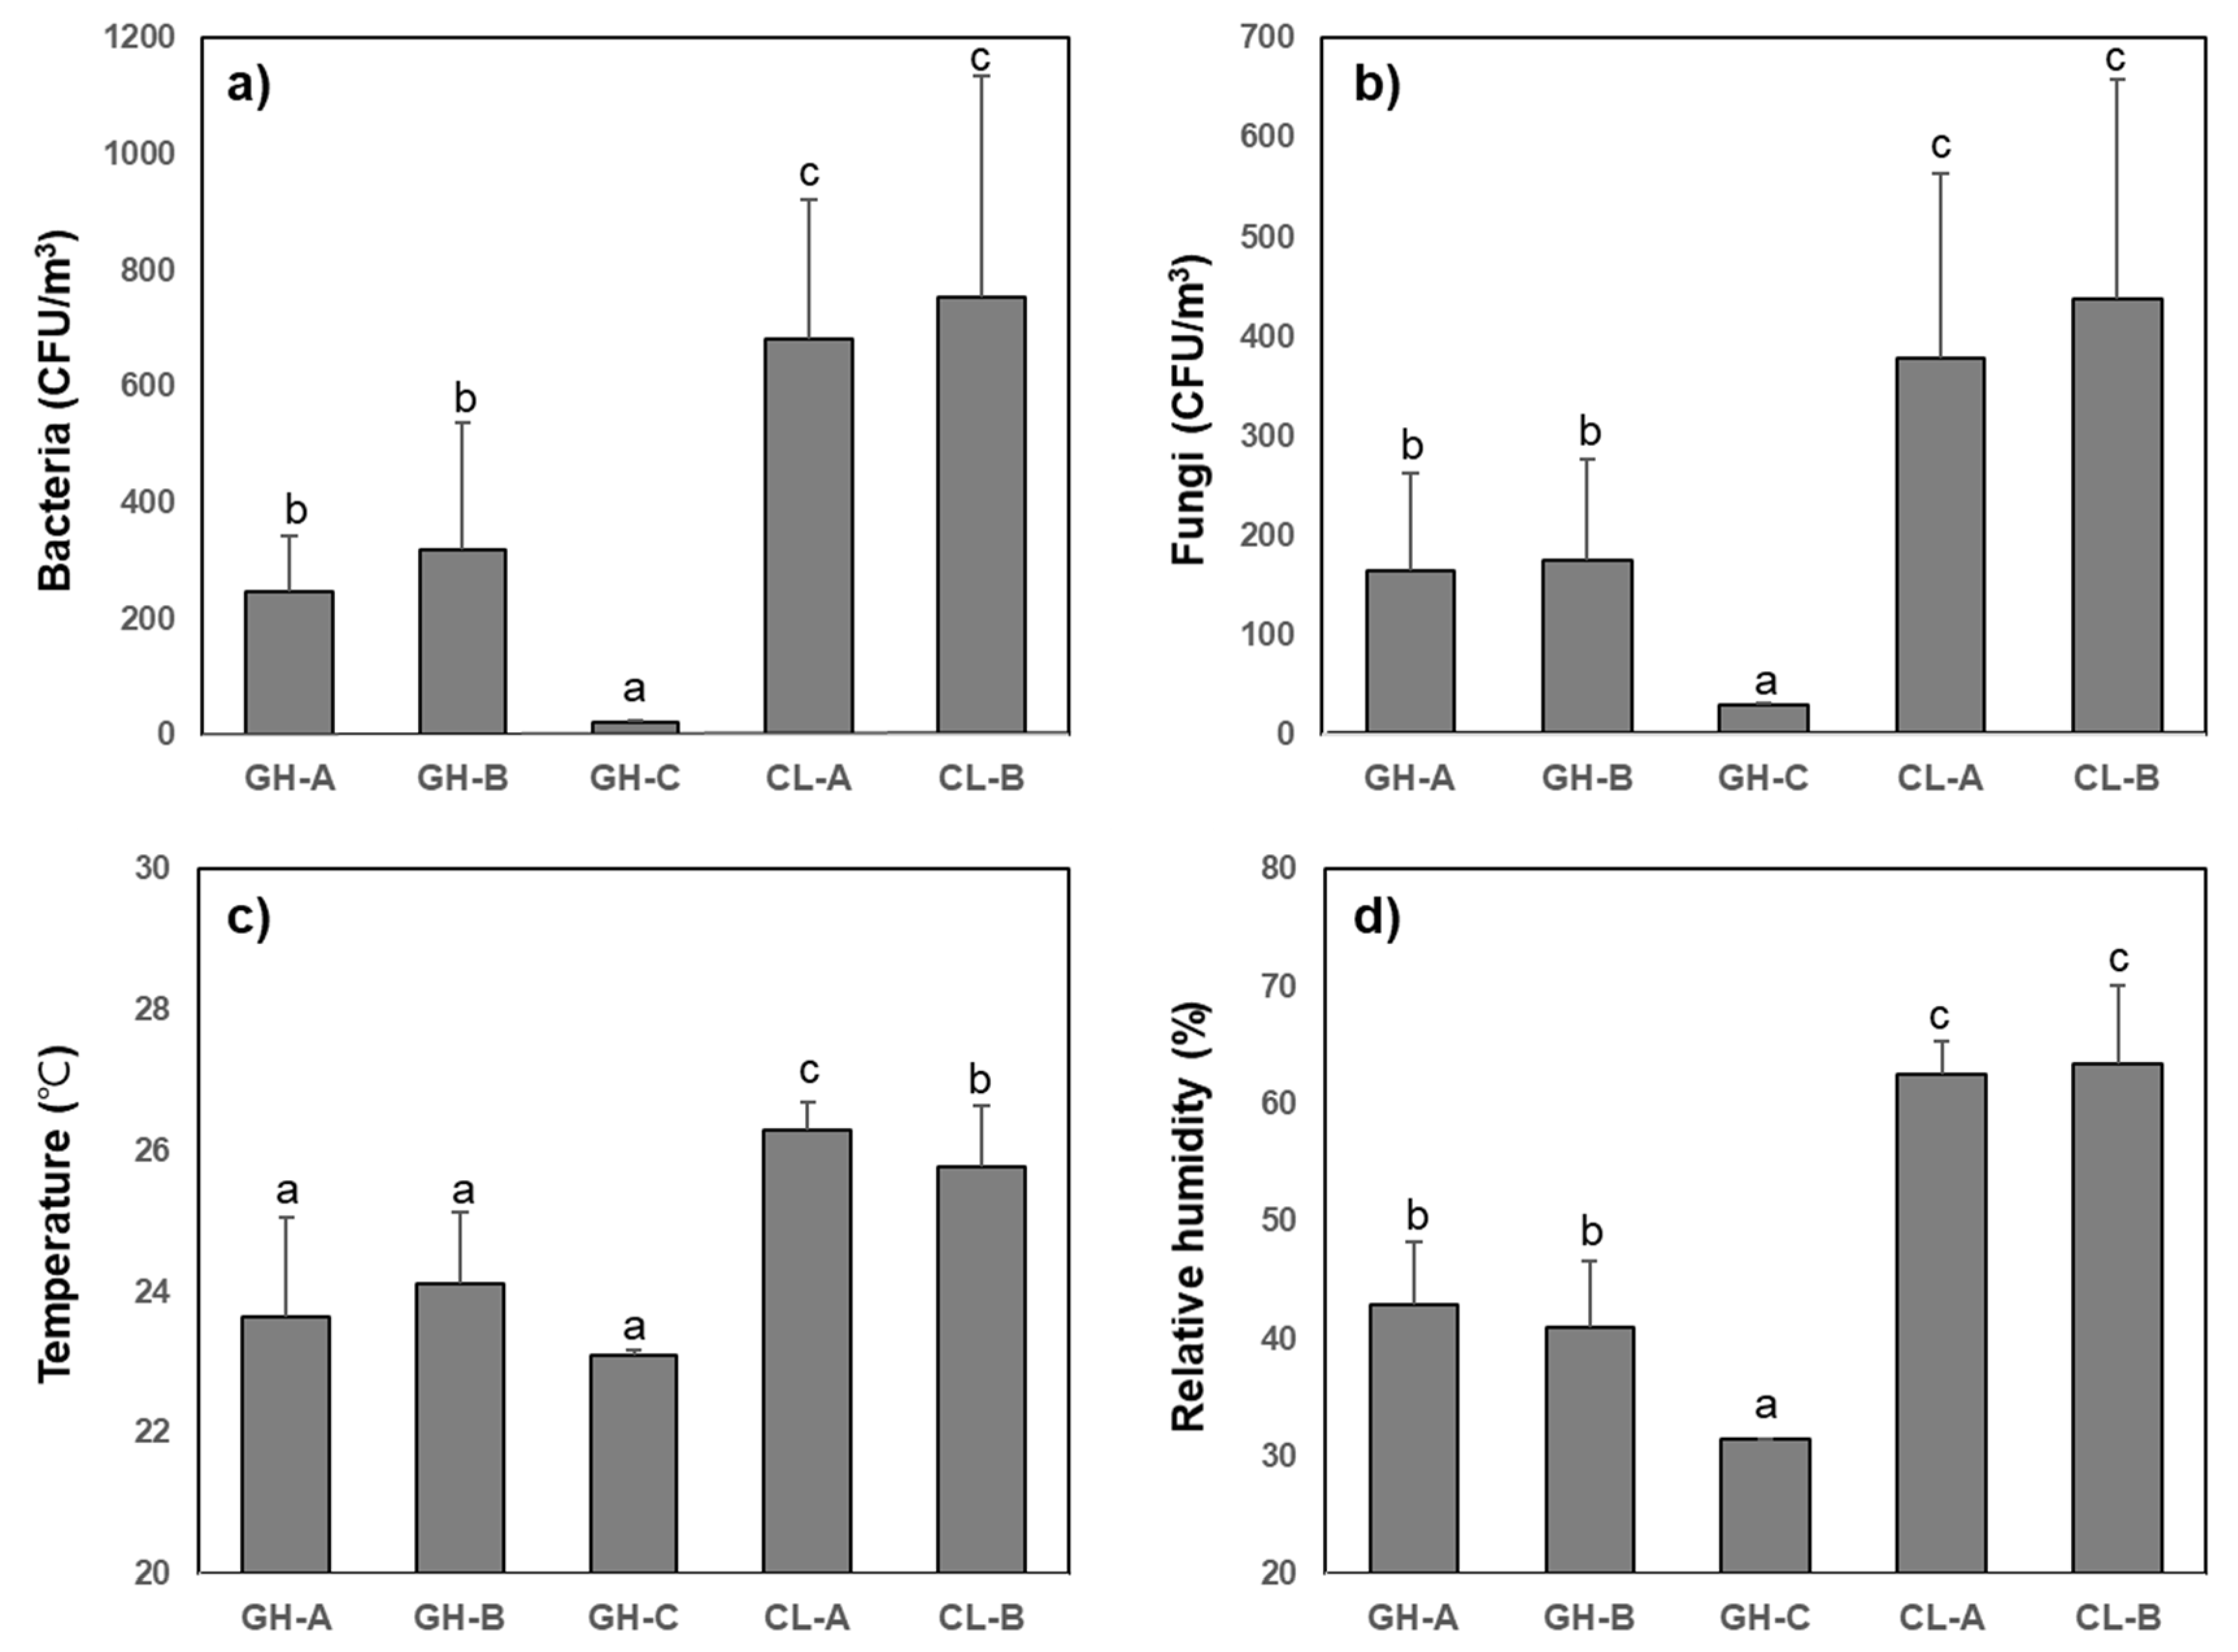
3.1. Charaterization of Bacterial and Fungal Bioaerosols
3.2. Concentration and Distribution of Size-Segregated Particles
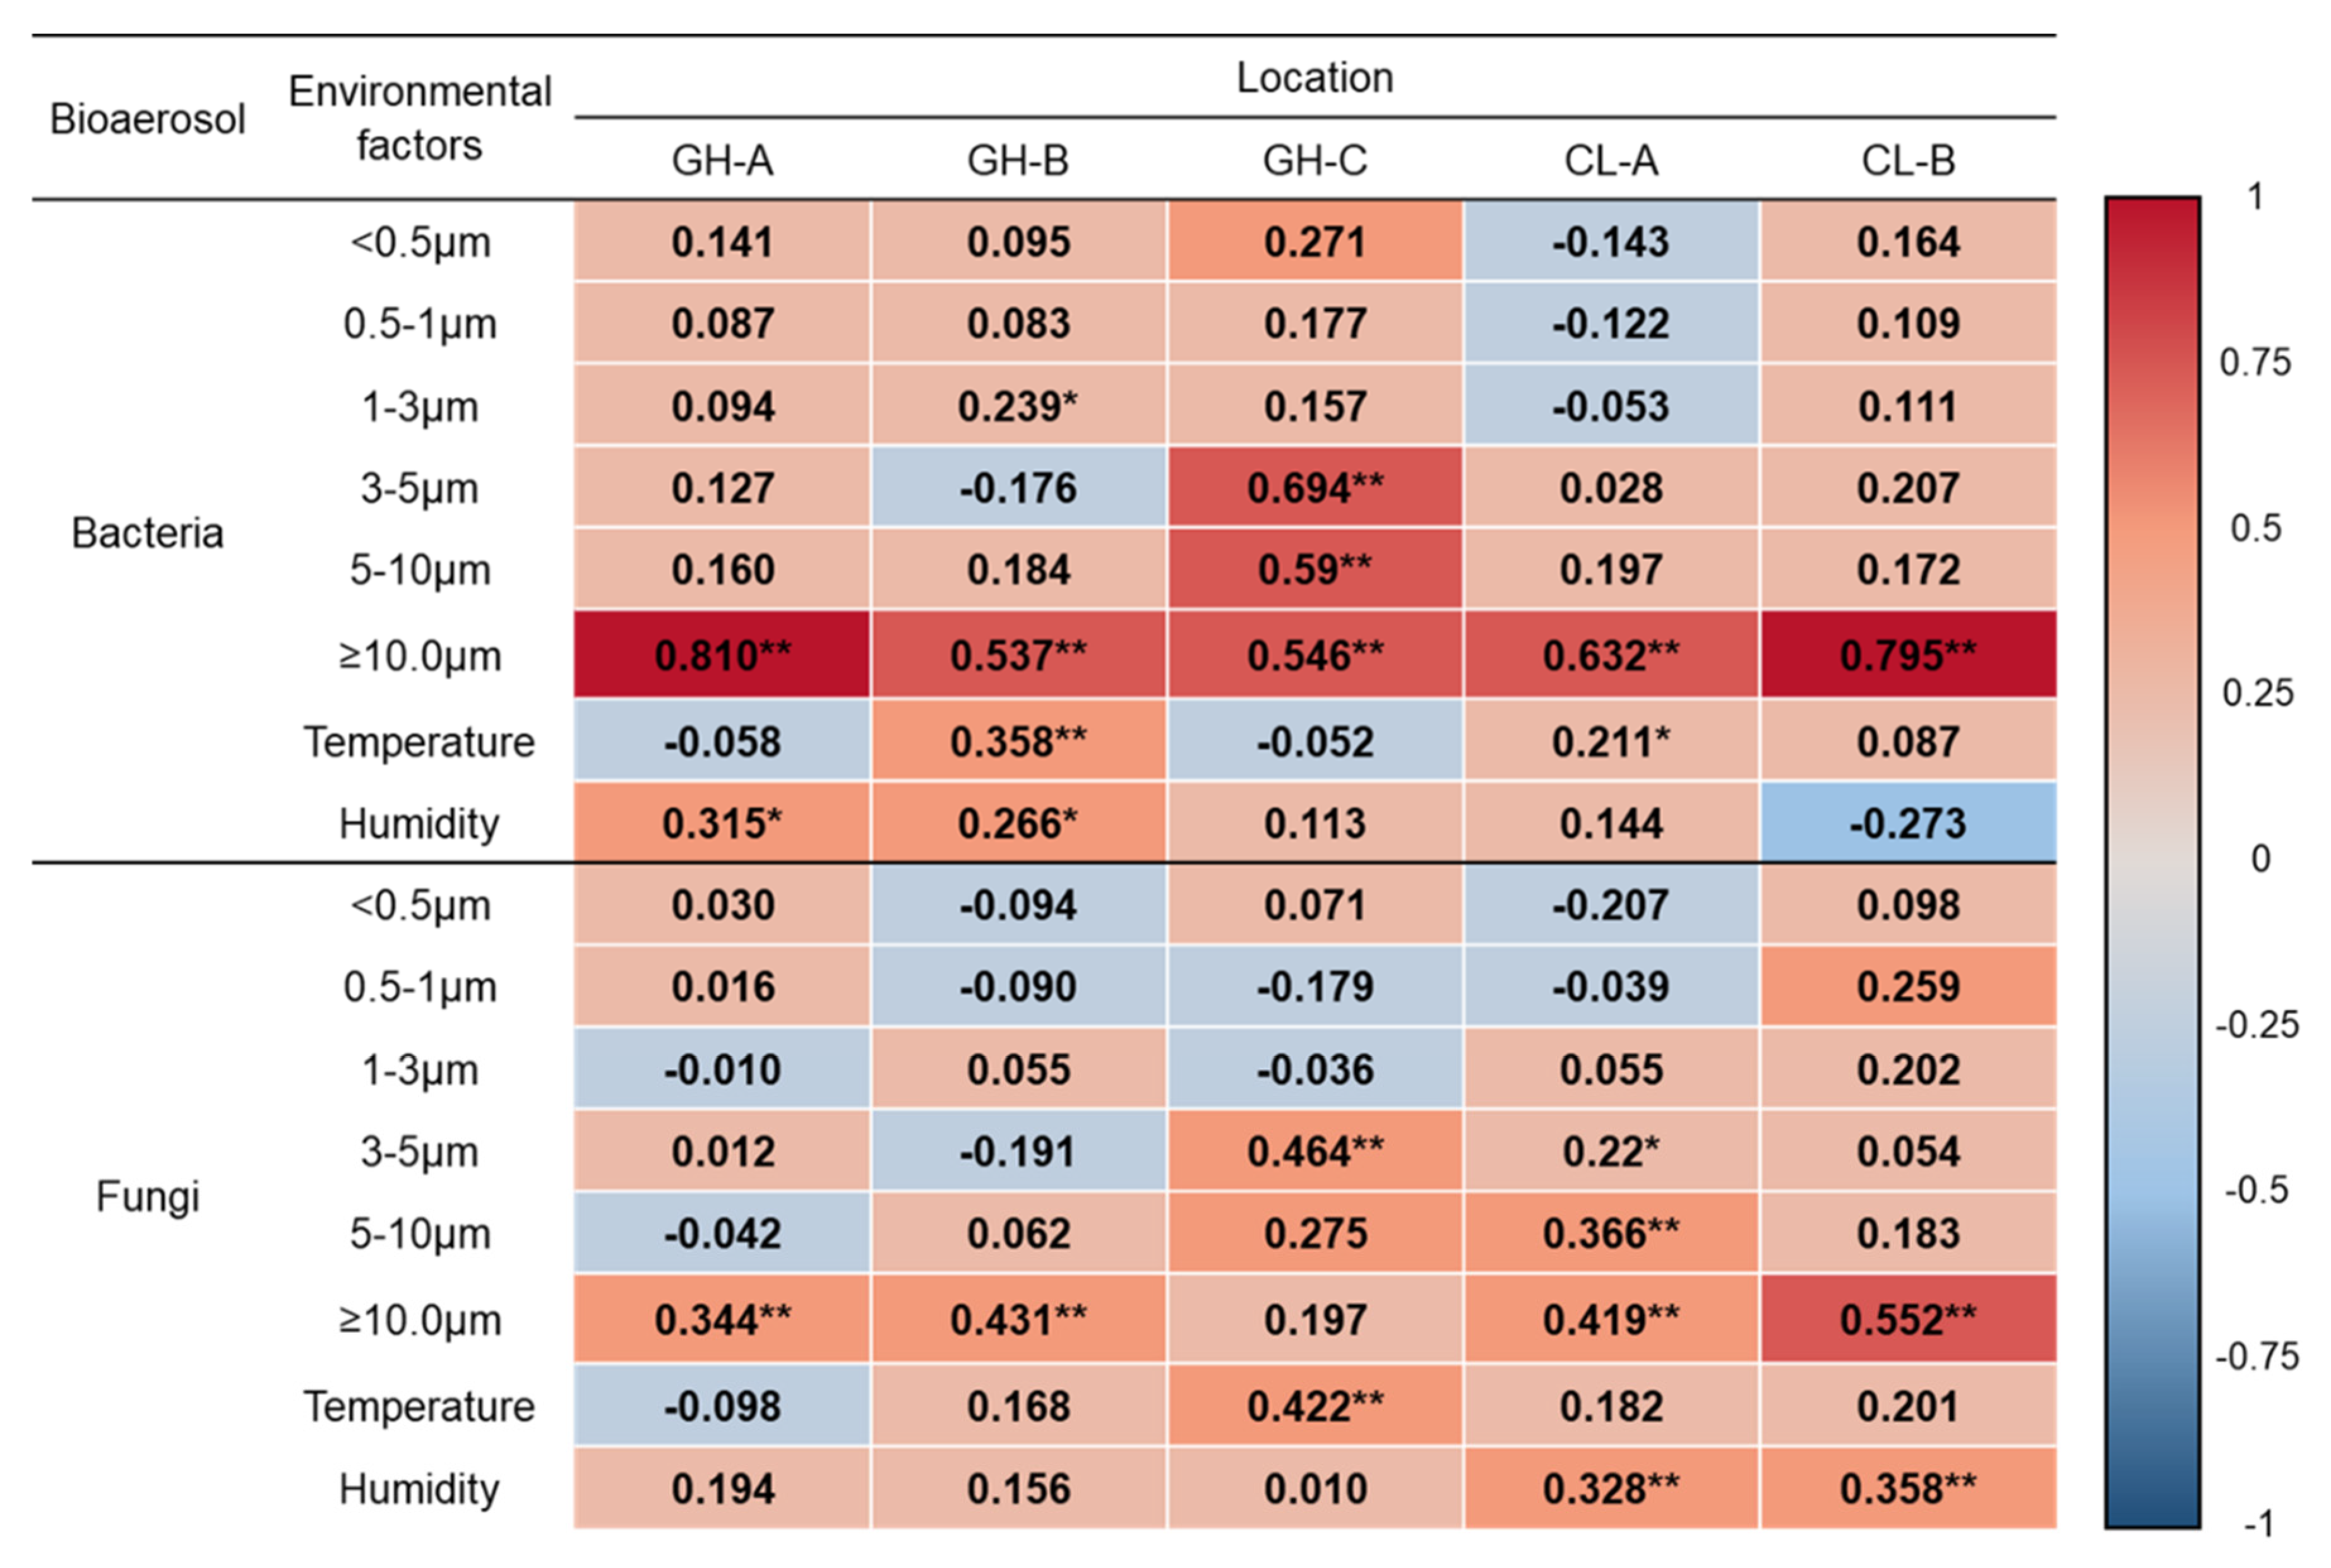
3.3. Correlation between Bioaerosols and Size-Segregated Particle Number
3.4. Prediction Models for Bacterial and Fungal Bioaerosols
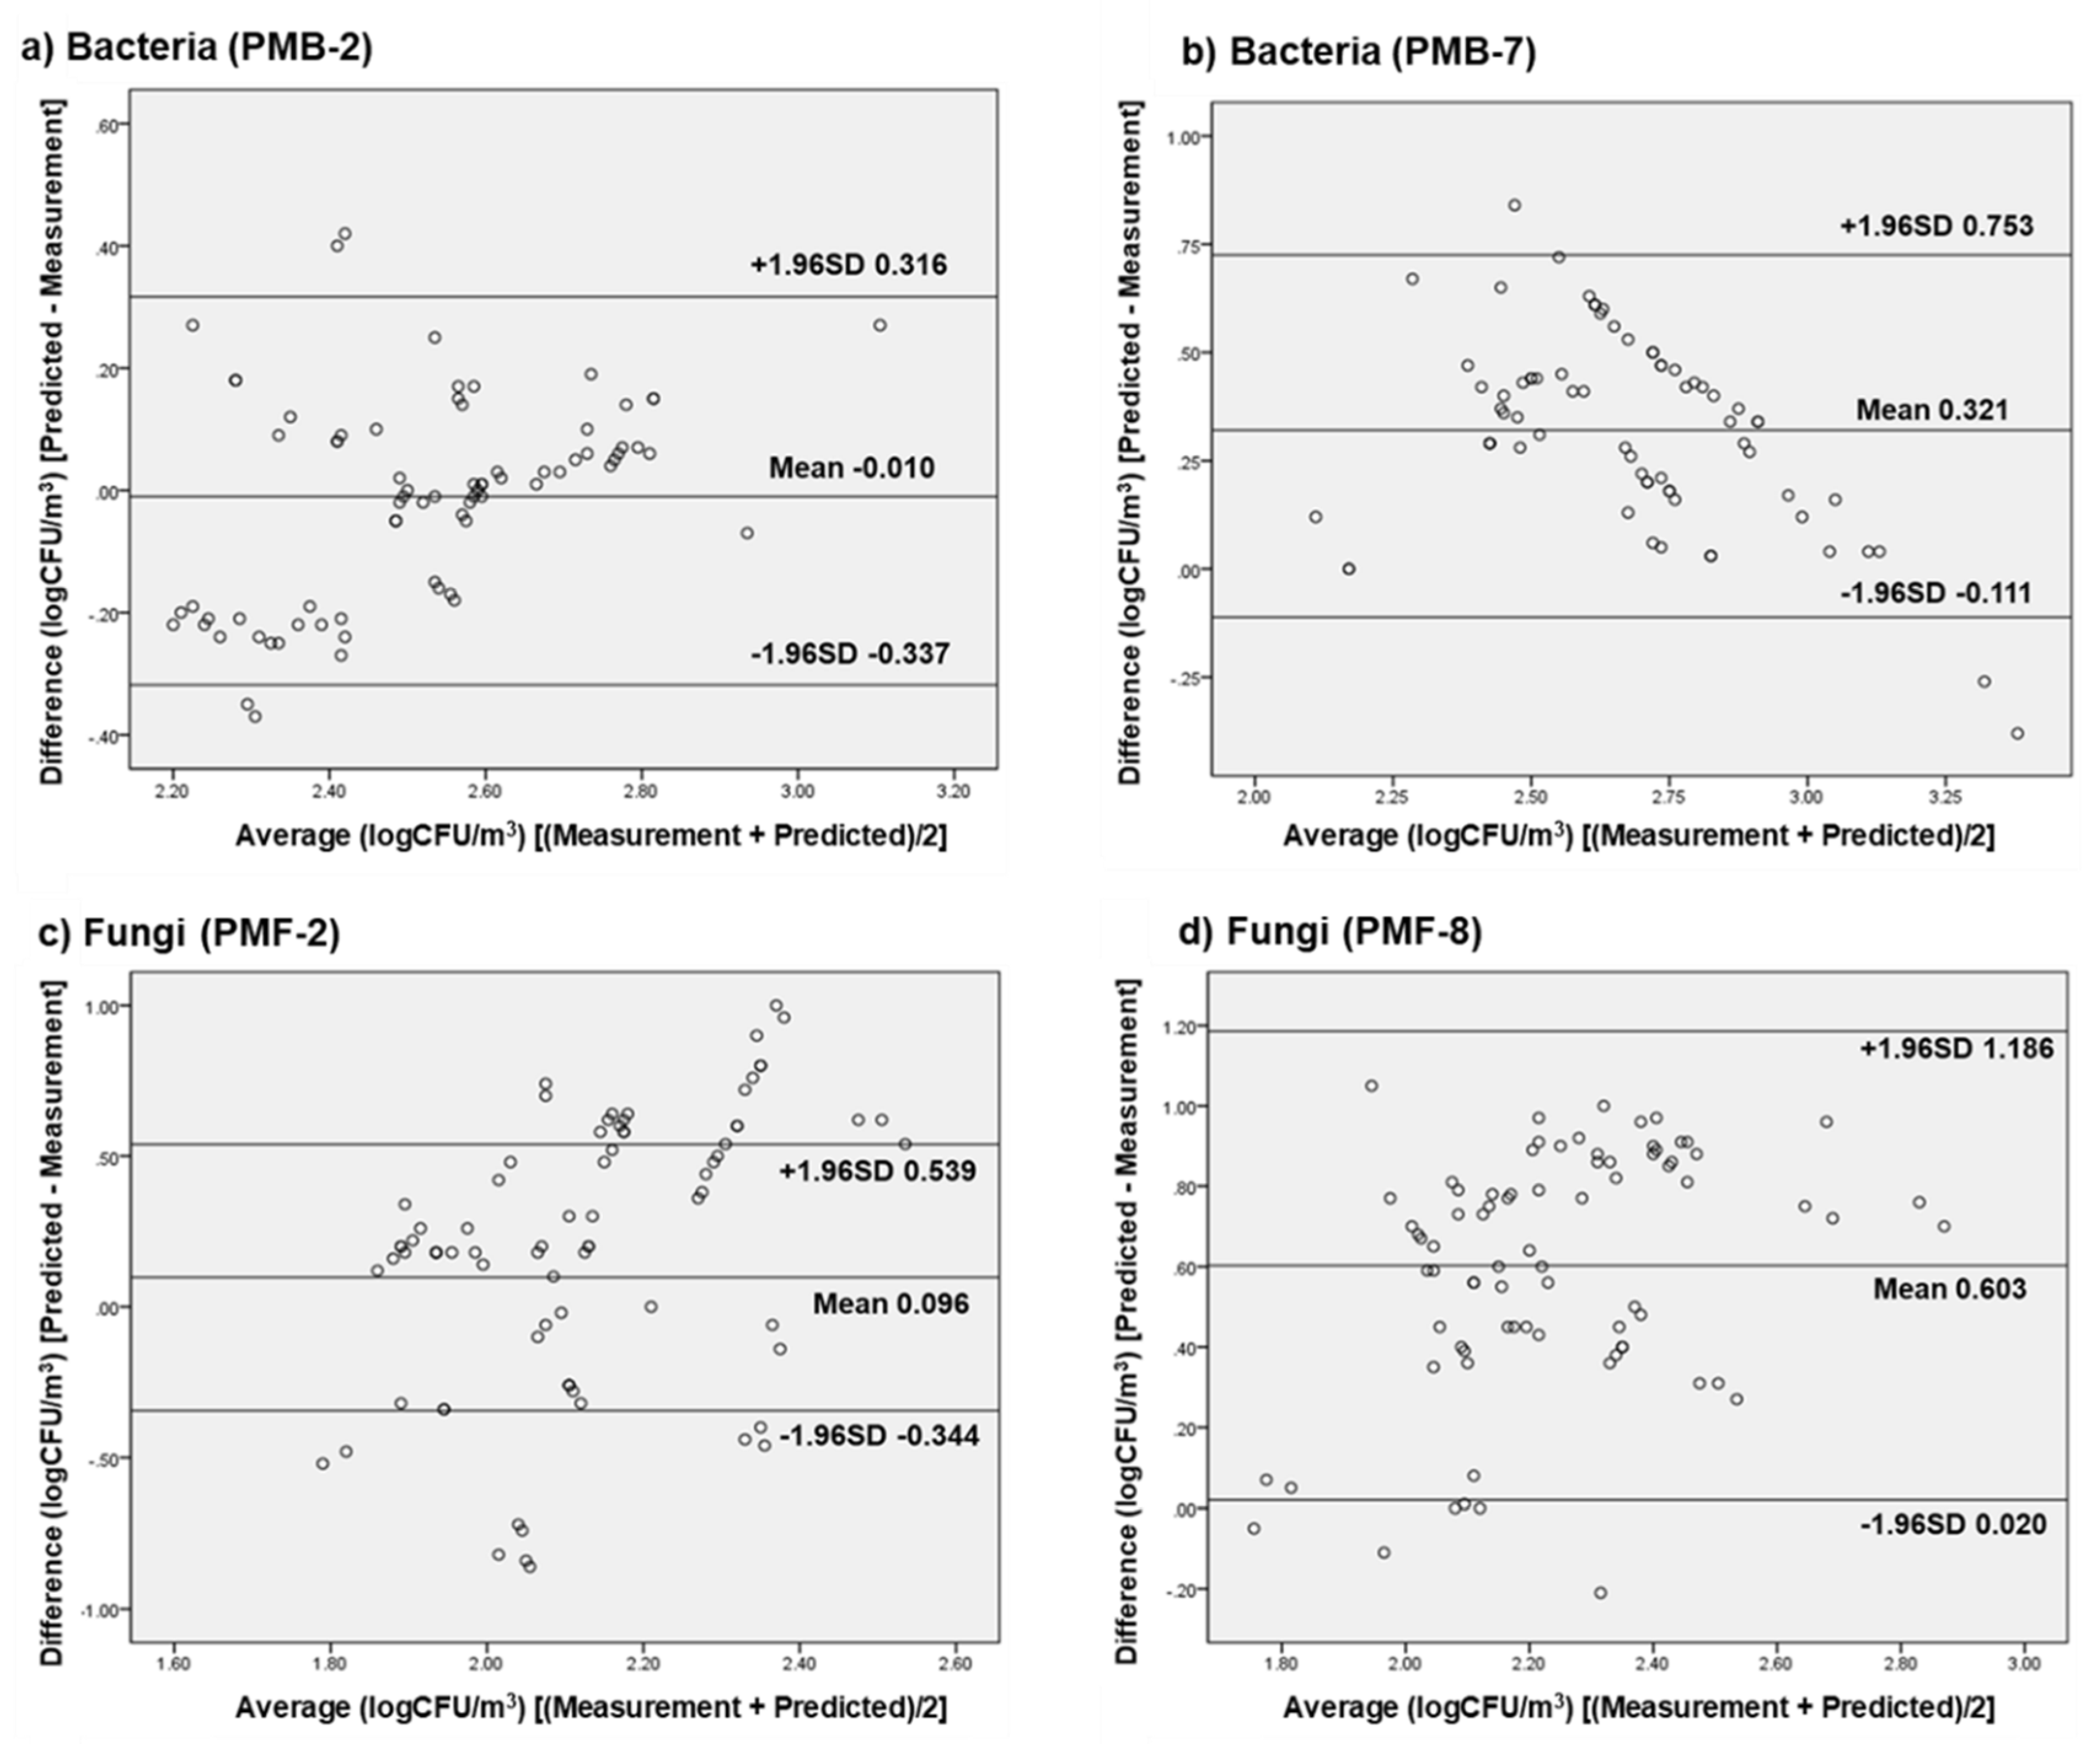
3.5. External Validation of Selected Prediction Models
4. Discussion
5. Conclusions
Author Contributions
Funding
Conflicts of Interest
References
- Sundell, J. On the history of indoor air quality and health. Indoor Air 2004, 14, 51–58. [Google Scholar] [CrossRef] [PubMed]
- Mirhoseini, S.H.; Nikaeen, M.; Satoh, K.; Makimura, K. Assessment of airborne particles in indoor environments: Applicability of particle counting for prediction of bioaerosol concentrations. Aerosol Air Qual. Res. 2016, 16, 1903–1910. [Google Scholar] [CrossRef]
- Kalogerakis, N.; Paschali, D.; Lekaditis, V.; Pantidou, A.; Eleftheriadis, K.; Lazaridis, M. Indoor air quality-bioaerosol measurements in domestic and office premises. J. Aerosol Sci. 2005, 36, 751–761. [Google Scholar] [CrossRef]
- Heo, K.J.; Kim, H.B.; Lee, B.U. Concentration of environmental fungal and bacterial bioaerosols during the monsoon season. J. Aerosol Sci. 2014, 77, 31–37. [Google Scholar] [CrossRef] [PubMed]
- Brandl, H. Bioaerosols in indoor environment-A review with special reference to residential and occupational locations. Open Environ. Boil. Monit. J. 2011, 4, 83–96. [Google Scholar] [CrossRef]
- Pastuszka, J.; Marchwinska-Wyrwal, E.; Wlazlo, A. Bacterial aerosol in Silesian hospitals: Preliminary results. Pol. J. Environ. Stud. 2005, 14, 883. [Google Scholar]
- Korea Ministry of Environment (MOE). Indoor Air Quality Management; Korea Ministry of Environment (MOE): Sejong, Korea, 2018. [Google Scholar]
- Mirhoseini, S.H.; Nikaeen, M.; Khanahmd, H.; Hatamzadeh, M.; Hassanzadeh, A. Monitoring of airborne bacteria and aerosols in different wards of hospitals-Particle counting usefulness in investigation of airborne bacteria. Ann. Agric. Environ. Med. 2015, 22, 670–673. [Google Scholar] [CrossRef] [PubMed]
- Stocks, G.W.; Self, S.D.; Thompson, B.; Adame, X.A.; O’Connor, D.P. Predicting bacterial populations based on airborne particulates: A study performed in nonlaminar flow operating rooms during joint arthroplasty surgery. Am. J. Infect. Control. 2010, 38, 199–204. [Google Scholar] [CrossRef]
- Scaltriti, S.; Cencetti, S.; Rovesti, S.; Marchesi, I.; Bargellini, A.; Borella, P. Risk factors for particulate and microbial contamination of air in operating theatres. J. Hosp. Infect. 2007, 66, 320–326. [Google Scholar] [CrossRef]
- Huang, H.-L.; Lee, M.-K.; Shih, H.-W. Assessment of indoor bioaerosols in public spaces by real-time measured airborne particles. Aerosol Air Qual. Res. 2017, 17, 2276–2288. [Google Scholar] [CrossRef]
- Landrin, A.; Bissery, A.; Kac, G. Monitoring air sampling in operating theatres: Can particle counting replace microbiological sampling? J. Hosp. Infect. 2005, 61, 27–29. [Google Scholar] [CrossRef] [PubMed]
- Cristina, M.L.; Spagnolo, A.M.; Sartini, M.; Panatto, D.; Gasparini, R.; Orlando, P.; Ottria, G.; Perdelli, F. Can particulate air sampling predict microbial load in operating theatres for arthroplasty? PLoS ONE 2012, 7, e52809. [Google Scholar] [CrossRef] [PubMed]
- Kim, S.G.; Yoon, S. Measuring the value of airborne particulate matter reduction in Seoul. Air Qual. Atmosphere Heal. 2019, 12, 549–560. [Google Scholar] [CrossRef]
- Lee, B.U. Life comes from the air: A short review on bioaerosol control. Aerosol Air Qual. Res. 2011, 11, 921–927. [Google Scholar] [CrossRef]
- Lee, B.U.; Lee, G.; Heo, K.J.; Jung, J. Concentrations of atmospheric culturable bioaerosols at mountain and seashore sites. Int. J. Environ. Res. Public Heal 2019, 16, 4323. [Google Scholar] [CrossRef]
- Heo, K.J.; Lim, C.E.; Kim, H.B.; Lee, B.U. Effects of human activities on concentrations of culturable bioaerosols in indoor air environments. J. Aerosol Sci. 2017, 104, 58–65. [Google Scholar] [CrossRef]
- Oh, H.-J.; Ma, Y.; Kim, J.B. Human inhalation exposure to aerosol and health effect: Aerosol monitoring and modelling regional deposited doses. Int. J. Environ. Res. Public Heal 2020, 17, 1923. [Google Scholar] [CrossRef]
- Bland, J.M.; Altman, D. Statistical methods for assessing agreement between two methods of clinical measurement. Lancet 1986, 327, 307–310. [Google Scholar] [CrossRef]
- Kim, K.-Y.; Park, J.-B.; Jang, G.-Y.; Kim, C.N.; Lee, K.-J. Assessment of bioaerosols in the public buildings of Korea. Indoor Built Environ. 2007, 16, 465–471. [Google Scholar] [CrossRef]
- Kabir, E.; Kim, K.-H.; Sohn, J.R.; Kweon, B.Y.; Shin, J.H. Indoor air quality assessment in child care and medical facilities in Korea. Environ. Monit. Assess. 2011, 184, 6395–6409. [Google Scholar] [CrossRef]
- Kim, K.Y.; Kim, C.N. Airborne microbiological characteristics in public buildings of Korea. Build. Environ. 2007, 42, 2188–2196. [Google Scholar] [CrossRef]
- Mousavi, M.S.; Hadei, M.; Majlesi, M.; Hopke, P.K.; Yarahmadi, M.; Emam, B.; Kermani, M.; Shahsavani, A. Investigating the effect of several factors on concentrations of bioaerosols in a well-ventilated hospital environment. Environ. Monit. Assess. 2019, 191, 407. [Google Scholar] [CrossRef]
- Tham, K.W.; Zuraimi, M.S. Size relationship between airborne viable bacteria and particles in a controlled indoor environment study. Indoor Air 2005, 15, 48–57. [Google Scholar] [CrossRef] [PubMed]
- Frankel, M.; Bekö, G.; Timm, M.; Gustavsen, S.; Hansen, E.W.; Madsen, A.M. Seasonal variations of indoor microbial exposures and their relation to temperature, relative humidity, and air exchange rate. Appl. Environ. Microbiol. 2012, 78, 8289–8297. [Google Scholar] [CrossRef] [PubMed]
- Qian, J.; Hospodsky, D.; Yamamoto, N.; Nazaroff, W.W.; Peccia, J. Size-resolved emission rates of airborne bacteria and fungi in an occupied classroom. Indoor Air 2012, 22, 339–351. [Google Scholar] [CrossRef] [PubMed]
- Amend, A.S.; Seifert, K.A.; Samson, R.A.; Bruns, T.D. Indoor fungal composition is geographically patterned and more diverse in temperate zones than in the tropics. Proc. Natl. Acad. Sci. 2010, 107, 13748–13753. [Google Scholar] [CrossRef] [PubMed]
- Yamamoto, N.; Schmechel, D.; Chen, B.T.; Lindsley, W.G.; Peccia, J. Comparison of quantitative airborne fungi measurements by active and passive sampling methods. J. Aerosol Sci. 2011, 42, 499–507. [Google Scholar] [CrossRef]
- Tseng, C.-H.; Wang, H.-C.; Xiao, N.-Y.; Chang, Y.-M. Examining the feasibility of prediction models by monitoring data and management data for bioaerosols inside office buildings. Build. Environ. 2011, 46, 2578–2589. [Google Scholar] [CrossRef]
- Hargreaves, M.; Parappukkaran, S.; Morawska, L.; Hitchins-Loveday, J.; He, C.; Gilbert, D. A pilot investigation into associations between indoor airborne fungal and non-biological particle concentrations in residential houses in Brisbane, Australia. Sci. Total. Environ. 2003, 312, 89–101. [Google Scholar] [CrossRef]
- Arundel, A.V.; Sterling, E.M.; Biggin, J.H.; Sterling, T.D. Indirect health effects of relative humidity in indoor environments. Environ. Health Perspect. 1986, 65, 351–361. [Google Scholar]
- Oh, Y.-W.; Cho, J.H. Evaluation of airborne fungi and the effects of a platform screen door and station depth in 25 underground subway stations in Seoul, South Korea. Air Qual. Atmosphere Heal 2015, 9, 561–568. [Google Scholar] [CrossRef]
- Ferro, A.R.; Kopperud, R.J.; Hildemann, L.M. Source strengths for indoor human activities that resuspend particulate matter. Environ. Sci. Technol. 2004, 38, 1759–1764. [Google Scholar] [CrossRef] [PubMed]
- Thatcher, T. Deposition, resuspension, and penetration of particles within a residence. Atmospheric Environ. 1995, 29, 1487–1497. [Google Scholar] [CrossRef]
- Tahir, M.A.; Zhang, X.; Cheng, H.; Xu, D.; Feng, Y.; Sui, G.; Fu, H.; Valev, V.K.; Zhang, L.; Chen, J.; et al. Klarite as a label-free SERS-based assay: A promising approach for atmospheric bioaerosol detection. Analyst 2019, 145, 277–285. [Google Scholar] [CrossRef]
- Choi, J.; Kang, J.S.; Hong, S.C.; Bae, G.-N.; Jung, J.H. A new method for the real-time quantification of airborne biological particles using a coupled inertial aerosol system with in situ fluorescence imaging. Sens. Actuators B Chem. 2017, 244, 635–641. [Google Scholar] [CrossRef]
- Choi, J.; Kang, M.; Jung, J.H. Integrated micro-optofluidic platform for real-time detection of airborne microorganisms. Sci. Rep. 2015, 5, 15983. [Google Scholar] [CrossRef]
- Park, C.W.; Park, J.-W.; Lee, S.H.; Hwang, J. Real-time monitoring of bioaerosols via cell-lysis by air ion and ATP bioluminescence detection. Biosens. Bioelectron. 2014, 52, 379–383. [Google Scholar] [CrossRef]


| Type | Sampling Site | Sampling Point | No. of Samples | Potential Pollutant Source | Type of Cooling, Heating and Ventilation System |
|---|---|---|---|---|---|
| General hospital | GH-A | IM, SW, GW, TR, PR | 240 | Human activities | Central HVAC and natural ventilation |
| (patients and medical staff) Outdoor | |||||
| GH-B | IM, SW, GW, TR, PR | 210 | Human activities | ||
| (patients, visitors, and medical staff) | |||||
| Outdoor | |||||
| GH-C | CSR | 135 | Human activities (medical staff) | HEPA filtration in HVAC systems | |
| Clinic | CL-A | TR, PR | 215 | Human activities | Natural ventilation |
| CL-B | TR, PR | 210 | (patients and medical staff) Outdoor |
| Location | Particulate Count/m3 | |||||
|---|---|---|---|---|---|---|
| <0.5 μm * | 0.5–1 μm * | 1–3 μm * | 3–5 μm * | 5–10 μm * | ≥10.0 μm * | |
| GH-A | 16,403,812 c | 472,838 c | 46,582 d | 4997 d | 1685 d | 597 c,d |
| (6,035,471) | (407,205) | (43,969) | (3167) | (856) | (272) | |
| GH-B | 15,511,037 c | 273,434 b | 14,785 b | 1473 b | 878 b | 487 b |
| (11,136,194) | (271,467) | (7751) | (961) | (538) | (277) | |
| GH-C | 4,164,399 a | 89,704 a | 5718 a | 395 a | 141 a | 120 a |
| (781,951) | (10,169) | (1466) | (229) | (58) | (79) | |
| CL-A | 19,280,252 d | 549,781 c | 38,703 c | 3570 c | 1379 c | 527 b,c |
| (3,097,115) | (157,515) | (15,191) | (1687) | (532) | (161) | |
| CL-B | 12,510,489 b | 350,251 b | 32,733 c | 3001 c | 1328 c | 611 d |
| (4,256,087) | (162,571) | (10,625) | (1325) | (511) | (318) | |
| Bioaerosol | Location | Regression Model | Training Set | Test Set | MAPE (%) | ||
|---|---|---|---|---|---|---|---|
| R2 (Adj R2) | R (p-Value) | R2 (Adj R2) | R (p-Value) | ||||
| Bacteria | GH-A | PMB-1: logCb(CFU/m3) = (6.189 × 10⁻⁴) PM>10 + 1.971 | 0.644 (0.638) | 0.802 (0.000) | 0.625 (0.612) | 0.791 (0.000) | 40.3 |
| PMB-2: logCb(CFU/m3) = (6.093 × 10⁻⁴) PM>10 + 0.011H + 1.501 | 0.710 (0.701) | 0.842 (0.000) | 0.703 (0.695) | 0.839 (0.000) | 38.9 | ||
| GH-C | PMB-3: logCb(CFU/m3) = (6.358 × 10⁻⁵) PM3-5 + 1.336 | 0.482 (0.470) | 0.694 (0.000) | 0.455 (0.439) | 0.675 (0.000) | 53.1 | |
| PMB-4: logCb(CFU/m3) = (6.977 × 10⁻⁵) PM3-5 + (1.691 × 10⁻⁵) PM1-3 + 1.236 | 0.739 (0.726) | 0.859 (0.000) | 0.741 (0.730) | 0.861 (0.000) | 26.0 | ||
| PMB-5: logCb(CFU/m3) = (5.713 × 10⁻⁵) PM3-5 + (1.613 × 10⁻⁵) PM1-3 + (9.555 × 10⁻⁵) PM5-10 + 1.232 | 0.817 (0.804) | 0.904 (0.000) | 0.853 (0.831) | 0.924 (0.000) | 8.5 | ||
| CL-A | PMB-6: logCb(CFU/m3) = (9.295 × 10⁻⁴) PM>10 + 2.026 | 0.535 (0.501) | 0.732 (0.000) | 0.583 (0.533) | 0.764 (0.001) | 61.2 | |
| PMB-7: logCb(CFU/m3) = (1.015 × 10⁻³) PM>10 + 0.193 T - 3.086 | 0.564 (0.539) | 0.751 (0.000) | 0.590 (0.566) | 0.768 (0.000) | 46.1 | ||
| Fungi | GH-A | PMF-1: logCf(CFU/m3) = (3.683 × 10⁻⁴) PM>10 + 1.917 | 0.122 (0.109) | 0.349 (0.003) | 0.116 (0.099) | 0.341 (0.001) | 142.8 |
| PMF-2: logCf(CFU/m3) = (3.545 × 10⁻⁴) PM>10 + 0.016H + 1.243 | 0.195 (0.171) | 0.441 (0.001) | 0.203 (0.185) | 0.451 (0.003) | 115.9 | ||
| GH-C | PMF-3: logCf(CFU/m3) = (3.742 × 10⁻⁶) PM3-5 + 1.496 | 0.216 (0.197) | 0.464 (0.001) | 0.225 (0.209) | 0.475 (0.000) | 96.5 | |
| PMF-4: logCf(CFU/m3) = (3.161 × 10⁻⁶) PM3-5 + 0.018T + 1.131 | 0.325 (0.293) | 0.570 (0.000) | 0.301 (0.284) | 0.549 (0.000) | 64.3 | ||
| CL-A | PMF-5: logCf(CFU/m3) = (5.441 × 10⁻⁴) PM>10 + 2.240 | 0.176 (0.164) | 0.419 (0.000) | 0.231 (0.215) | 0.481 (0.000) | 101.8 | |
| PMF-6: logCf(CFU/m3) = (5.619 X 10⁻⁴) PM>10 + 0.012H + 1.594 | 0.295 (0.275) | 0.543 (0.000) | 0.287 (0.264) | 0.536 (0.001) | 76.7 | ||
| PMF-7: logCf(CFU/m3) = (7.036 × 10⁻⁴) PM>10 + 0.007H + (3.302 × 10⁻⁵) PM3-5 + 1.398 | 0.460 (0.429) | 0.678 (0.000) | 0.417 (0.398) | 0.646 (0.000) | 58.2 | ||
| PMF-8: logCf(CFU/m3) = (6.338 × 10⁻⁴) PM>10 + 0.006H + (5.055 × 10⁻⁵) PM3-5 + (8.824 × 10⁻⁵) PM5-10 + 1.003 | 0.504 (0.489) | 0.710 (0.000) | 0.516 (0.496) | 0.719 (0.000) | 42.5 | ||
© 2020 by the authors. Licensee MDPI, Basel, Switzerland. This article is an open access article distributed under the terms and conditions of the Creative Commons Attribution (CC BY) license (http://creativecommons.org/licenses/by/4.0/).
Share and Cite
Seo, J.H.; Jeon, H.W.; Choi, J.S.; Sohn, J.-R. Prediction Model for Airborne Microorganisms Using Particle Number Concentration as Surrogate Markers in Hospital Environment. Int. J. Environ. Res. Public Health 2020, 17, 7237. https://doi.org/10.3390/ijerph17197237
Seo JH, Jeon HW, Choi JS, Sohn J-R. Prediction Model for Airborne Microorganisms Using Particle Number Concentration as Surrogate Markers in Hospital Environment. International Journal of Environmental Research and Public Health. 2020; 17(19):7237. https://doi.org/10.3390/ijerph17197237
Chicago/Turabian StyleSeo, Ji Hoon, Hyun Woo Jeon, Joung Sook Choi, and Jong-Ryeul Sohn. 2020. "Prediction Model for Airborne Microorganisms Using Particle Number Concentration as Surrogate Markers in Hospital Environment" International Journal of Environmental Research and Public Health 17, no. 19: 7237. https://doi.org/10.3390/ijerph17197237
APA StyleSeo, J. H., Jeon, H. W., Choi, J. S., & Sohn, J.-R. (2020). Prediction Model for Airborne Microorganisms Using Particle Number Concentration as Surrogate Markers in Hospital Environment. International Journal of Environmental Research and Public Health, 17(19), 7237. https://doi.org/10.3390/ijerph17197237