Exploring the Impacts of Living in a “Green” City on Individual BMI: A Study of Lingang New Town in Shanghai, China


Abstract
1. Introduction
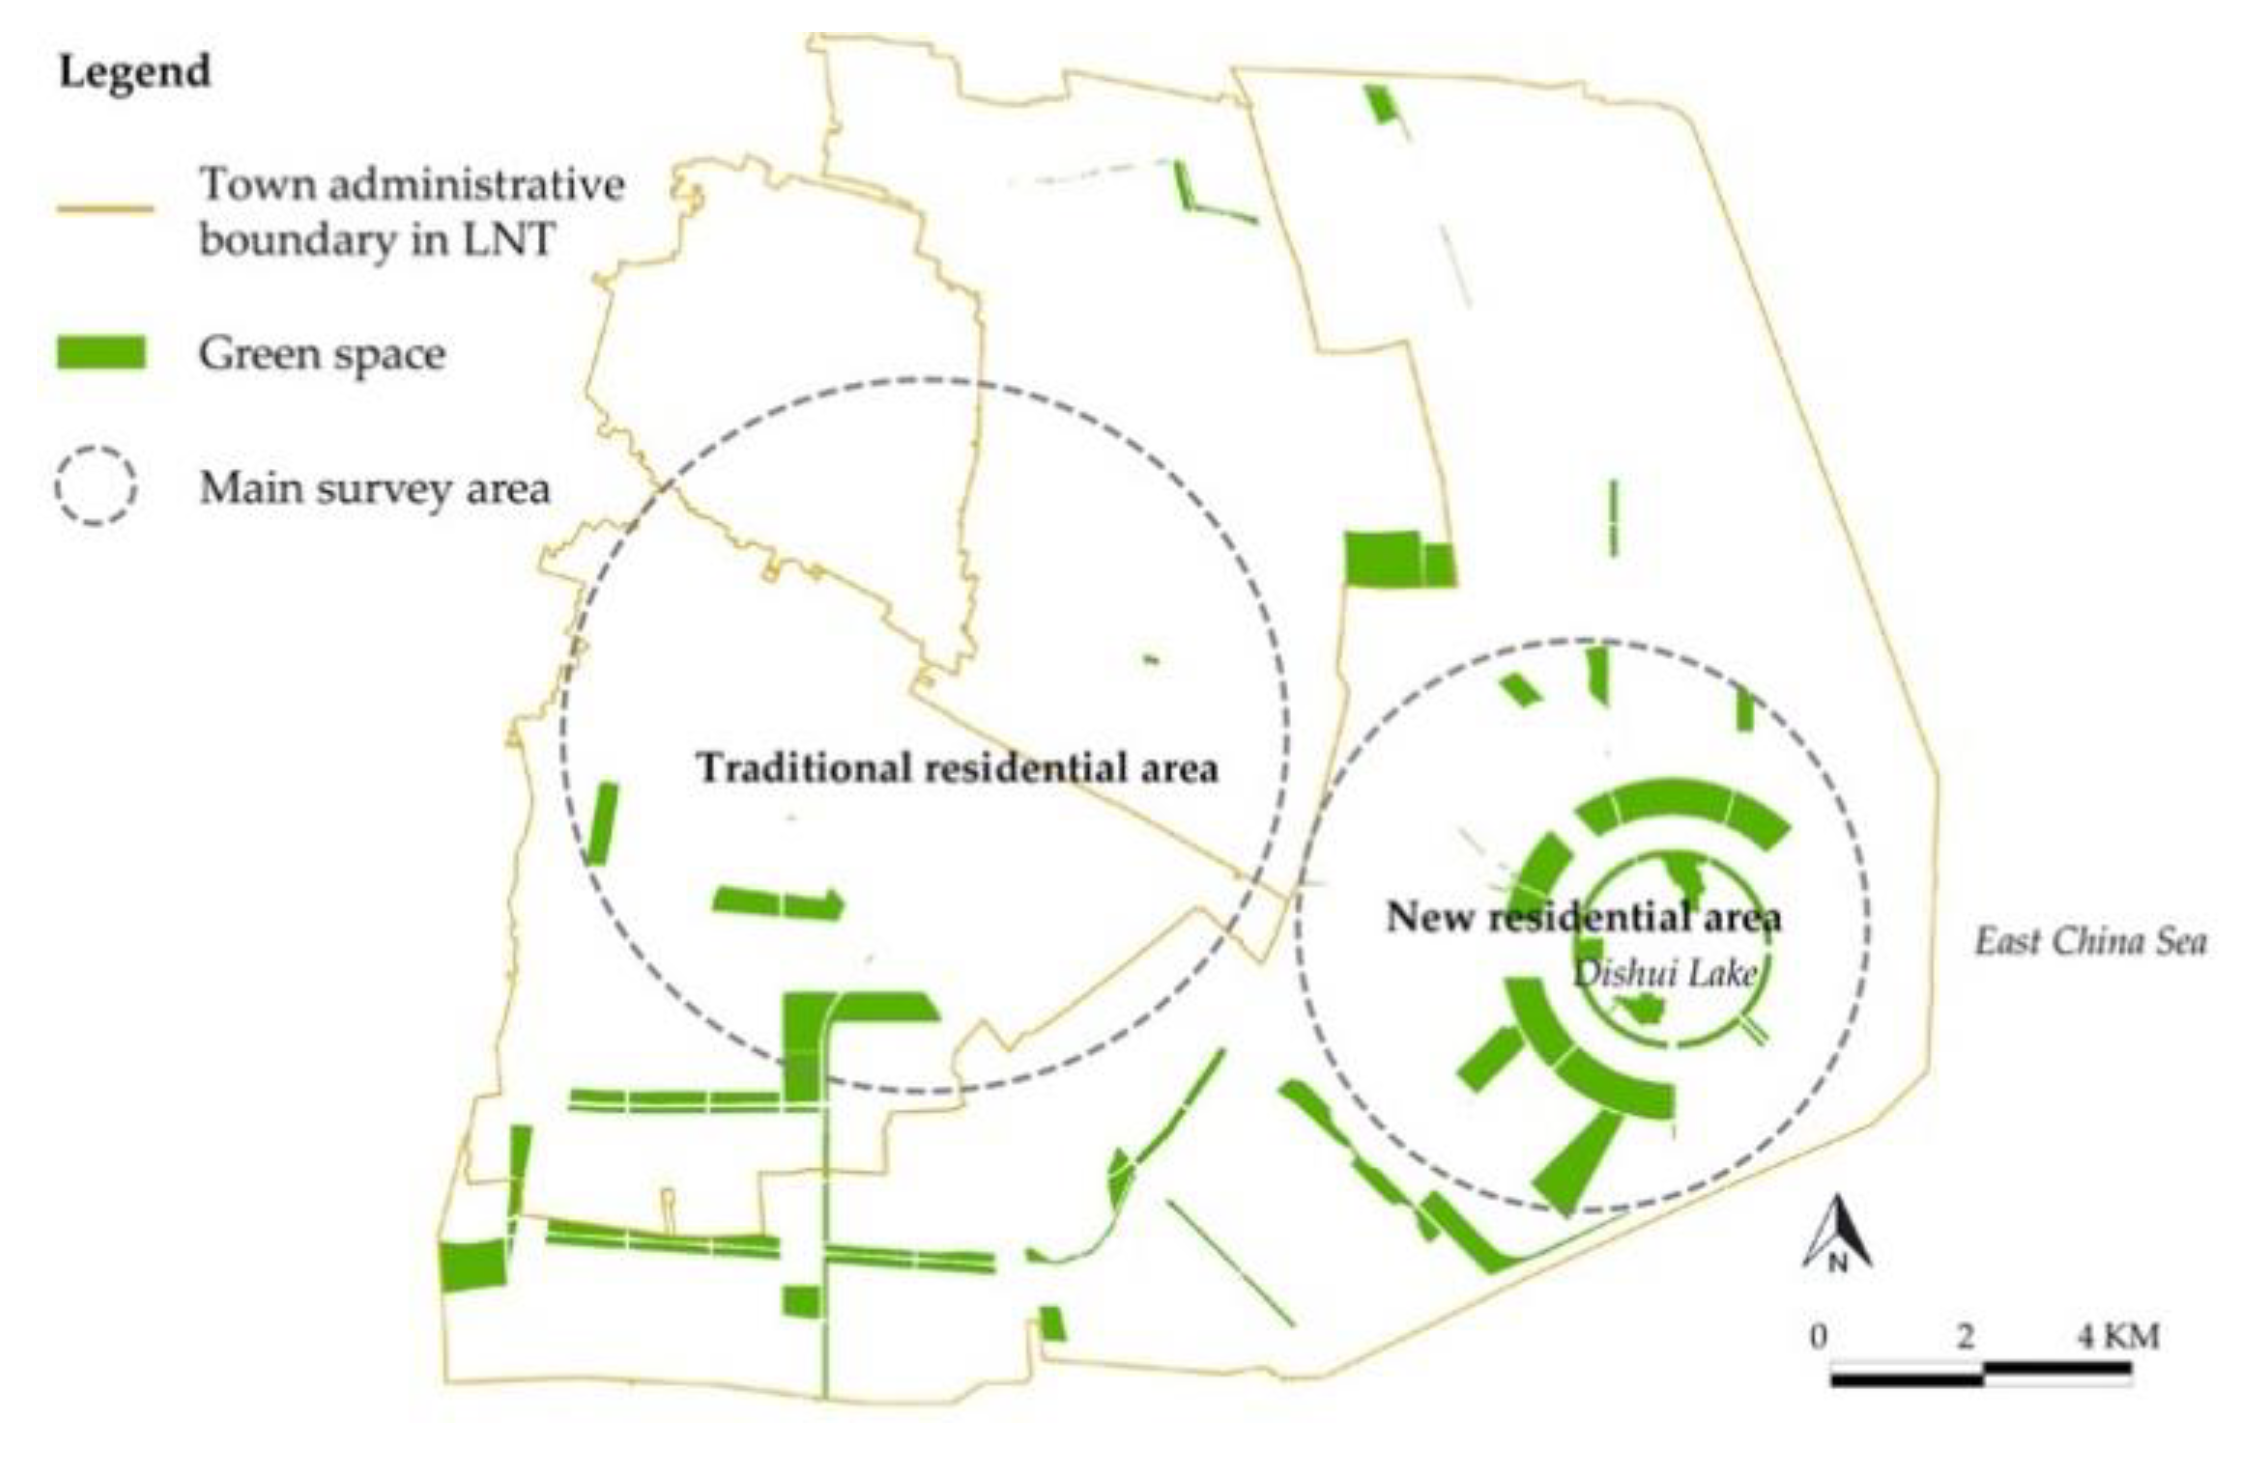
Case Study
2. Materials and Methods
2.1. Data
2.2. Measures
- (1)
- (2)
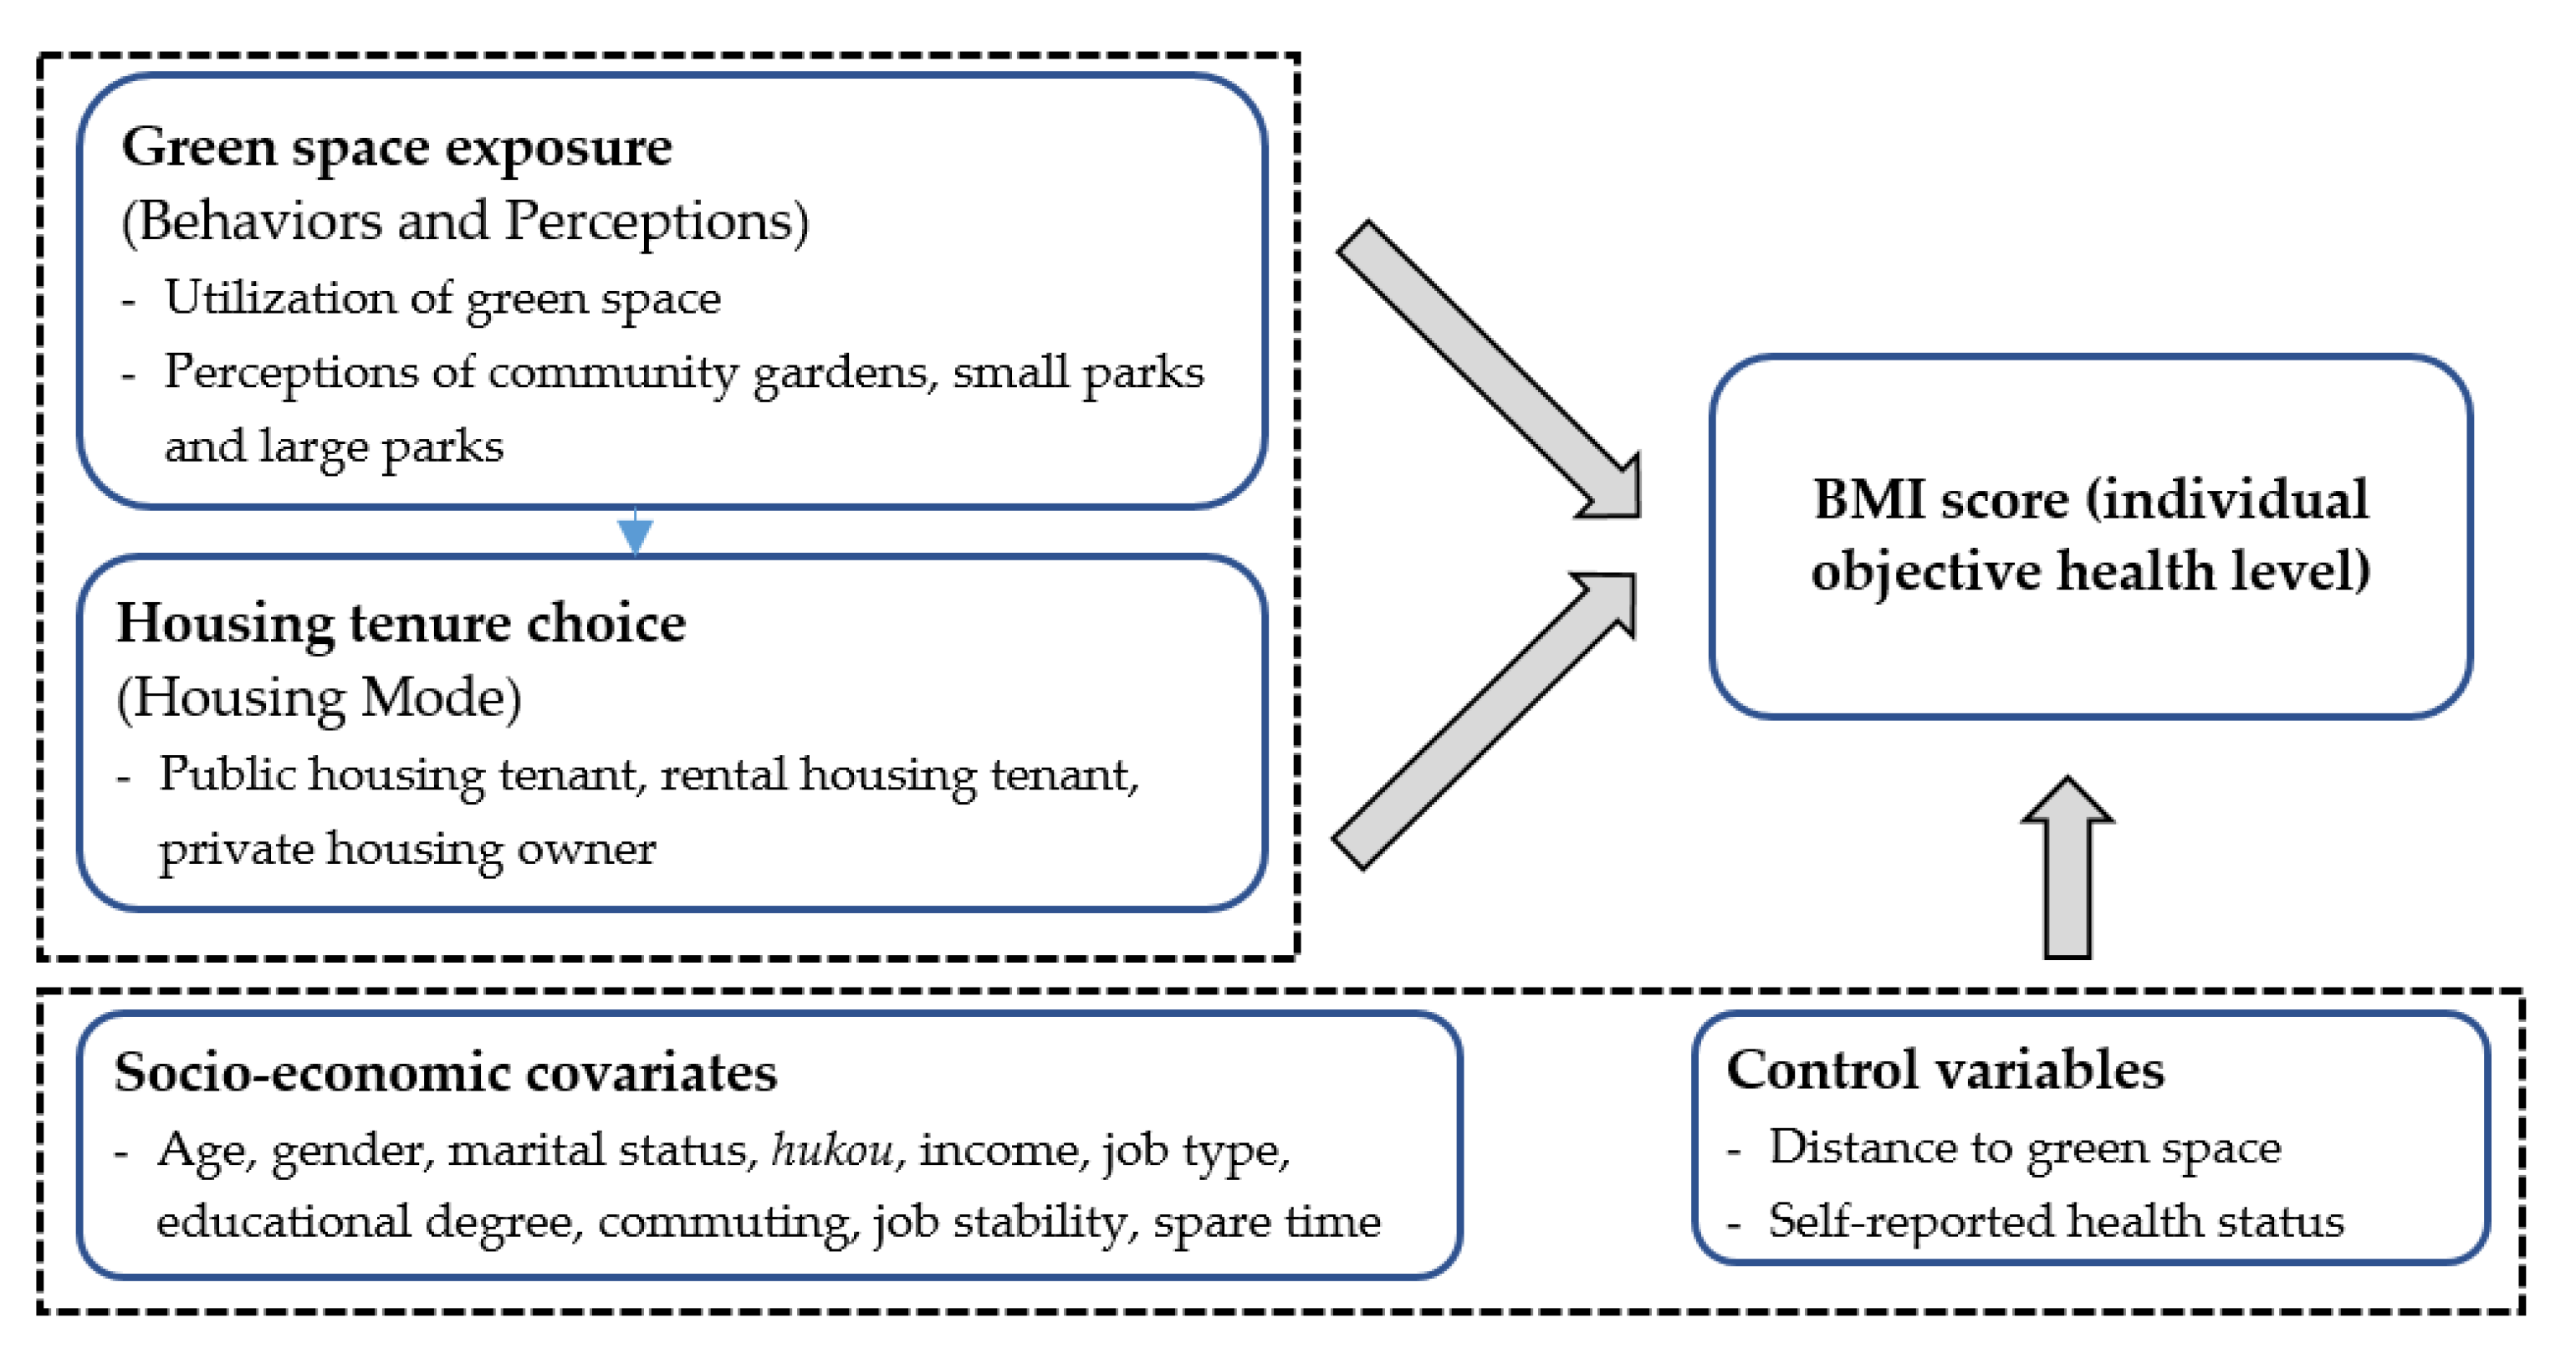
- Variables of (green) lifestyle: both behaviors and perceptions related to the exposure of green space in LNT were measured in this research to reflect people’s green lifestyles. The behavior aspect was measured by querying residents’ frequency of using green space before moving to LNT and their current use of green space in LNT, with four-scale answers provided (1 = “less than once a week”, 2 = “once or twice a week”, 3 = “three to six times a week”, 4 = “everyday”). We inspected residents’ perceptions of green space in LNT in seven dimensions that were acknowledged as green space’s key functions in the sustainable urban planning code: exercising, safety, accessibility, social interaction, commerce, public events, and environment quality. Specifically, residents were asked four sets of questions, including to what extent the specific dimension of green space is important to them, and to what extent they are satisfied with every dimensional function of green space of a specific kind. Three kinds of green space were inspected, respectively, namely community gardens (in community), small parks (nearby community), and large parks, covering most of the green infrastructure types in LNT. Answers on a Likert scale were provided for these 28 questions, with the score ranging from 1 (indicating extremely unimportant/unsatisfied) to 7 (indicating extremely important/satisfied).
- (3)
- Housing mode variable: residents’ housing tenure choice in LNT was measured to constitute the housing mode variable. Overall, there were three housing modes identified, namely private housing, rental housing and public housing. The private housing mode referred to residents who owned a local private property. The rental housing mode referred to tenants who rented from the housing market. Public housing mode represented tenants who obtained subsidized housing provided by the local government. This housing mode was mostly provided to employees of state-owned enterprises in LNT as temporary accommodation.
- (4)
- Covariates: respondents’ individual profiles were considered as confounding variables. In terms of socio-demographic status, we surveyed the heads of household or their spouses for age, gender, marital status, hukou status, educational level and the household monthly income level. It is important to note that hukou status is one of the most crucial indicators of individual socio-economic capabilities. Hukou is a household registration system in China that defines one’s right to different socio-economic benefits. For example, the hukou origin determines the access to local socio-economic welfare support, such as education allowances and medical care. Furthermore, only non-agricultural hukou holders can have urban welfare support, which is of a much higher standard than rural forms. In this research, we defined a respondent as a migrant if his/her hukou origin was outside Shanghai. The type of hukou was categorized into agricultural and non-agricultural based on the type of hukou registration. A respondent with a college or above degree was regarded as having a high educational level. Household monthly income in Chinese currency “RMB” was classified into six levels (1 = “less than 1000“, 2 = “1000–4999”, 3 = “5000–10,000”, 4 = “10,001–20,000”, 5 = “20,001–30,000”, 6 = “more than 30,000”). As for factors of work and life, we measured respondents’ job type, commuting time, amount of spare time and length of time spent living in LNT. Specifically, working for the public sector was considered as a stable job type in Chinese cities. One’s amount of spare time was likely to be affected by his/her employment status and commuting time. The residence length in LNT helped to verify respondents as new inhabitants of LNT.
- (5)
- Control variable: a few variables relating to the lived experience in LNT were considered as control variables for analyzing BMI. First, respondents were asked to report their subjective perception of individual health, ranging from “completely unhealthy”, “relatively unhealthy”, “relatively healthy”, to “completely healthy”. The walking time from home to the nearest green space was surveyed, with four answers provided (1 = “less than 10 min”, 2 = “11–20 min”, 3 = “21–30 min”, 4 = “more than 30 min”).
2.3. Model Construction
3. Results
3.1. Descriptive Statistics
3.2. Analysis on Behaviors and Perceptions of Green Space Exposure
3.3. Structural Equation Model Results
4. Discussion
5. Conclusions
Author Contributions
Funding
Acknowledgments
Conflicts of Interest
References
- While, A.; Jonas, A.E.G.; Gibbs, D. The environment and the entrepreneurial city: Searching for the urban ‘sustainability fix’ in Manchester and Leeds. Int. J. Urban Reg. 2004, 28, 549–569. [Google Scholar] [CrossRef]
- Gibbs, D.; Krueger, R.; MacLeod, G. Grappling with Smart City Politics in an Era of Market Triumphalism. Urban Stud. 2013, 50, 2151–2157. [Google Scholar] [CrossRef]
- Asma, S.; Lozano, R.; Chatterji, S.; Swaminathan, S.; Marinho, M.D.; Yamamoto, N.; Varavikova, E.; Misganaw, A.; Ryan, M.; Dandona, L.; et al. Monitoring the health-related Sustainable Development Goals: Lessons learned and recommendations for improved measurement. Lancet 2020, 395, 240–246. [Google Scholar] [CrossRef]
- Verrecchia, R.; Thompson, R.; Yates, R. Universal Health Coverage and public health: A truly sustainable approach. Lancet Public Health 2019, 4, E10–E11. [Google Scholar] [CrossRef]
- Dhakal, S.; Ruth, M. Creating Low Carbon Cities, 1st ed.; Springer: New York, NY, USA, 2017; pp. 1–4. [Google Scholar]
- Daniels, T.L. A Trail Across Time: American Environmental Planning From City Beautiful to Sustainability. J. Am. Plan. Assoc. 2009, 75, 178–192. [Google Scholar] [CrossRef]
- Marsh, M. From garden city to green city: The legacy of Ebenezer Howard. J. Urban Hist. 2007, 33, 645–651. [Google Scholar] [CrossRef]
- Hall, P.; Falk, N. Good Cities, Better Lives: How Europe Discovered the Lost Art of Urbanism; Routledge: London, UK, 2014; pp. 56–73. [Google Scholar]
- Lehmann, S. The Principles of Green Urbanism: Transforming the City for Sustainability; Earthscan: London, UK, 2010; pp. 1–15. [Google Scholar]
- Ji, Q.F.; Li, C.C.; Jones, P. New green theories of urban development in China. Sustain. Cities Soc. 2017, 30, 257–262. [Google Scholar] [CrossRef]
- Wu, F.L. China’s eco-cities. Geoforum 2012, 43, 169–171. [Google Scholar] [CrossRef]
- Liu, W.; Qin, B. Low-carbon city initiatives in China: A review from the policy paradigm perspective. Cities 2016, 51, 131–138. [Google Scholar] [CrossRef]
- Li, H.M.; Wang, J.; Yang, X.; Wang, Y.F.; Wu, T. A holistic overview of the progress of China’s low-carbon city pilots. Sustain. Cities Soc. 2018, 42, 289–300. [Google Scholar] [CrossRef]
- Huang, L.; Yan, L.J.; Wu, J.G. Assessing urban sustainability of Chinese megacities: 35 years after the economic reform and open-door policy. Landsc. Urban Plan. 2016, 145, 57–70. [Google Scholar] [CrossRef]
- Chen, W.Y. The role of urban green infrastructure in offsetting carbon emissions in 35 major Chinese cities: A nationwide estimate. Cities 2015, 44, 112–120. [Google Scholar] [CrossRef]
- Yu, L. Low carbon eco-city: New approach for Chinese urbanisation. Habitat Int. 2014, 44, 102–110. [Google Scholar] [CrossRef]
- Caprotti, F.; Springer, C.; Harmer, N. ‘Eco’ For Whom? Envisioning Eco-urbanism in the Sino-Singapore Tianjin Eco-city, China. Int. J. Urban Reg. Res. 2015, 39, 495–517. [Google Scholar] [CrossRef]
- Paquet, C.; Coffee, N.T.; Haren, M.T.; Howard, N.J.; Adams, R.J.; Taylor, A.W.; Daniel, M. Food environment, walkability, and public open spaces are associated with incident development of cardio-metabolic risk factors in a biomedical cohort. Health Place 2014, 28, 173–176. [Google Scholar] [CrossRef]
- Wolch, J.; Jerrett, M.; Reynolds, K.; McConnell, R.; Chang, R.; Dahmann, N.; Brady, K.; Gilliland, F.; Su, J.G.; Berhane, K. Childhood obesity and proximity to urban parks and recreational resources: A longitudinal cohort study. Health Place 2011, 17, 207–214. [Google Scholar] [CrossRef]
- Demoury, C.; Thierry, B.; Richard, H.; Sigler, B.; Kestens, Y.; Parent, M.E. Residential greenness and risk of prostate cancer: A case-control study in Montreal, Canada. Environ. Int. 2017, 98, 129–136. [Google Scholar] [CrossRef]
- James, P.; Hart, J.E.; Banay, R.F.; Laden, F. Exposure to Greenness and Mortality in a Nationwide Prospective Cohort Study of Women. Environ. Health Perspect. 2016, 124, 1344–1352. [Google Scholar] [CrossRef]
- Song, C.R.; Ikei, H.; Igarashi, M.; Takagaki, M.; Miyazaki, Y. Physiological and Psychological Effects of a Walk in Urban Parks in Fall. Int. J. Environ. Res. Pubulic Health 2015, 12, 14216–14228. [Google Scholar] [CrossRef]
- Mowafi, M.; Khadr, Z.; Bennett, G.; Hill, A.; Kawachi, I.; Subramanian, S.V. Is access to neighborhood green space associated with BMI among Egyptians? A multilevel study of Cairo neighborhoods. Health Place 2012, 18, 385–390. [Google Scholar] [CrossRef]
- Sang, A.O.; Knez, I.; Gunnarsson, B.; Hedblom, M. The effects of naturalness, gender, and age on how urban green space is perceived and used. Urban For. Urban Green. 2016, 18, 268–276. [Google Scholar] [CrossRef]
- van den Berg, M.; Wendel-Vos, W.; van Poppel, M.; Kemper, H.; van Mechelen, W.; Maas, J. Health benefits of green spaces in the living environment: A systematic review of epidemiological studies. Urban For. Urban Green. 2015, 14, 806–816. [Google Scholar] [CrossRef]
- Zhang, X.H.; Melbourne, S.; Sarkar, C.; Chiaradia, A.; Webster, C. Effects of green space on walking: Does size, shape and density matter? Urban Stud. 2020. [Google Scholar] [CrossRef]
- Heiskanen, E.; Johnson, M.; Robinson, S.; Vadovics, E.; Saastamoinen, M. Low-carbon communities as a context for individual behavioural change. Energy Policy 2010, 38, 7586–7595. [Google Scholar] [CrossRef]
- Flynn, A.; Yu, L.; Feindt, P.; Chen, C. Eco-cities, governance and sustainable lifestyles: The case of the Sino-Singapore Tianjin Eco-City. Habitat Int. 2016, 53, 78–86. [Google Scholar] [CrossRef]
- Carthy, P.; Lyons, S.; Nolan, A. Characterising urban green space density and footpath-accessibility in models of BMI. BMC Public Health 2020, 20, 760. [Google Scholar] [CrossRef]
- Wang, R.Y.; Helbich, M.; Yao, Y.; Zhang, J.B.; Liu, P.H.; Yuan, Y.; Liu, Y. Urban greenery and mental wellbeing in adults: Cross-sectional mediation analyses on multiple pathways across different greenery measures. Environ. Res. 2019, 176, 108535. [Google Scholar] [CrossRef]
- Liu, Y.; Wang, R.Y.; Xiao, Y.; Huang, B.S.; Chen, H.S.; Li, Z.G. Exploring the linkage between greenness exposure and depression among Chinese people: Mediating roles of physical activity, stress and social cohesion and moderating role of urbanicity. Health Place 2019, 58, 102168. [Google Scholar] [CrossRef]
- Knobel, P.; Dadvand, P.; Maneja-Zaragoza, R. A systematic review of multi-dimensional quality assessment tools for urban green spaces. Health Place 2019, 59, 102198. [Google Scholar] [CrossRef]
- Kondo, M.C.; Fluehr, J.M.; McKeon, T.; Branas, C.C. Urban Green Space and Its Impact on Human Health. Int. J. Environ. Res. Public Health 2018, 15, 445. [Google Scholar] [CrossRef]
- Van Dyck, D.; Cardon, G.; Deforche, B.; Sallis, J.F.; Owen, N.; De Bourdeaudhuij, I. Neighborhood SES and walkability are related to physical activity behavior in Belgian adults. Prev. Med. 2010, 50, S74–S79. [Google Scholar] [CrossRef]
- Koprowska, K.; Laszkiewicz, E.; Kronenberg, J.; Marcinczak, S. Subjective perception of noise exposure in relation to urban green space availability. Urban For. Urban Green. 2018, 31, 93–102. [Google Scholar] [CrossRef]
- Heinrich, K.M.; Lee, R.E.; Regan, G.R.; Reese-Smith, J.Y.; Howard, H.H.; Haddock, C.K.; Poston, W.S.C.; Ahluwalia, J.S. How does the built environment relate to body mass index and obesity prevalence among public housing residents? Am. J. Health Promot. 2008, 22, 187–194. [Google Scholar] [CrossRef]
- Jim, C.Y.; Shan, X.Z. Socioeconomic effect on perception of urban green spaces in Guangzhou, China. Cities 2013, 31, 123–131. [Google Scholar] [CrossRef]
- Bedimo-Rung, A.L.; Mowen, A.J.; Cohen, D.A. The significance of parks to physical activity and public health—A conceptual model. Am. J. Prev. Med. 2005, 28, 159–168. [Google Scholar] [CrossRef]
- Richardson, E.; Pearce, J.; Mitchell, R.; Day, P.; Kingham, S. The association between green space and cause-specific mortality in urban New Zealand: An ecological analysis of green space utility. BMC Public Health 2010, 10, 240. [Google Scholar] [CrossRef]
- Papas, M.A.; Alberg, A.J.; Ewing, R.; Helzlsouer, K.J.; Gary, T.L.; Klassen, A.C. The built environment and obesity. Epidemiol. Rev. 2007, 29, 129–143. [Google Scholar] [CrossRef]
- Xiao, Y.; Miao, S.Y.; Sarkar, C.; Geng, H.Z.; Lu, Y. Exploring the Impacts of Housing Condition on Migrants’ Mental Health in Nanxiang, Shanghai: A Structural Equation Modelling Approach. Int. J. Environ. Res. Public Health 2018, 15, 225. [Google Scholar] [CrossRef]
- Muntaner, C.; Nagoshi, C.; Diala, C. Racial ideology and explanations for health inequalities among middle-class whites. Int. J. Health Serv. 2001, 31, 659–668. [Google Scholar] [CrossRef]
- Gao, M.L.; Ahern, J.; Koshland, C.P. Perceived built environment and health-related quality of life in four types of neighborhoods in Xi’an, China. Health Place 2016, 39, 110–115. [Google Scholar] [CrossRef]
- Krieger, J.; Higgins, D.L. Housing and health: Time again for public health action. Am. J. Public Health 2002, 92, 758–768. [Google Scholar] [CrossRef]
- Lang, R.E.; LeFurgy, J. Edgeless Cities: Examining the noncentered metropolis. Hous. Policy Debate 2003, 14, 427–460. [Google Scholar] [CrossRef]
- Harris, R. Using Toronto to explore three suburban stereotypes, and vice versa. Environ. Plan. A Econ. Space 2015, 47, 30–49. [Google Scholar] [CrossRef]
- Thomas, M.M.C.; Mehta, A.J.; Murphy, J.S.; Childs, E.; Sena, B.F.; Dimitri, N.; Dooley, D.P.; Kane, J.; Shen, A.; Barros, E.; et al. Associations Between Public Housing Residency and Health Behaviors in a Cross-Sectional Sample of Boston Adults. Hous. Policy Debate 2020, 30, 335–347. [Google Scholar] [CrossRef]
- Stewart, J.; Knight, A. Private Sector housing conditions: Influencing health and wellbeing across the generations. Perspect. Public Health 2011, 131, 255–256. [Google Scholar] [CrossRef]
- Lu, T.T.; Zhang, F.Z.; Wu, F.L. Place attachment in gated neighbourhoods in China: Evidence from Wenzhou. Geoforum 2018, 92, 144–151. [Google Scholar] [CrossRef]
- Li, J.; Chiu, R.L.H. State rescaling and large-scale urban development projects in China: The case of Lingang New Town, Shanghai. Urban Stud. 2019, 57, 2564–2581. [Google Scholar] [CrossRef]
- Shen, J.; Luo, X.; Wu, F.L. Assembling mega-urban projects through state-guided governance innovation: The development of Lingang in Shanghai. Reg. Stud. 2020. [Google Scholar] [CrossRef]
- Wang, Z.; Wu, F.L. In-Situ Marginalisation: Social Impact of Chinese Mega-Projects. Antipode 2019, 51, 1640–1663. [Google Scholar] [CrossRef]
- Kim, J.I. Making cities global: The new city development of Songdo, Yujiapu and Lingang. Plan. Perspect. 2014, 29, 329–356. [Google Scholar] [CrossRef]
- Shanghai Municipal Government. Shanghai Announced to Make Chongming Island, Lingang and Hongqiao Area as Three Pilot Sites for Low Carbon Development. 2010. Available online: http://www.gov.cn/govweb/gzdt/2010-03/24/content_1563366.htm (accessed on 20 March 2020).
- Shanghai Lingang Special Area Ivestment Promotion and Service Center. Lingang First Station for Investment. 2017. Available online: https://www.shlgservice.com/lg/sthj/sthj.html#sthj (accessed on 20 March 2020).
- Sun, B.D.; Yan, H.; Zhang, T.L. Built environmental impacts on individual mode choice and BMI: Evidence from China. J. Transp. Geogr. 2017, 63, 11–21. [Google Scholar] [CrossRef]
- National Health and Family Planning Commission of the People’s Republic of China. The Management Method of Nutrition Improvement Work. 2010. Available online: http://www.nhfpc.gov.cn/zhuzhan/wsbmgz/201304/2d99c4ebe95047d28079d511e7582960.shtml (accessed on 10 February 2020).
- Sperling, J.B.; Ramaswami, A. Exploring health outcomes as a motivator for low-carbon city development: Implications for infrastructure interventions in Asian cities. Habitat Int. 2013, 37, 113–123. [Google Scholar] [CrossRef]
- Li, W.X. Health implications of environmental and social resources for preadolescents in urban China. Habitat Int. 2015, 50, 347–353. [Google Scholar] [CrossRef]


| Description | Range | Housing Tenure Choice | F Value | |||
|---|---|---|---|---|---|---|
| Private (n = 229) | Rental (n = 118) | Public (n = 56) | ||||
| Age | Mean (S.D.) | 18–80 | 36.4 (9.0) | 34.3 (11.0) | 32.8 (10.0) | 3.9 * |
| Gender | Female (%) | 57.6 | 42.4 | 44.6 | ||
| Marital status | Married (%) | 84.7 | 65.3 | 55.4 | ||
| Hukou origin | Non-Shanghai (%) | 32.3 | 77.1 | 64.3 | ||
| Hukou type | Non-agriculture (%) | 86.0 | 56.8 | 69.6 | ||
| Educational degree | College or above (%) | 84.7 | 71.2 | 89.3 | ||
| Job type | Public sector (%) | 53.3 | 28.0 | 57.1 | ||
| Other sector (%) | 46.7 | 72.0 | 42.9 | |||
| Employment status | Retired (%) | 3.1 | 1.7 | 3.6 | ||
| Part-time (%) | 8.7 | 17.0 | 8.9 | |||
| Full-time (%) | 88.2 | 81.3 | 87.5 | |||
| Commuting minutes | Mean(S.D.) | 2–120 | 26.1 (19.8) | 20.8 (16.6) | 18.7 (10.3) | 5.9 ** |
| Household monthly income level | Mean (S.D.) | 1–6 | 4.1 (1.1) | 3.7 (1.2) | 4.1 (0.9) | 4.1 * |
| Year living in LNT | Mean (S.D.) | 0–18 | 4.2 (3.2) | 2.2 (1.6) | 1.6 (1.1) | 35.8 *** |
| Frequency of using green space before | Mean (S.D.) | 1–4 | 1.6 (0.9) | 1.7 (0.9) | 1.8 (0.9) | 1.3 |
| Frequency of using green space now | Mean (S.D.) | 1–4 | 1.9 (0.9) | 1.9 (0.9) | 2.0 (1.0) | 0.22 |
| Distance to nearest green space | Mean (S.D.) | 1–4 | 1.7 (0.9) | 1.8 (1.0) | 2.1 (1.1) | 4.6* |
| Self-reported health level | Mean (S.D.) | 1–4 | 2.9 (0.7) | 3.1 (0.8) | 3.0 (0.9) | 1.6 |
| BMI | Mean (S.D.) | 15.6–32.9 | 22.9 (2.9) | 22.5 (2.8) | 21.7 (2.4) | 4.4* |
| Frequency of Using Green Space | Before Moving to LNT (%) | After Moved to LNT (%) | Relative Change (%) 1 |
|---|---|---|---|
| Everyday | 6.2 | 7.1 | +14.5 |
| 3–6 times per week | 9.5 | 13.9 | +46.3 |
| 1–2 times per week | 27.0 | 40.0 | +48.1 |
| Once in a few weeks | 57.3 | 39.0 | −31.9 |
| Component | Variance | Loaded Items (>0.40) | Percentage of Explained Variance | Generative Content |
|---|---|---|---|---|
| I | 4.842 | Exercising (0.402), safety (0.413), quality environment (0.430) | 0.153 | Perception of community garden |
| II | 4.778 | Safety (0.486), accessibility (0.459) | 0.143 | Perception of small parks |
| III | 4.460 | Safety (0.457), accessibility (0.421), quality environment (0.413) | 0.137 | Perception of large parks |
| IV | 4.052 | Commerce (0.421), public events (0.425) | 0.133 | Social values of green space in general |
| V | 3.137 | Safety (0.480), accessibility (0.449), quality environment (0.436) | 0.109 | Physical value of green space in general |
| Model 1 | Model 2 | Model 3 | ||||
|---|---|---|---|---|---|---|
| Private Housing | BMI | Private Housing | BMI | Public Housing | BMI | |
| Coef. (S.E.) | Coef. (S.E.) | Coef. (S.E.) | Coef. (S.E.) | Coef. (S.E.) | Coef. (S.E.) | |
| Housing tenure choice | ||||||
| Private housing | 0.617 ** (0.279) | |||||
| Public housing | −0.947 ** (0.367) | |||||
| Green lifestyles | ||||||
| Relative change of using green space | 0.060 ** (0.028) | −0.116 (0.160) | 0.060 ** (0.028) | −0.152 (0.160) | −0.021 (0.022) | −0.134 (0.159) |
| Frequency of using green space now | −0.026 (0.031) | 0.230 (0.179) | −0.026 (0.031) | 0.248 (0.178) | 0.023 (0.023) | 0.262 (0.178) |
| Perception of community garden | −0.009 (0.015) | 0.042 (0.086) | −0.009 (0.015) | 0.048 (0.085) | 0.015 (0.012) | 0.057 (0.085) |
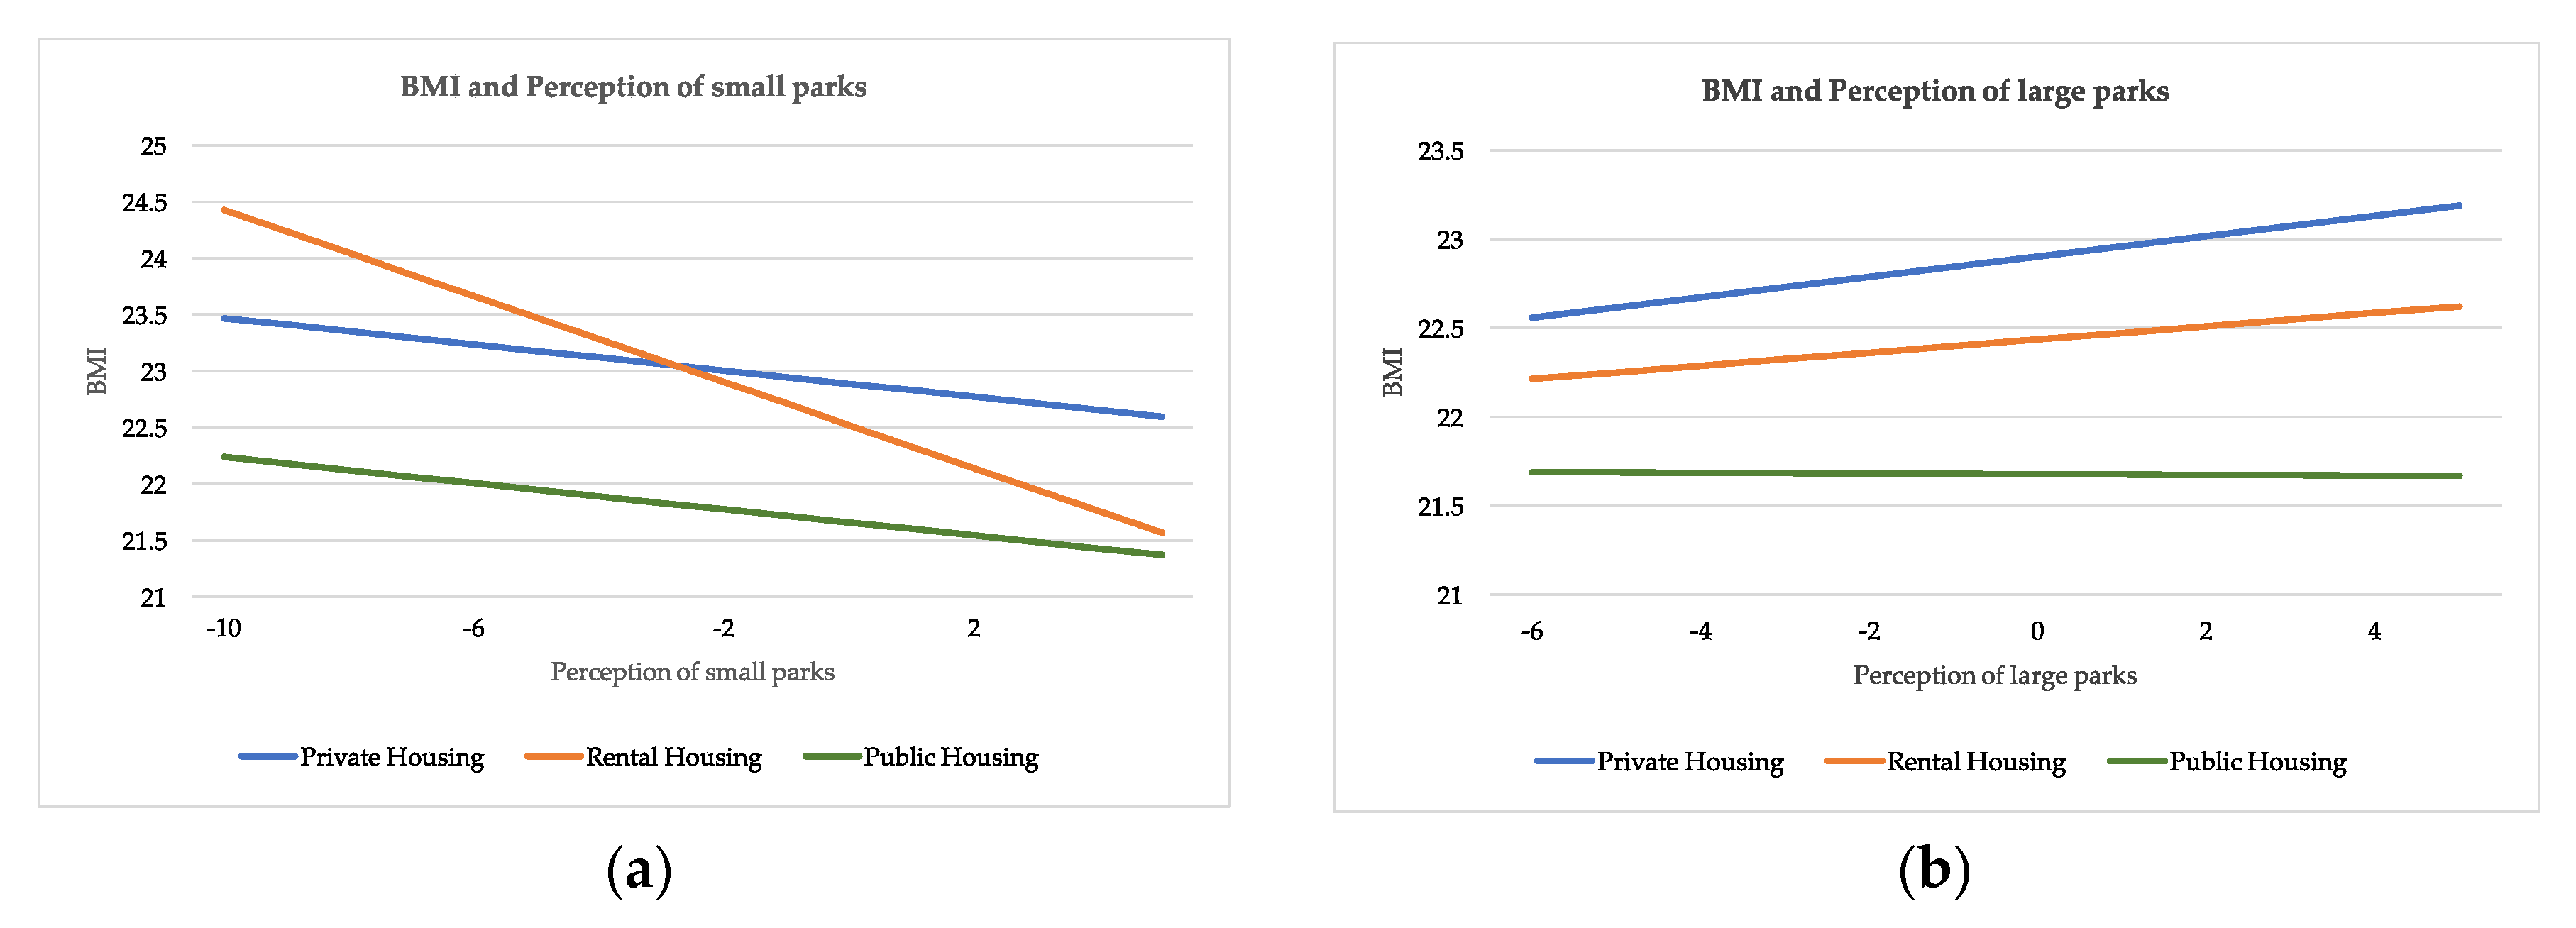
| Perception of small parks | −0.020 (0.018) | −0.176 * (0.100) | −0.002 (0.018) | −0.174 * (0.100) | −0.016 (0.014) | −0.189 * (0.100) |
| Perception of large parks | −0.007 (0.016) | 0.164 * (0.088) | −0.007 (0.016) | 0.169 * (0.087) | −0.004 (0.012) | 0.161 * (0.087) |
| Social values of green space in general | 0.001 (0.014) | −0.109 (0.079) | 0.001 (0.014) | −0.111 (0.078) | −0.001 (0.046) | −0.111 (0.078) |
| Physical value of green space in general | 0.008 (0.013) | −0.002 (0.072) | 0.008 (0.013) | −0.008 (0.072) | 0.006 (0.010) | 0.001 (0.072) |
| Covariates | ||||||
| Age | −4.19 × 10⁻⁴ (0.003) | 0.054 *** (0.018) | −4.19 × 10⁻⁴ (0.003) | 0.055 *** (0.018) | −0.001 (0.002) | 0.053 *** (0.018) |
| Educational level (college and above = 1) | −0.034 (0.066) | −1.070 *** (0.372) | −0.034 (0.066) | −1.056 *** (0.370) | 0.068 (0.050) | −1.017 *** (0.370) |
| Gender (female = 1) | 0.085 * (0.046) | −2.092 *** (0.259) | 0.085 * (0.046) | −2.143 *** (0.259) | −0.032 (0.035) | −2.122 *** (0.258) |
| Hukou origin (migrant = 1) | −0.316 *** (0.051) | −0.584 ** (0.285) | −0.316 *** (0.051) | −0.392 (0.296) | 0.090 ** (0.039) | −0.503 * (0.285) |
| Hukou type (non-agriculture = 1) | 0.107 * (0.060) | 0.395 (0.336) | 0.107 * (0.060) | 0.332 (0.335) | −0.011 (0.046) | 0.391 (0.333) |
| Marital status (married = 1) | 0.162 *** (0.060) | 0.454 (0.340) | 0.162 *** (0.060) | 0.353 (0.341) | −0.123 *** (0.046) | 0.341 (0.340) |
| Level of household monthly income | 0.014 (0.021) | 0.140 (0.119) | 0.014 (0.021) | 0.136 (0.118) | 0.014 (0.016) | 0.160 (0.118) |
| Job type (public sector = 1) | −0.004 (0.050) | −0.220 (0.282) | −0.004 (0.050) | −0.218 (0.280) | 0.080 ** (0.038) | −0.148 (0.281) |
| Commuting time | 0.002 *** (0.001) | 0.005 (0.005) | 0.002 *** (0.001) | 0.004 (0.005) | −0.001 (0.001) | 0.004 (0.005) |
| Employment status (retired = 1) | 0.018 (0.163) | −1.329 (0.917) | 0.018 (0.163) | −1.347 (0.912) | 0.114 (0.124) | −1.234 (0.911) |
| Control variables | ||||||
| Self-reported health | −0.449 *** (0.162) | −0.443 *** (0.161) | −0.459 *** (0.161) | |||
| Time to nearest green space | 0.210 (0.133) | 0.232 * (0.133) | 0.253 * (0.133) | |||
| Constant | 0.435 (0.149) | 22.262 (1.020) | 0.435 *** (0.149) | 21.919 *** (1.026) | 0.096 (0.114) | 22.273 *** (1.012) |
| RMSEA | 0.060 | 0.024 | 0.075 | |||
| CFI | 0.979 | 0.998 | 0.968 |
© 2020 by the authors. Licensee MDPI, Basel, Switzerland. This article is an open access article distributed under the terms and conditions of the Creative Commons Attribution (CC BY) license (http://creativecommons.org/licenses/by/4.0/).
Share and Cite
Lu, T.; Lane, M.; Horst, D.V.d.; Liang, X.; Wu, J. Exploring the Impacts of Living in a “Green” City on Individual BMI: A Study of Lingang New Town in Shanghai, China. Int. J. Environ. Res. Public Health 2020, 17, 7105. https://doi.org/10.3390/ijerph17197105
Lu T, Lane M, Horst DVd, Liang X, Wu J. Exploring the Impacts of Living in a “Green” City on Individual BMI: A Study of Lingang New Town in Shanghai, China. International Journal of Environmental Research and Public Health. 2020; 17(19):7105. https://doi.org/10.3390/ijerph17197105
Chicago/Turabian StyleLu, Tingting, Matthew Lane, Dan Van der Horst, Xin Liang, and Jianing Wu. 2020. "Exploring the Impacts of Living in a “Green” City on Individual BMI: A Study of Lingang New Town in Shanghai, China" International Journal of Environmental Research and Public Health 17, no. 19: 7105. https://doi.org/10.3390/ijerph17197105
APA StyleLu, T., Lane, M., Horst, D. V. d., Liang, X., & Wu, J. (2020). Exploring the Impacts of Living in a “Green” City on Individual BMI: A Study of Lingang New Town in Shanghai, China. International Journal of Environmental Research and Public Health, 17(19), 7105. https://doi.org/10.3390/ijerph17197105