3.1. Spatial-Temporal Analysis of (De)Coupling Conditions
According to the results of decoupling indexes assessment, as shown in
Table 1, there were five decoupling states within the scope of this study, namely, strong decoupling (SD), weak decoupling (WD), expansive negative decoupling (END), expansive coupling (EC), and recessive coupling (RC), sorting from most to least. Based on the decoupling state classification, see
Table 1, SD is the most desirable condition where SO
2 emissions decline along with economic development. Therefore, the frequent emergence of SD indicated that the overall decoupling status of provinces in China was favorable.
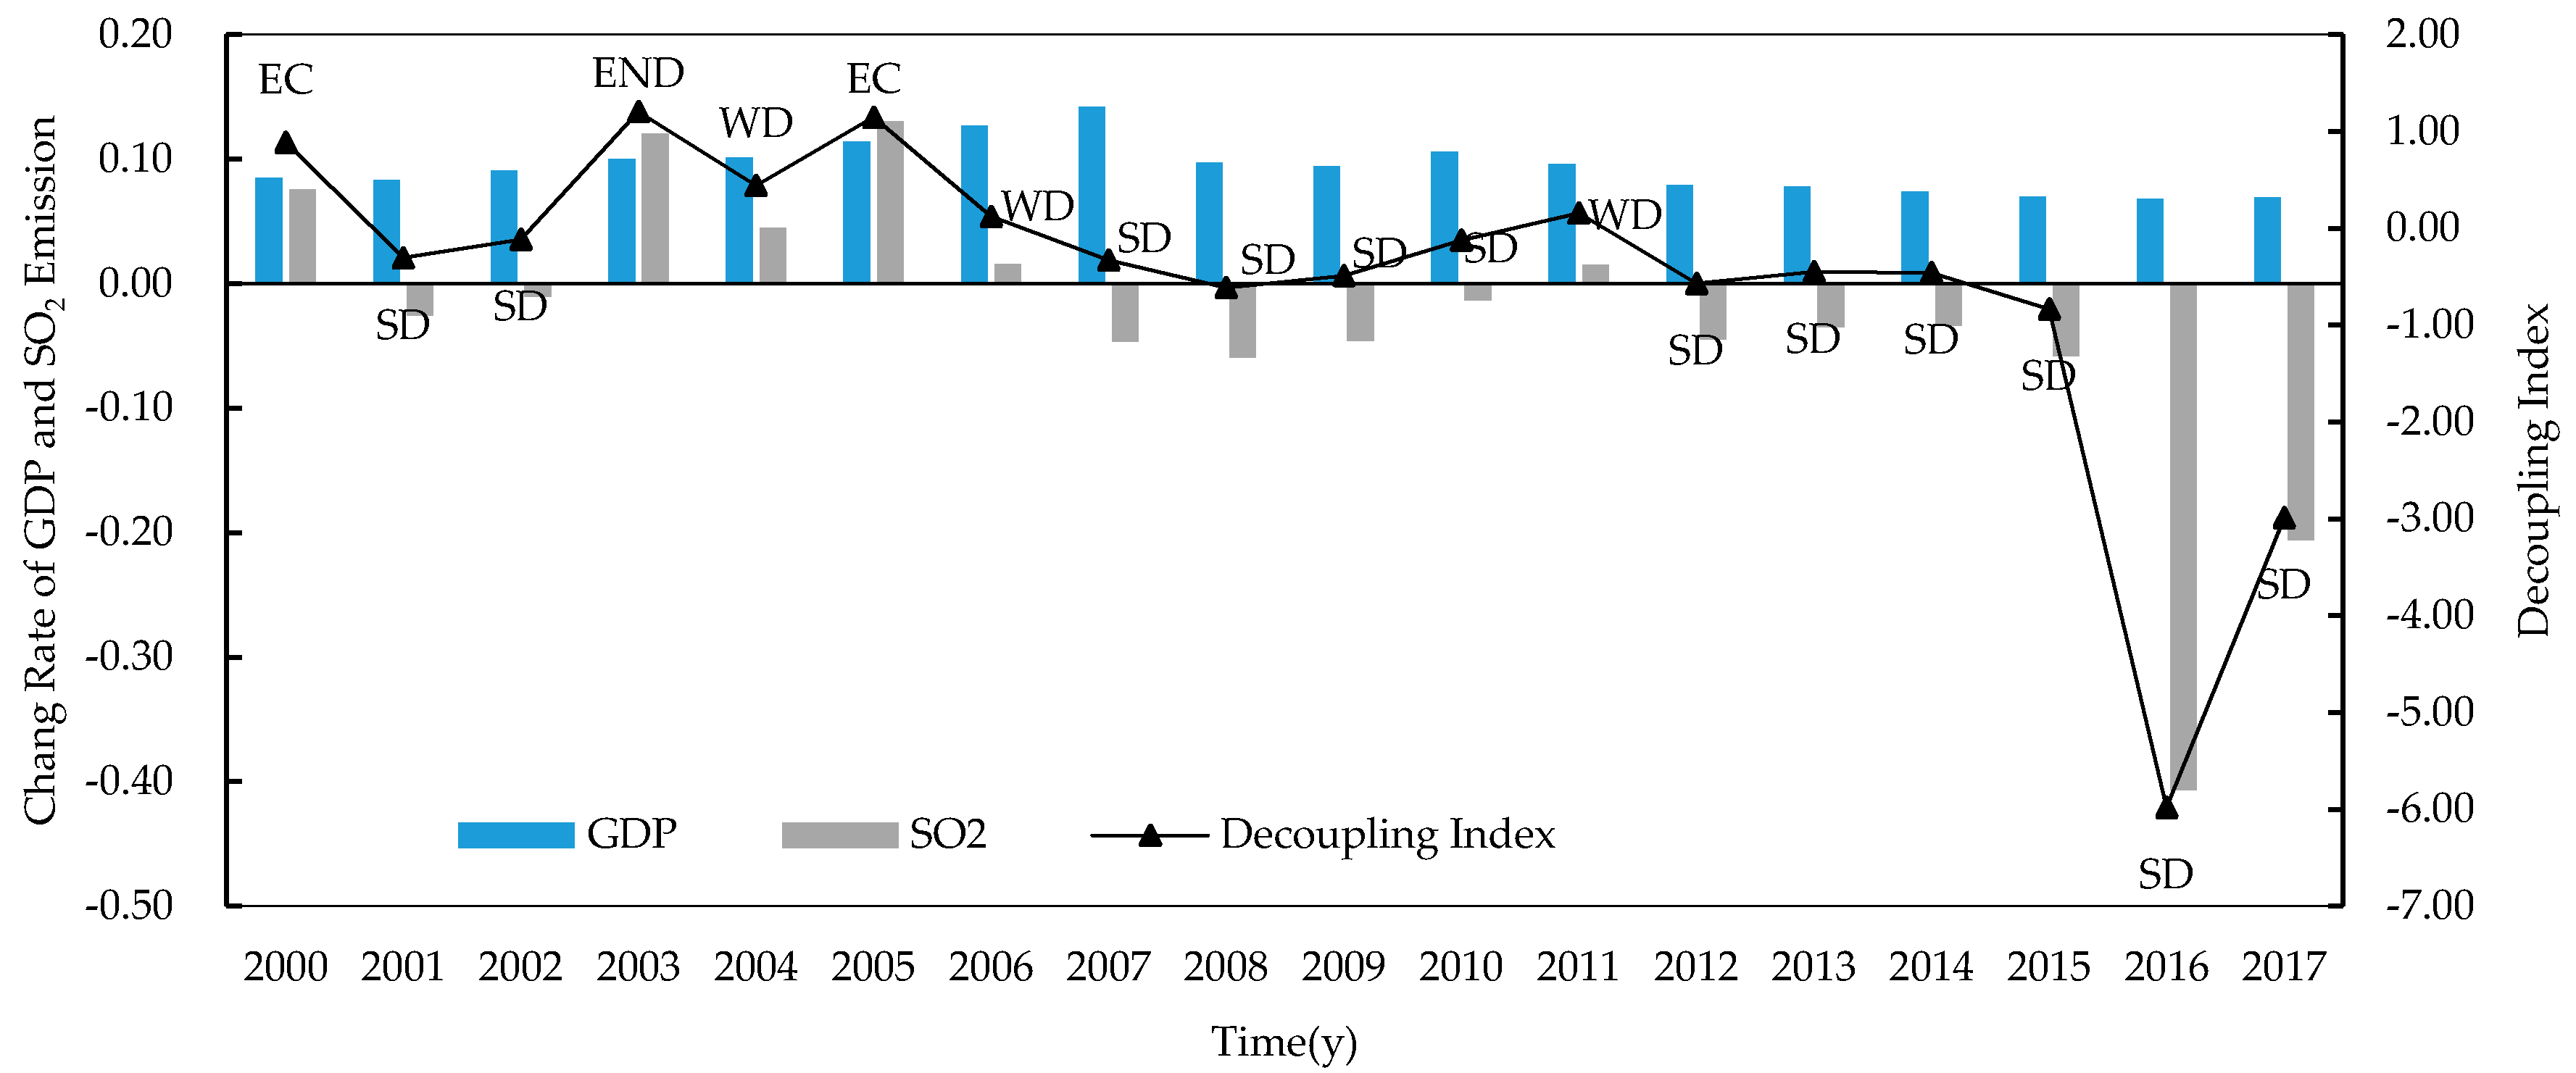
From the perspective of temporal contrast, as shown in
Figure 1, the overall decoupling condition in China was improving. At the beginning of the 21st country, the GDP and SO
2 emission went up together, showing the characteristics of EC. Then, the decoupling situation was unstable from 2001 to 2011 for the fluctuation of SO
2 emission change rates. With economic growth consistently positive, the change rate of SO
2 emissions had been negative since 2012, so that the decoupling condition had remained to SD. It is worth noting that significant decline of SO
2 emissions occurred in 2016 and 2017, which showed the performance of China’s vigorous efforts to combat air pollution in recent years; those efforts consolidated the achievement of reaching SD.
However, the situation varies from province to province; see
Table 4. From 2001 to 2014, there were many changes and fluctuations of the decoupling state. After 2015, 28 provinces reached the SD state, accounting for 93.3% of the provinces studied. Among all the administrative units, Beijing was in the best state, which had almost achieved SD in all periods within this study, except 2004. This situation shows that Beijing’s decoupling condition had been relatively stable.
On the contrary, some provinces should be focused on. As shown in
Table 4, Guizhou was in WD scenario in 2017, where the SO
2 emissions grows more slowly than the economy, which was not the best, but an acceptable condition. The condition in Liaoning became RD in 2016, which means the economy was in recession while the SO
2 emissions decreased even more significantly. Although this condition was good from an environmental point of view, emission reduction at the cost of economic recession was not acceptable. To achieve the goal of sustainable development, the situation in Liaoning province needed to be carefully considered. Moreover, Hainan, Qinghai, and Xinjiang had the fewest SD states among the provinces studied, only six times from 2001 to 2017, which means their situations were precarious and complicated in former years. However, these three provinces reached SD state after 2015, which suggested that their situations were expected to gradually stabilize. For these provinces, recent experience could be referenced and efforts should be made to consolidate their SD situations.
Figure 2a—from the perspective of spatial analysis. In the context of positive economic growth in all provinces, SO
2 emissions increased in only three provinces (Qinghai, Xinjiang, and Ningxia) and fell in all others, so that Qinghai, Xinjiang, and Ningxia failed to achieve SD condition; see
Figure 2b.
The Moran Index scatter plot was used to further assess the spatial relationship among provinces, as shown in
Figure 3a. The
x-axis represents the normalized provincial decoupling index (
) and the
y-axis represents the lagged value, that is, the normalized
of adjacent units of each province. The diagonal in the graph can be regarded as the linear fitting of the scatters. The Moran’s I is the slope of the diagonal, which is greater than 0, representing positive spatial autocorrelation. This result was permutated 999 times to test its significance and the
p value was 0.001, indicating at least 99% certainty that the results were significant. Moreover, it is worth noting that there is an upper-right outlier in
Figure 3a. To exclude its influence on the result, Moran’s I was recalculated after removing the outlier for robust check, as shown in
Figure 3b. The recalculated Moran’s I was still greater than 0, and its
p value after 999 times permutating was 0.028, which was lower than 0.05, indicating that the results were significant at least 95% certainty. That is, generally, the outlier did not have a decisive influence on the results; the decoupling conditions of neighboring provinces would affect each other.
To give a more comprehensive analysis of spatial relationships between provinces,
Figure 3a takes all provinces into account. Specific to each province’s situation, the four quadrants identify four kinds of spatial relationships and they can be further categorized into two groups: positive and negative spatial autocorrelation [
34]. Provinces in the first and third quadrants, respectively, exhibited high–high (H–H) and low–low (L–L) aggregation, indicating that these provinces tended to be adjacent to provinces with similar decoupling indexes, that is, positively autocorrelated. Provinces in the second and fourth quadrants exhibited low–high (L–H) and high–low (H–L) aggregation separately, indicating that these provinces tended to be adjacent to provinces with opposite decoupling indexes, which is called negative autocorrelation. The map of Local Indications of Spatial Association (LISA) aggregation was applied to analyze the spatial correlation and the significance of each province. The LISA is a space-based statistical technique; it gives an indication of the extent to which a significant spatial clustering of homogeneous values existing around a particular observation [
35,
36]. The results of LISA, which indicate spatial correlation of decoupling index in 30 provinces, can be calculated through software GeoDa, as shown in
Table 5.
Four provinces, Xinjiang, Jiangxi, Anhui, and Fujian showed significantly positive autocorrelation. Cross-regional coordination could be considered in these regions. Among these provinces, Xinjiang did not, overall, reach SD state; see
Figure 2. Its conditions could have a bad effect on neighboring provinces. Therefore, in order to maintain favorable decoupling status, the provinces adjacent to Xinjiang should give Xinjiang the necessary assistance to make it achieve SD faster. Moreover, there were four provinces in states of significantly negative autocorrelation, Shanghai, Jiangsu, Zhejiang, and Shaanxi; they were all in H–L condition. All of these provinces had, overall, reached SD state; see
Figure 2. However, their developments might have dampening effects on the surrounding areas. For these provinces, there might be trade-offs with their neighbors. Therefore, these provinces should learn the decoupling trends of neighbors and complement each other when seeking self-development.
3.2. Driving Factors Decomposition of SO2 emissions
Nevertheless, the understanding of decoupling conditions alone cannot maximize the efficiency of SO
2 reduction. Therefore, panel data of 30 provinces from 2000 to 2017 were used to identify the effect of each driving factor on SO
2 emissions. Decomposition and analysis were carried out according to Equations (7)–(17). For the whole country, decomposition factors were calculated, taking the year 2000 as the benchmark; the results are shown in
Table 6.
In general, the impact of elements on SO
2 emissions was negative within this study; see row
, indicating that SO
2 emissions had been overall suppressed in China from 2000 to 2017. The driving factors can be categorized into two groups: the positive factors, which would cause emissions increase, and the negative factors, which could facilitate emissions reduction. As shown in
Table 6, the capital (
), the labor (
), the economic growth level (
), the proportion of secondary sector of economy to GRP (
), the urbanization rate (
) and the fixed assets investment (
) were positive drivers. Obviously, all of these positive drivers are important factors to promote social and economic development, which means that China’s socio-economic development, indeed, led to an increase in SO
2 emissions.
On the contrary, the energy consumption intensity (
), the energy efficient (
), the waste gas treatment investment (
), and the investment efficiency requirement (
) were negative drivers. The first two negative factors are related to energy consumption, which shows that China’s energy management has played a beneficial role in reducing SO
2 emissions. The negative impact of these energy factors is favorable for China, because China remained the world’s largest energy consumer in 2017, accounting for 23.2% of global energy consumption and 33.6% of global energy consumption growth, according to the 2018 British Petroleum (BP) World Energy Statistical Yearbook (
http://www.199it.com/archives/767423.html). As China develops further, it will be difficult for its energy consumption to decline in short-term. Therefore, energy management will continue to be important to SO
2 emissions reduction; the inhibitory effect of energy factors can be good to China’s atmospheric environment protection in the long run. The latter two negative factors are related to investment in waste gas treatment projects, indicating that China’s investment in waste gas treatment has made achievement in reducing SO
2 emissions. The most significant negative driver is
, which denotes the requirement of waste gas reduction investment efficiency. In order to meet the investment efficiency requirement, the Chinese government and enterprises accelerated technological innovation of SO
2 emission reduction and adopted a series of mandatory emission reduction policies. At the second National Conference on Environmental Science and Technology of China, the minister of Ministry of Environmental Protection (now the Ministry of Ecology and Environment) said that technological progress accounted for 66% of sulfur dioxide emissions reduction (
http://www.cinic.org.cn/zgzz/cx/136582.html). Moreover, China issued at least 237 air pollution control regulations at the national level from 2000 to 2017 (data were obtained from the websites of the Ministry of Ecology and Environment (
http://www.mee.gov.cn/), Ministry of Finance (
http://www.mof.gov.cn/index.htm), Resource Conservation and Environmental Protection division of National Development and Reform Commission (
https://www.ndrc.gov.cn/fzggw/jgsj/hzs/), and the Laws and Regulations Database of Peking University), which urged and guided the emission reduction of SO
2 and other air pollutants. All of these reasons made
become the most important emission reduction driver.
However, only a macro analysis of the overall situation of China cannot reveal the changes of each factor over the years. For a rapidly developing country, the effects of each factor are likely to be different at different development stages. Therefore, the analysis of the changes in the impact of various factors in different years will provide a more specific reference for China’s SO
2 emission reduction. To compare the changes of decomposition factors over the years, this study calculated each decomposition factor taking the previous year as the benchmark, the results are shown in
Table 7.
From the perspective of total effect, as shown in column
, the impact of elements on SO
2 emissions was negative only expect that from year 2002 to 2003 and from year 2004 to 2005, indicating that SO
2 emissions suppression in China was relatively stable. The overall positive effect of elements in 2002–2003 and 2004–2005 had leaded to significant increase of SO
2 emissions in China; see
Figure 1, which was the result of multifactorial interaction. To find out the key factors, as shown in row 2002–2003, the positive effect of the fixed assets investment per person (
) was relatively high, while the negative effect of the energy intensity (
) was the lowest compared to other periods. In other words, the fixed assets investment per person significantly contributed to SO
2 emissions increase, while the industrial energy intensity control did not have adequate restraining effect on SO
2 emissions from 2002 to 2003. From 2004 to 2005, the urbanization rate (
) was much greater than that in other periods, while the contribution of
was still relatively low, which means that rapid urbanization contributed significantly to SO
2 emissions while the inhibition effect of industrial energy intensity control on SO
2 was relatively weak compared with other stages.
From the perspective of positive factorization, there were two factors that always behaved as positive drivers, the labor () and the economic growth level (), indicating that labor and economic development always contributed to higher SO2 emissions in China. Besides, the capital (), the proportion of secondary sector of economy to GRP (), the urbanization rate (), and the fixed assets investment per person () exhibited acceleration impact on SO2 emissions in no less than 14 years. Among all the positive drivers, the labor (), the economic growth level (), the capital (), the urbanization rate (), and the fixed assets investment per person () are key indicators of national progress, and cannot be suppressed just for the sake of SO2 emission reduction. While, the proportion of secondary sector of economy to GRP can be weighed in the future. In fact, the adjustment of economic structure has been attached great importance by the Chinese government, and great breakthroughs have been made in the past period of time. However, according to data from the World Bank World Development Indicator (WDI) database, in 2017, the proportion of secondary industry was 40.5% in China, while this proportion was less than 30% in developed countries, such as the United States, Japan, and Canada, which means that China’s economic structure still has potential for optimization. To reduce the proportion of secondary industry and, thus, its impact on SO2 emissions, the Chinese government should continue to encourage non-industrial enterprises to drive the economy. For example, the government could sequentially improve the proportion of primary and tertiary industry in GRP to optimize the structure of enterprises in China.
From the perspective of negative factorization, the intensity () and the efficiency () of energy consumption had suppression impact on SO2 emissions in 16 years, and they all remained negative after year 2013, indicating that the inhibition of SO2 emissions by energy management was stable over years, which is beneficial for China, referring to the macro analysis of the whole country above. For the waste gas treatment investment (), and the investment efficiency requirement (), the conditions before 2015 were unstable, while these two factors remained negative from 2015 to 2017. Whether they will change next is still uncertain; thus, the government and enterprises need to take necessary measures to stabilize their negative influence.
3.3. Limitations
Due to the lack of public data, some factors affecting sulfur dioxide emissions, such as indicators measuring the development of SO2 filtration technology, were not taken into account in the model. This issue also made some indicators be not straightforward. As there is no available public data on investments specifically for SO2 treatment, the investment in industrial waste gas treatment projects was used to estimate the investment strength of waste gas treatment and the investment efficiency requirement. However, the waste gas projects mainly include desulfurization and denitrification, they do not solely consider SO2. In addition, at the provincial level, comprehensive energy consumption data for the secondary industry are not directly disclosed in China. For China’s energy consumption is mainly generated by the secondary industry, the total energy consumption, instead of the energy consumption for the secondary industry, was used to measure the energy intensity and efficiency.
Moreover, this paper used the data of each province in China to study the factorization of the whole country, and the analysis was relatively macro, while the situation of each province was different, so the factorization of each province would be more targeted. However, according to the principle of the GLMDI model, more microscopic data are needed to realize the factor decomposition at the provincial level, such as the data of cities within the jurisdiction of each province. At present, some data of key driving factors, such as the investment data of waste gas treatment, are not publicly available at the city level, which limits further refinement of the study. In future research, further optimization of index selection can be considered, and different theoretical models can be tried to achieve the impact factor decomposition at the provincial level.


