Air Quality Change in Seoul, South Korea under COVID-19 Social Distancing: Focusing on PM2.5

 ,
,  , , , and
Abstract
:
1. Introduction
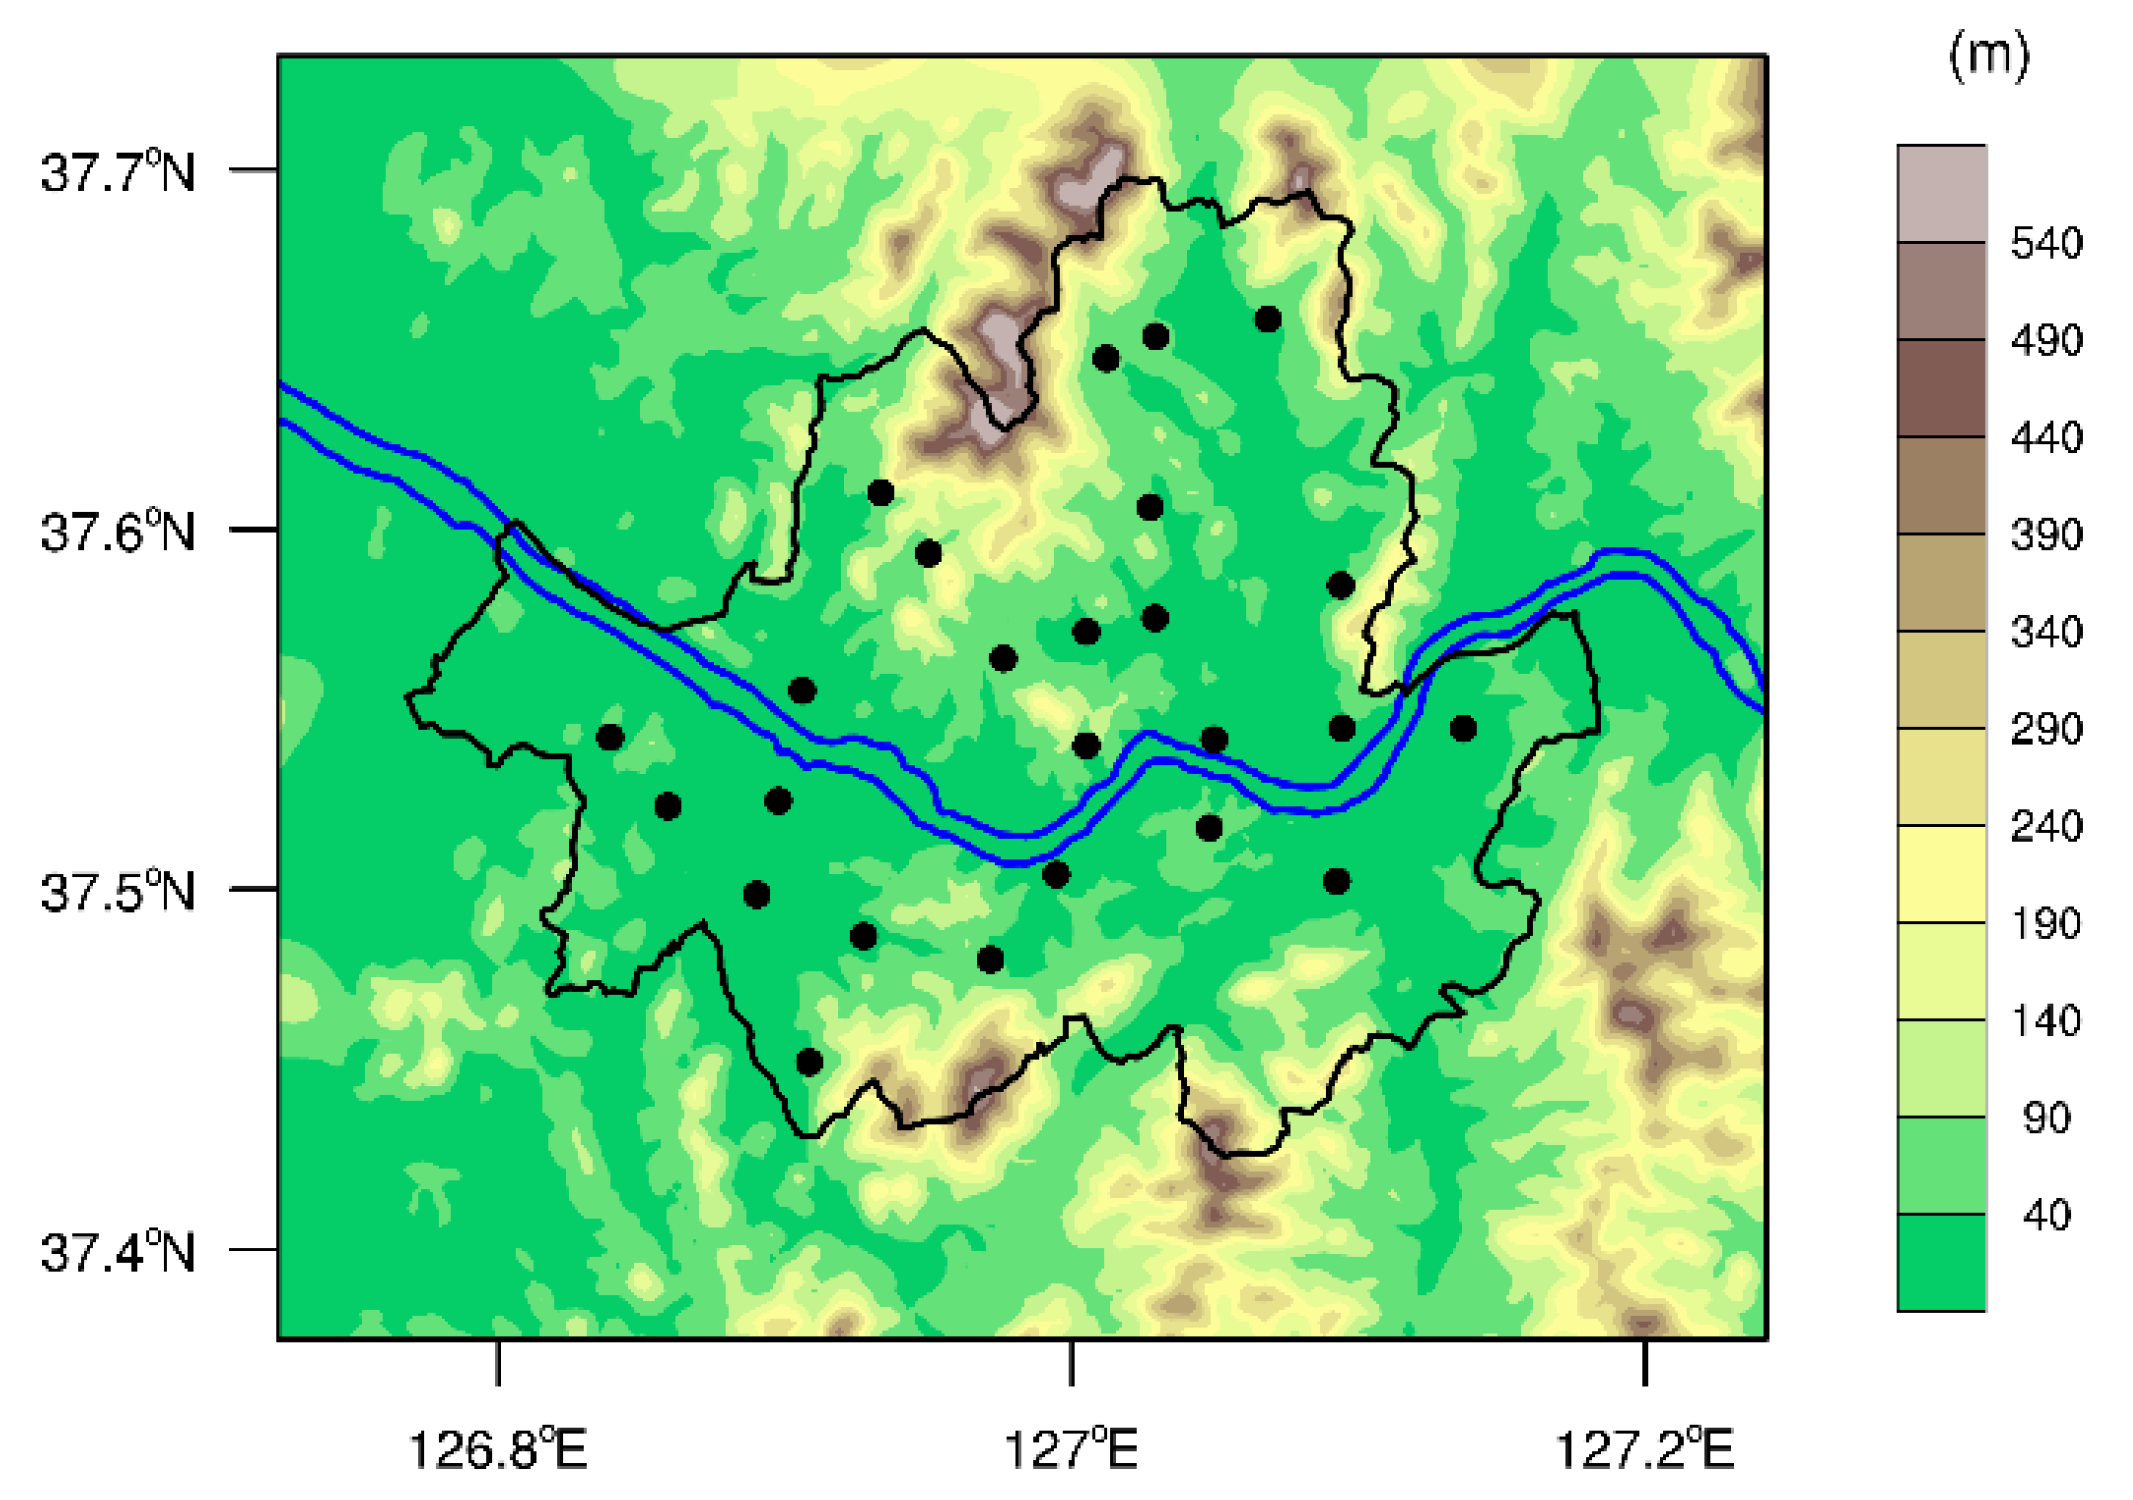
2. Data and Methods
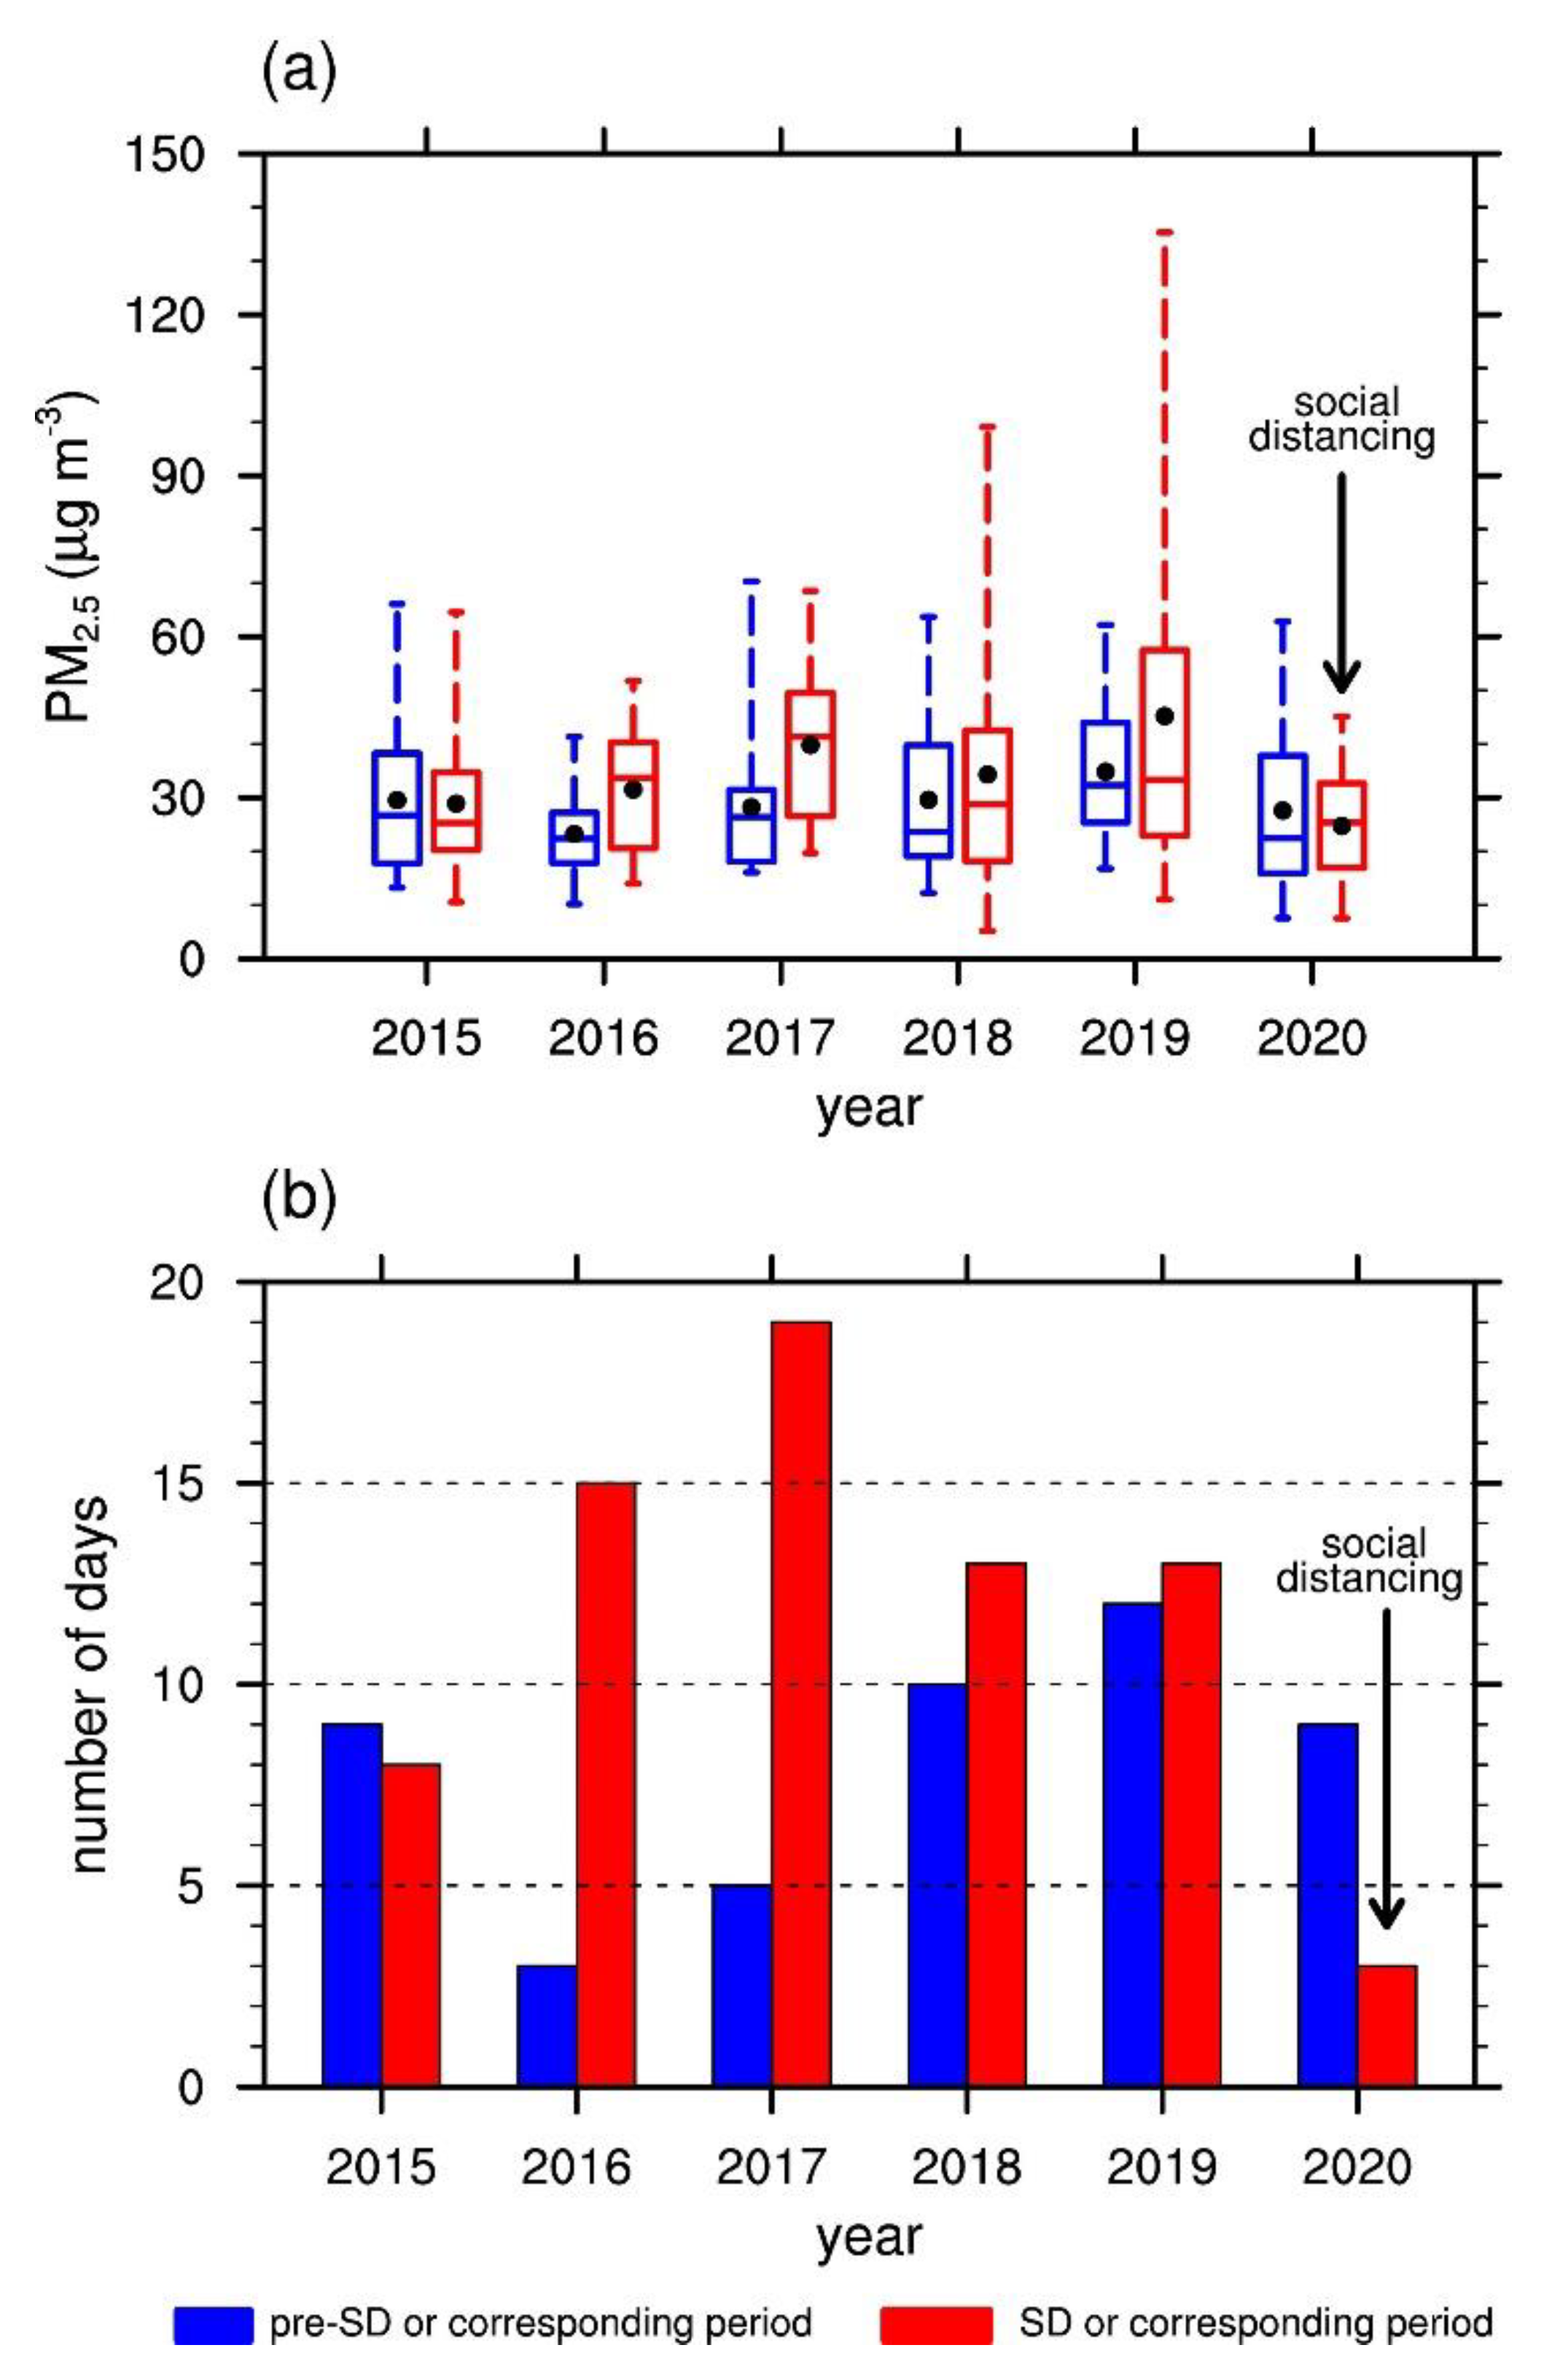
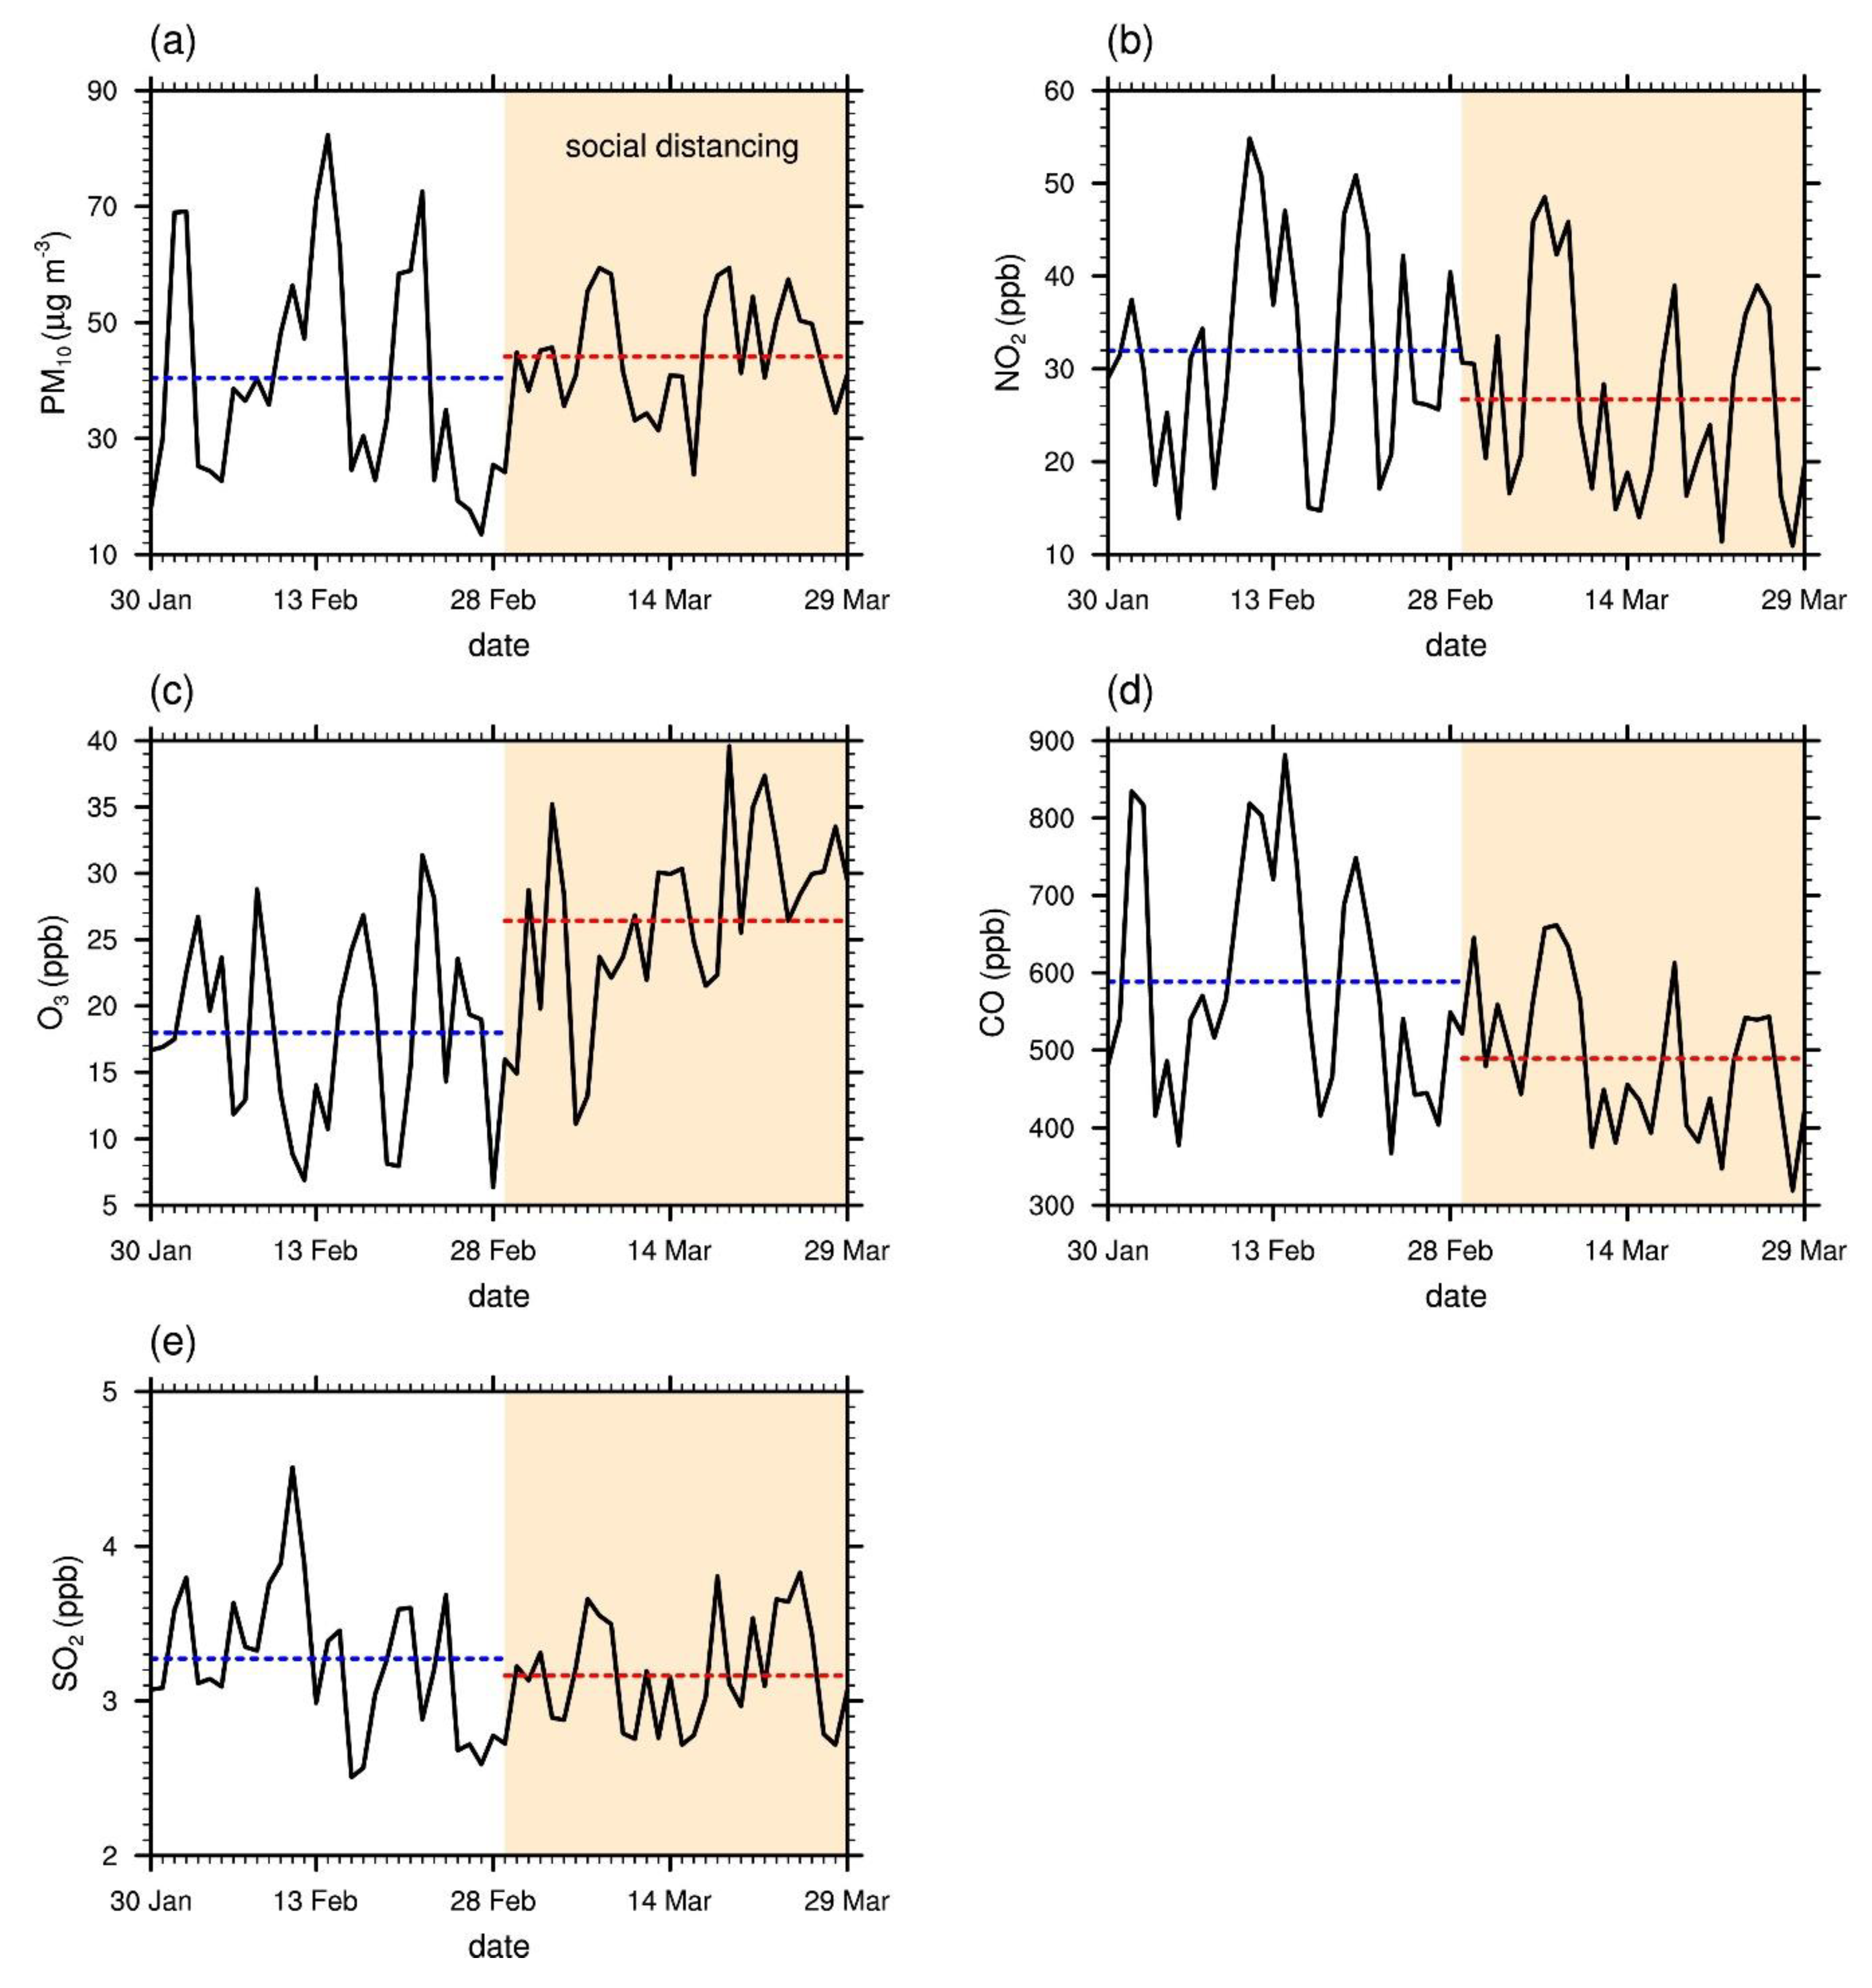
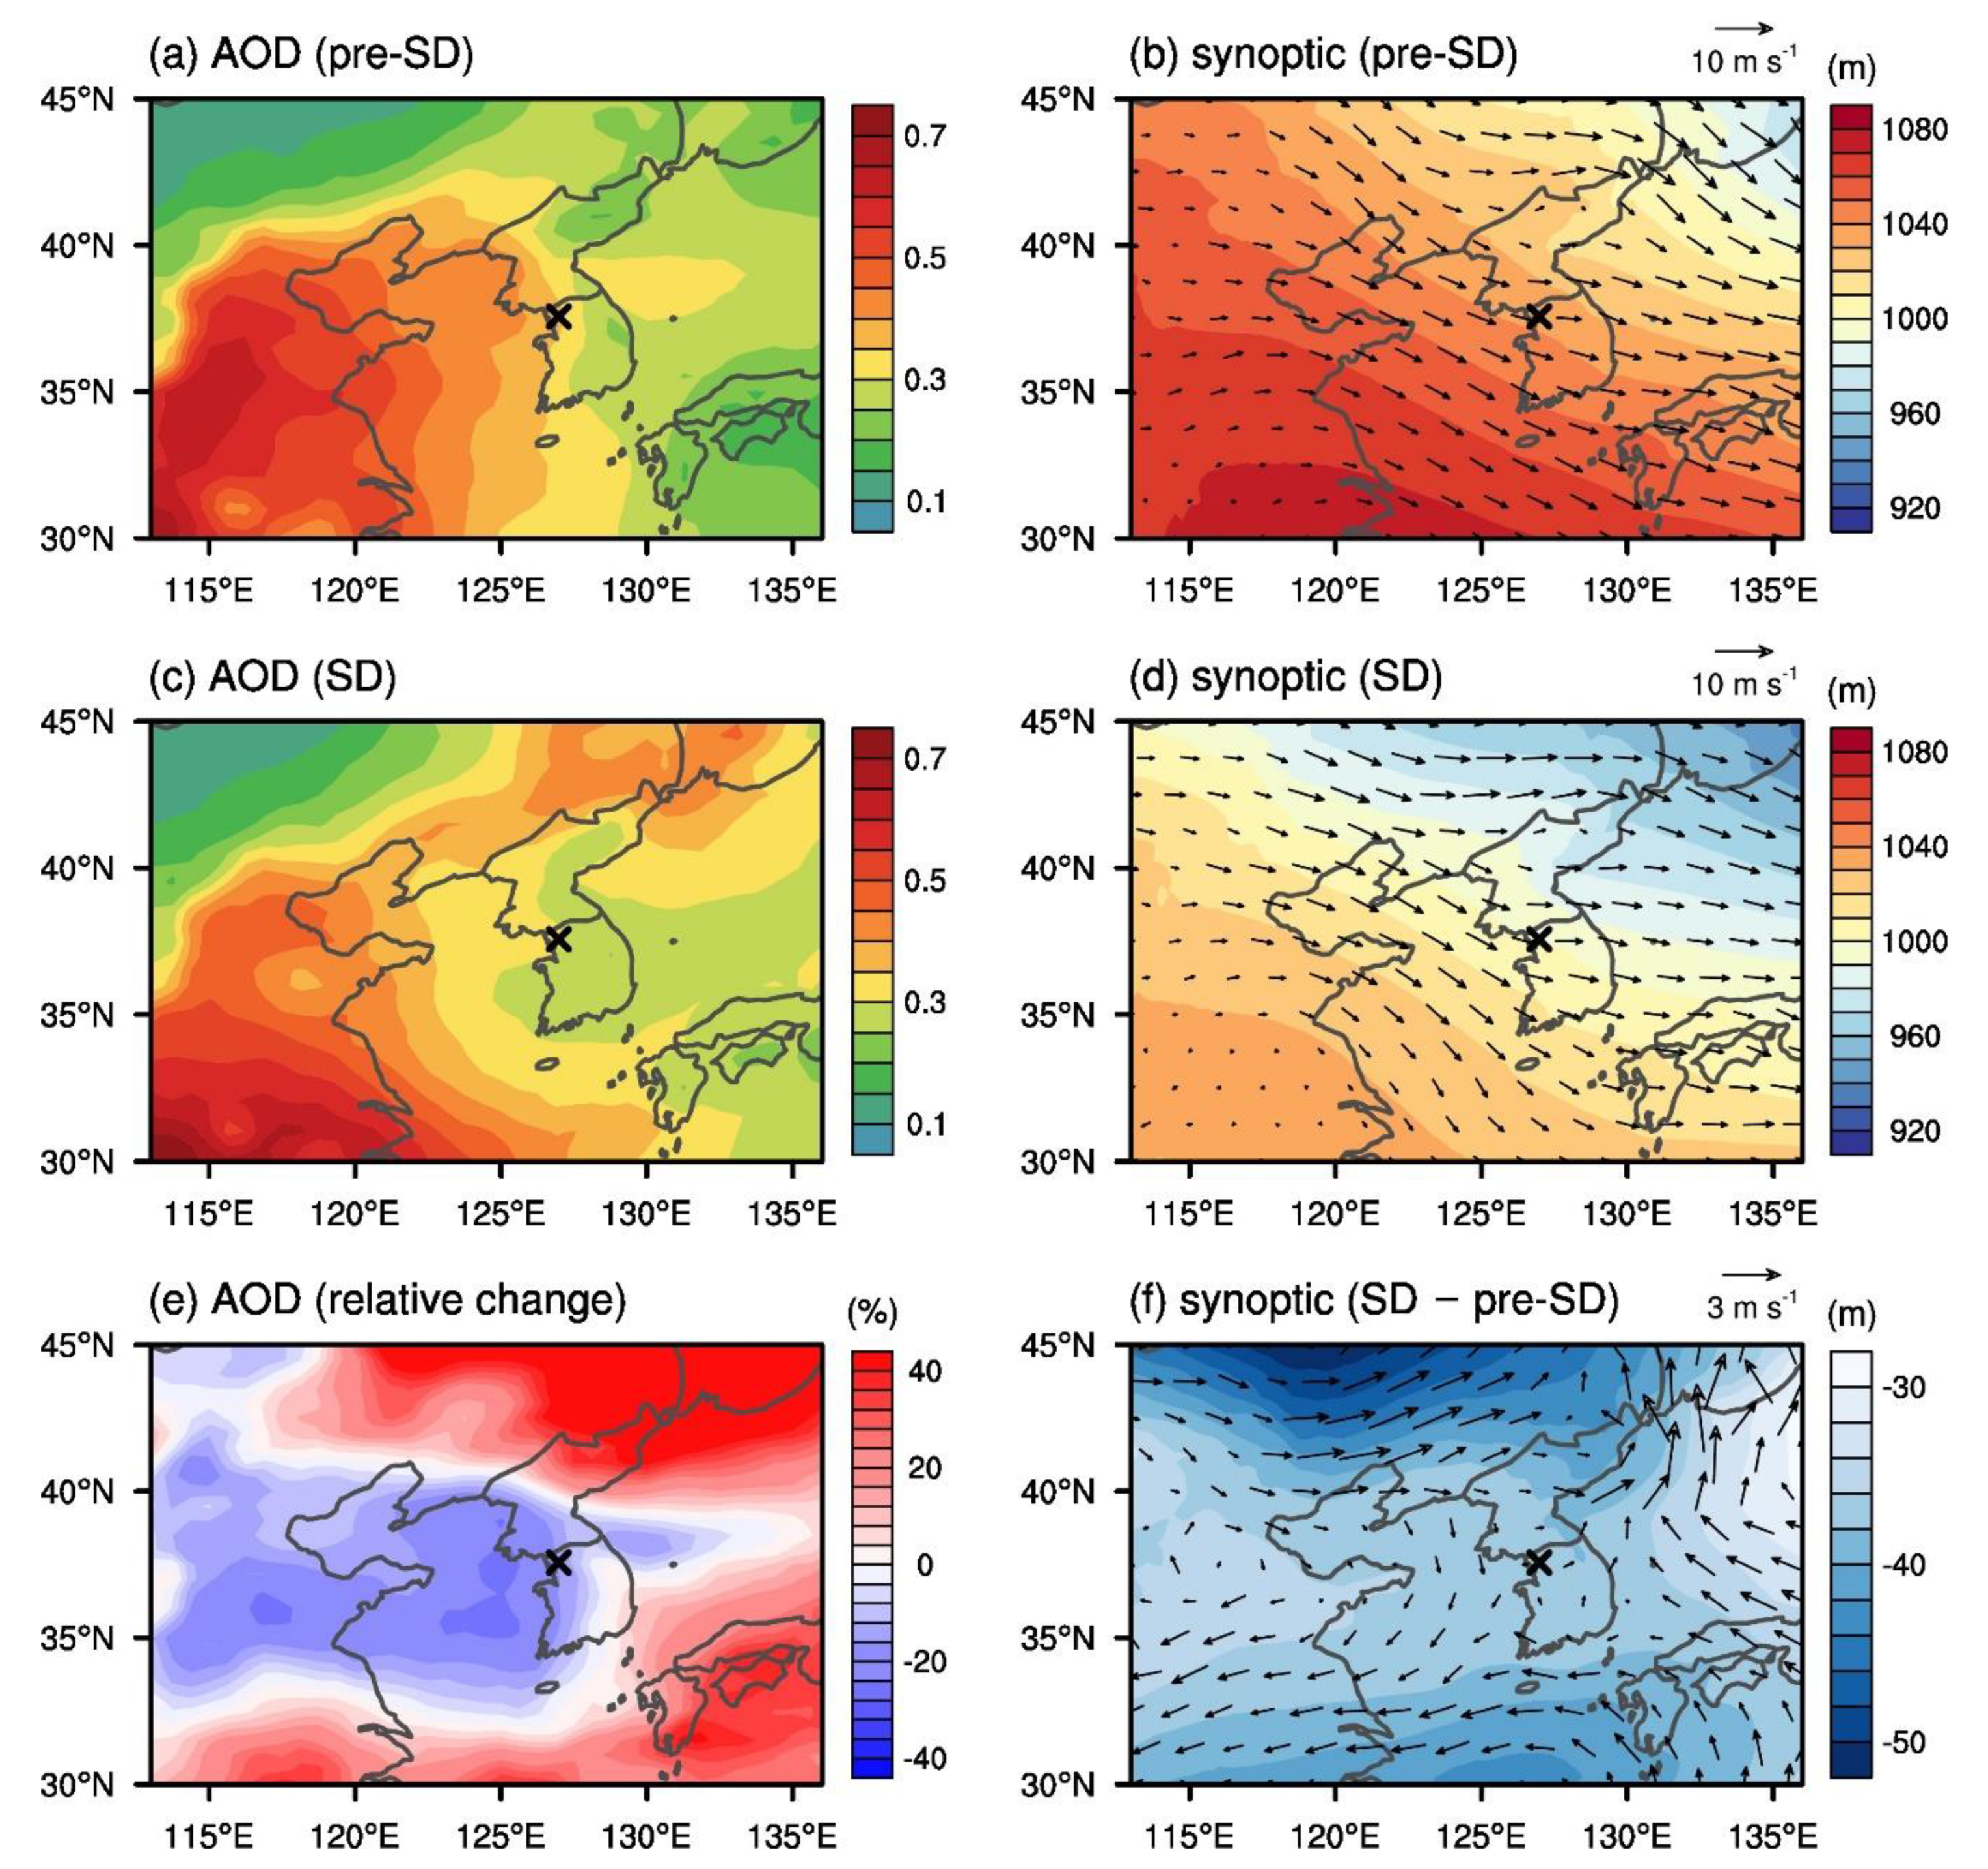
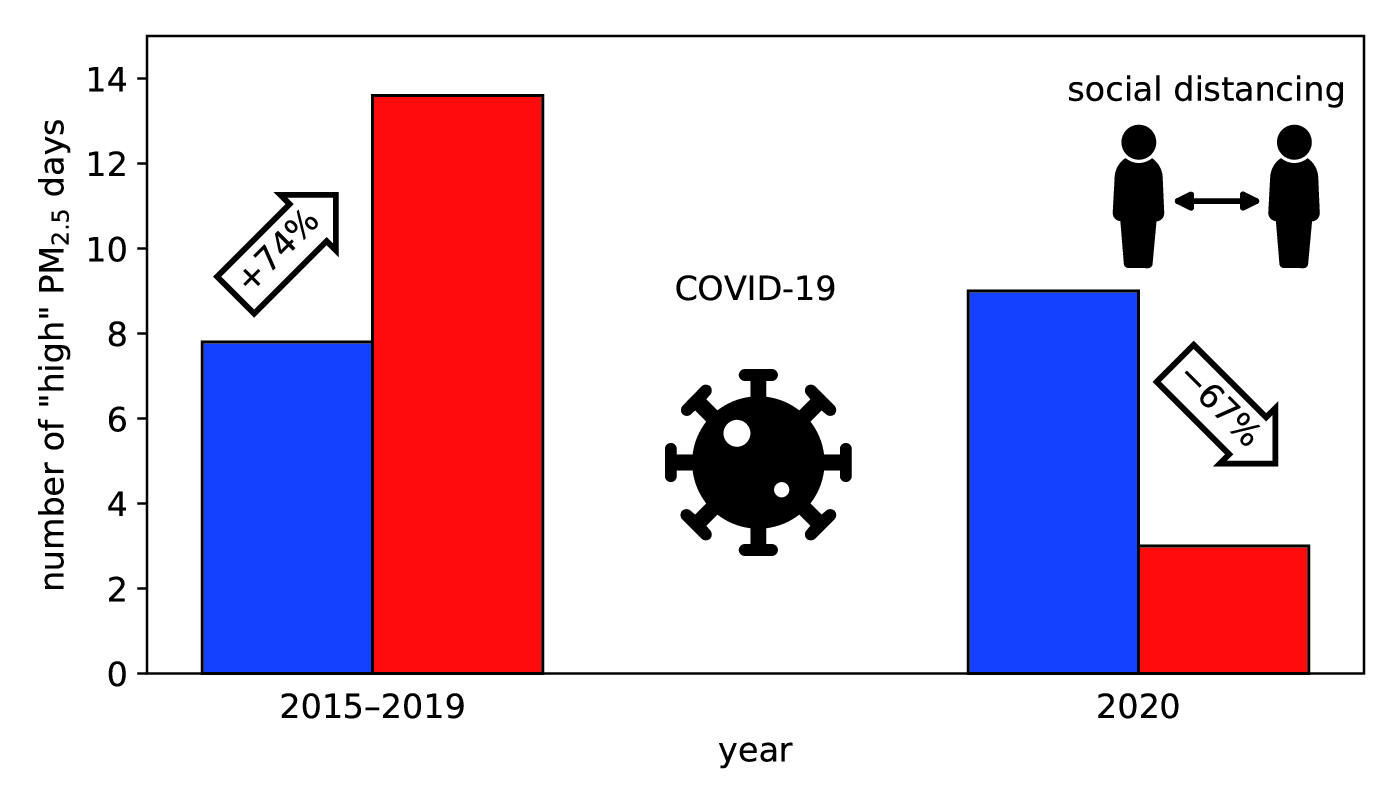
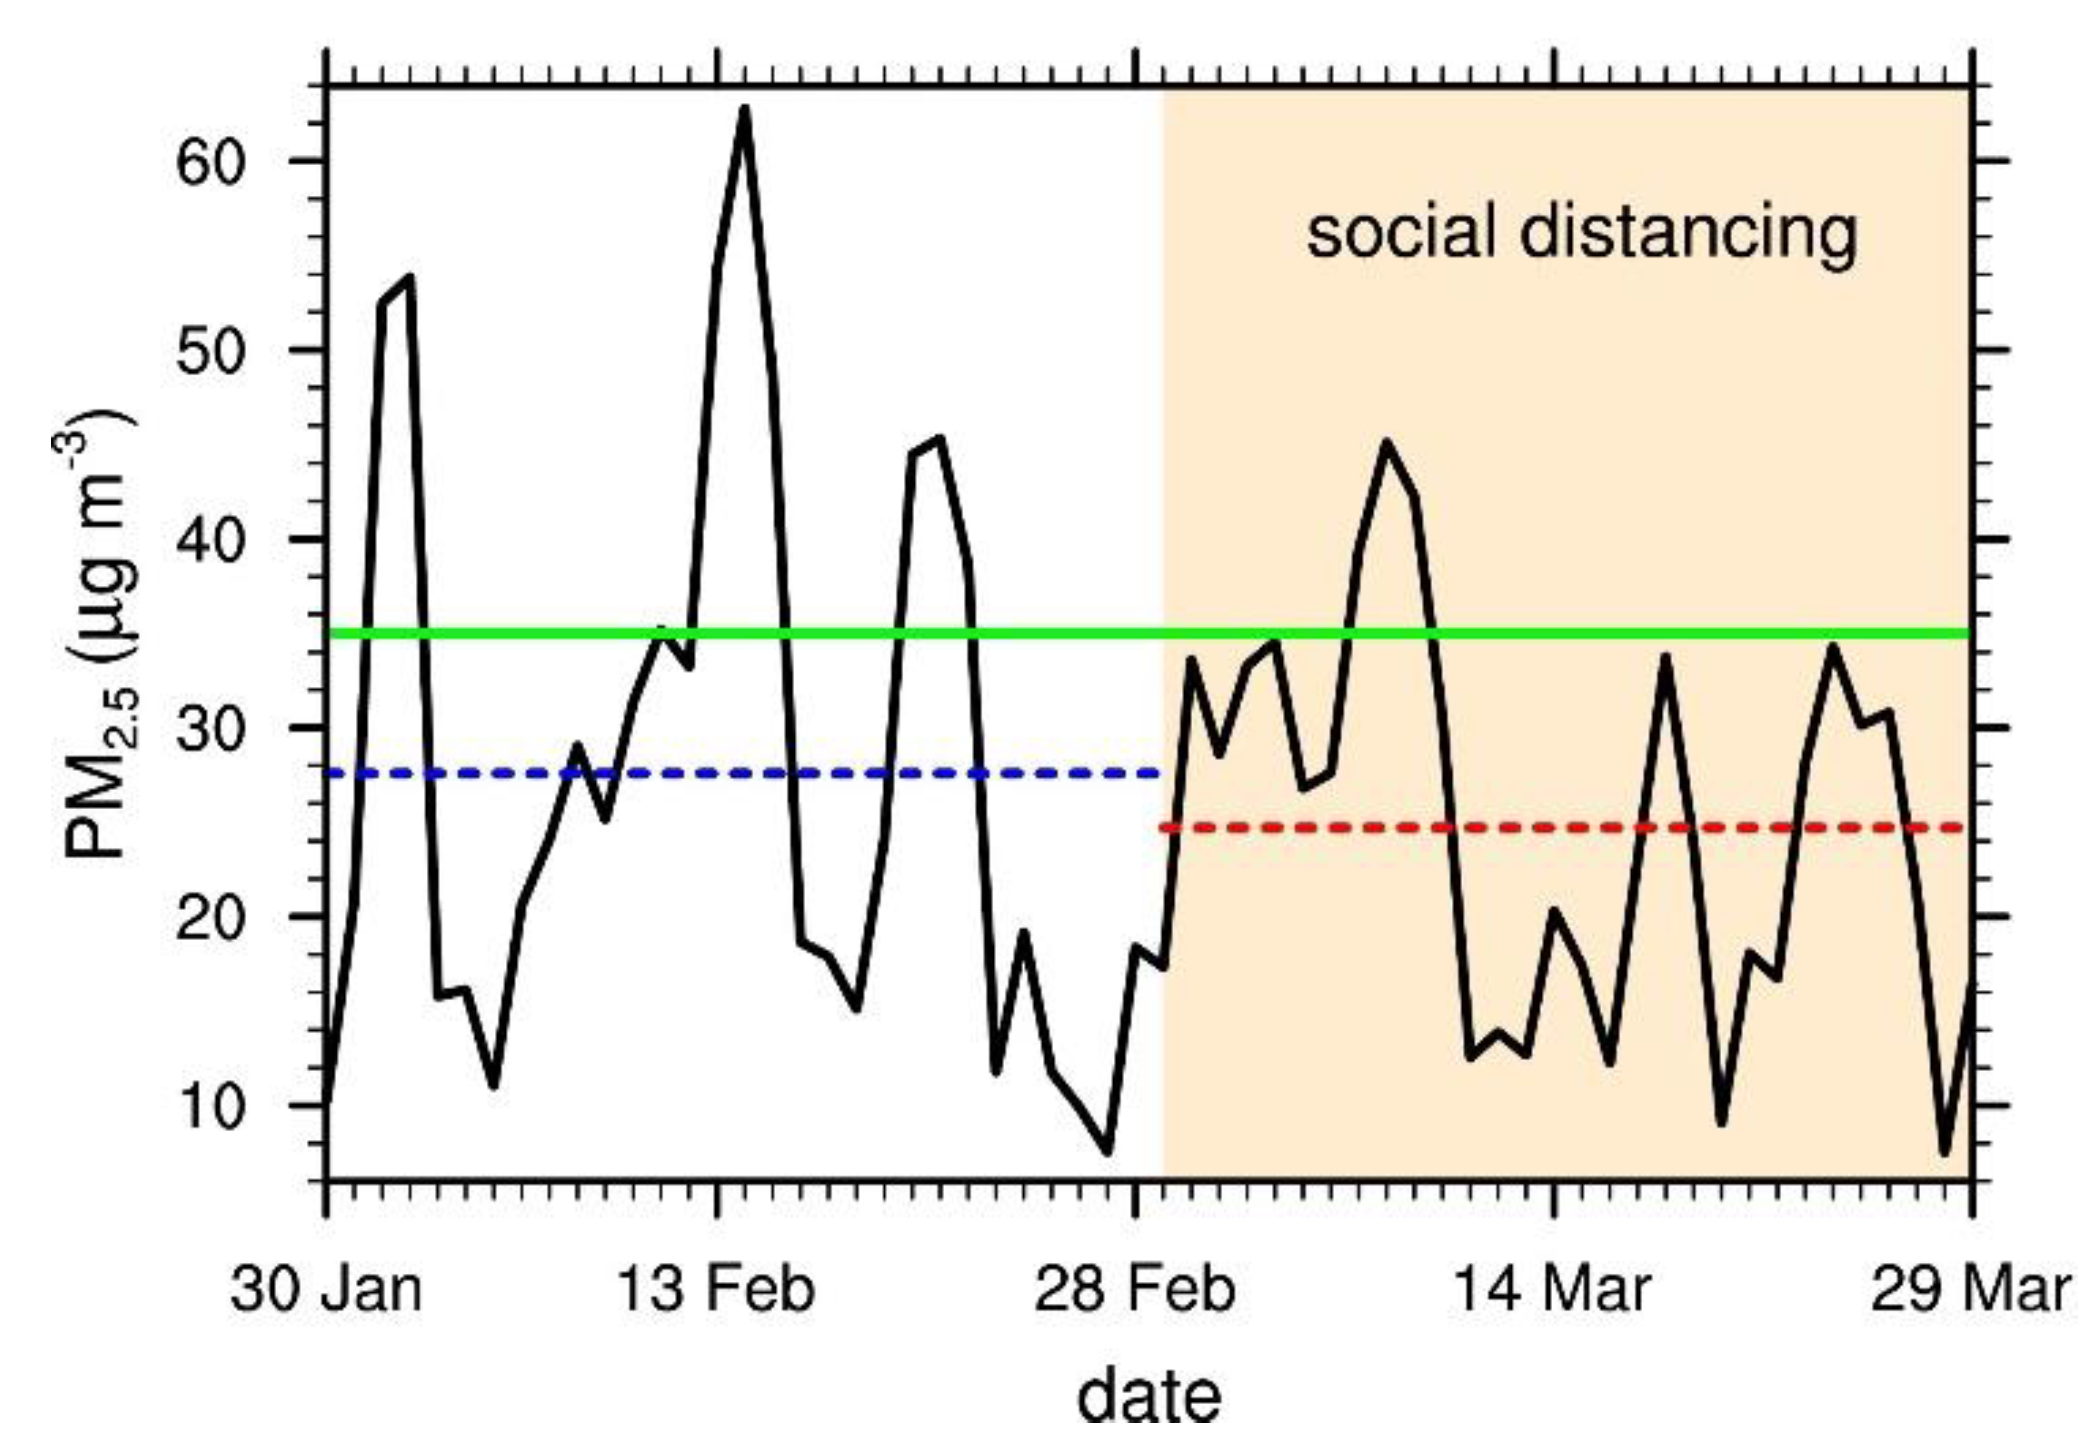
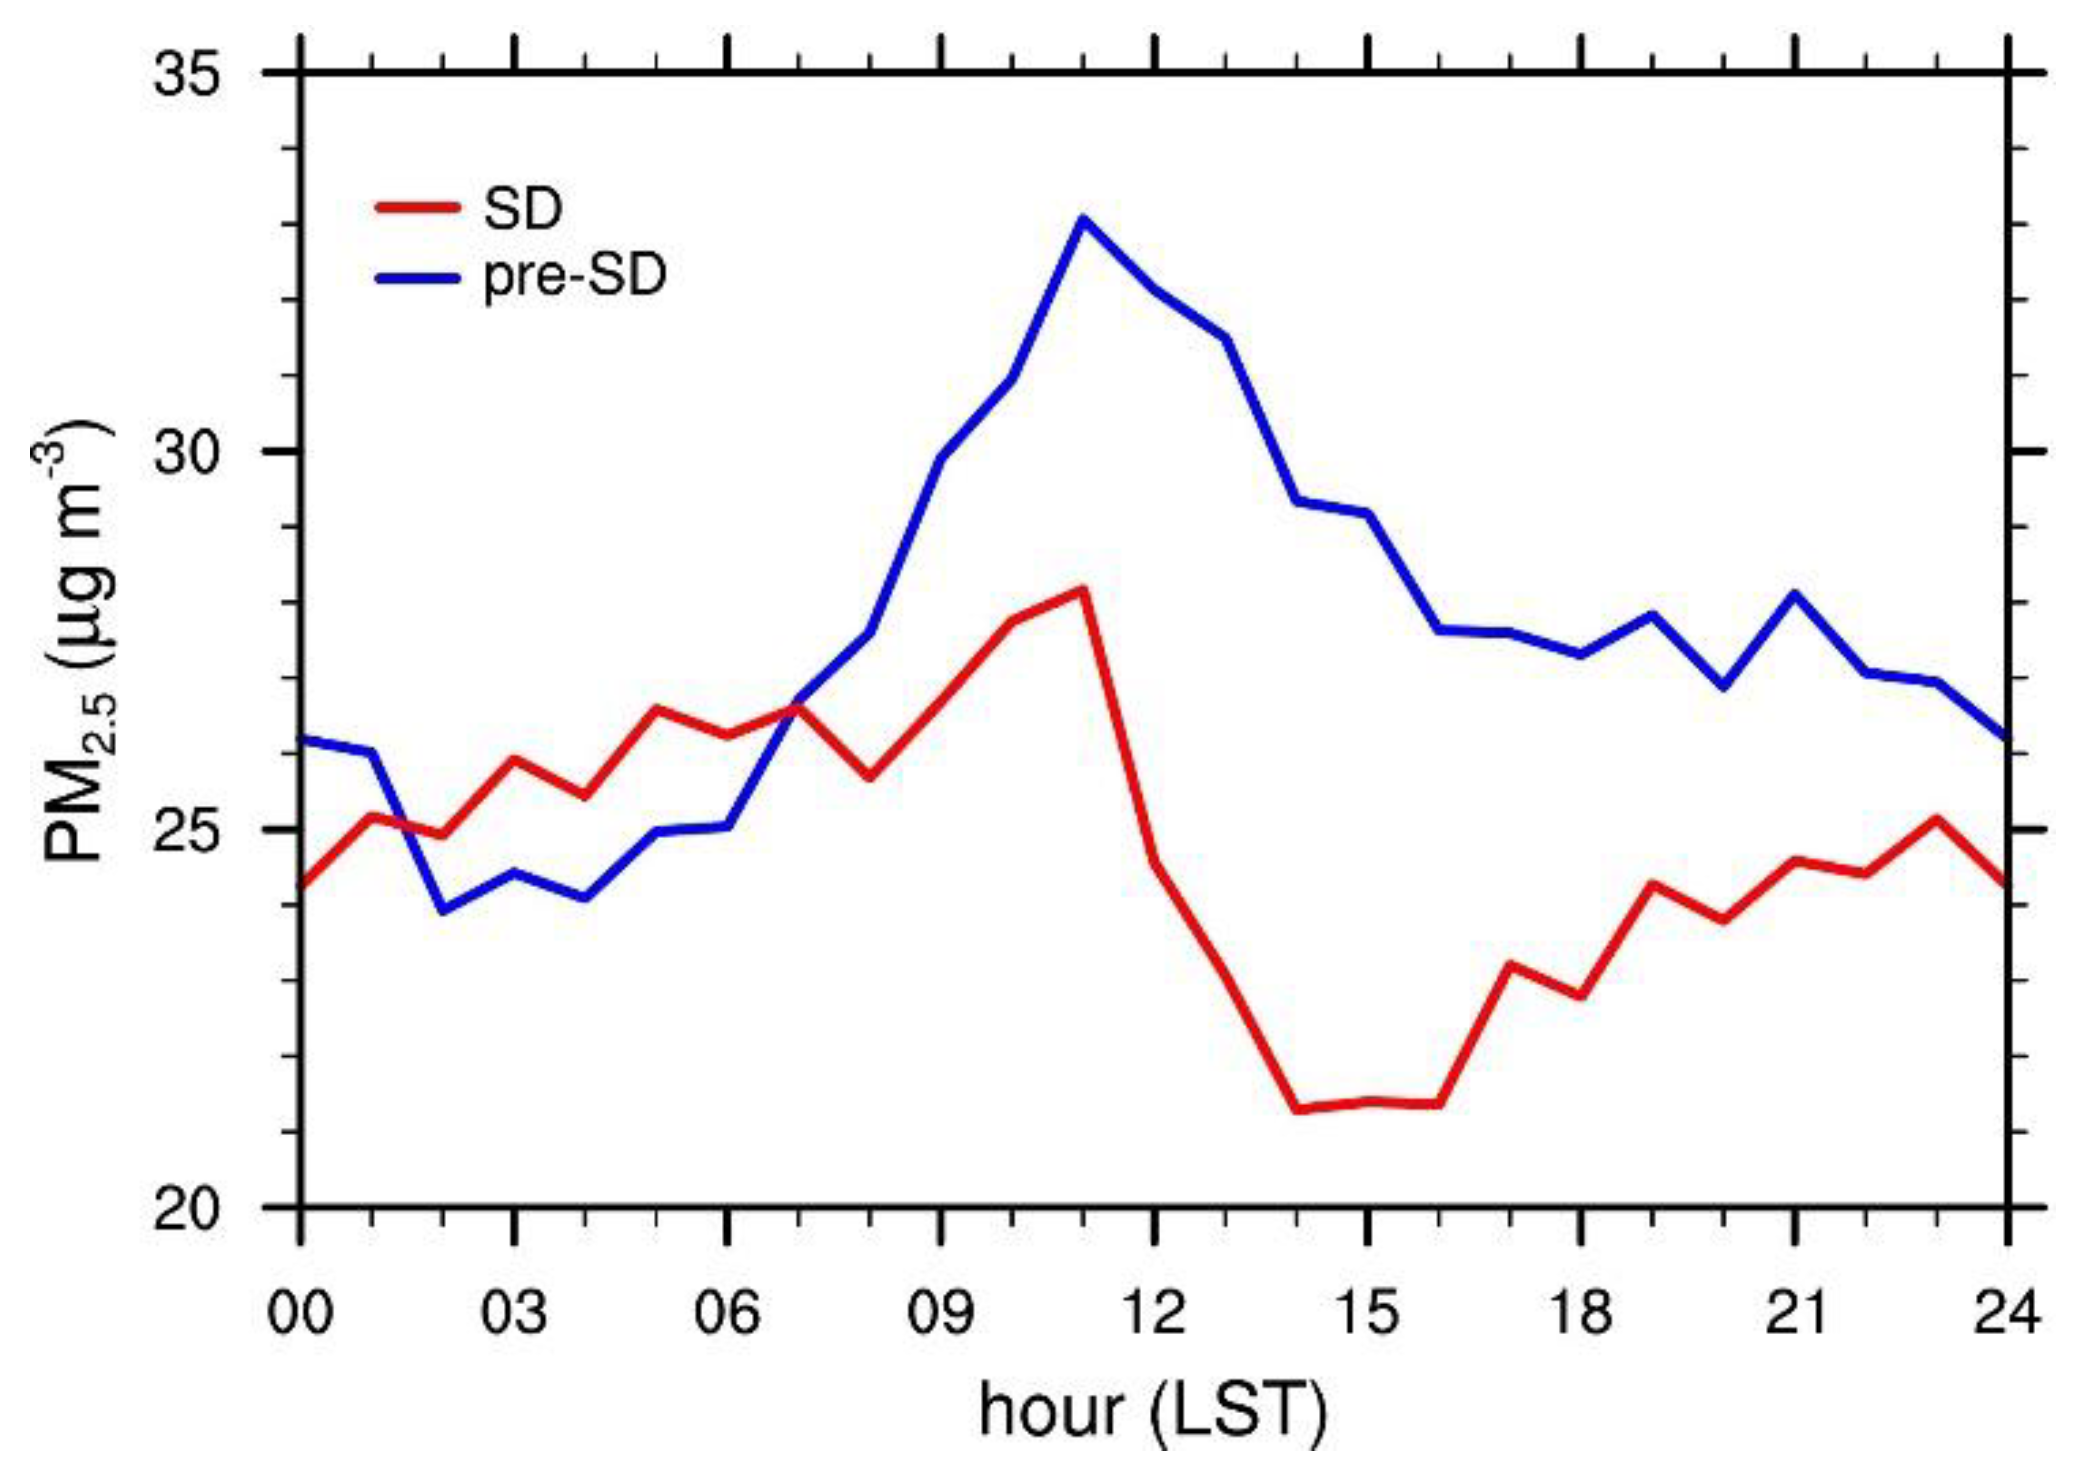
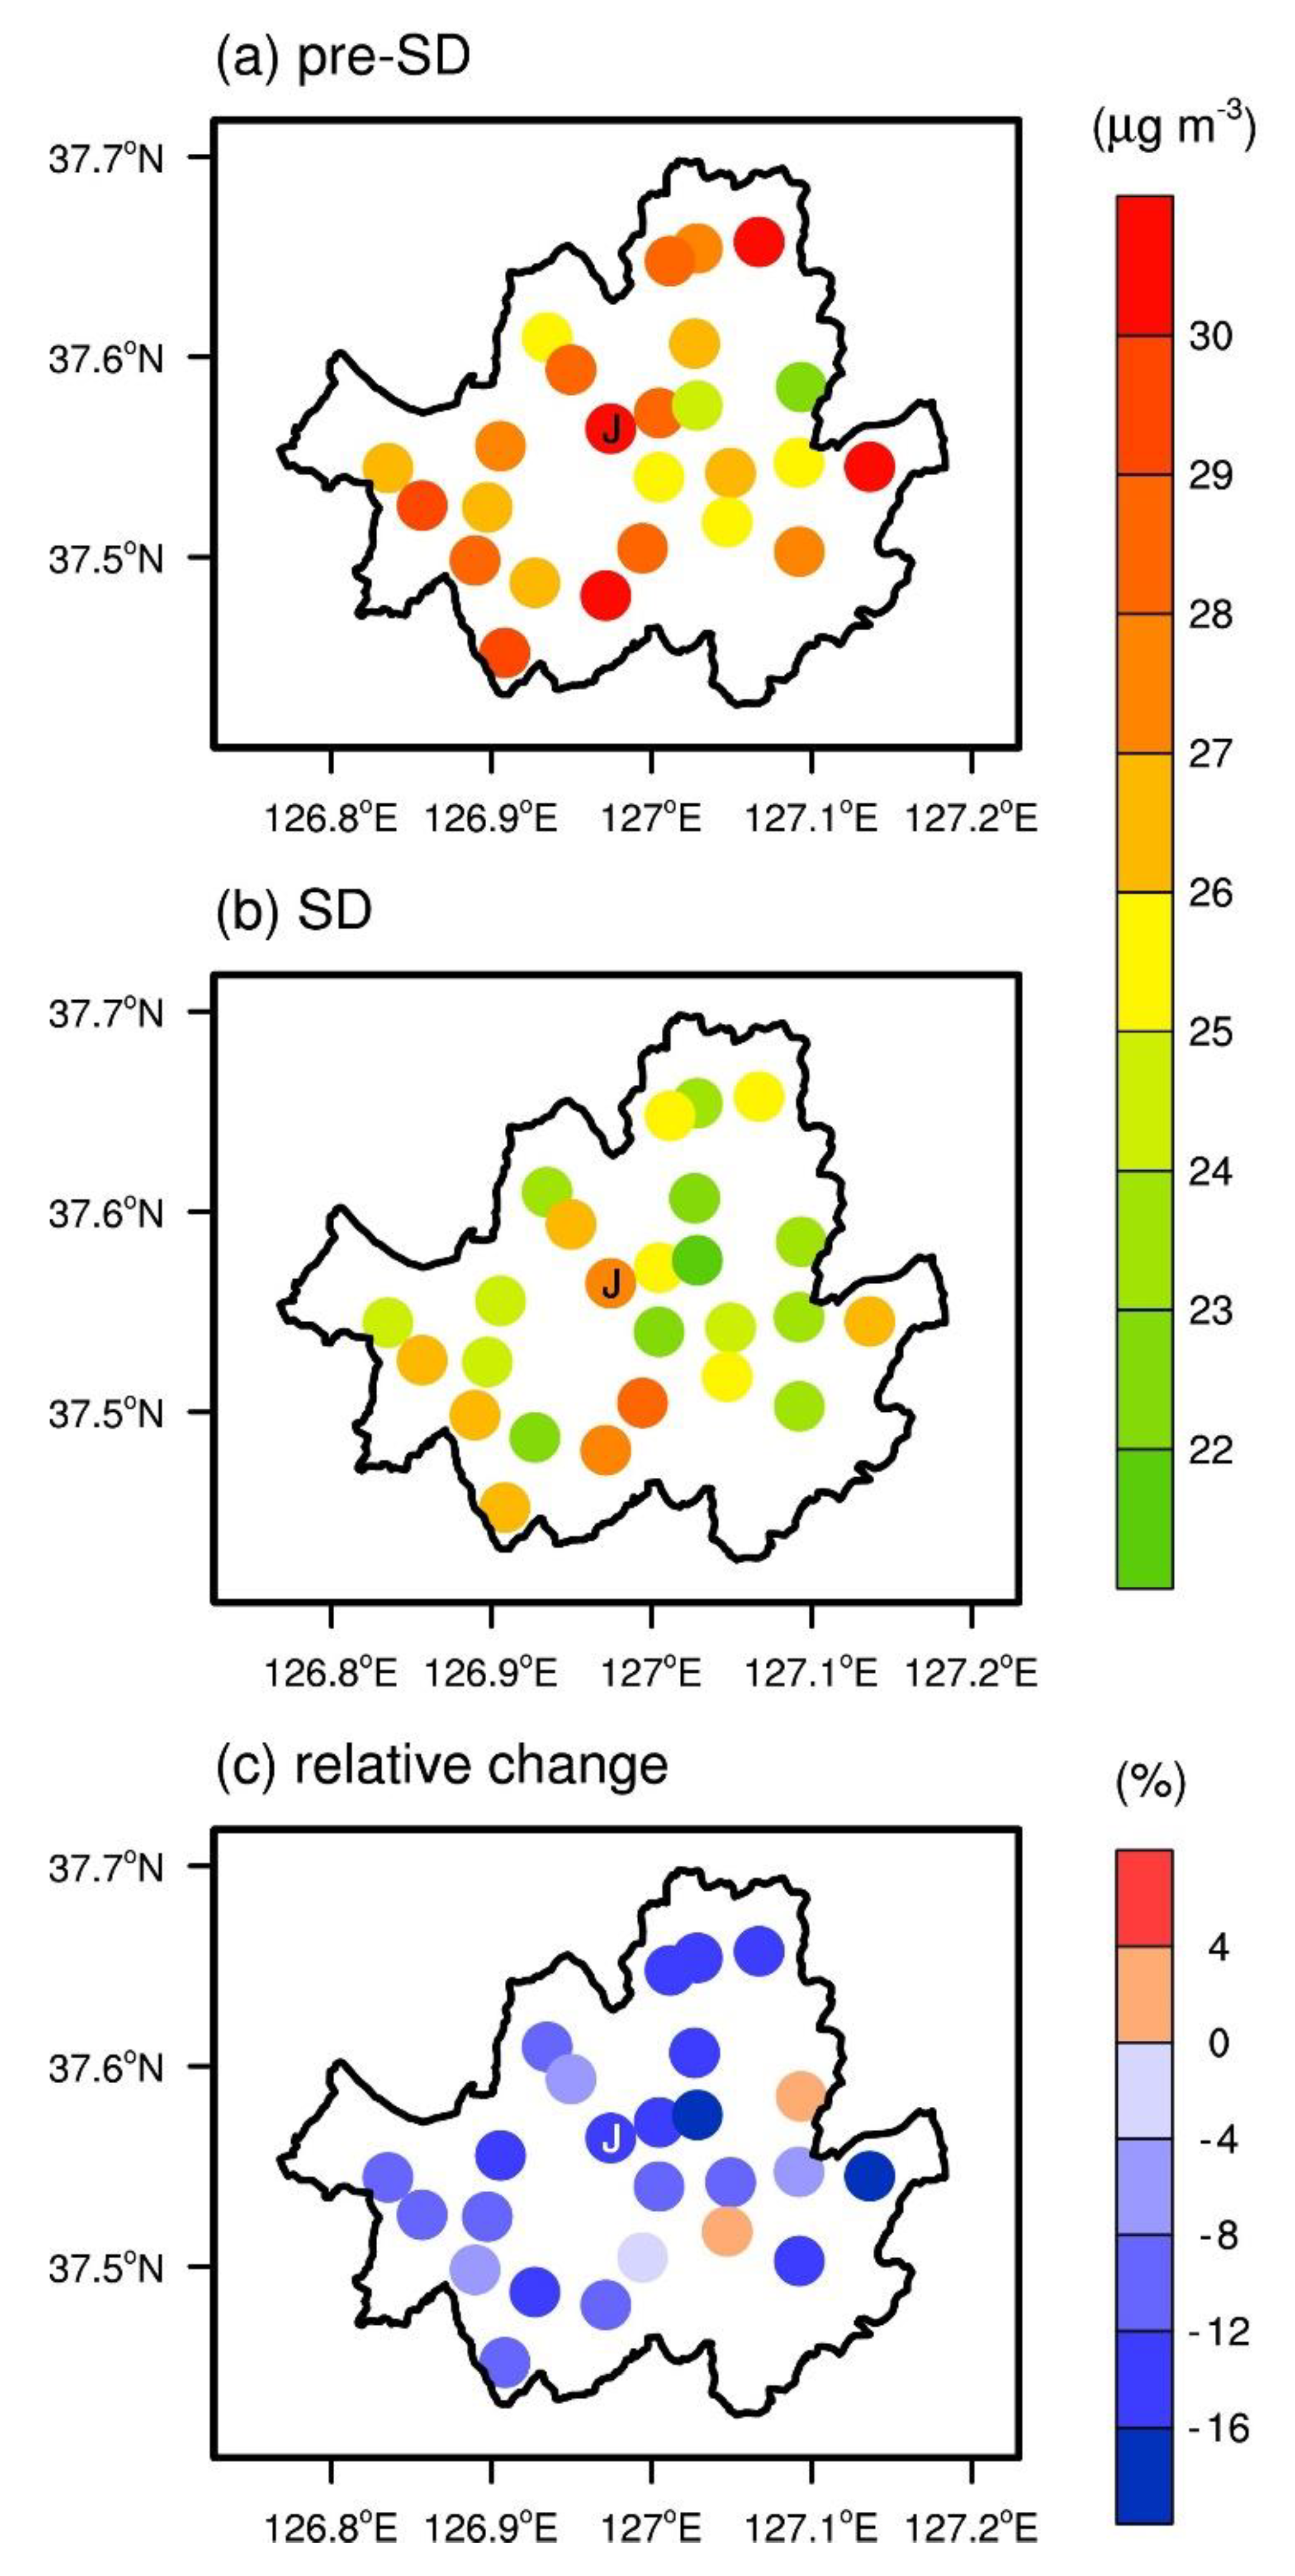
3. Results and Discussion
4. Conclusions
Author Contributions
Funding
Acknowledgments
Conflicts of Interest
References
- Arora, S.; Bhaukhandi, K.D.; Mishra, P.K. Coronavirus lockdown helped the environment to bounce back. Sci. Total Environ. 2020, 742, 140573. [Google Scholar] [CrossRef]
- Zambrano-Monserrate, M.A.; Ruano, M.A.; Sanchez-Alcalde, L. Indirect effects of COVID-19 on the environment. Sci. Total Environ. 2020, 728, 138813. [Google Scholar] [CrossRef]
- Chauhan, A.; Singh, R.P. Decline in PM2.5 concentrations over major cities around the world associated with COVID-19. Environ. Res. 2020, 187, 109634. [Google Scholar] [CrossRef]
- Lian, X.; Huang, J.; Huang, R.; Liu, C.; Wang, L.; Zhang, T. Impact of city lockdown on the air quality of COVID-19-hit of Wuhan city. Sci. Total Environ. 2020, 742, 140556. [Google Scholar] [CrossRef]
- Rodríguez-Urrego, D.; Rodríguez-Urrego, L. Air quality during COVID-19: PM2.5 analysis in the 50 most polluted capital cities in the world. Environ. Pollut. 2020, 266, 115042. [Google Scholar] [CrossRef]
- Adams, M.D. Air pollution in Ontario, Canada during the COVID-19 State of Emergency. Sci. Total Environ. 2020, 742, 140516. [Google Scholar] [CrossRef]
- Kerimray, A.; Baimatova, N.; Ibragimova, O.P.; Bukenov, B.; Kenessov, B.; Plotitsyn, P.; Karaca, F. Assessing air quality changes in large cities during COVID-19 lockdowns: The impacts of traffic-free urban conditions in Almaty, Kazakhstan. Sci. Total Environ. 2020, 730, 139179. [Google Scholar] [CrossRef]
- Le, T.; Wang, Y.; Liu, L.; Yang, J.; Yung, Y.L.; Li, G.; Seinfeld, J.H. Unexpected air pollution with marked emission reductions during the COVID-19 outbreak in China. Science 2020, 369, 702–706. [Google Scholar] [CrossRef]
- Dantas, G.; Siciliano, B.; França, B.B.; da Silva, C.M.; Arbilla, G. The impact of COVID-19 partial lockdown on the air quality of the city of Rio de Janeiro, Brazil. Sci. Total Environ. 2020, 729, 139085. [Google Scholar] [CrossRef]
- Nakada, L.Y.K.; Urban, R.C. COVID-19 pandemic: Impacts on the air quality during the partial lockdown in São Paulo state, Brazil. Sci. Total Environ. 2020, 730, 139087. [Google Scholar] [CrossRef]
- Bao, R.; Zhang, A. Does lockdown reduce air pollution? Evidence from 44 cities in northern China. Sci. Total Environ. 2020, 731, 139052. [Google Scholar] [CrossRef]
- He, G.; Pan, Y.; Tanaka, T. The short-term impacts of COVID-19 lockdown on urban air pollution in China. Nat. Sustain. 2020. [Google Scholar] [CrossRef]
- Li, L.; Li, Q.; Huang, L.; Wang, Q.; Zhu, A.; Xu, J.; Liu, Z.; Li, H.; Shi, L.; Li, R.; et al. Air quality changes during the COVID-19 lockdown over the Yangtze River Delta Region: An insight into the impact of human activity pattern changes on air pollution variation. Sci. Total Environ. 2020, 732, 139282. [Google Scholar] [CrossRef]
- Wang, Y.; Yuan, Y.; Wang, Q.; Liu, C.G.; Zhi, Q.; Cao, J. Changes in air quality related to the control of coronavirus in China: Implications for traffic and industrial emissions. Sci. Total Environ. 2020, 731, 139133. [Google Scholar] [CrossRef]
- Sharma, S.; Zhang, M.; Anshika; Gao, J.; Zhang, H.; Kota, S.H. Effect of restricted emissions during COVID-19 on air quality in India. Sci. Total Environ. 2020, 728, 138878. [Google Scholar] [CrossRef]
- Collivignarelli, M.C.; Abbà, A.; Bertanza, G.; Pedrazzani, R.; Ricciardi, P.; Carnevale Miino, M. Lockdown for CoViD-2019 in Milan: What are the effects on air quality? Sci. Total Environ. 2020, 732, 139280. [Google Scholar] [CrossRef]
- Ma, C.-J.; Kang, G.-U. Air quality variation in Wuhan, Daegu, and Tokyo during the explosive outbreak of COVID-19 and its health effects. Int. J. Envrion. Res. Public Health 2020, 17, 4119. [Google Scholar] [CrossRef]
- Sicard, P.; De Marco, A.; Agathokleous, E.; Feng, Z.; Xu, X.; Paoletti, E.; Rodriguez, J.J.D.; Calatayud, V. Amplified ozone pollution in cities during the COVID-19 lockdown. Sci. Total Environ. 2020, 735, 139542. [Google Scholar] [CrossRef]
- Zangari, S.; Hill, D.T.; Charette, A.T.; Mirowsky, J.E. Air quality changes in New York City during the COVID-19 pandemic. Sci. Total Environ. 2020, 742, 140496. [Google Scholar] [CrossRef]
- Sharma, A.P.; Kim, K.-H.; Ahn, J.-W.; Shon, Z.-H.; Sohn, J.-R.; Lee, J.-H.; Ma, C.-J.; Brown, R.J.C. Ambient particulate matter (PM10) concentrations in major urban areas of Korea during 1996–2010. Atmos. Pollut. Res. 2014, 5, 161–169. [Google Scholar] [CrossRef] [Green Version]
- National Air Pollutants Emission Service of Korea. Emission Rate Inquiry. Available online: https://airemiss.nier.go.kr (accessed on 22 July 2020).
- Korea Environment Corporation. Airkorea. Available online: https://www.airkorea.or.kr (accessed on 19 June 2020).
- Seoul Transport Operation and Information Service. Traffic Volume Information. Available online: https://topis.seoul.go.kr (accessed on 19 June 2020).
- Gelaro, R.; McCarty, W.; Suárez, M.J.; Todling, R.; Molod, A.; Takacs, L.; Randles, C.A.; Darmenov, A.; Bosilovich, M.G.; Reichle, R.; et al. The modern-era retrospective analysis for research and applications, version 2 (MERRA-2). J. Clim. 2017, 30, 5419–5454. [Google Scholar] [CrossRef]
- National Aeronautics and Space Administration (NASA). Data Collections. Available online: https://disc.gsfc.nasa.gov/ datasets (accessed on 7 July 2020).
- Copernicus Climate Change Service (C3S). ERA5: Fifth Generation of ECMWF Atmospheric Reanalysis of the Global Climate. Copernicus Climate Change Service Climate Data Store (CDS). Available online: https://cds.climate. copernicus.eu/cdsapp#!/home (accessed on 15 July 2020).
- Nguyen, H.T.; Kim, K.-H.; Ma, C.-J.; Cho, S.-J.; Sohn, J.R. A dramatic shift in CO and CH4 levels at urban locations in Korea after the implementation of the Natural Gas Vehicle Supply (NGVS) program. Environ. Res. 2010, 110, 396–409. [Google Scholar] [CrossRef]
- Kim, K.-H.; Sul, K.-H.; Szulejko, J.E.; Chambers, S.D.; Feng, X.; Lee, M.-H. Progress in the reduction of carbon monoxide levels in major urban areas in Korea. Environ. Pollut. 2015, 207, 420–428. [Google Scholar] [CrossRef]
- Lee, M. An analysis on the concentration characteristics of PM2.5 in Seoul, Korea from 2005 to 2012. Asia-Pac. J. Atmos. Sci. 2014, 50, 585–594. [Google Scholar] [CrossRef]
- Ahmed, E.; Shon, K.-H.; Song, Z.-H.; Song, S.-K. Long-term trend of airborne particulate matter in Seoul, Korea from 2004 to 2013. Atmos. Environ. 2015, 101, 125–133. [Google Scholar] [CrossRef]
- Xu, G.; Jiao, L.; Zhang, B.; Zhao, S.; Yuan, M.; Gu, Y.; Liu, J.; Tang, X. Spatial and temporal variability of the PM2.5/PM10 ratio in Wuhan, Central China. Aerosol Air Qual. Res. 2017, 17, 741–751. [Google Scholar] [CrossRef] [Green Version]
- Korea Ministry of Environment (MoE). Summary Report of the 4th Stage (2013–2017) LTP Project. Available online: https://www.me.go.kr/home/file/readDownloadFile.do?fileId=184686&fileSeq=1 (accessed on 24 July 2020).
- Jeong, U.; Kim, J.; Lee, H.; Lee, Y.G. Assessing the effect of long-range pollutant transportation on air quality in Seoul using the conditional potential source contribution function method. Atmos. Environ. 2020, 150, 33–44. [Google Scholar] [CrossRef]


| Pollutant/Year | Pre-SD * | SD * | Relative Change (%) Pre-SD * vs. SD * | Relative Change (%) for SD * 2015–2019 vs. 2020 |
|---|---|---|---|---|
| PM2.5 (μg m−3) | ||||
| 2020 | 27.6 | 24.7 | −10.4 | −31.2 |
| 2015–2019 | 29.1 | 35.9 | 23.7 | |
| PM10 (μg m−3) | ||||
| 2020 | 40.4 | 44.1 | 9.1 | −29.9 |
| 2015–2019 | 56.0 | 62.9 | 12.3 | |
| NO2 (ppbv) | ||||
| 2020 | 32.0 | 26.7 | −16.4 | −26.9 |
| 2015–2019 | 34.9 | 36.5 | 4.7 | |
| O3 (ppbv) | ||||
| 2020 | 18.0 | 26.4 | 47.0 | 5.7 |
| 2015–2019 | 17.5 | 25.0 | 42.5 | |
| CO (ppbv) | ||||
| 2020 | 588.3 | 489.1 | −16.9 | −16.1 |
| 2015–2019 | 633.4 | 583.3 | −7.9 | |
| SO2 (ppbv) | ||||
| 2020 | 3.3 | 3.2 | −3.3 | −41.5 |
| 2015–2019 | 5.6 | 5.4 | −2.5 |
© 2020 by the authors. Licensee MDPI, Basel, Switzerland. This article is an open access article distributed under the terms and conditions of the Creative Commons Attribution (CC BY) license (http://creativecommons.org/licenses/by/4.0/).
Share and Cite
Han, B.-S.; Park, K.; Kwak, K.-H.; Park, S.-B.; Jin, H.-G.; Moon, S.; Kim, J.-W.; Baik, J.-J. Air Quality Change in Seoul, South Korea under COVID-19 Social Distancing: Focusing on PM2.5. Int. J. Environ. Res. Public Health 2020, 17, 6208. https://doi.org/10.3390/ijerph17176208
Han B-S, Park K, Kwak K-H, Park S-B, Jin H-G, Moon S, Kim J-W, Baik J-J. Air Quality Change in Seoul, South Korea under COVID-19 Social Distancing: Focusing on PM2.5. International Journal of Environmental Research and Public Health. 2020; 17(17):6208. https://doi.org/10.3390/ijerph17176208
Chicago/Turabian StyleHan, Beom-Soon, Kyeongjoo Park, Kyung-Hwan Kwak, Seung-Bu Park, Han-Gyul Jin, Sungju Moon, Jong-Won Kim, and Jong-Jin Baik. 2020. "Air Quality Change in Seoul, South Korea under COVID-19 Social Distancing: Focusing on PM2.5" International Journal of Environmental Research and Public Health 17, no. 17: 6208. https://doi.org/10.3390/ijerph17176208
APA StyleHan, B.-S., Park, K., Kwak, K.-H., Park, S.-B., Jin, H.-G., Moon, S., Kim, J.-W., & Baik, J.-J. (2020). Air Quality Change in Seoul, South Korea under COVID-19 Social Distancing: Focusing on PM2.5. International Journal of Environmental Research and Public Health, 17(17), 6208. https://doi.org/10.3390/ijerph17176208