The Perceived Health Status from Young Adults to Elderly: Results of the MEHM Questionnaire within the CUORE Project Survey 2008–2012

 , , , and
Abstract
:1. Introduction
2. Materials and Methods
2.1. Data Extraction and Pre-Processing
- Q1 (MEHM Item 1, general health status). The question “How is your health in general?” had five possible answer categories: very good; good; fair; bad; and very bad. In order to comply with the requirement of homogeneity of data processing, the order of the 5 answers was inverted to obtain a score of increasing rather than decreasing satisfaction, i.e., very bad perception of health status; bad perception of health status; neither good nor bad; good; very good;
- Q2 (MEHM Item 2, chronic morbidity). The question “Do you have any long-standing illness or health problem?” had two possible answers: yes (long-standing compromised health status) or no (uncompromised health status); with respect to the meaning of “long-standing”, it was explained that it should be understood as a period of not less than 6 months;
- Q3 (MEHM Item 3, activity limitations). The question “For at least the past 6 months, to what extent have you been limited because of a health problem in activities people usually do? Would you say you have been …” had three possible answers: severely limited; limited but not severely; not limited at all. The answers were organized on the basis of an increasing satisfaction score.
- The season, referring to the month in which the questionnaire was administered and codified from 1 January to 12 December;
- The marital status of the participant collected through a face-to-face questionnaire, classified as single, never married; married or cohabiting; separated or divorced; widow/widower;
- The participant’s level of education collected through a face-to-face questionnaire, classified as bachelor’s degree, master’s degree or PhD; high school diploma; lower secondary school licence; primary school licence; level of education lower than primary school.
2.2. Data Processing and Statistical Analysis
3. Results
3.1. Analysis of Age and Gender Groups
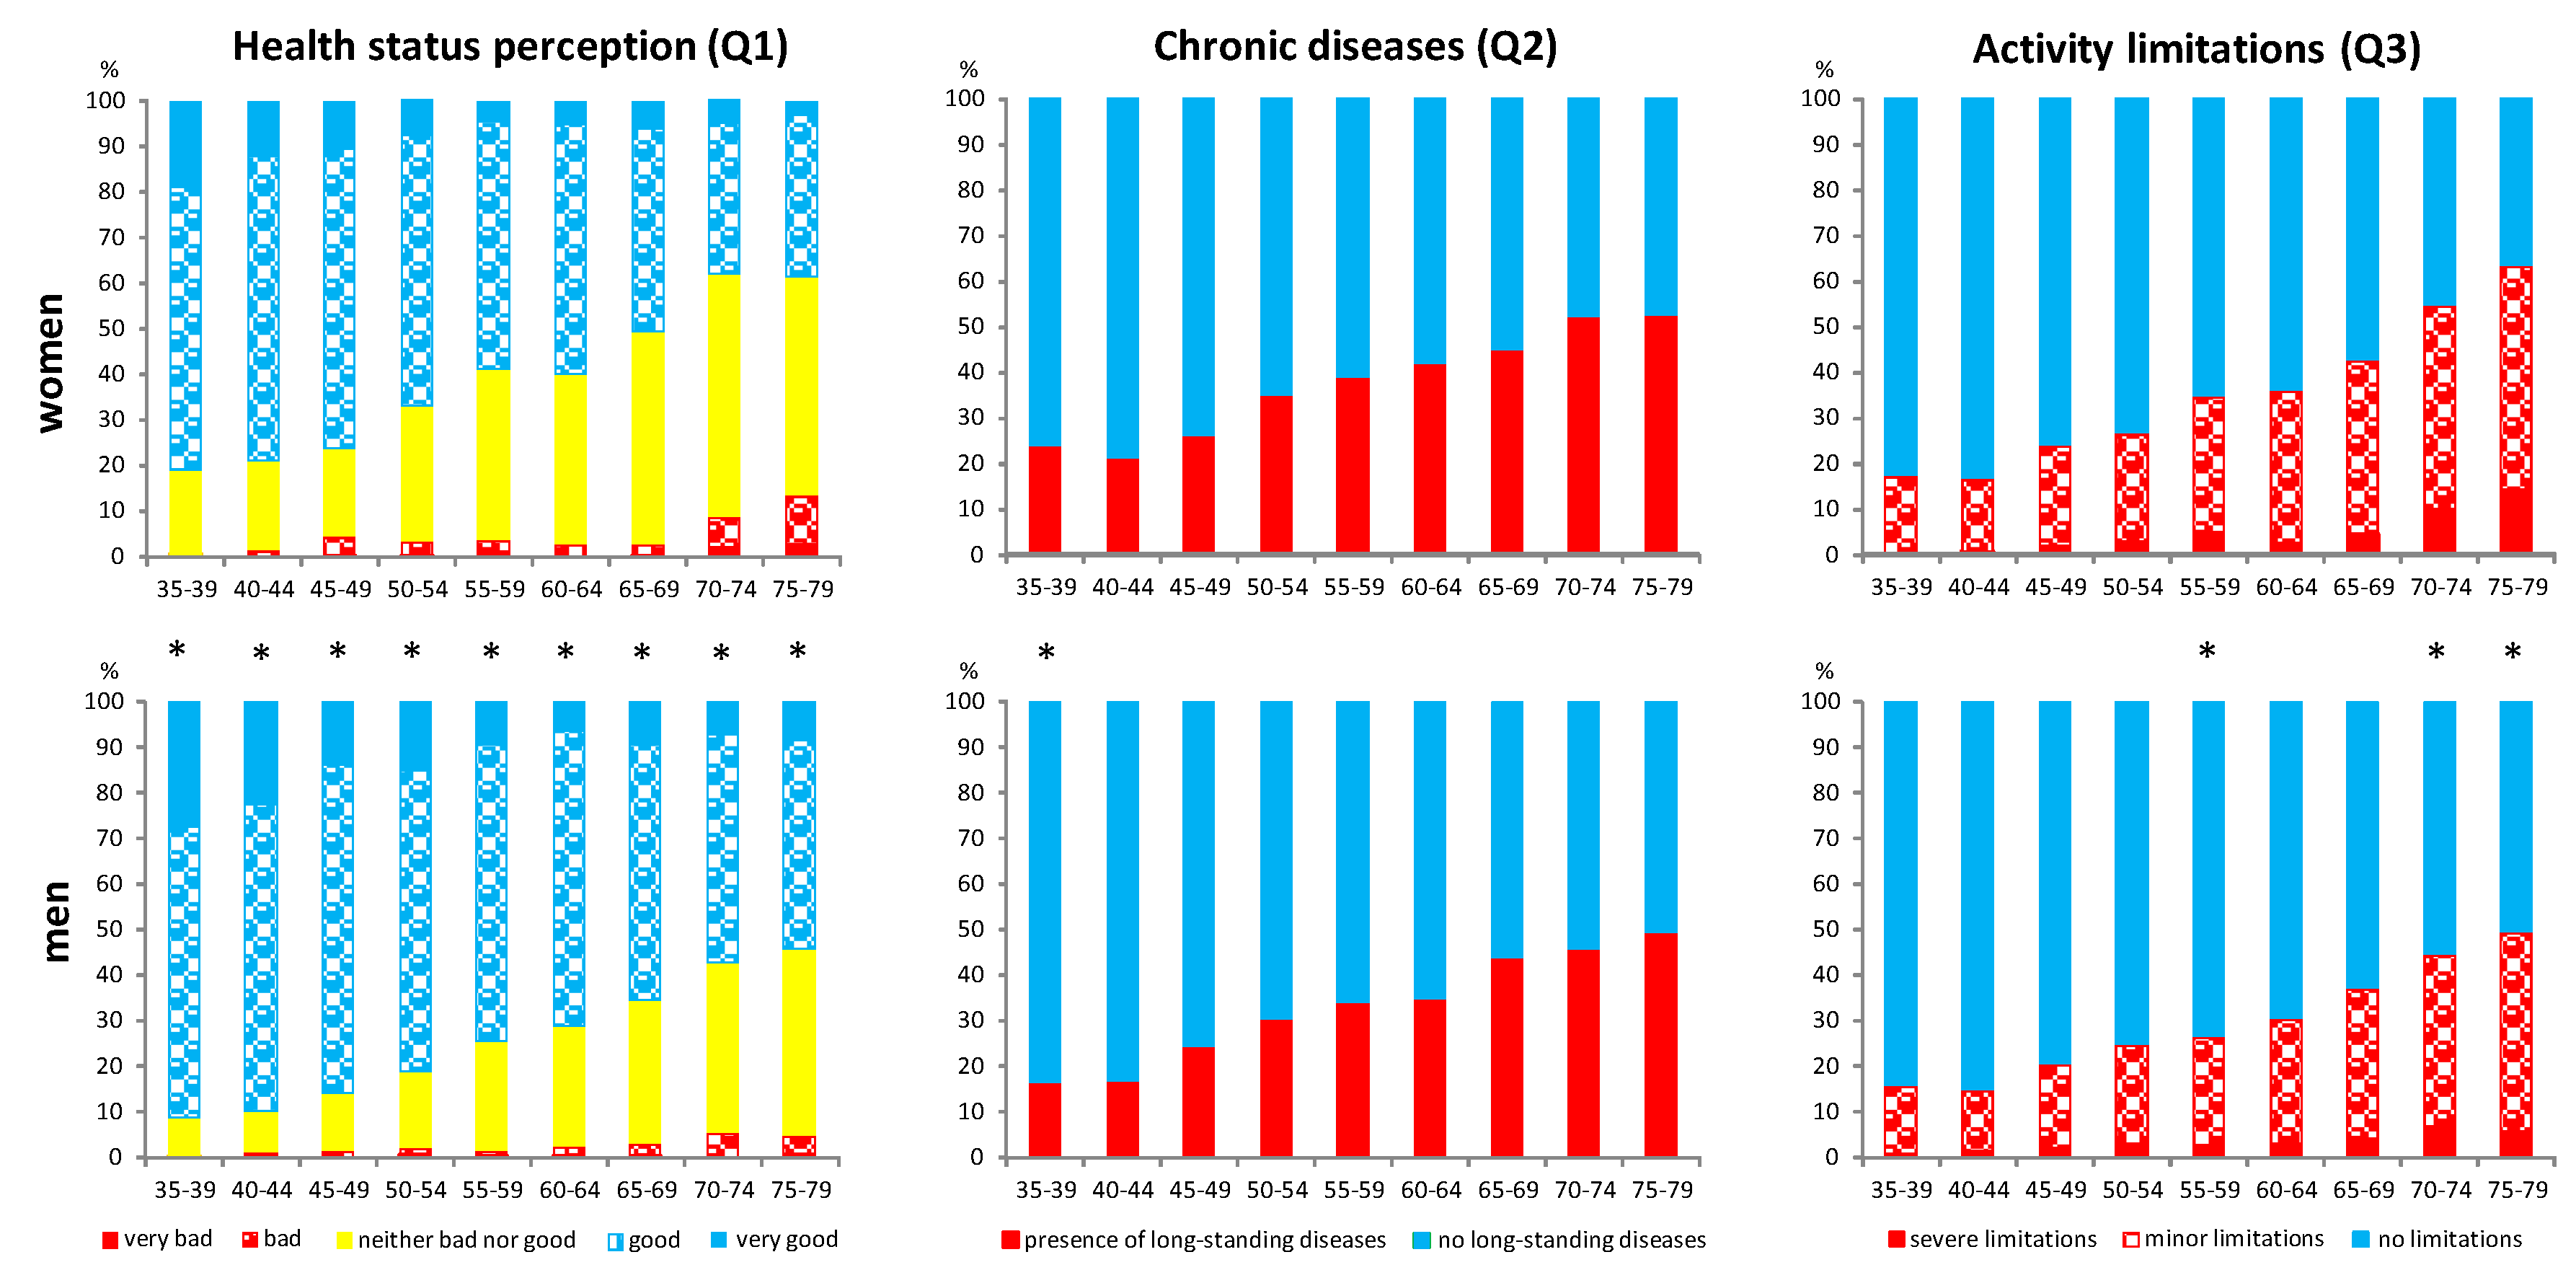
- women showed a worse perception of their health status than men at any age (negative perception of general health status (Q1) ranging from 19 to 62% for women and 9 to 46% for men) and there was a greater slope from younger to older age (43% and 37% for women and 37% for men, respectively); as a result, half of the women interviewed (50%) reported a negative perceived health status at the age of 65–69, i.e., ten years earlier than men (Figure 1);
- a relevant prevalence of chronic morbidity (Q2: 24 and 16% in women and men respectively) and activity limitations (Q3: 17 and 15% in women and men respectively) was found even among young adults (35–39 years old), which is quite remarkable in the general population;
- for both genders, 8 multiple comparisons were required to detect statistically significant differences of all MEHM items by age groups. Specifically, a first significant difference was found between the 35–39 group and the 50–54 group, and a second one between the 50–54 and the 65–69 groups; a third one was finally found between the 65–69 group and the oldest group, but only for general health status and activity limitations (Figure 1);
- differences were almost linearly distributed with respect to age groups in both women and men.
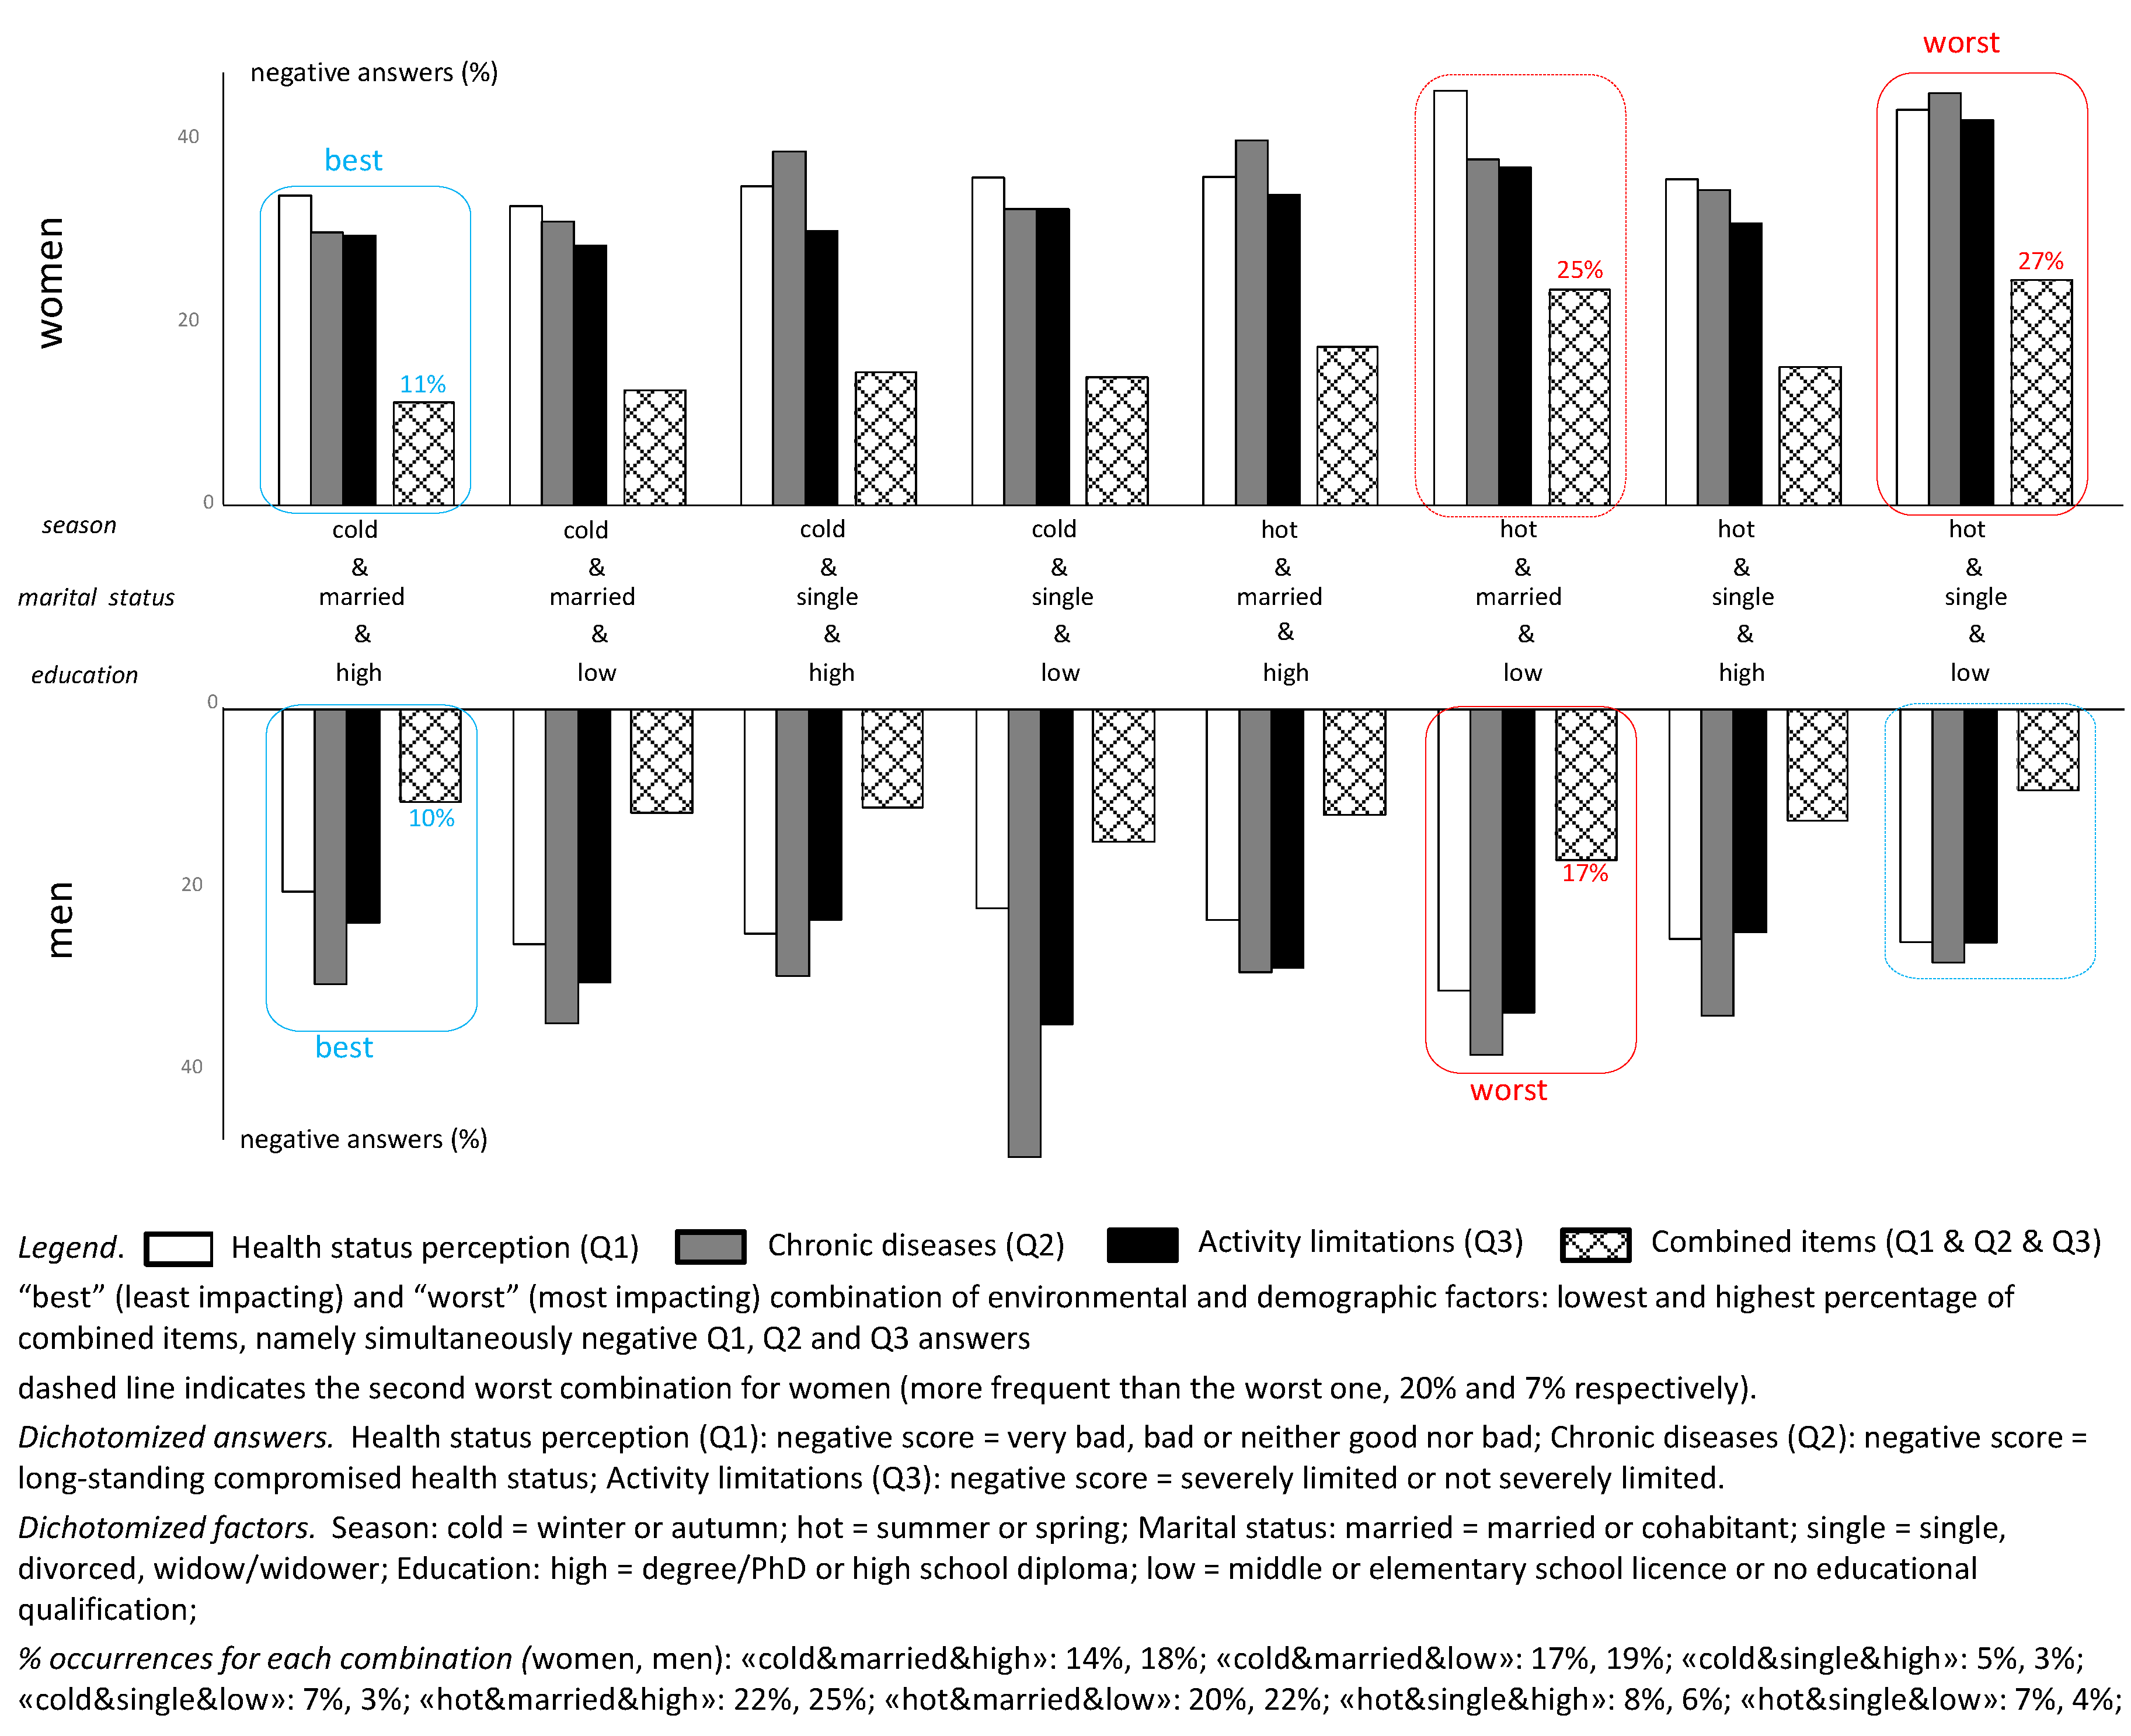
3.2. Global Analysis on Environmental and Demographic Factors
4. Discussion
Strengths and Limitations
- -
- unbalanced number of urban and rural samples;
- -
- easonality; in each region, the data collection took place in the same season, but the latitude of the various regions is different, which can potentially influence the association of MEHM with seasonality; however, the distributions of questionnaires in hot and cold seasons was quite balanced for both women and men (51% vs. 49%), moreover the geographical areas were fairly homogeneously represented for the hot season, and also for the cold season if we consider that in Italy the cold season is quite similar in the central and southern regions;
- -
- different living conditions, experience, expectations in the oldest and youngest groups—including the effect of the age cohort—which may have affected comparisons;
- -
- the subgroups provided by urban/rural, married/single, high/low level of education do not always have a similar distribution in terms of age and gender, as these characteristics could not be known in advance;
- -
- the cross-sectional design of the study does not allow to assess the causality of the associations between factors;
- -
- the lack of information on the accessibility of health care facilities may have influenced the perceived health status, even though this aspect could be partly included in the level of education;
- -
- potential bias may have derived from the design of the study, which required participants to “come to the examination room”. Non-respondents may have had various reasons for refusing, among which mobility limitations due to health condition, feeling of a healthy or “already under control” status, opposite feeling of being “too sick or too fearful to attend a screening”, or simply lack of availability for the screening for practical/working reasons; furthermore the perceived relevance or sensitivity of the topic may affect participation.
5. Conclusions
Author Contributions
Funding
Acknowledgments
Conflicts of Interest
Appendix A

| Women | Men | |||||||
|---|---|---|---|---|---|---|---|---|
| Age Group (Years) | N | Median | 25° Perc | 75° Perc | N | Median | 25° Perc | 75° Perc |
| 35–39 | 242 | 37 | 36 | 39 | 267 | 37 | 36 | 38 |
| 40–44 | 320 | 42 | 41 | 43 | 279 | 42 | 41 | 43 |
| 45–49 | 288 | 47 | 46 | 48 | 269 | 47 | 46 | 48 |
| 50–54 | 293 | 52 | 51 | 53 | 273 | 52 | 51 | 54 |
| 55–59 | 281 | 57 | 56 | 58 | 272 | 57 | 56 | 58 |
| 60–64 | 284 | 62 | 61 | 63 | 309 | 62 | 61 | 63 |
| 65–69 | 265 | 67 | 66 | 68 | 285 | 67 | 66 | 68 |
| 70–74 | 233 | 72 | 71 | 73 | 235 | 72 | 71 | 73 |
| 75–79 | 181 | 77 | 76 | 78 | 222 | 77 | 76 | 78 |
| Tot (35–79) | 2387 | 55 | 45 | 66 | 2411 | 57 | 46 | 67 |
| Geographical Area of ITALY | Factor | WOMEN | MEN | Factor | WOMEN | MEN |
|---|---|---|---|---|---|---|
| URBAN | RURAL | |||||
| northern | 866 | 870 | 218 | 218 | ||
| central | 310 | 327 | 118 | 116 | ||
| southern | 875 | 880 | 0 | 0 | ||
| total | 2051 (86%) | 2077 (86%) | 336 (14%) | 334 (14%) | ||
| HOT | COLD | |||||
| northern | 423 | 430 | 661 | 658 | ||
| central | 428 | 443 | 0 | 0 | ||
| southern | 373 | 355 | 502 | 525 | ||
| total | 1224 (51%) | 1228 (51%) | 1163 (49%) | 1183 (49%) | ||
| HIGH ED | LOW ED | |||||
| northern | 528 | 568 | 556 | 520 | ||
| central | 226 | 220 | 202 | 223 | ||
| southern | 420 | 463 | 455 | 417 | ||
| total | 1174 (49%) | 1251 (52%) | 1213 (51%) | 1160 (48%) | ||
| MARRIED | SINGLE | |||||
| northern | 751 | 879 | 333 | 209 | ||
| central | 304 | 351 | 124 | 92 | ||
| southern | 682 | 779 | 193 | 101 | ||
| total | 1737 (73%) | 2009 (83%) | 650 (27%) | 402 (17%) |


References
- Pan, B.; Li, H.; Wang, Y.; Sun, M.; Cai, H.; Wang, J. Physical activity and the risk of frailty among community-dwelling healthy older adults. Medicine 2019, 98, e16955. [Google Scholar] [CrossRef]
- Partridge, L.; Deelen, J.; Slagboom, P.E. Facing up to the global challenges of ageing. Nature 2018, 561, 45–56. [Google Scholar] [CrossRef] [PubMed]
- Cox, B.; Van Oyen, H.; Cambois, E.; Jagger, C.; Le Roy, S.; Robine, J.-M.; Romieu, I. The reliability of the Minimum European Health Module. Int. J. Public Health 2009, 54, 55–60. [Google Scholar] [CrossRef] [PubMed]
- Liotta, G.; Canhão, H.; Cenko, F.; Cutini, R.; Vellone, E.; Illario, M.; Kardas, P.; Poscia, A.; Sousa, R.D.; Palombi, L.; et al. Active Ageing in Europe: Adding Healthy Life to Years. Front. Med. 2018, 5. [Google Scholar] [CrossRef]
- Van Oyen, H.; Nusselder, W.; Jagger, C.; Kolip, P.; Cambois, E.; Robine, J.-M. Gender differences in healthy life years within the EU: An exploration of the “health–survival” paradox. Int. J. Public Health 2012, 58, 143–155. [Google Scholar] [CrossRef] [PubMed] [Green Version]
- Robine, J.-M.; Cambois, E.; Nusselder, W.J.; Jeune, B.; Van Oyen, H.; Jagger, C. The joint action on healthy life years (JA: EHLEIS). Arch. Public Health 2013, 71, 2. [Google Scholar] [CrossRef] [Green Version]
- EHLEIS Technical Report 2015_4.1. Available online: http://www.eurohex.eu/pdf/CountryReports_Issue8/All_countries.pdf (accessed on 24 August 2020).
- Bruin, A.; Picave, H.S.; Nossikov, A. Health Interview Surveys: Towards International Harmonization of Methods and Instruments; WHO Regional Office for Europe: Copenhagen, Denmark, 1996. [Google Scholar]
- Idler, E.; Russell, L.B.; Davis, D. Survival, Functional Limitations, and Self-rated Health in the NHANES I Epidemiologic Follow-up Study, 1992. Am. J. Epidemiol. 2000, 152, 874–883. [Google Scholar] [CrossRef] [Green Version]
- DeSalvo, K.B.; Bloser, N.; Reynolds, K.; He, J.; Muntner, P. Mortality Prediction with a Single General Self-Rated Health Question. J. Gen. Intern. Med. 2006, 21, 267–275. [Google Scholar] [CrossRef] [Green Version]
- Bond, J.; Dickinson, H.O.; Matthews, F.E.; Jagger, C.; Brayne, C. Self-rated health status as a predictor of death, functional and cognitive impairment: A longitudinal cohort study. Eur. J. Ageing 2006, 3, 193–206. [Google Scholar] [CrossRef] [Green Version]
- Robine, J.M.; Jagger, C.; Romieu, I. Selection of a Coherent Set of Health Indicators for the European Union, Phase II; Euro-Reves: Montpellier, France, 2002. [Google Scholar]
- Burata, V.; Frova, L.; Gargiulo, L.; Gianicolo, E.; Prati, S.; Quattrociocchi, L. Development of a Common Instrument for Chronic Physical Conditions. In Eurohis: Developing Common Instruments for Health Surveys; Nossikov, A., Gudex, C., Eds.; IOS Press: Amsterdam, The Netherlands, 2003; pp. 21–34. [Google Scholar]
- Verbrugge, L.M. A global disability indicator. J. Aging Stud. 1997, 11, 337–362. [Google Scholar] [CrossRef]
- Cambois, E.; Mormiche, J.-M.R. Une forte baisse de l’incapacité en France dans les années 1990? Discussion autour des questions de l’enquête Santé. Population 2007, 62, 363. [Google Scholar] [CrossRef]
- Oortwijn, W.; Mathijssen, J.; Lankhuizen, M.; Cave, J. Evaluating the uptake of the Healthy Life Years Indicator: Final report. Rand Eur. 2007, 1–74. [Google Scholar] [CrossRef] [Green Version]
- Van Oyen, H.; Bogaert, P.; Yokota, R.T.C.; Berger, N. Measuring disability: A systematic review of the validity and reliability of the Global Activity Limitations Indicator (GALI). Arch. Public Health 2018, 76, 25. [Google Scholar] [CrossRef] [PubMed] [Green Version]
- Van Der Heyden, J.; Van Oyen, H.; Berger, N.; De Bacquer, D.; Van Herck, K. Activity limitations predict health care expenditures in the general population in Belgium. BMC Public Health 2015, 15, 267. [Google Scholar] [CrossRef] [PubMed] [Green Version]
- Giampaoli, S.; Vanuzzo, D. Gruppo di Ricerca del Progetto Osservatorio Epidemiologico Cardiovascolare/Health Examination Survey. Terzo Atlante Italiano delle Malattie Cardiovascolari. La salute cardiovascolare degli italiani. G Ital. Cardiol. 2014, 15, 7S–31S. [Google Scholar]
- Giampaoli, S.; Palmieri, L.; Donfrancesco, C.; Noce, C.L.; Pilotto, L.; Vanuzzo, D. Cardiovascular health in Italy. Ten-year surveillance of cardiovascular diseases and risk factors: Osservatorio Epidemiologico Cardiovascolare/Health Examination Survey 1998–2012. Eur. J. Prev. Cardiol. 2015, 22, 9–37. [Google Scholar] [CrossRef]
- Tolonen, H. EHES Manual: Part B. Fieldwork Procedures. Directions 2016_14. 2016. Available online: http://www.julkari.fi/handle/10024/131503 (accessed on 24 August 2020).
- Indagine-Europea-Sulla-Salute-Giallo-Mod.-ISTAT_EHIS_A.15. Available online: http://www.istat.it/en/archive/173452 (accessed on 24 August 2020).
- Katz, S.; Ford, A.B.; Moskowitz, R.W.; Jackson, B.A.; Jaffe, M.W. Studies of illness in the aged: The index of ADL: A standardized measure of biological and psychosocial function. JAMA 1963, 185, 914–919. [Google Scholar] [CrossRef]
- Mahoney, F.I.; Barthel, D.W. Functional evaluation: The barthel index. Md. State Med. J. 1965, 14, 61. [Google Scholar]
- Lawton, M.P.; Brody, A.E.M. Assessment of Older People: Self-Maintaining and Instrumental Activities of Daily Living. Gerontologist 1969, 9, 179–186. [Google Scholar] [CrossRef]
- Gimigliano, F.; Riccio, I.; D’Avanzo, C.; Di Pietro, G.; Liguori, E.; Di Mizio, R.; Iolascon, G. Validazione di un questionario breve derivato dalla GARS per misurare la disabilità nelle ADL nel soggetto anziano. Eur. Med. Phys. 2008, 44 (Suppl. 1), 1–2. [Google Scholar]
- European Commission Public Health. Available online: https://ec.europa.eu/health/indicators_data/data_en (accessed on 24 August 2020).
- Giampaoli, S.; Vanuzzo, D.; Palmieri, L.; Lo Noce, C.; Dima, F.; De Sanctis Caiola, P.; Donfrancesco, C.; Ciccarelli, P.; Toccaceli, V. Progetto, CUORE. Epidemiologia e Prevenzione delle Malattie Cardio-Cerebrovascolari. Protocollo e Manuale delle Operazioni dell’Osservatorio Epidemiologico Cardiovascolare/Health Examination Survey 2008–2011. Rapp. ISTISAN 2010, 10/33, 80. Available online: https://www.iss.it/documents/20126/45616/10trentatreWEB.pdf/98ec4288-7dc3-9f47-7872-a0ffcdaf0a47?t=1581095139025 (accessed on 24 August 2020).
- Mindell, J.; Giampaoli, S.; Goesswald, A.; Kamtsiuris, P.; Mann, C.; Mannisto, S.; Morgan, K.; Shelton, N.; Verschuren, W.M.M.; Tolonen, H.; et al. Sample selection, recruitment and participation rates in health examination surveys in Europe--experience from seven national surveys. BMC Med. Res. Methodol. 2015, 15, 78. [Google Scholar] [CrossRef] [PubMed] [Green Version]
- Bixby, H.; Bentham, J.; Zhou, B. Rising rural body-mass index is the main driver of the global obesity epidemic in adults. Nature 2019, 569, 260–264. [Google Scholar]
- United Nations Department of Economic and Social Affairs, Population Division. World Urbanization Prospects: The 2014 Revision. Available online: https://esa.un.org/unpd/wup/publications/fles/wup2014-report.pdf (accessed on 24 August 2020).
- Cronbach, L.J. Coefficient alpha and the internal structure of tests. Psychometrika 1951, 16, 297–334. [Google Scholar] [CrossRef] [Green Version]
- Egidi, V.; Spizzichino, D. Perceived health and mortality: A multidimensional analysis of ECHP Italian data. Genus 2006, 62, 135–153. [Google Scholar]
- Marmot, M.; Allen, J.; Bell, R.; Bloomer, E.; Goldblatt, P. On behalf of the Consortium for the European Review of Social Determinants of Health and the Health Divide. WHO European review of social determinants of health and the health divide. Lancet 2012, 380, 1011–1029. [Google Scholar] [CrossRef]


| Intercept | Age 40–44 | Age 45–49 | Age 50–54 | Age 55–59 | Age 60–64 | Age 65–69 | Age 70–74 | Age 75–79 | Q2 | Q3 | Education | Marital Status | Season | Context | |||
|---|---|---|---|---|---|---|---|---|---|---|---|---|---|---|---|---|---|
| General health status (Q1) a | W | OR | 0.14 *** | 1.12 | 1.21 | 2.03 *** | 2.52 *** | 2.24 *** | 3.06 *** | 4.46 *** | 4.42 *** | 2.29 *** | 1.14 | 1.15 | 1.13 | ||
| W | 95% CI | 0.09; 0.22 | 0.74; 1.72 | 0.79; 1.87 | 1.35; 3.08 | 1.68; 3.81 | 1.49; 3.39 | 2.03; 4.65 | 2.91; 6.93 | 2.81; 7.06 | 1.89; 2.77 | 0.92; 1.39 | 0.96; 1.39 | 0.87; 1.47 | |||
| M | OR | 0.07 *** | 1.11 | 1.68 | 2.23 ** | 3.27 *** | 3.73 *** | 4.51 *** | 6.70 *** | 6.84 *** | 1.76 *** | 1.20 | 1.00 | 1.16 | |||
| M | 95% CI | 0.04; 0.11 | 0.62; 2.00 | 0.98; 2.93 | 1.33; 3.82 | 1.99; 5.52 | 2.31; 6.22 | 2.78; 7.55 | 4.11; 11.28 | 4.17; 11.59 | 1.43; 2.17 | 0.92; 1.57 | 0.82; 1.22 | 0.87; 1.56 | |||
| Chronic morbidity (Q2) a | W | OR | 0.22 *** | 0.87 | 1.12 | 1.72 ** | 1.93 *** | 2.16 *** | 2.39 *** | 2.91 *** | 2.85 *** | 1.25 * | 1.13 | 1.37 * | 1.10 | ||
| W | 95% CI | 0.15; 0.32 | 0.58; 1.30 | 0.75; 1.67 | 1.18; 2.53 | 1.32; 2.85 | 1.48; 3.19 | 1.62; 3.55 | 1.94; 4.39 | 1.85; 4.42 | 1.03; 1.51 | 0.92; 1.37 | 1.15; 1.64 | 0.86; 1.42 | |||
| M | OR | 0.14 *** | 1.06 | 1.69 * | 2.36 *** | 2.85 *** | 2.89 *** | 4.39 *** | 4.76 *** | 5.36 *** | 0.93 | 1.36 * | 1.16 | 1.23 | |||
| M | 95% CI | 0.09; 0.21 | 0.67; 1.67 | 1.10; 2.60 | 1.56; 3.59 | 1.90; 4.34 | 1.94; 4.35 | 2.94; 6.67 | 3.13; 7.31 | 3.50; 8.32 | 0.77; 1.12 | 1.07; 1.73 | 0.97; 1.38 | 0.95; 1.61 | |||
| Activity limitations (Q3) a | W | OR | 0.11 *** | 0.97 | 1.48 | 1.74 * | 2.35 *** | 2.46 *** | 3.14 *** | 4.40 *** | 6.43 *** | 1.55 *** | 1.24 * | 1.55 *** | 1.21 | ||
| W | 95% CI | 0.07; 0.17 | 0.62; 1.53 | 0.96; 2.30 | 1.14; 2.68 | 1.55; 3.62 | 1.62; 3.79 | 2.06; 4.85 | 2.85; 6.89 | 4.04; 10.39 | 1.27; 1.88 | 1.01; 1.52 | 1.29; 1.87 | 0.92; 1.58 | |||
| M | OR | 0.11 *** | 0.93 | 1.35 | 1.79 ** | 1.89 ** | 2.19 *** | 2.96 *** | 4.08 *** | 4.38 *** | 1.41 *** | 1.06 | 1.32 ** | 1.20 | |||
| M | 95% CI | 0.07; 0.18 | 0.58; 1.50 | 0.86; 2.14 | 1.17; 2.79 | 1.23; 2.93 | 1.45; 3.36 | 1.95; 4.55 | 2.67; 6.34 | 2.84; 6.86 | 1.16; 1.71 | 0.82; 1.37 | 1.09; 1.60 | 0.91; 1.58 | |||
| General health status (Q1) b | W | OR | 0.12 *** | 2.69 *** | 5.17 *** | 2.72 *** | 1.13 | 0.94 | 1.07 | ||||||||
| W | 95% CI | 0.08; 0.17 | 2.17; 3.33 | 4.15; 6.44 | 2.22; 3.33 | 0.90; 1.41 | 0.77; 1.15 | 0.80; 1.44 | |||||||||
| M | OR | 0.08 *** | 3.42 *** | 4.24 *** | 2.32 *** | 1.01 | 0.89 | 1.01 | |||||||||
| M | 95% CI | 0.05; 0.11 | 2.70; 4.32 | 3.36; 5.37 | 1.87; 2.90 | 0.75; 1.34 | 0.72; 1.11 | 0.74; 1.39 | |||||||||
| General health status (Q1) c | W | OR | 0.09 *** | 1.19 | 1.06 | 1.71 * | 1.94 ** | 1.60 * | 2.08 ** | 2.75 *** | 2.31 ** | 2.58 *** | 4.77 *** | 2.26 *** | 1.05 | 0.93 | 1.07 |
| W | 95% CI | 0.05; 0.14 | 0.75; 1.90 | 0.66; 1.71 | 1.09; 2.71 | 1.24; 3.07 | 1.02; 2.52 | 1.31; 3.32 | 1.71; 4.48 | 1.39; 3.88 | 2.07; 3.21 | 3.82; 5.98 | 1.82; 2.80 | 0.83; 1.31 | 0.76; 1.14 | 0.80; 1.44 | |
| M | OR | 0.04 *** | 1.14 | 1.49 | 1.74 | 2.54 *** | 2.86 *** | 2.88 *** | 4.07 *** | 3.94 *** | 3.07 *** | 3.99 *** | 1.44 *** | 1.12 | 0.88 | 1.03 | |
| M | 95% CI | 0.02; 0.07 | 0.61; 2.13 | 0.83; 2.70 | 1.00; 3.09 | 1.49; 4.47 | 1.70; 4.95 | 1.71; 5.00 | 2.38; 7.13 | 2.30; 6.94 | 2.42; 3.89 | 3.15; 5.06 | 1.84; 2.32 | 0.83; 1.51 | 0.70; 1.10 | 0.75; 1.46 |
© 2020 by the authors. Licensee MDPI, Basel, Switzerland. This article is an open access article distributed under the terms and conditions of the Creative Commons Attribution (CC BY) license (http://creativecommons.org/licenses/by/4.0/).
Share and Cite
Giacomozzi, C.; Palmieri, L.; Gargiulo, L.; Lo Noce, C.; Iannucci, L.; Di Lonardo, A.; Vannucchi, S.; Onder, G.; Colivicchi, F.; Giampaoli, S.; et al. The Perceived Health Status from Young Adults to Elderly: Results of the MEHM Questionnaire within the CUORE Project Survey 2008–2012. Int. J. Environ. Res. Public Health 2020, 17, 6160. https://doi.org/10.3390/ijerph17176160
Giacomozzi C, Palmieri L, Gargiulo L, Lo Noce C, Iannucci L, Di Lonardo A, Vannucchi S, Onder G, Colivicchi F, Giampaoli S, et al. The Perceived Health Status from Young Adults to Elderly: Results of the MEHM Questionnaire within the CUORE Project Survey 2008–2012. International Journal of Environmental Research and Public Health. 2020; 17(17):6160. https://doi.org/10.3390/ijerph17176160
Chicago/Turabian StyleGiacomozzi, Claudia, Luigi Palmieri, Lidia Gargiulo, Cinzia Lo Noce, Laura Iannucci, Anna Di Lonardo, Serena Vannucchi, Graziano Onder, Furio Colivicchi, Simona Giampaoli, and et al. 2020. "The Perceived Health Status from Young Adults to Elderly: Results of the MEHM Questionnaire within the CUORE Project Survey 2008–2012" International Journal of Environmental Research and Public Health 17, no. 17: 6160. https://doi.org/10.3390/ijerph17176160