Examining Health-Related Effects of Refurbishment to Parks in a Lower Socioeconomic Area: The ShadePlus Natural Experiment

 , , , ,
Abstract
:1. Introduction
2. Methods
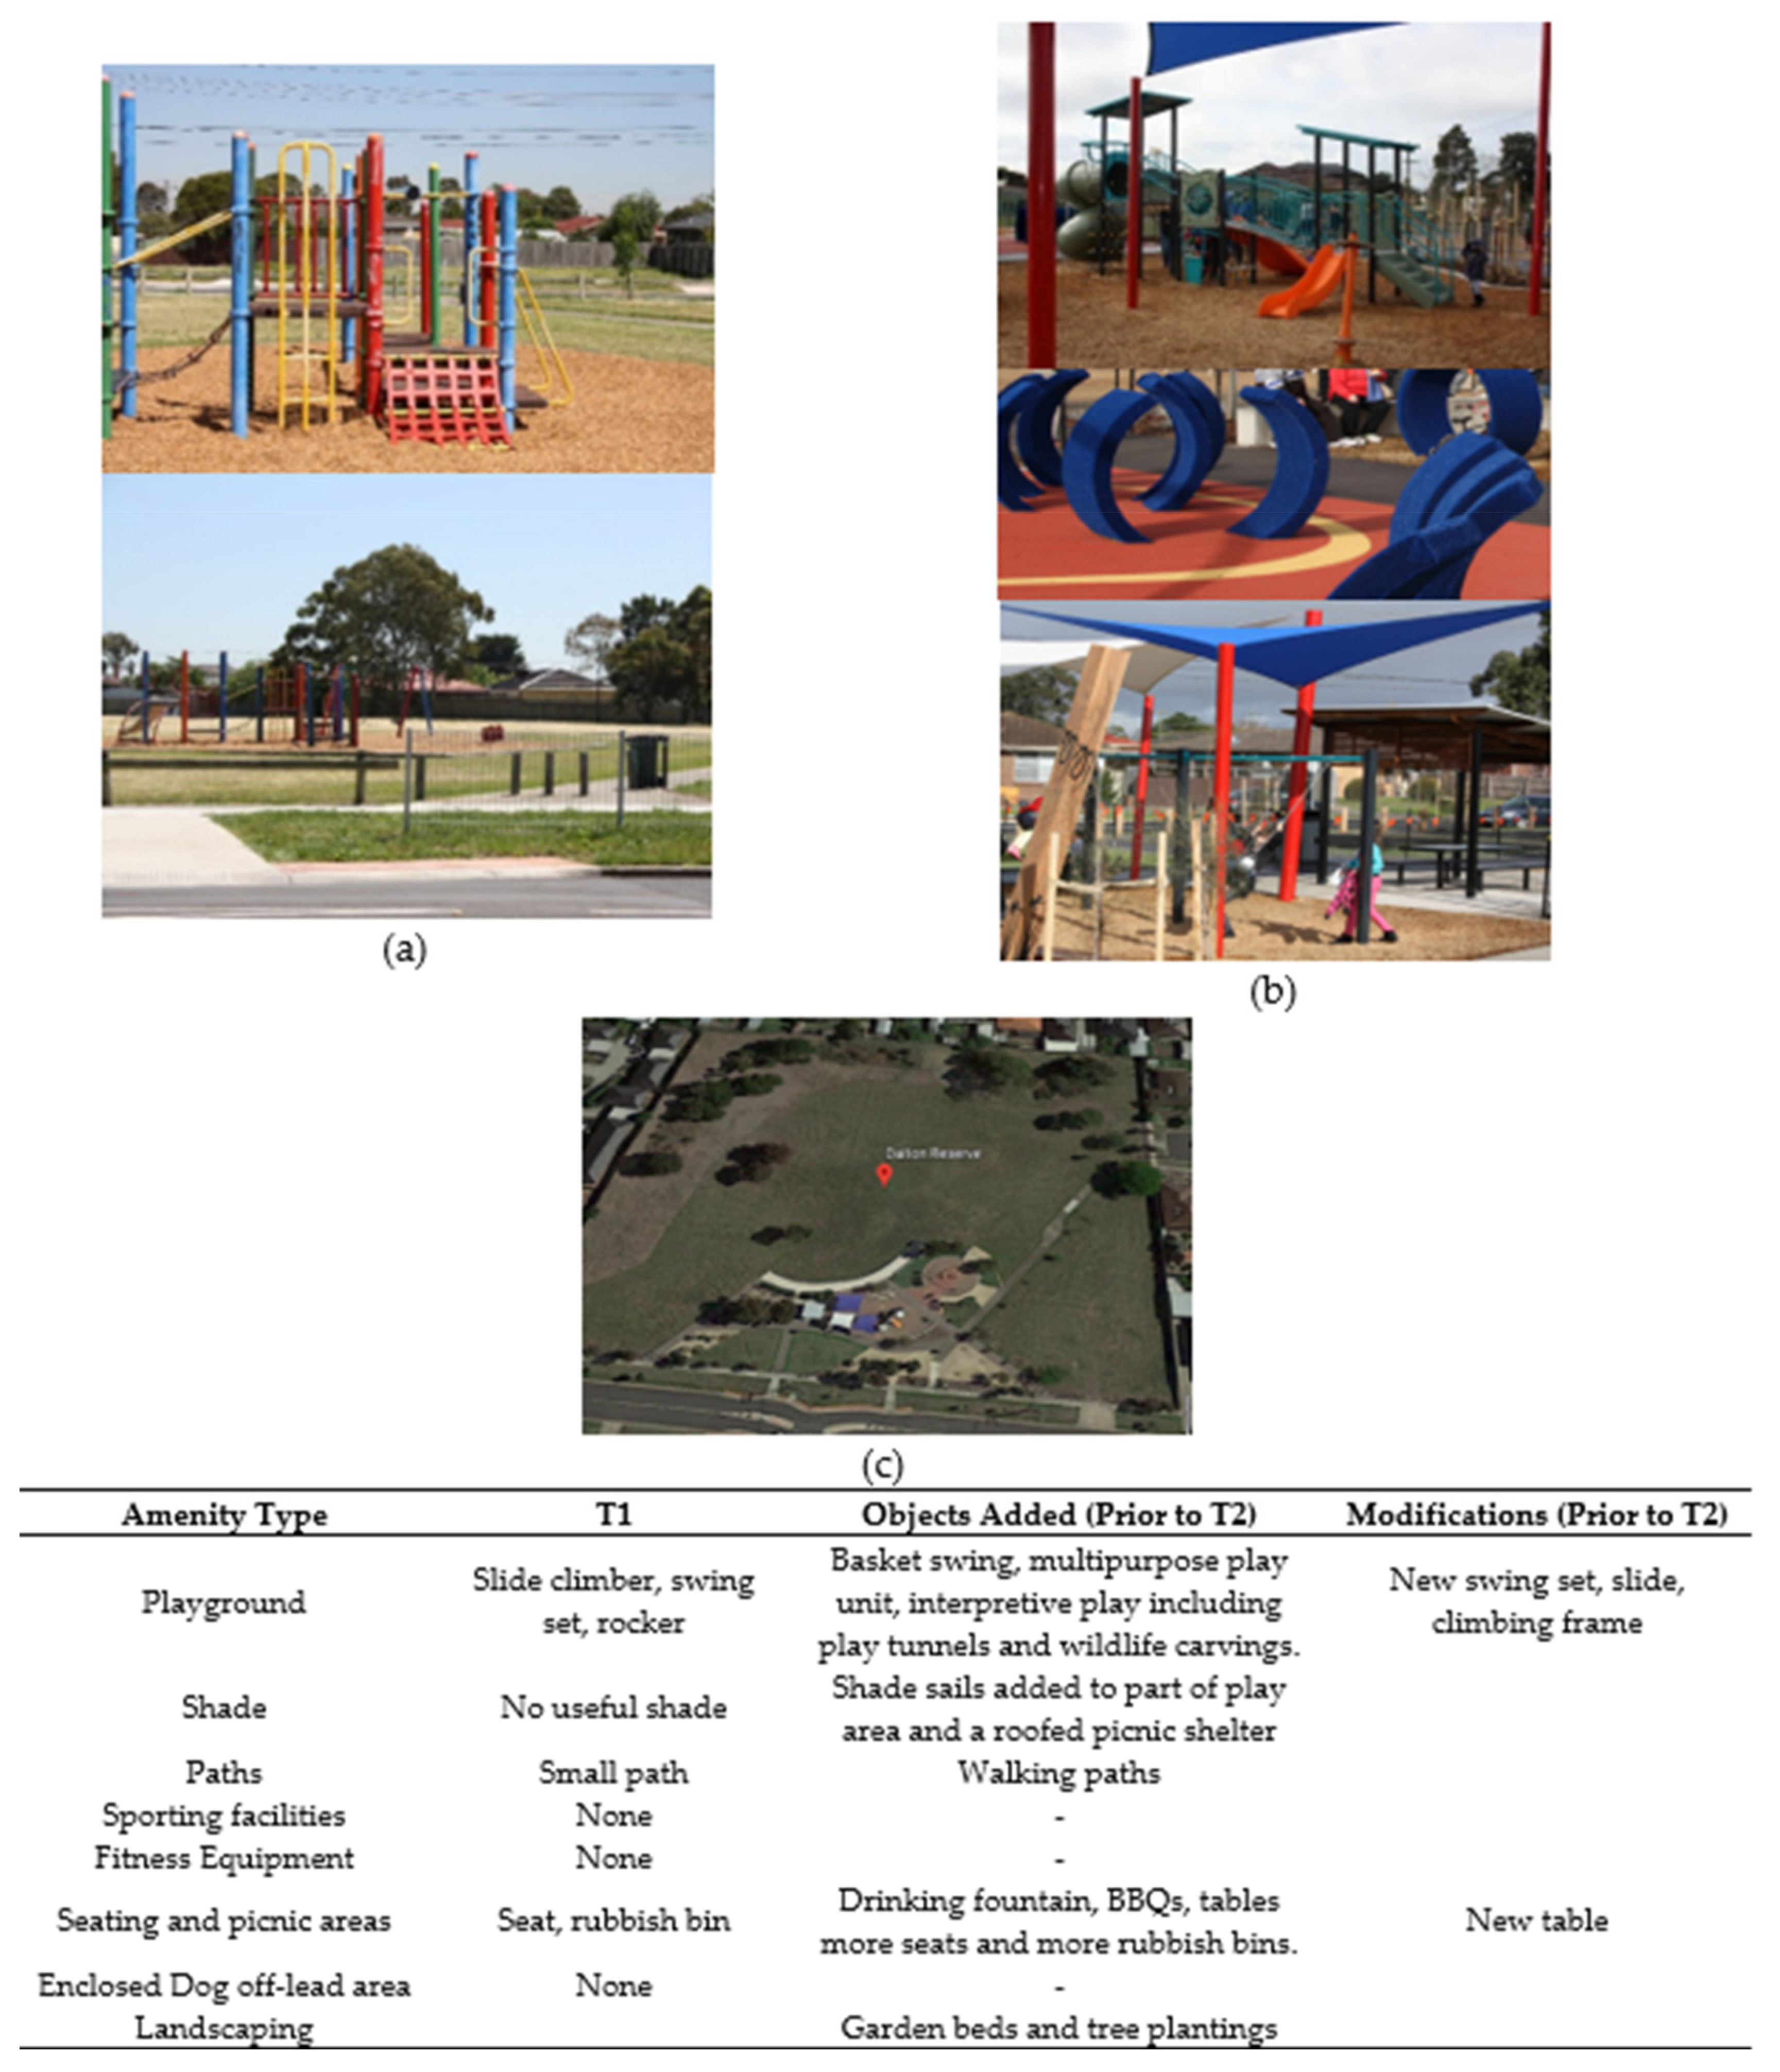
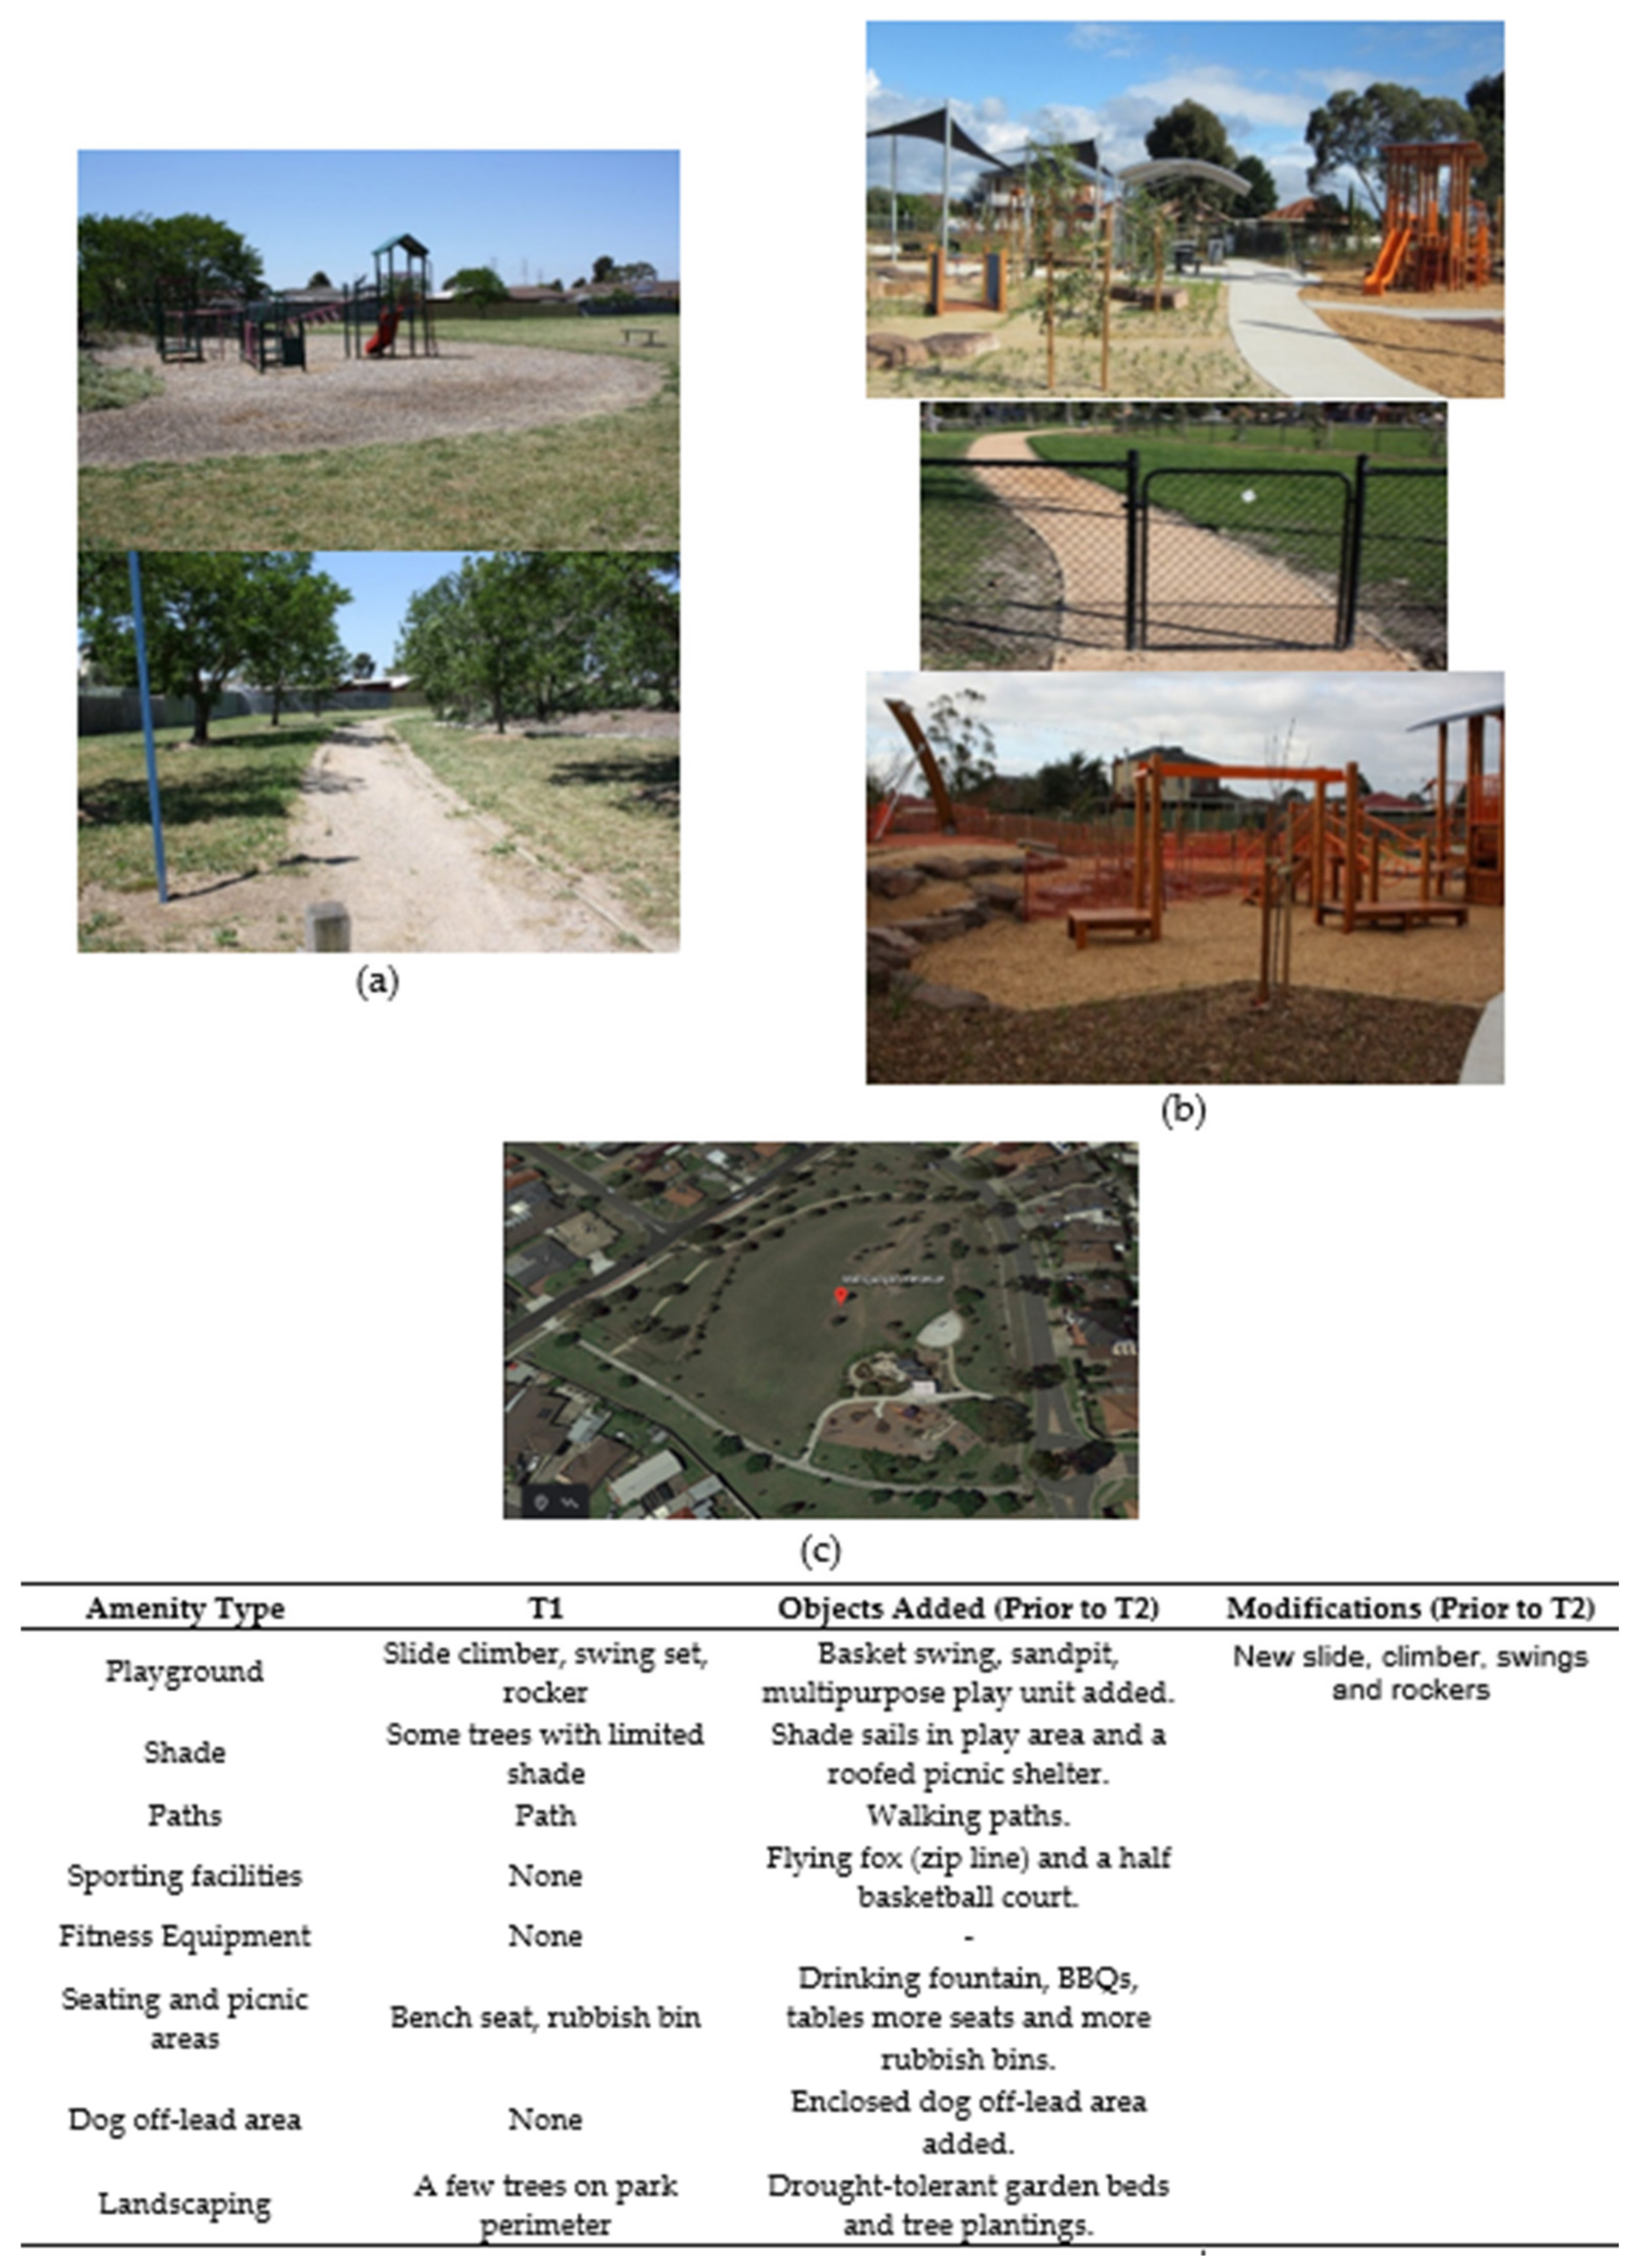
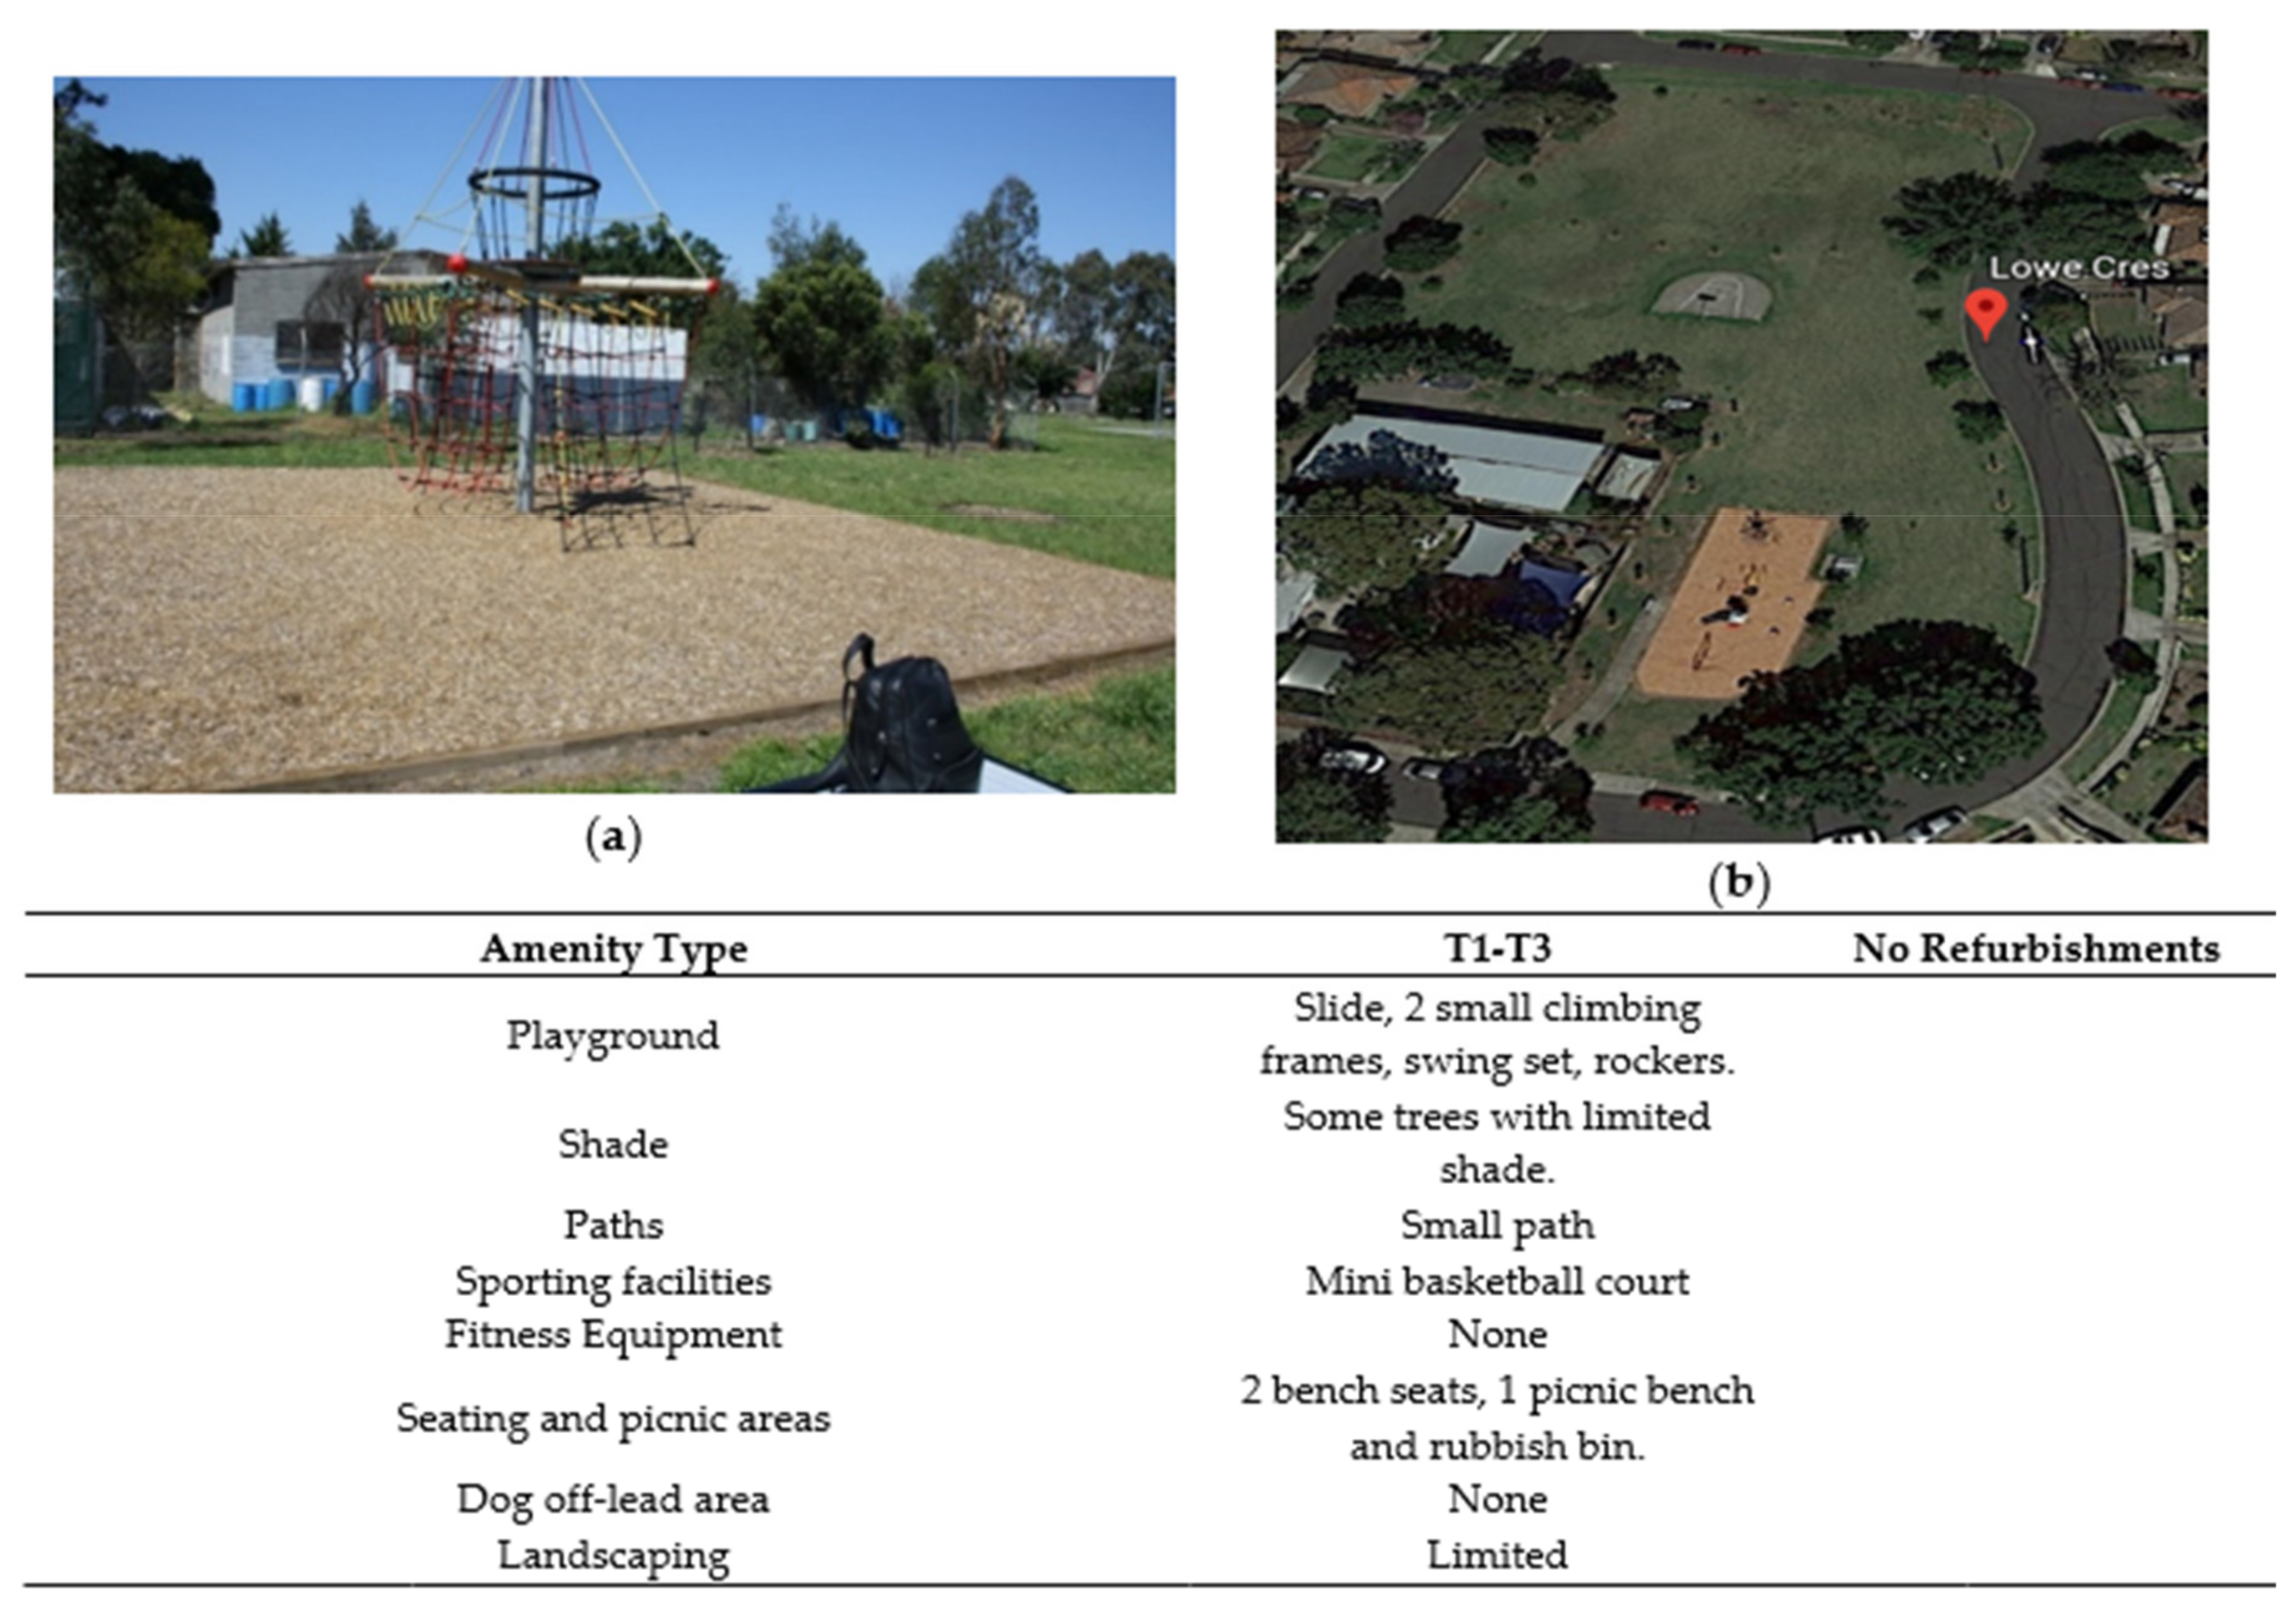
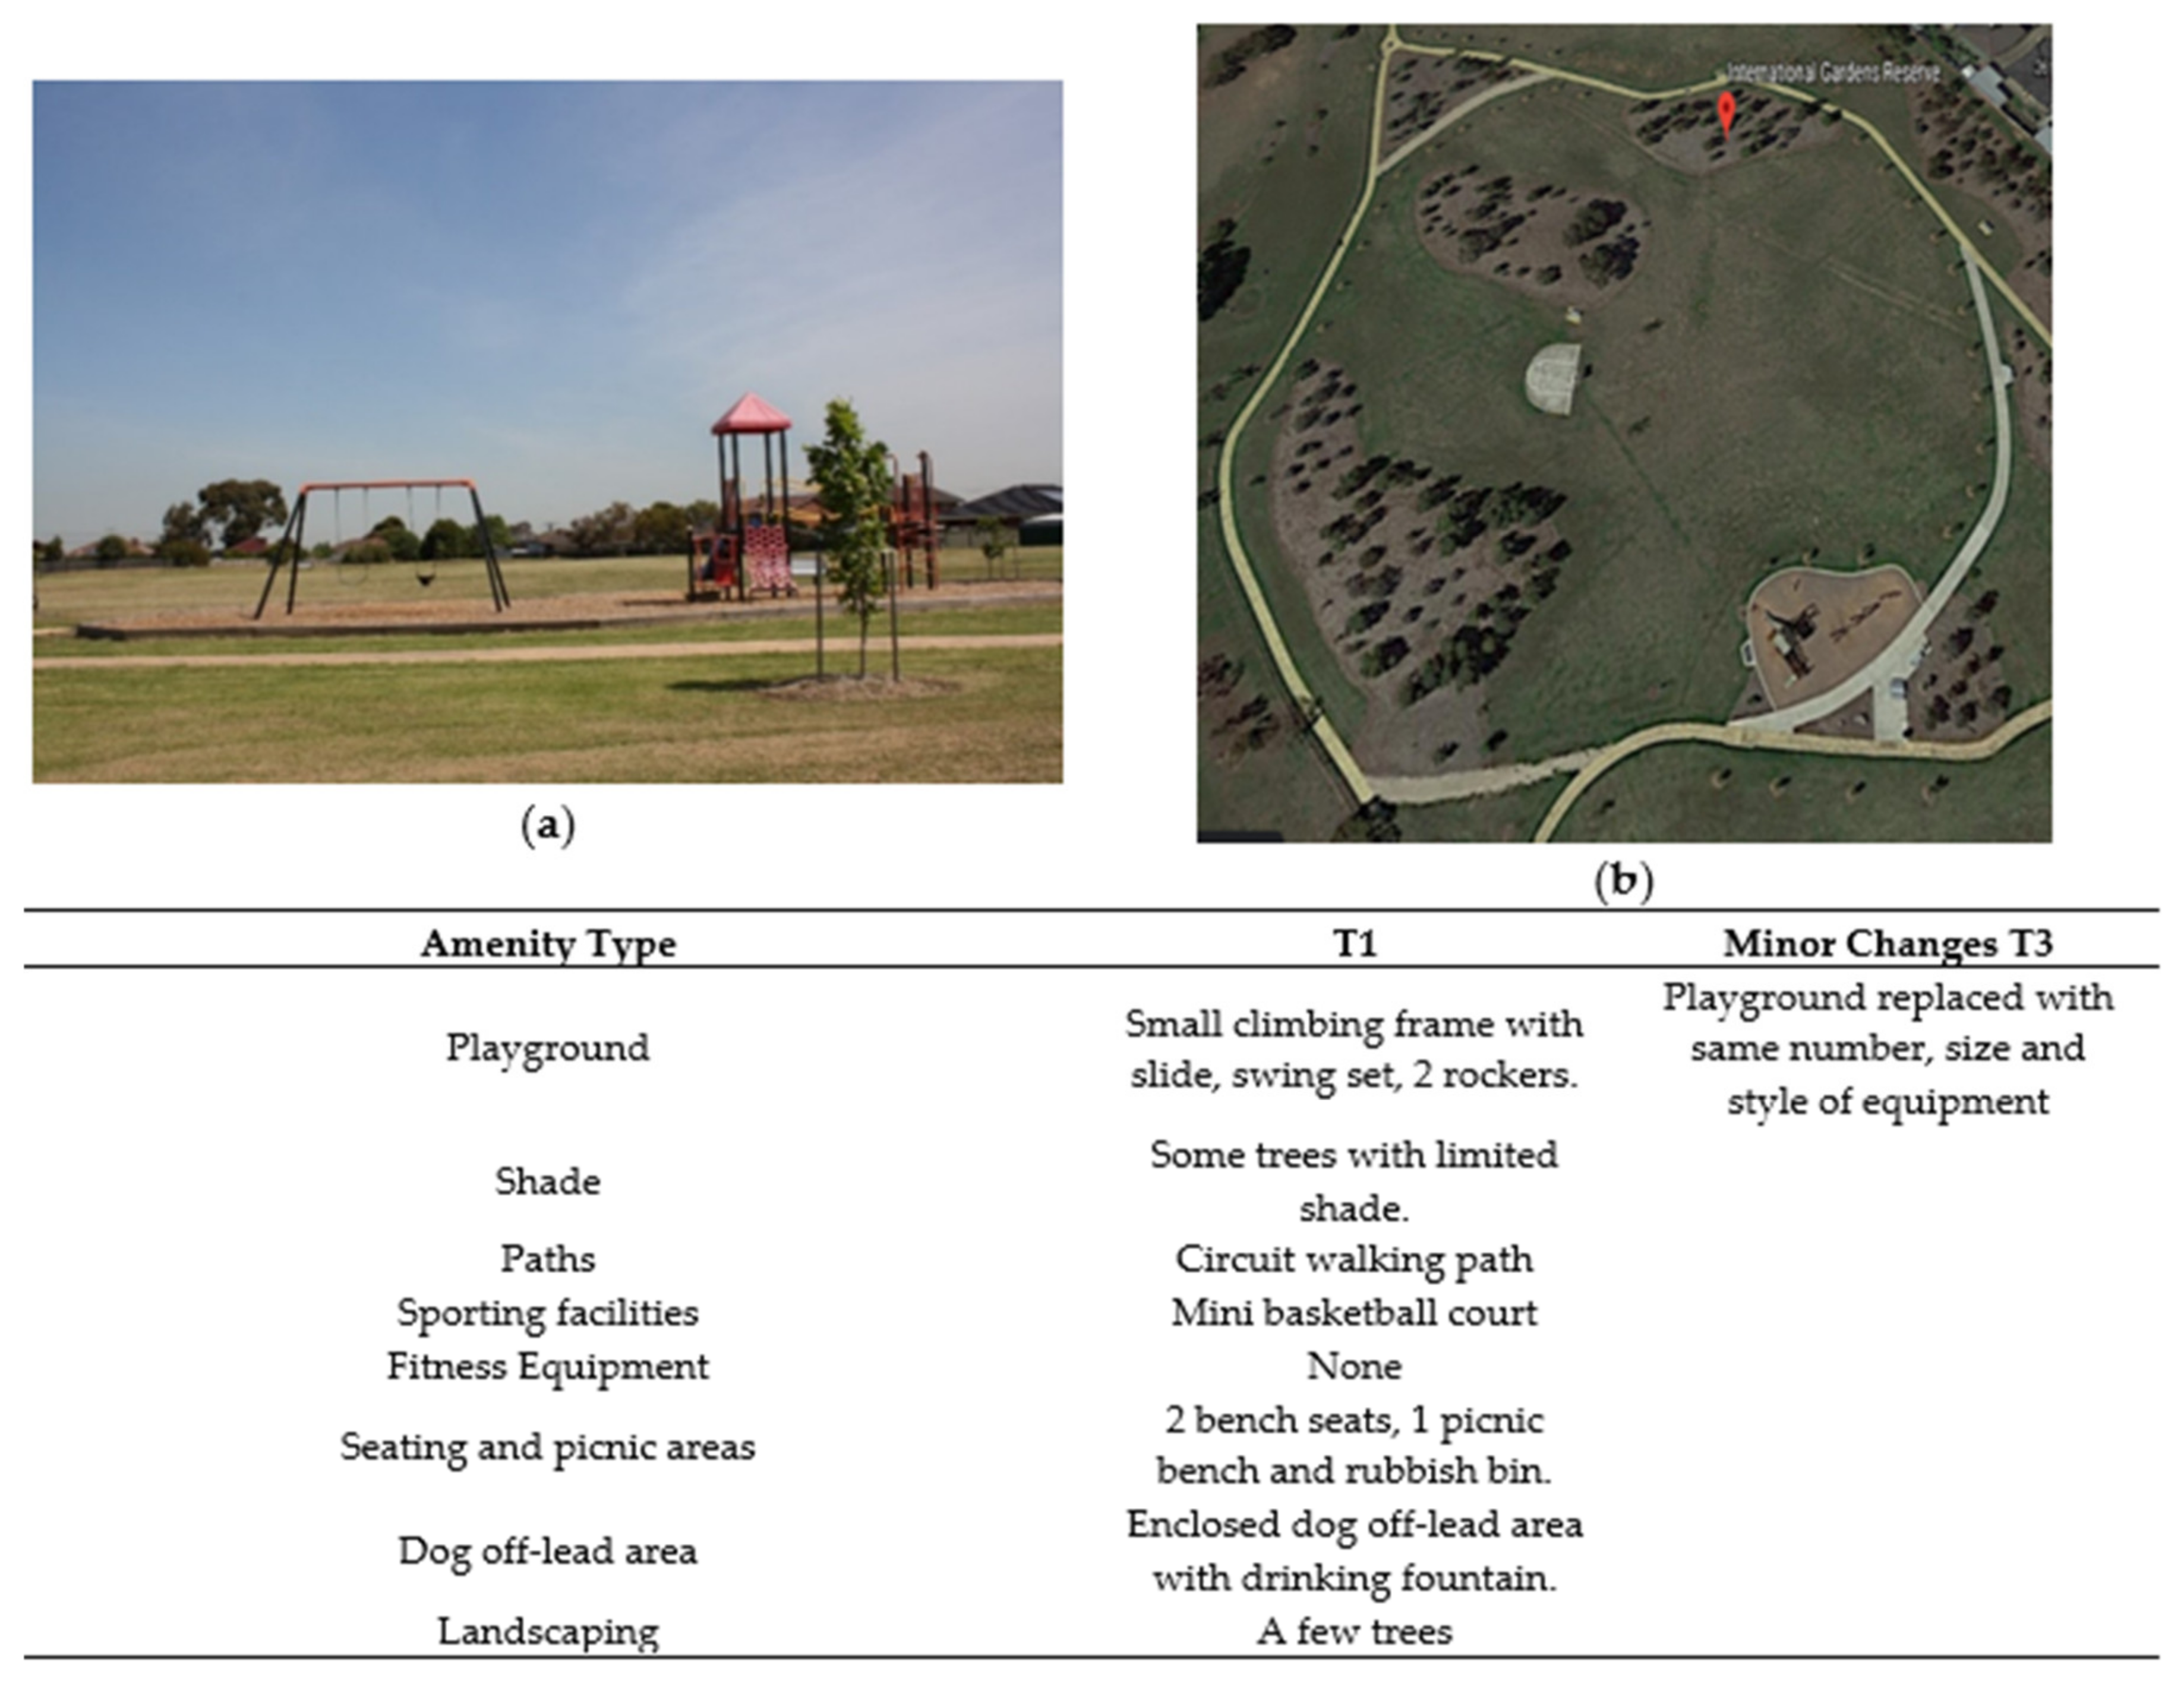
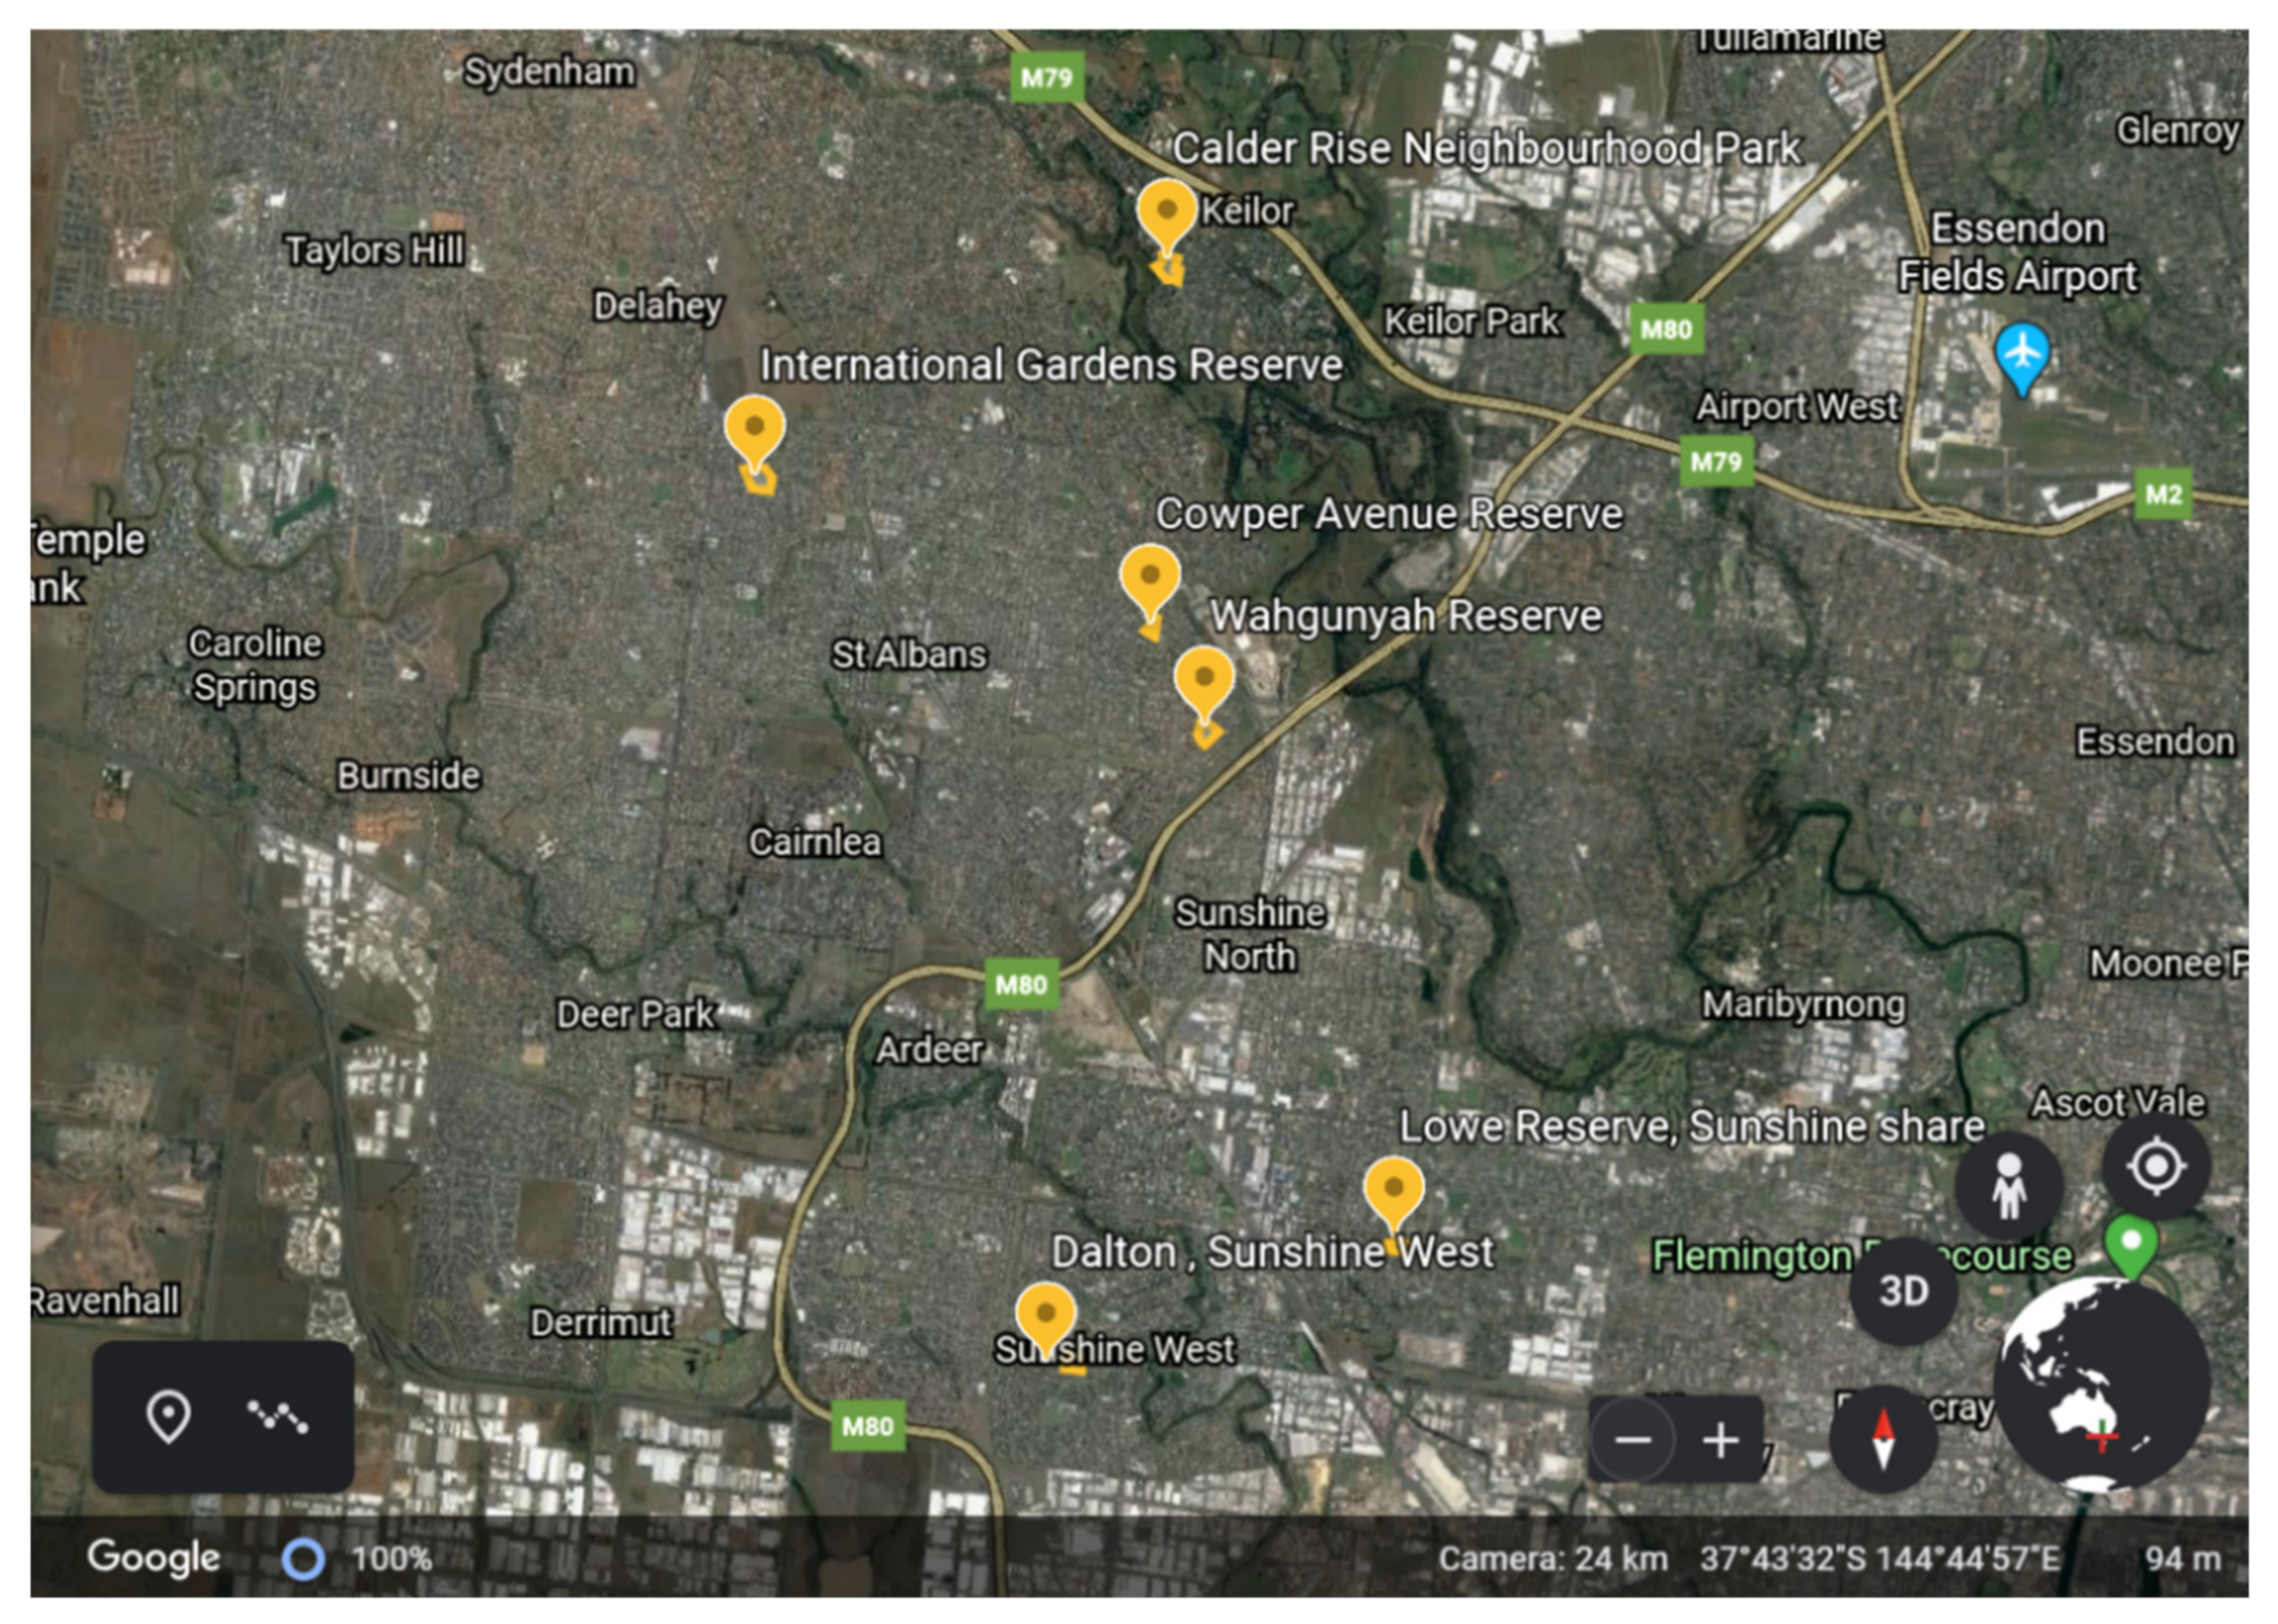
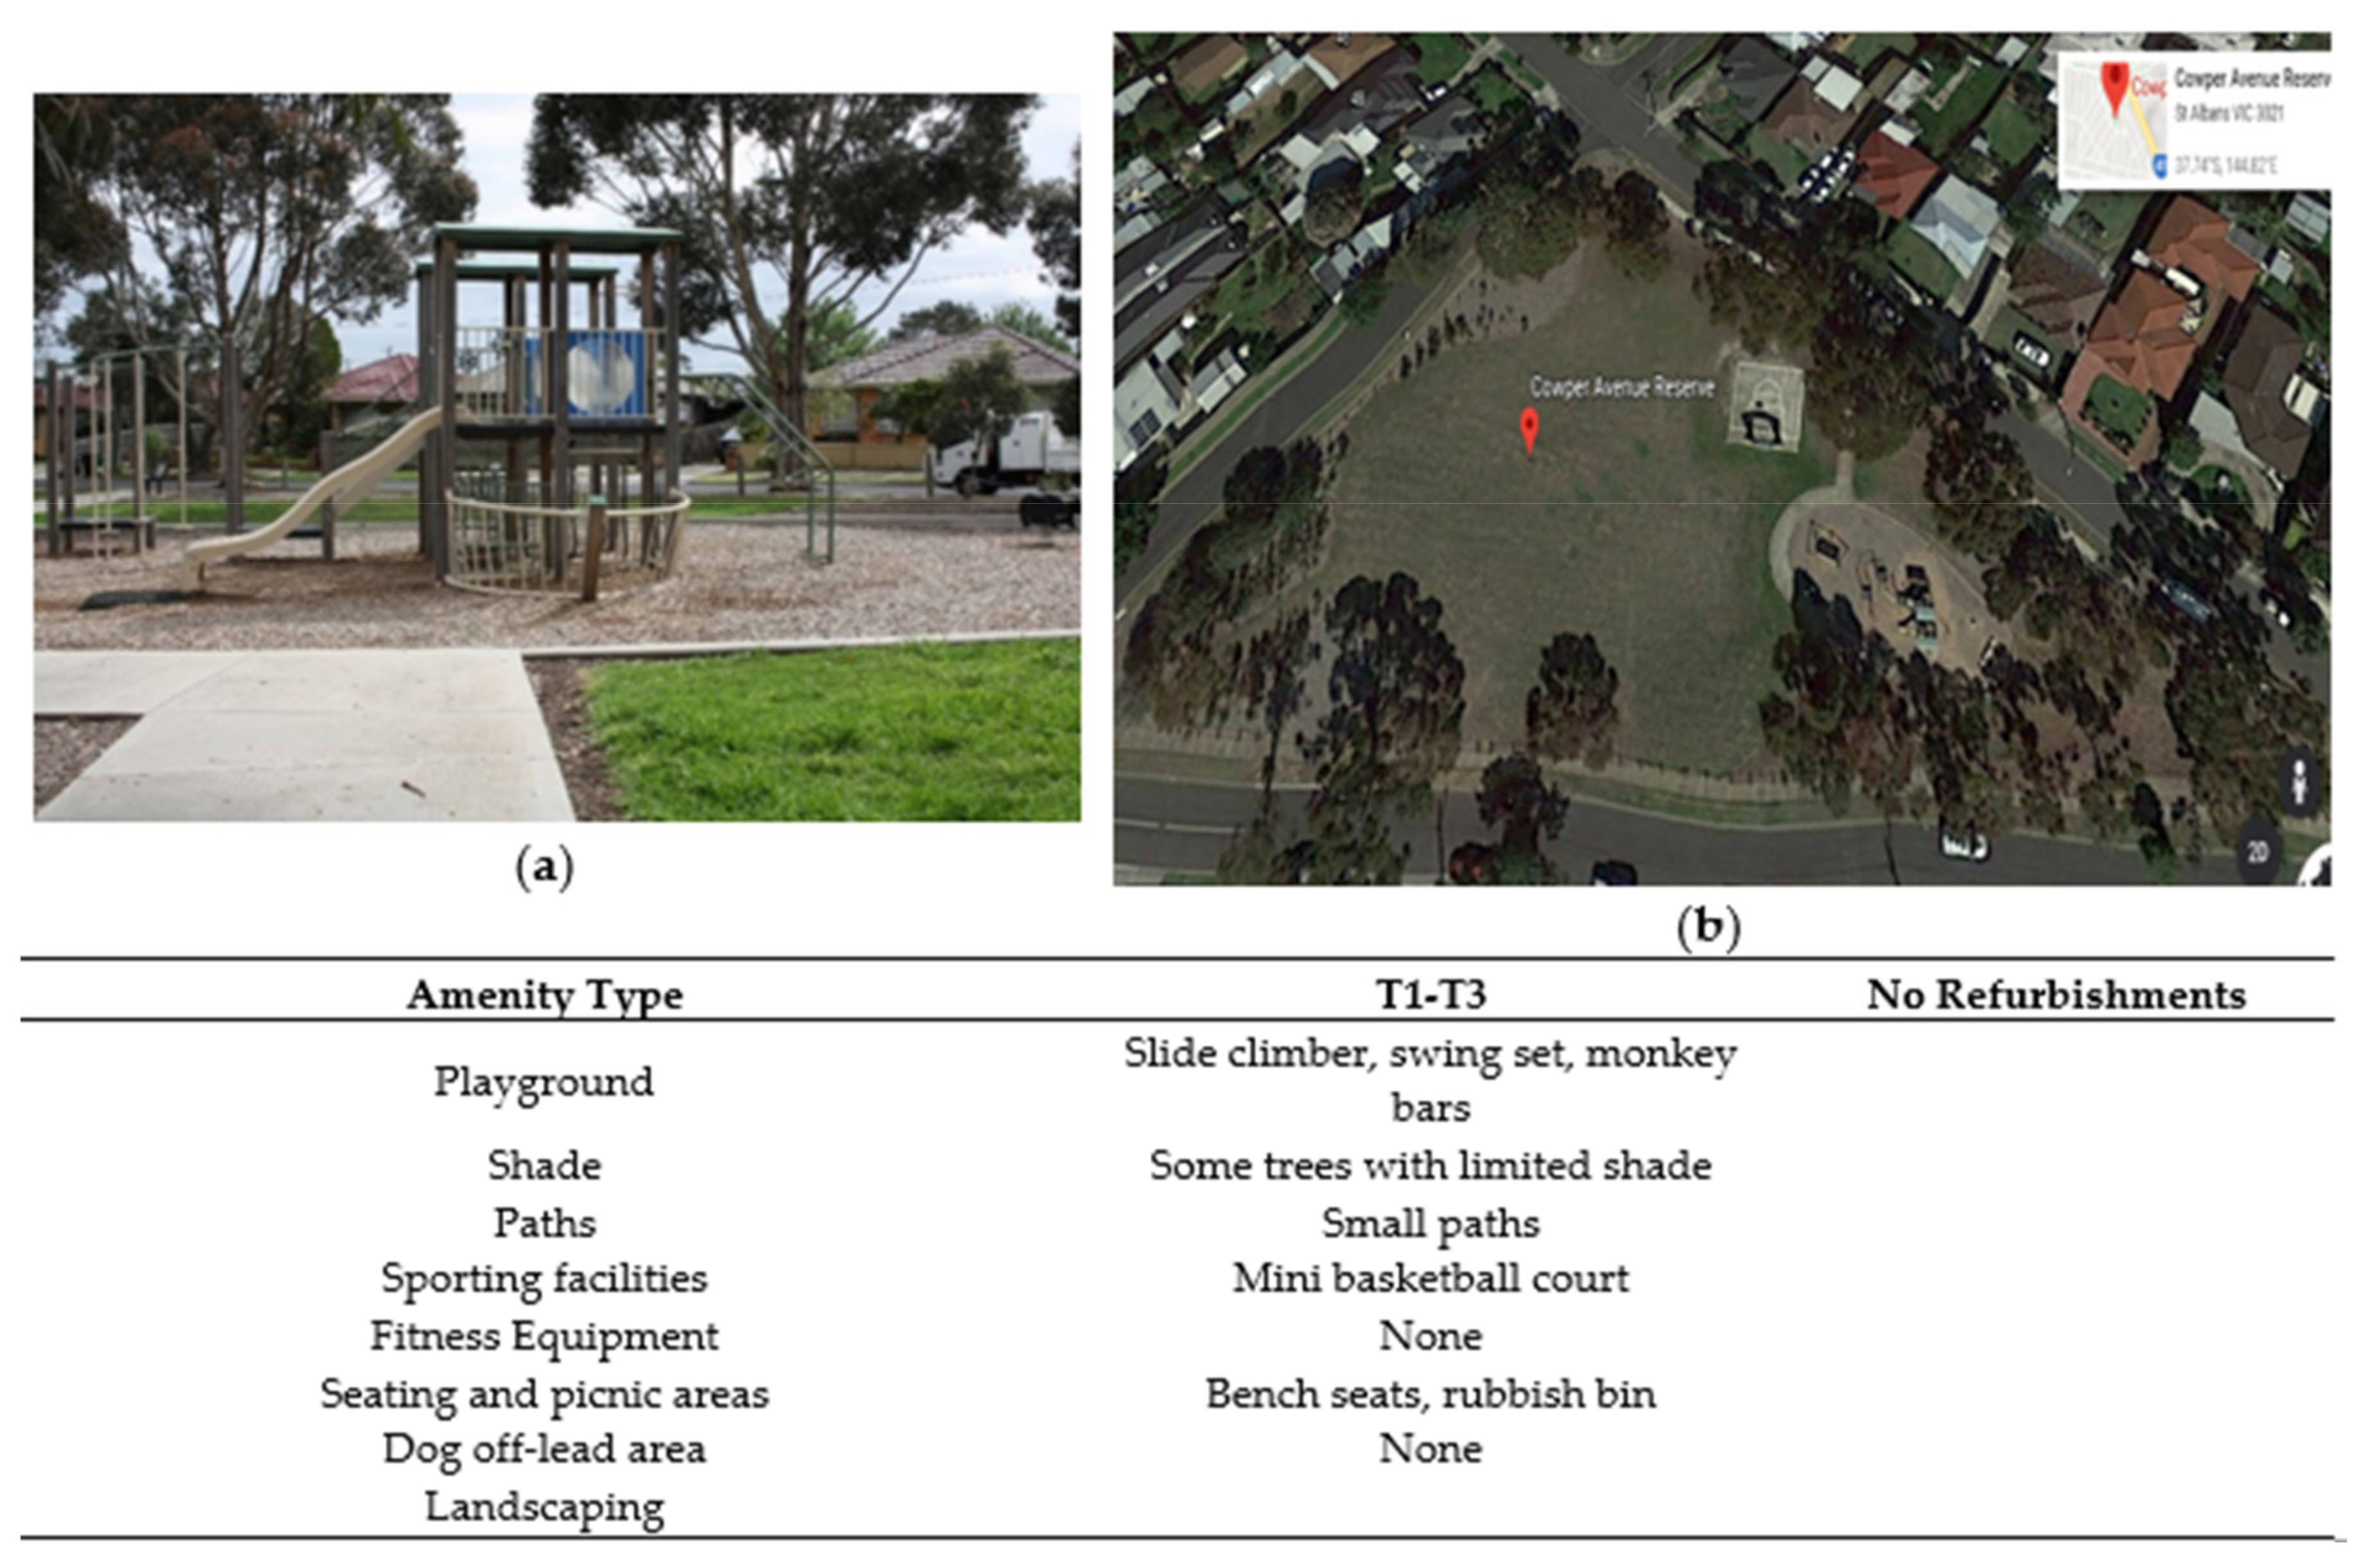
2.1. Study Sites
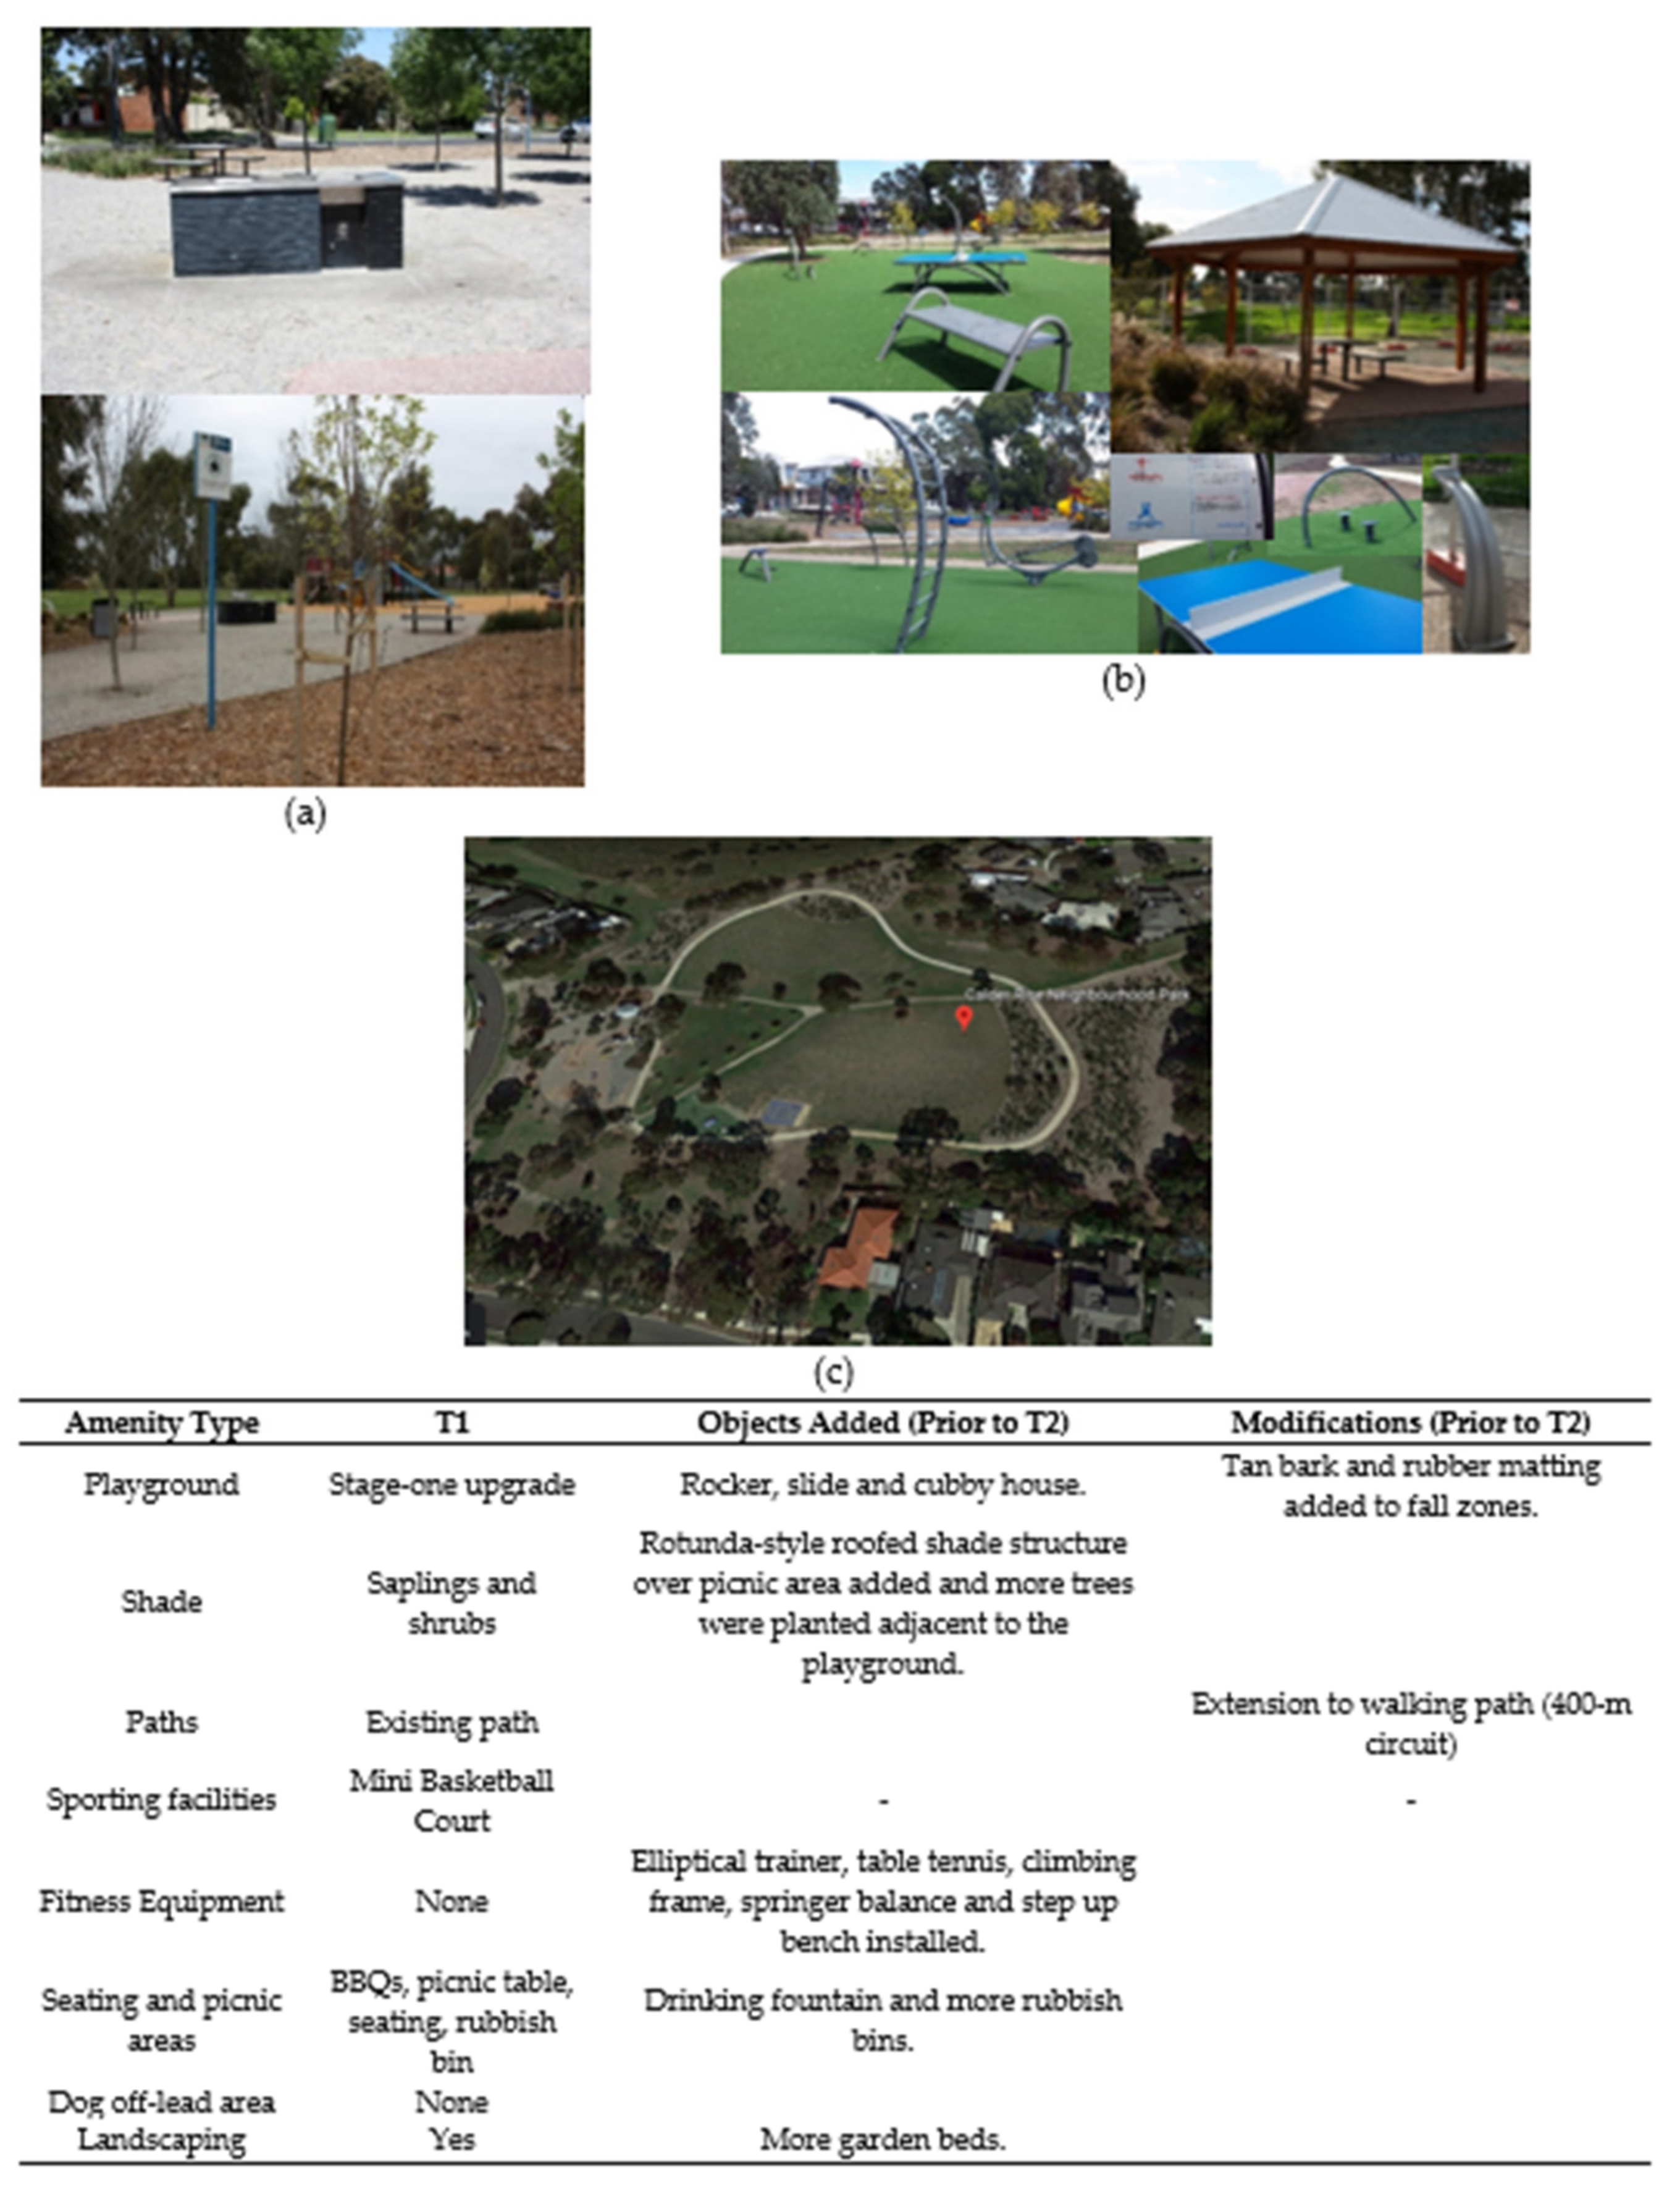
2.2. Intervention
2.3. Outcomes
2.4. Procedure
2.5. Statistical Analysis
3. Results
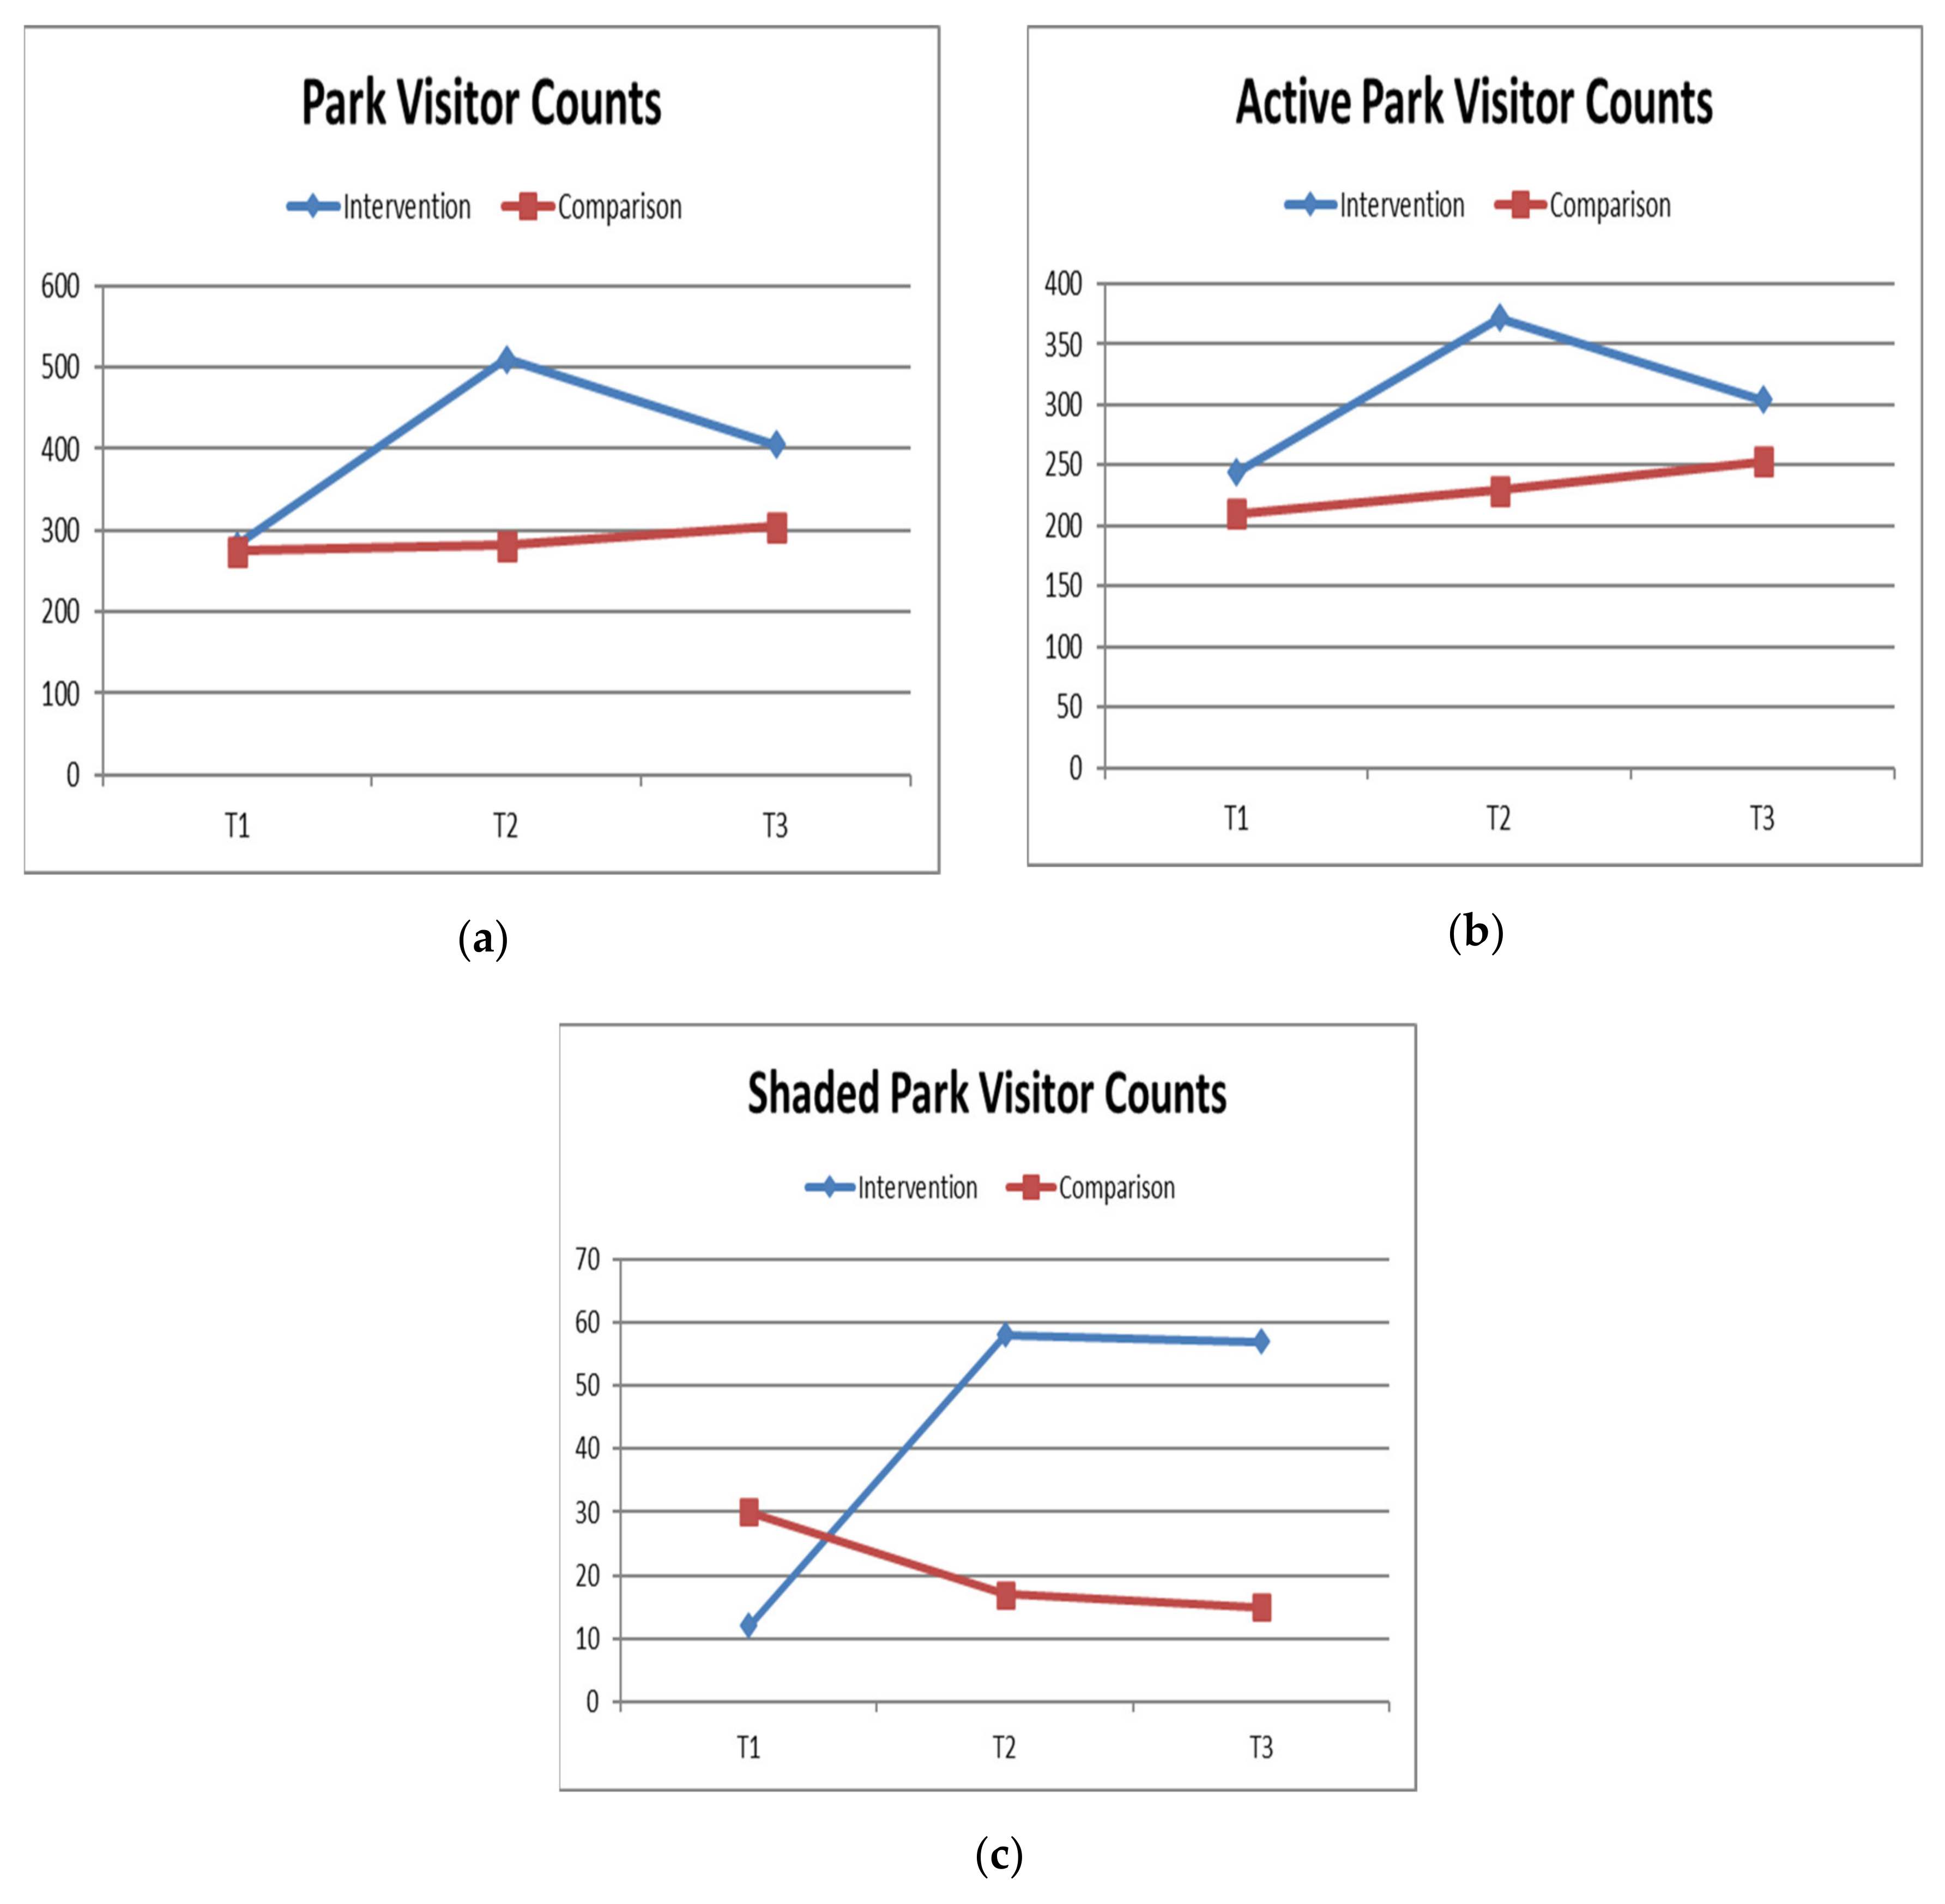
3.1. Intervention Impact
3.2. Descriptive Outcomes for Individual Parks
4. Discussion
5. Conclusions
Author Contributions
Funding
Acknowledgments
Conflicts of Interest
Appendix A. Study Weather Conditions

| Time of Day | T1 Mean (min—max) °C | T2 Mean (min—max) °C | T3 Mean (min—max) °C |
|---|---|---|---|
| 7 am–8:30 am | 15.4 | 15.4 | 15.7 |
| (7.9–31.5) | (8.1–26.4) | (9.1–26.4) | |
| 11:30 am–1 pm | 23.5 | 19.4 | 24.0 |
| (15.9–39.8) | (14.0–30.3) | (17.4–29.7) | |
| 4 pm–6:30 pm | 22.3 | 21.3 | 26.7 |
| (15.2–31.4) | (15.3–34.7) | (16.8–32.7) |
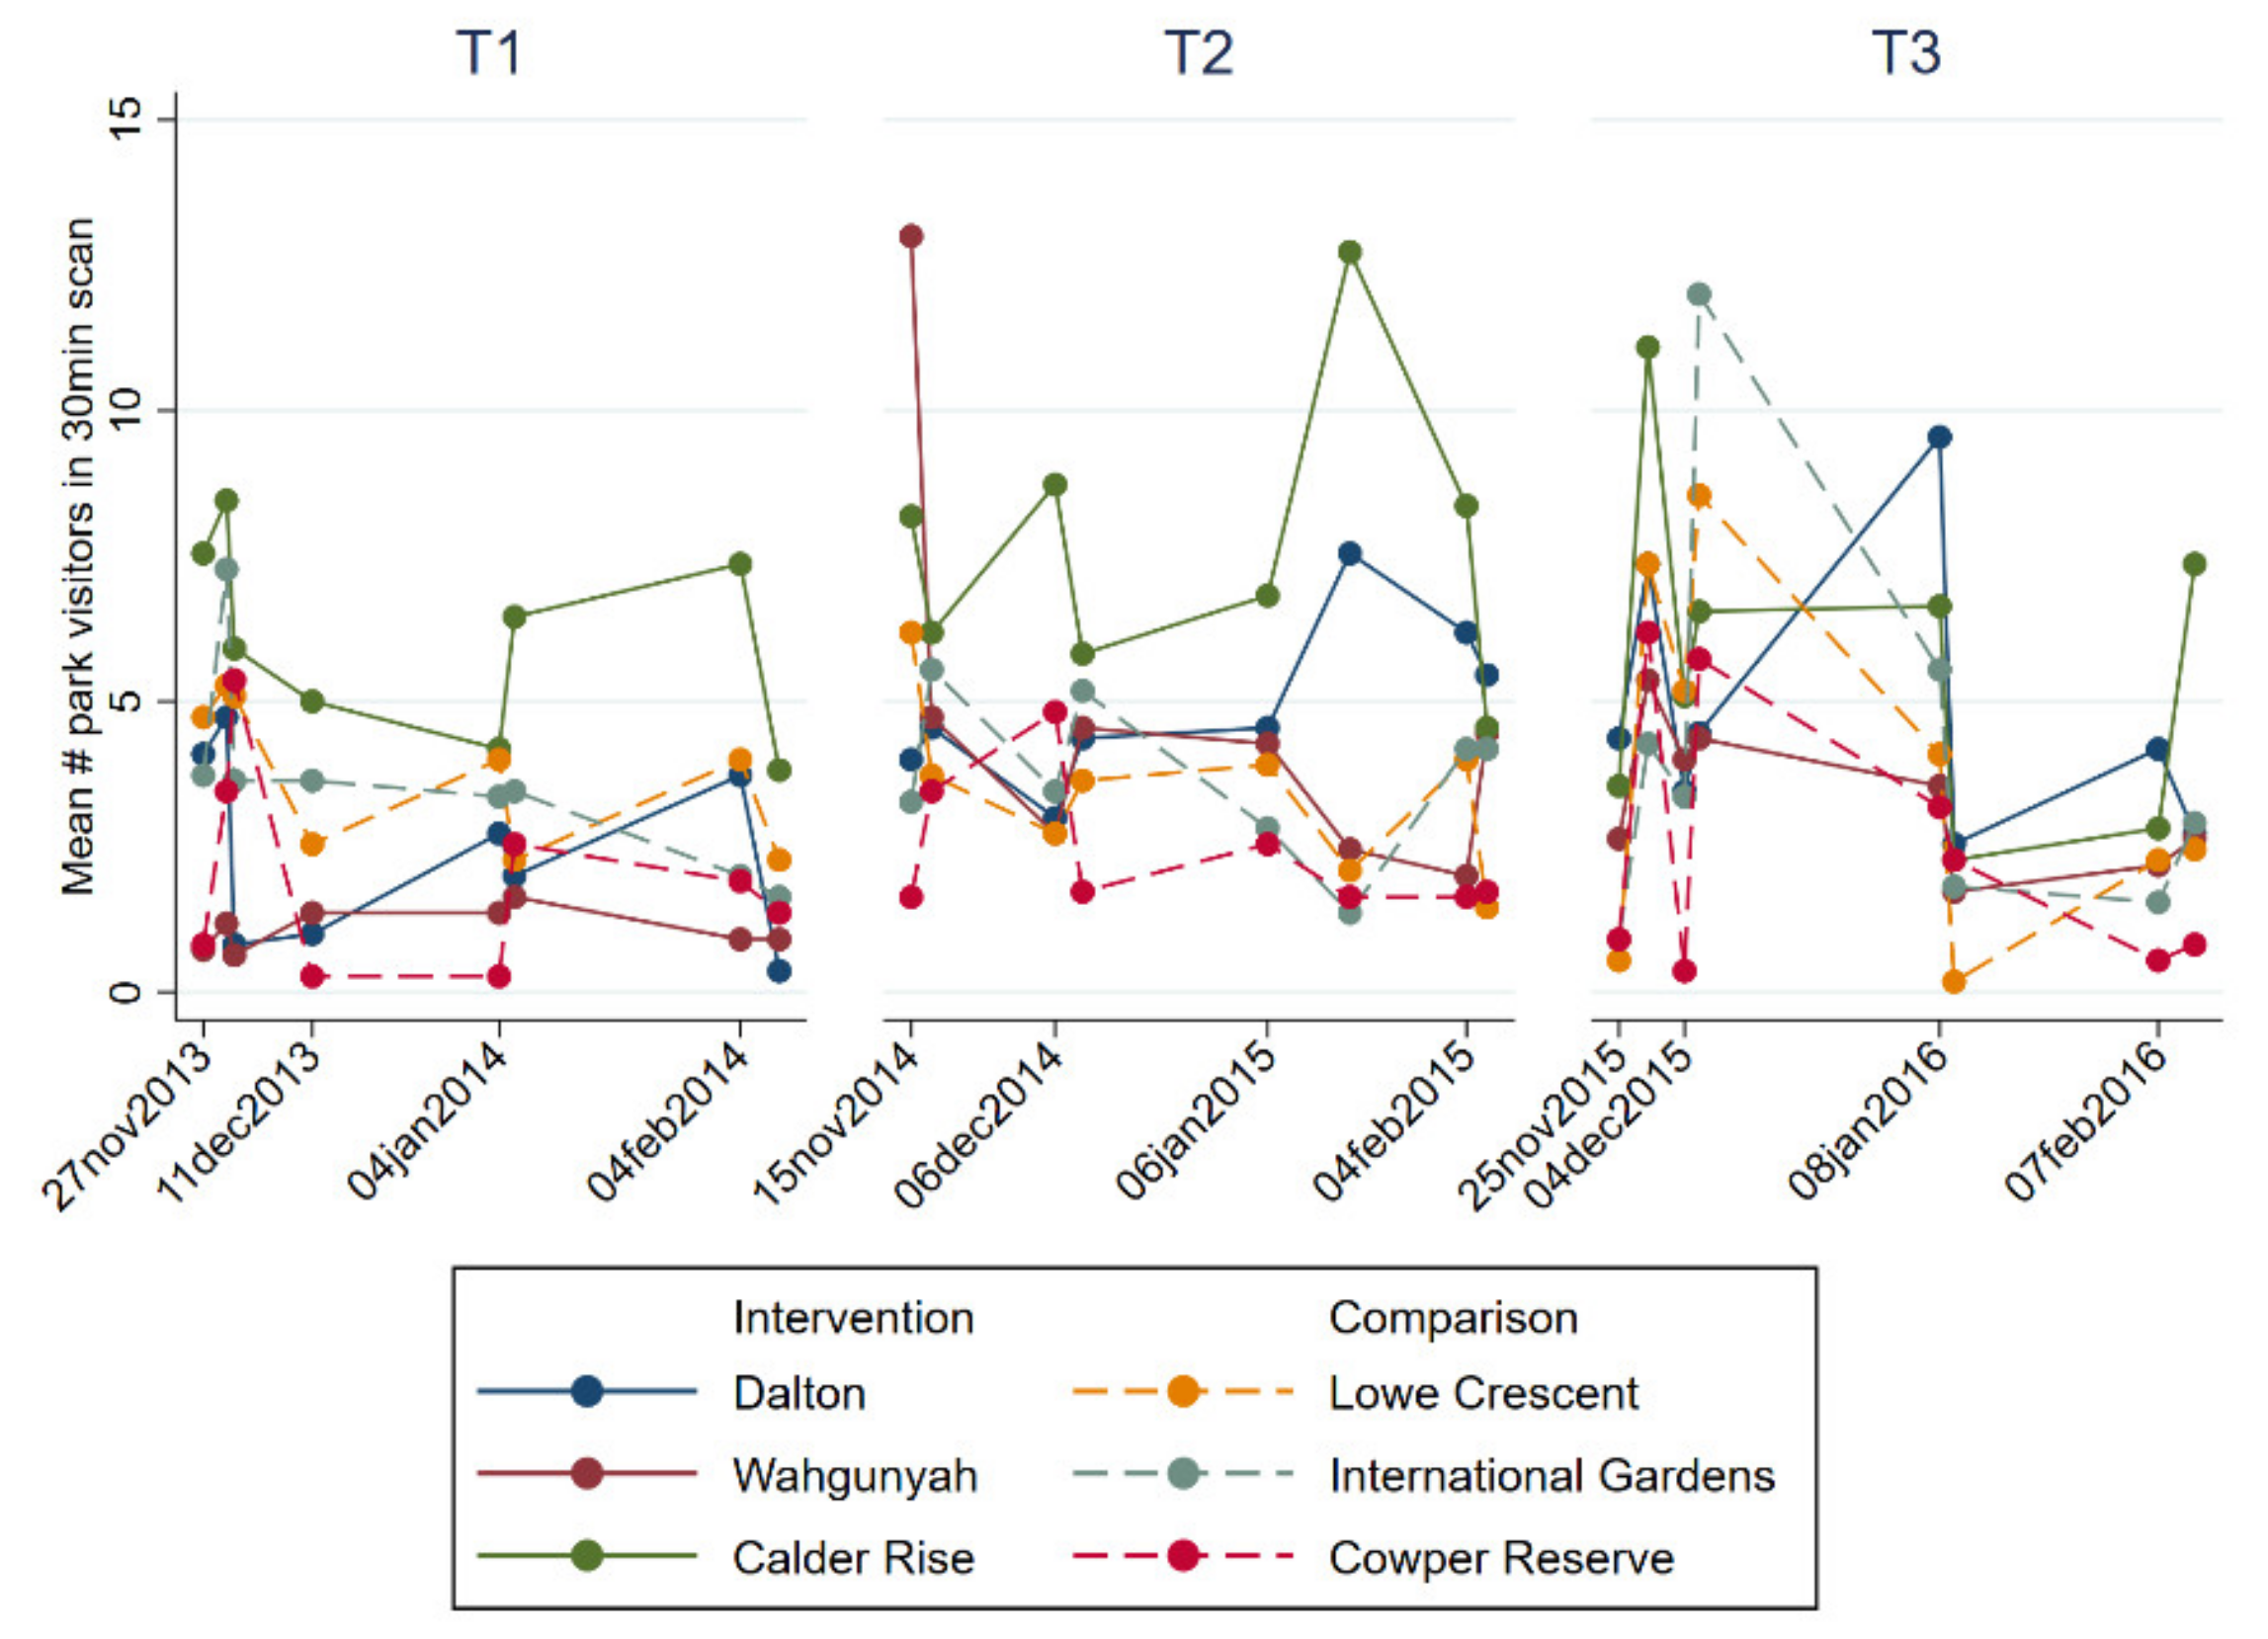
Appendix B. Average Park Use Per 30-min Observation Scan
References
- Lee, I.M.; Shiroma, E.J.; Lobelo, F.; Puska, P.; Blair, S.N.; Katzmarzyk, P.T. Lancet Physical Activity Series Working Group. Effect of physical inactivity on major non-communicable diseases worldwide: An analysis of burden of disease and life expectancy. Lancet 2012, 380, 219–229. [Google Scholar] [CrossRef] [Green Version]
- Kyu, H.H.; Bachman, V.F.; Alexander, L.T.; Mumford, J.E.; Afshin, A.; Estep, K.; Veerman, J.L.; Delwiche, K.; Iannarone, M.L.; Moyer, M.L.; et al. Physical activity and risk of breast cancer, colon cancer, diabetes, ischemic heart disease, and ischemic stroke events: Systematic review and dose-response meta-analysis for the Global Burden of Disease Study 2013. BMJ 2016, 354. [Google Scholar] [CrossRef] [PubMed] [Green Version]
- Bedimo-Rung, A.L.; Mowen, A.J.; Cohen, D.A. The significance of parks to physical activity and public health: A conceptual model. Am. J. Prev. Med. 2005, 28, 159–168. [Google Scholar] [CrossRef]
- Schipperijn, J.; Cerin, E.; Adams, M.A.; Reis, R.; Smith, G.; Cain, K.; Christiansen, L.B.; van Dyck, D.; Gidlow, C.; Frank, L.D.; et al. Access to parks and physical activity: An eight country comparison. Urban For. Urban Green 2017, 27, 253–263. [Google Scholar] [CrossRef]
- Liu, H.; Li, F.; Li, J.; Zhang, Y. The relationships between urban parks, residents’ physical activity, and mental health benefits: A case study from Beijing, China. J. Environ. Manag. 2017, 190, 223–230. [Google Scholar] [CrossRef]
- Ward, J.S.; Duncan, J.S.; Jarden, A.; Stewart, T. The impact of children’s exposure to greenspace on physical activity, cognitive development, emotional wellbeing, and ability to appraise risk. Health Place 2016, 40, 44–50. [Google Scholar] [CrossRef] [PubMed]
- Sugiyama, T.; Leslie, E.; Giles-Corti, B.; Owen, N. Associations of neighbourhood greenness with physical and mental health: Do walking, social coherence and local social interaction explain the relationships? J. Epidemiol. Community Health 2008, 62, e9. [Google Scholar] [CrossRef] [Green Version]
- Cohen, D.A.; Marsh, T.; Williamson, S.; Golinelli, D.; McKenzie, T.L. Impact and cost-effectiveness of family fitness zones: A natural experiment in urban public parks. Health Place 2012, 18, 39–45. [Google Scholar] [CrossRef] [Green Version]
- Lachowycz, K.; Jones, A.P.; Page, A.S.; Wheeler, B.W.; Cooper, A.R. What can global positioning systems tell us about the contribution of different types of urban greenspace to children’s physical activity? Health Place 2012, 18, 586–594. [Google Scholar] [CrossRef] [Green Version]
- Engelberg, J.K.; Conway, T.L.; Geremia, C.; Cain, K.L.; Saelens, B.E.; Glanz, K.; Frank, L.D.; Sallis, J.F. Socioeconomic and race/ethnic disparities in observed park quality. BMC Public Health 2016, 16, 395. [Google Scholar] [CrossRef] [Green Version]
- Crawford, D.; Timperio, A.; Giles-Corti, B.; Ball, K.; Hume, C.; Roberts, R.; Andrianopoulos, N.; Salmon, J. Do features of public open spaces vary according to neighbourhood socio-economic status? Health Place 2008, 14, 889–893. [Google Scholar] [CrossRef] [PubMed]
- Anderson, C.; Jackson, K.; Egger, S.; Chapman, K.; Rock, V. Shade in urban playgrounds in Sydney and inequities in availability for those living in lower socioeconomic areas. Aust. N. Z. J. Public Health 2014, 38, 49–53. [Google Scholar] [CrossRef] [PubMed]
- Ellaway, A.; Kirk, A.; Macintyre, S.; Mutrie, N. Nowhere to play? The relationship between the location of outdoor play areas and deprivation in Glasgow. Health Place 2007, 13, 557–561. [Google Scholar] [CrossRef]
- Mitchell, R.; Popham, F. Effect of exposure to natural environment on health inequalities: An observational population study. Lancet 2008, 372, 1655–1660. [Google Scholar] [CrossRef] [Green Version]
- Sallis, J.F.; Owen, N. Ecological models of health behavior. In Health Behavior: Theory, Research, and Practice, 5th ed.; Glanz, K., Rimer, B.K., Viswanath, K., Eds.; Jossey-Bass: San Francisco, CA, USA, 2015; pp. 43–64. ISBN 978-1-118-62898-0. [Google Scholar]
- McLeroy, K.R.; Bibeau, D.; Steckler, A.; Glanz, K. An ecological perspective on health promotion programs. Health Educ. Q. 1988, 15, 351–377. [Google Scholar] [CrossRef] [PubMed]
- Sallis, J.F.; Floyd, M.F.; Rodríguez, D.A.; Saelens, B.E. Role of built environments in physical activity, obesity, and cardiovascular disease. Circulation 2012, 125, 729–737. [Google Scholar] [CrossRef]
- Australian Institute of Health and Welfare. Skin Cancer in Australia; Cat. no. CAN 96; Australian Institute of Health and Welfare: Canberra, Australia, 2016; ISBN 978-1-74249-948-2. [Google Scholar]
- Fransen, M.; Karahalios, A.; Sharma, N.; English, D.R.; Giles, G.G.; Sinclair, R.D. Non-melanoma skin cancer in Australia. Med. J. Aust. 2012, 197, 565–568. [Google Scholar] [CrossRef]
- Whiteman, D.C.; Green, A.C.; Olsen, C.M. The growing burden of invasive melanoma: Projections of incidence rates and numbers of new cases in six susceptible populations through 2031. J. Investig. Dermatol. 2016, 136, 1161–1171. [Google Scholar] [CrossRef] [Green Version]
- Hartig, T.; Evans, G.W.; Jamner, L.D.; Davis, D.S.; Gärling, T. Tracking restoration in natural and urban field settings. J. Environ. Psychol. 2003, 23, 109–123. [Google Scholar] [CrossRef]
- Dobbinson, S.J.; Veitch, J.; Salmon, J.; Wakefield, M.; Staiger, P.K.; MacInnis, R.J.; Simmons, J. Study protocol for a natural experiment in a lower socioeconomic area to examine the health-related effects of refurbishment to parks including built-shade (ShadePlus). BMJ Open 2017, 7, e013493. [Google Scholar] [CrossRef]
- Brimbank City Council. The Diverse Communities of Brimbank; Brimbank City Council: Sunshine, Australia; Available online: https://www.yumpu.com/en/document/view/32007840/the-diverse-communities-of-brimbank-profile-brimbank-city-council (accessed on 22 May 2020).
- 202020 Vision. Where are All the Trees: An Analysis of Tree Canopy Cover in Urban Australia; Institute for Sustainable Futures, University of Technology: Sydney, Australia; Available online: https://202020vision.com.au/media/7145/where_are_all_the_trees.pdf (accessed on 22 May 2020).
- City of Brimbank: Community Profile. Idcommunity-Demographic Resources. Available online: https://profile.id.com.au/brimbank (accessed on 25 July 2020).
- Dobbinson, S.J.; White, V.; Wakefield, M.A.; Jamsen, K.M.; White, V.; Livingston, P.M.; English, D.R.; Simpson, J.A. Adolescents’ use of purpose built shade in secondary schools: Cluster randomised controlled trial. BMJ 2009, 338, b95. [Google Scholar] [CrossRef] [PubMed] [Green Version]
- Buller, D.B.; English, D.R.; Buller, M.K.; Simmons, J.; Chamberlain, J.A.; Wakefield, M.; Dobbinson, S. Shade sails and passive recreation in public parks of Melbourne and Denver: A randomized intervention. Am. J. Public Health 2017, 107, 1869–1875. [Google Scholar] [CrossRef] [PubMed]
- Watson, D.; Clark, L.A.; Tellegen, A. Development and validation of brief measures of positive and negative affect: The PANAS scales. J. Pers. Soc. Psychol. 1988, 54, 1063–1070. [Google Scholar] [CrossRef] [PubMed]
- Watson, D.; Clark, L.A. The PANAS-X: Manual for the Positive and Negative Affect. Schedule—Expanded Form; University of Iowa, Psychological and Brain Sciences: Iowa City, IA, USA, 1994. [Google Scholar] [CrossRef] [Green Version]
- Andersen, P.A.; Buller, D.B.; Walkosz, B.J.; Scott, M.D.; Beck, L.; Liu, X.; Abbott, A.; Eye, R. Environmental variables associated with vacationers’ sun protection at warm weather resorts in North America. Environ. Res. 2016, 146, 200–206. [Google Scholar] [CrossRef]
- Hayes, R.J.; Moulton, L.H. Cluster Randomised Trials; CRC Press: London, UK, 2017; ISBN 978-1-315-35323-4. [Google Scholar]
- Dobbinson, S.J.; Simmons, J.; Chamberlain, J.A.; MacInnis, R.; Salmon, J.; Staiger, P.K.; Wakefield, M.; Veitch, J. ShadePlus. Ann Arbor, MI: Inter-university Consortium for Political and Social Research [distributor], 18 August 2020. Available online: https://doi.org/10.3886/E119704V1 (accessed on 21 August 2020).
- Hunter, R.F.; Christian, H.; Veitch, J.; Astell-Burt, T.; Hipp, J.A.; Schipperijn, J. The impact of interventions to promote physical activity in urban green space: A systematic review and recommendations for future research. Soc. Sci. Med. 2015, 124, 246–256. [Google Scholar] [CrossRef] [PubMed] [Green Version]
- Veitch, J.; Salmon, J.; Crawford, D.; Abbott, G.; Giles-Corti, B.; Carver, A.; Timperio, A. The REVAMP natural experiment study: The impact of a play-scape installation on park visitation and park-based physical activity. Int. J. Behav. Nutr. Phys. Act. 2018, 15, 10. [Google Scholar] [CrossRef] [PubMed] [Green Version]
- Roberts, H.; McEachan, R.; Margary, T.; Conner, M.; Kellar, I. Identifying effective behavior change techniques in built environment interventions to increase use of green space: A systematic review. Environ. Behav. 2016. [Google Scholar] [CrossRef]
- Slater, S.; Pugach, O.; Lin, W.; Bontu, A. If you build it will they come? Does involving community groups in playground renovations affect park utilization and physical activity? Environ. Behav. 2016. [Google Scholar] [CrossRef] [Green Version]
- Veitch, J.; Ball, K.; Crawford, D.; Abbott, G.R.; Salmon, J. Park improvements and park activity: A natural experiment. Am. J. Prev. Med. 2012, 42, 616–619. [Google Scholar] [CrossRef] [Green Version]
- Tester, J.; Baker, R. Making the playfields even: Evaluating the impact of an environmental intervention on park use and physical activity. Prev. Med. 2009, 48, 316–320. [Google Scholar] [CrossRef]
- Cohen, D.A.; Marsh, T.; Williamson, S.; Han, B.; Derose, K.P.; Golinelli, D.; McKenzie, T.L. The potential for pocket parks to increase physical activity. Am. J. Health Promot. 2014, 28, S19–S26. [Google Scholar] [CrossRef] [PubMed] [Green Version]
- Lal, A.; Moodie, M.; Abbott, G.; Carver, A.; Salmon, J.; Giles-Corti, B.; Timperio, A.; Veitch, J. The impact of a park refurbishment in a low socioeconomic area on physical activity: A cost-effectiveness study. Int. J. Behav. Nutr. Phy. 2019, 16, 26. [Google Scholar] [CrossRef] [Green Version]
- Combs, M. Musical stairs: Encouraging Physical Activity through Persuasive Technology. Student Research. Honor Scholar. Senior Thesis, Depauw University Libraries, Greencastle, IN, USA, 2015. Available online: https://scholarship.depauw.edu/studentresearch/24/ (accessed on 22 May 2020).
- Costigan, S.A.; Veitch, J.; Crawford, D.; Carver, A.; Timperio, A. A cross-sectional investigation of the importance of park features for promoting regular physical activity in parks. Int. J. Environ. Res. Public Health 2017, 14, 1335. [Google Scholar] [CrossRef] [PubMed] [Green Version]
- King, D.K.; Litt, J.; Hale, J.; Burniece, K.M.; Ross, C. ‘The park a tree built’: Evaluating how a park development project impacted where people play. Urban. For. Urban. Green. 2015, 14, 293–299. [Google Scholar] [CrossRef]
- City of Brimbank: Community Profile. SEIFA by Local Government Area. Available online: https://profile.id.com.au/brimbank/seifa-disadvantage (accessed on 25 July 2020).
- Veitch, J.; Flowers, E.; Ball, K.; Deforche, B.; Timperio, A. Exploring children’s views on important park features: A qualitative study using walk-along interviews. Int. J. Environ. Res. Public Health 2020, 17, 4625. [Google Scholar] [CrossRef] [PubMed]
- Veitch, J.; Flowers, E.; Ball, K.; Deforche, B.; Timperio, A. Designing parks for older adults: A qualitative study using walk-along interviews. Urban For. Urban Green 2020, 54, 126768. [Google Scholar] [CrossRef]
- Dijkstra, K.; Pieterse, M.E.; Pruyn, A. Stress-reducing effects of indoor plants in the built healthcare environment: The mediating role of perceived attractiveness. Prev. Med. 2008, 47, 279–283. [Google Scholar] [CrossRef]
- Sturm, R.; Cohen, D. Proximity to urban parks and mental health. J. Ment. Health Policy Econ. 2014, 17, 19–24. [Google Scholar]


| Variable | Intervention | Comparison | Total |
|---|---|---|---|
| n (%) | n (%) | n (%) | |
| Total number of visitors b | 846 (100) | 824 (100) | 1670 (100) |
| Males | 464 (54.9) | 510 (61.9) | 974 (58.3) |
| Females | 378 (44.7) | 306 (37.1) | 684 (41.0) |
| Undetermined | 4 (0.5) | 8 (1.0) | 12 (0.7) |
| Age c | |||
| Child < 14 years | 303 (35.9) | 248 (30.3) | 551 (33.2) |
| Adolescent 14–19 years | 85 (10.1) | 151 (18.5) | 236 (14.2) |
| Adult 20–49 years | 305 (36.1) | 284 (34.7) | 589 (35.4) |
| Adult 50 + years | 151 (17.9) | 135 (16.5) | 286 (17.2) |
| Activity levels | |||
| Lying/sitting | 63 (7.5) | 107 (13.1) | 170 (10.2) |
| Standing | 44 (5.2) | 83 (10.1) | 127 (7.7) |
| Walking/moderate | 587 (69.9) | 478 (58.3) | 1065 (64.2) |
| Vigorous | 146 (17.4) | 152 (18.5) | 298 (18.0) |
| Active | 733 (86.6) | 630 (74.5) | 1363 (81.6) |
| Time of day | |||
| 7am–8:30am | 158 (18.7) | 116 (14.1) | 274 (16.4) |
| 11:30am–1:00pm | 194 (22.9) | 114 (13.8) | 308 (18.4) |
| 4:00pm–6:30pm | 494 (58.4) | 594 (72.1) | 1088 (65.2) |
| Day of week | |||
| Weekdays | 460 (54.4) | 351 (42.6) | 811 (48.6) |
| Weekends | 386 (45.6) | 473 (57.4) | 859 (51.4) |
| Cloud cover | |||
| Clear skies/thin cloud | 343 (40.5) | 348 (42.2) | 691 (41.4) |
| Cloudy | 503 (59.5) | 476 (57.8) | 979 (58.6) |
| Wind | |||
| None–slight | 275 (32.5) | 286 (34.7) | 561 (33.6) |
| Moderate | 382 (45.1) | 422 (51.2) | 804 (48.1) |
| Strong–very strong | 189 (22.3) | 116 (14.1) | 305 (18.3) |
| Difference T1 to T2 | Difference T1 to T3 | |||||||||
|---|---|---|---|---|---|---|---|---|---|---|
| Intervention Mean (SD) | Comparison Mean (SD) | Group Difference | t-Test p-Value | Effect Size d (95% CI) | Intervention Mean (SD) | Comparison Mean (SD) | Group Difference | t-Test p-Value | Effect Size d (95% CI) | |
| 6 park intention-to-treat analysis | ||||||||||
| Park use | 228.3 (92.7) | 7.3 (31.5) | 221.0 | 0.02 | 7.0 (2.0 to 12.0) | 123.0 (138.8) | 29.7 (21.5) | 93.3 | 0.31 | 4.3 (−6.1 to 14.8) |
| Shade use (any) | 46 (56.6) | −13.3 (15.0) | 59.3 | 0.15 | 4.0 (−2.3 to 10.2) | 44.7 (77.0) | −15.3 (32.8) | 60.0 | 0.28 | 1.8 (−2.3 to 5.9) |
| Active a | 127.7 (102.3) | 19.7 (15.9) | 108.0 | 0.15 | 6.8 (−3.6 to 17.2) | 59.3 (118.0) | 43.3 (13.7) | 16.0 | 0.83 | 1.2 (−12.8 to 15.1) |
| 5 park intervention received analysis b | ||||||||||
| Park use | 273 (72.1) | 7.3 (31.5) | 265.7 | 0.01 | 8.4 (3.9 to 12.9) | 203 (11.3) | 29.7 (21.5) | 173.3 | 0.002 | 8.1 (5.6 to 10.6) |
| Shade use (any) | 73.5 (43.1) | −13.3 (15.0) | 86.8 | 0.04 | 5.8 (0.4 to 11.1) | 75.5 (78.5) | −15.3 (32.8) | 90.8 | 0.16 | 2.8 (−1.9 to 7.4) |
| Active a | 123 (144.2) | 19.7 (15.9) | 103.3 | 0.27 | 6.5 (−8.9 to 21.8) | 118.5 (82.7) | 43.3 (13.7) | 75.2 | 0.19 | 2.4 (−4.9 to 16.0) |
| Difference T1 to T2 | Difference T1 to T3 | |||||||
|---|---|---|---|---|---|---|---|---|
| Intervention Mean (SD) | Comparison Mean (SD) | Group Difference | t-Test p-Value | Intervention Mean (SD) | Comparison Mean (SD) | Group Difference | t-Test p-Value | |
| 6 park intention-to-treat analysis a | ||||||||
| PANAS emotional state | ||||||||
| Positive affect (mean) | −2.47 (2.9) | 0.75 (2.7) | −3.22 | 0.23 | −3.90 (4.4) | 0.00 (0.4) | −3.90 | 0.20 |
| Negative affect (mean) | −0.70 (3.1) | 0.04 (0.6) | −0.75 | 0.70 | −2.75 (4.2) | 0.39 (1.1) | −3.14 | 0.28 |
| Park facilities—mean attractiveness rating | 3.92 (2.5) | −0.40 (2.3) | 4.31 | 0.10 | 3.51 (2.6) | 1.03 (1.1) | 2.48 | 0.20 |
| Community social cohesion score b | - | - | - | - | 1.04 (5.6) | −2.62 (1.8) | 3.66 | 0.34 |
| Frequency met/talked to new people at park in past 3 months | −0.31 (0.7) | −0.44 (0.6) | 0.13 | 0.82 | 0.39 (0.9) | −1.2 (0.6) | 1.62 | 0.05 |
| Frequency met/talked to known people at park in past 3 months | −0.43 (0.8) | −0.53 (0.7) | 0.10 | 0.87 | 0.60 (1.8) | −0.88 (1.1) | 1.48 | 0.28 |
| Frequency participated in social event at park in past 3 months | −0.05 (0.5) | −0.47 (0.8) | 0.41 | 0.49 | 0.41 (1.0) | 0.04 (0.5) | 0.37 | 0.58 |
| T1 (n = 1670) | T2 (n = 2377) | T3 (n = 2128) | ||||||||
|---|---|---|---|---|---|---|---|---|---|---|
| Outcome | Pair A | Pair B | Pair C | Pair A | Pair B | Pair C | Pair A | Pair B | Pair C | |
| Park use | Intervention | 214 | 96 | 536 | 436 | 420 | 675 | 425 | 291 | 499 |
| Comparison | 332 | 176 | 316 | 305 | 211 | 330 | 337 | 220 | 356 | |
| Physical activity (active) | Intervention | 193 | 80 | 460 | 214 | 305 | 597 | 253 | 257 | 401 |
| Comparison | 215 | 145 | 270 | 248 | 147 | 294 | 273 | 186 | 301 | |
| Shade use (any) | Intervention | 0 | 2 | 35 | 104 | 45 | 26 | 131 | 22 | 18 |
| Comparison | 24 | 65 | 1 | 12 | 36 | 2 | 24 | 12 | 8 | |
© 2020 by the authors. Licensee MDPI, Basel, Switzerland. This article is an open access article distributed under the terms and conditions of the Creative Commons Attribution (CC BY) license (http://creativecommons.org/licenses/by/4.0/).
Share and Cite
Dobbinson, S.J.; Simmons, J.; Chamberlain, J.A.; MacInnis, R.J.; Salmon, J.; Staiger, P.K.; Wakefield, M.; Veitch, J. Examining Health-Related Effects of Refurbishment to Parks in a Lower Socioeconomic Area: The ShadePlus Natural Experiment. Int. J. Environ. Res. Public Health 2020, 17, 6102. https://doi.org/10.3390/ijerph17176102
Dobbinson SJ, Simmons J, Chamberlain JA, MacInnis RJ, Salmon J, Staiger PK, Wakefield M, Veitch J. Examining Health-Related Effects of Refurbishment to Parks in a Lower Socioeconomic Area: The ShadePlus Natural Experiment. International Journal of Environmental Research and Public Health. 2020; 17(17):6102. https://doi.org/10.3390/ijerph17176102
Chicago/Turabian StyleDobbinson, Suzanne J., Jody Simmons, James A. Chamberlain, Robert J. MacInnis, Jo Salmon, Petra K. Staiger, Melanie Wakefield, and Jenny Veitch. 2020. "Examining Health-Related Effects of Refurbishment to Parks in a Lower Socioeconomic Area: The ShadePlus Natural Experiment" International Journal of Environmental Research and Public Health 17, no. 17: 6102. https://doi.org/10.3390/ijerph17176102