Investigation of Correlated Internet and Smartphone Addiction in Adolescents: Copula Regression Analysis


 and
and
Abstract
1. Introduction
2. Materials and Methods
2.1. Participants
2.2. Measures
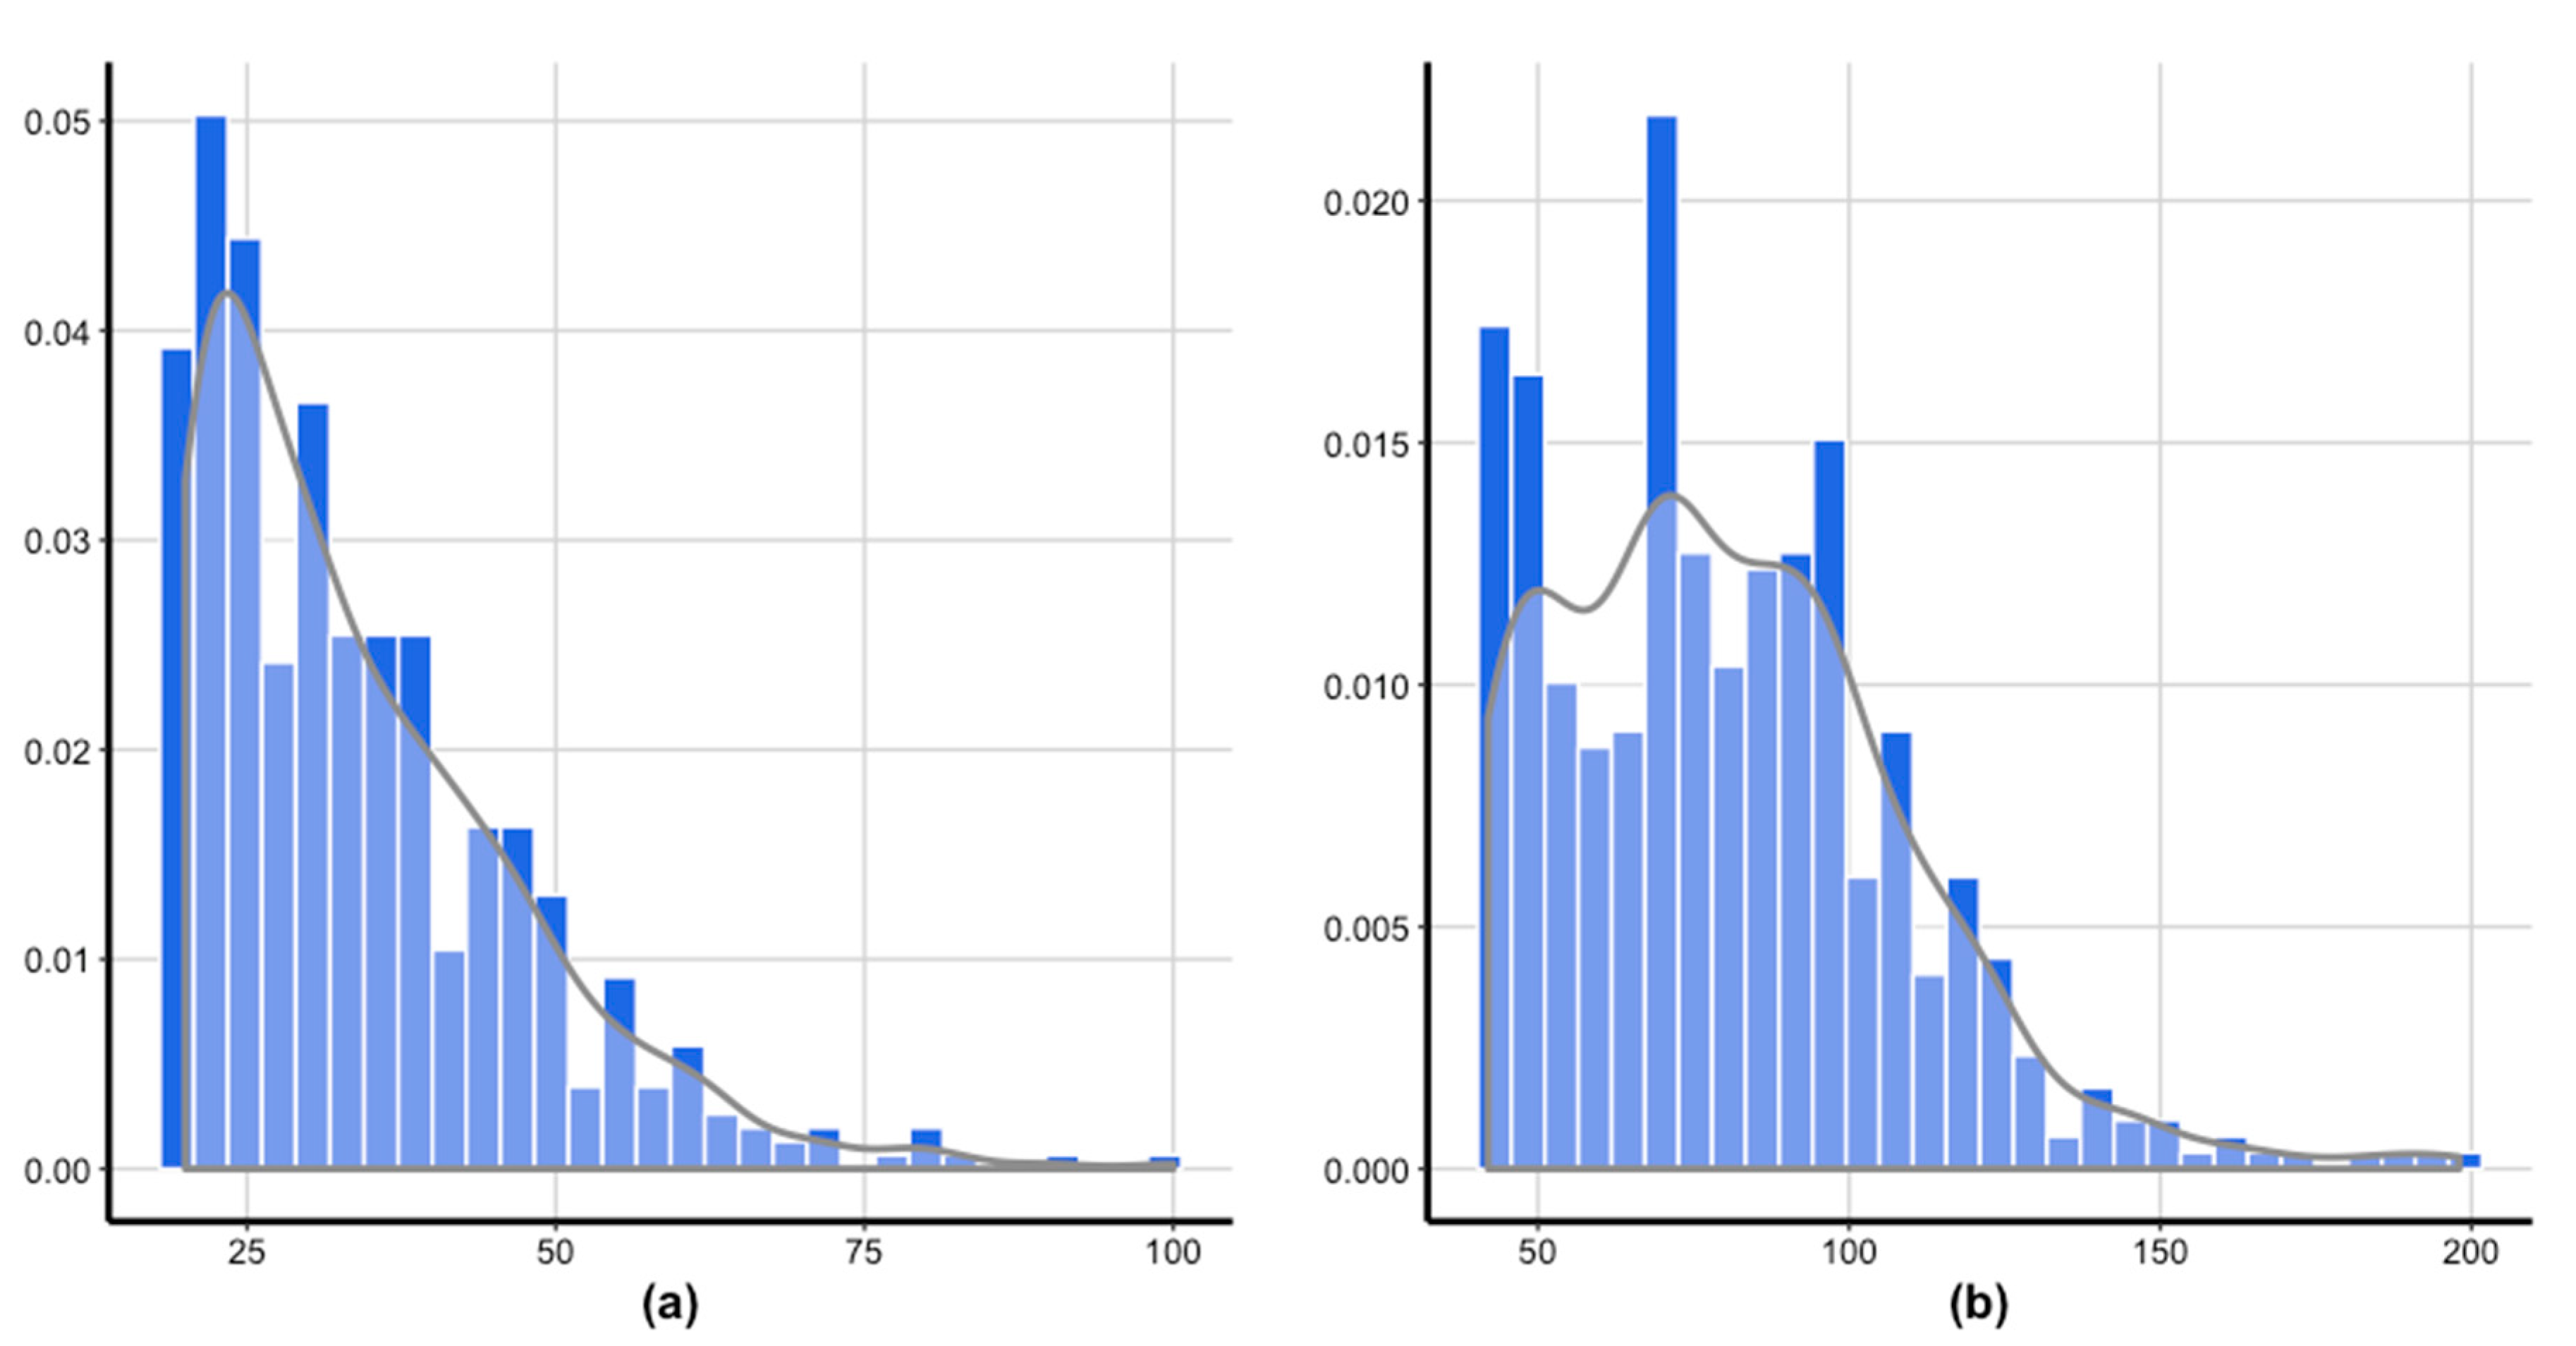
2.2.1. Young’s Internet Addiction Test (Y-IAT)
2.2.2. Smartphone Addiction Scale (SAS)
2.2.3. Psychosocial Measures
2.2.4. Internet/Smartphone Usage Pattern Survey
2.3. Statistical Analysis
3. Results
4. Discussion
5. Conclusions
Author Contributions
Funding
Conflicts of Interest
References
- Ministry of Science and ICT. 2018 Internet Usage Survey Summary Report. Available online: https://www.kisa.or.kr/public/library/etc_View.jsp?regno=0011990 (accessed on 1 November 2019).
- Kim, Y.H. Analysis of Cellular Phone Retention and Usage Behavior of Children and Adolescent. Available online: https://www.kisdi.re.kr/kisdi/fp/kr/publication/selectResearch.do?cmd=fpSelectResearch&sMenuType=2&controlNoSer=43&controlNo=14421&langdiv=1 (accessed on 31 October 2018).
- Hwang, Y.; Park, N. Is Smartphone Addiction Comparable between Adolescents and Adults? Examination of the Degree of Smartphone Use, Type of Smartphone Activities, and Addiction Levels among Adolescents and Adults. Int. Telecommun. Policy Rev. 2017, 24, 59–75. [Google Scholar]
- Griffiths, M.D. Online Games, Addiction and Overuse of. In The International Encyclopedia of Digital Communication and Society; Available online: https://onlinelibrary.wiley.com/doi/full/10.1002/9781118767771.wbiedcs044 (accessed on 1 June 2020).
- Andreassen, C.S.; Billieux, J.; Griffiths, M.D.; Kuss, D.J.; Demetrovics, Z.; Mazzoni, E.; Pallesen, S. The relationship between addictive use of social media and video games and symptoms of psychiatric disorders: A large-scale cross-sectional study. Psychol. Addict. Behav. 2016, 30, 252–262. [Google Scholar] [CrossRef] [PubMed]
- Koo, H.J.; Kwon, J.H. Risk and Protective Factors of Internet Addiction: A Meta-Analysis of Empirical Studies in Korea. Yonsei Med. J. 2014, 55, 1691–1711. [Google Scholar] [CrossRef] [PubMed]
- Boumosleh, J.M.; Jaalouk, D. Depression, anxiety, and smartphone addiction in university students—A cross sectional study. PLoS ONE 2018, 12, e0182239. [Google Scholar] [CrossRef]
- Thomee, S.; Harenstam, A.; Hagberg, M. Mobile phone use and stress, sleep disturbances, and symptoms of depression among young adults-a prospective cohort study. BMC Public Health 2011, 11, 66. [Google Scholar] [CrossRef]
- Kim, J. The Evolution of Mobile Internet Service. OSIA Stand. Technol. Rev. 2010, 38, 4–12. [Google Scholar]
- Choi, S.W.; Kim, D.J.; Choi, J.S.; Ahn, H.; Choi, E.J.; Song, W.Y.; Kim, S.; Youn, H. Comparison of risk and protective factors associated with smartphone addiction and Internet addiction. J. Behav. Addict. 2015, 4, 308–314. [Google Scholar] [CrossRef]
- Lim, J.-A.; Gwak, A.R.; Park, S.M.; Kwon, J.-G.; Lee, J.-Y.; Jung, H.Y.; Sohn, B.K.; Kim, J.-W.; Kim, D.J.; Choi, J.-S. Are Adolescents with Internet Addiction Prone to Aggressive Behavior? The Mediating Effect of Clinical Comorbidities on the Predictability of Aggression in Adolescents with Internet Addiction. Cyberpsychol. Behav. Soc. Netw. 2015, 18, 260–267. [Google Scholar] [CrossRef]
- Whang, S.; Lee, S.; Chang, G. Internet Over-Users’ Psychological Profiles: A Behavior Sampling Analysis on Internet Addiction. CyberPsychol. Behav. 2003, 6, 143–150. [Google Scholar] [CrossRef]
- Ko, C.; Yen, J.-Y.; Yen, C.-F.; Chen, C.-S.; Chen, C.-C. The association between Internet addiction and psychiatric disorder: A review of the literature. Eur. Psychiatry 2012, 27, 1–8. [Google Scholar] [CrossRef]
- Demirci, K.; Akgonul, M.; Akpinar, A. Relationship of smartphone use severity with sleep quality, depression, and anxiety in university students. J. Behav. Addict. 2015, 4, 85–92. [Google Scholar] [CrossRef] [PubMed]
- Kwon, M.; Lee, J.Y.; Won, W.Y.; Park, J.W.; Min, J.A.; Hahn, C.; Gu, X.; Kim, D.J. Development and validation of a smartphone addiction scale (SAS). PLoS ONE 2013, 8, e56936. [Google Scholar] [CrossRef]
- Tateno, M.; Kim, D.J.; Teo, A.R.; Skokauskas, N.; Guerrero, A.; Kato, T.A. Smartphone Addiction in Japanese College Students: Usefulness of the Japanese Version of the Smartphone Addiction Scale as a Screening Tool for a New Form of Internet Addiction. Psychiatry Investig. 2019, 16, 115–120. [Google Scholar] [CrossRef]
- Cha, S.S.; Seo, B.K. Smartphone use and smartphone addiction in middle school students in Korea: Prevalence, social networking service, and game use. Health Psychol. Open 2018, 5, 2055102918755046. [Google Scholar] [CrossRef] [PubMed]
- Parsa, R.A.; Klugman, S.A. Copula Regression. Variance 2011, 5, 45–54. [Google Scholar]
- Faraci, P.; Craparo, G.; Messina, R.; Severino, S. Internet Addiction Test (IAT): Which is the Best Factorial Solution? J. Med. Internet Res. 2013, 15, e225. [Google Scholar] [CrossRef] [PubMed]
- Kwon, M.; Kim, D.J.; Cho, H.; Yang, S. The smartphone addiction scale: Development and validation of a short version for adolescents. PLoS ONE 2013, 8, e83558. [Google Scholar] [CrossRef] [PubMed]
- Beck, A.T.; Steer, R.A.; Brown, G.K. Beck Depression Inventory-Second Edition. Available online: https://www.nctsn.org/measures/beck-depression-inventory-second-edition (accessed on 1 June 2020).
- Chung, Y.C.; Rhee, M.K.; Lee, Y.H.; Park, S.H.; Sohn, C.H.; Hong, S.K.; Lee, B.K.; Chang, P.L.; Yoon, A.R. A standardization study of Beck depression inventory I—Korean version (K-BDI): Reliability and factor analysis. Korean J. Psychopathol 1995, 4, 77–95. [Google Scholar]
- Beck, A.T.; Epstein, N.; Brown, G.; Steer, R.A. An inventory for measuring clinical anxiety: Psychometric properties. J. Consult. Clin. Psychol. 1988, 56, 893. [Google Scholar] [CrossRef]
- Carver, C.S.; White, T.L. Behavioral inhibition, behavioral activation, and affective responses to impending reward and punishment: The BIS/BAS scales. J. Personal. Soc. Psychol. 1994, 67, 319. [Google Scholar] [CrossRef]
- Conners, C.K.; Wells, K.C.; Parker, J.D.A.; Sitarenios, G.; Diamond, J.M.; Powell, J.W. A new self-report scale for assessment of adolescent psychopathology: Factor structure, reliability, validity, and diagnostic sensitivity. J. Abnorm. Child. Psychol. 1997, 25, 487–497. [Google Scholar] [CrossRef] [PubMed]
- Buss, A.H.; Perry, M. The aggression questionnaire. J. Personal. Soc. Psychol. 1992, 63, 452. [Google Scholar] [CrossRef]
- Chon, K.K.; Hahn, D.W.; Lee, C.H.; Spielberger, C. Korean adaptation of the state-trait anger expression inventory: Anger and blood pressure. Korean J. Health Psychol. 1997, 2, 60–78. [Google Scholar]
- Jaalouk, D.; Boumosleh, J. Is Smartphone Addiction Associated with a Younger Age at First Use in University Students? Glob. J. Health Sci. 2018, 10, 134. [Google Scholar] [CrossRef]
- Sklar, A. Fonctions de répartition à n dimensions et leurs marges. Publ. Inst. Statist. Univ. 1959, 8, 229–231. [Google Scholar]
- Song, P.X.-K. Multivariate Dispersion Models Generated From Gaussian Copula. Scand. J. Stat. 2000, 27, 305–320. [Google Scholar] [CrossRef]
- Demarta, S.; McNeil, A.J. The t Copula and Related Copulas. Int. Stat. Rev. 2007, 73, 111–129. [Google Scholar] [CrossRef]
- Montgomery, D.C.; Peck, E.A.; Vining, G.G. Introduction to Linear Regression Analysis, 5th ed.; Wiley: Hoboken, NJ, USA, 2012. [Google Scholar]
- Faraway, J.J. Extending the Linear Model with R: Generalized Linear, Mixed Effects and Nonparametric Regression Models, 2nd ed.; Chapman & Hall/CRC: New York, NY, USA, 2016. [Google Scholar]
- Delignette-Muller, M.-L.; Dutang, C. fitdistrplus: An R Package for Fitting Distributions. J. Stat. Softw. 2015, 64, 15459. [Google Scholar] [CrossRef]
- Schepsmeier, U.; Stoeber, J.; Brechmann, E.C.; Graeler, B.; Nagler, T.; Erhardt, T. VineCopula: Statistical Inference of Vine Copulas. Available online: https://CRAN.R-project.org/package=VineCopula (accessed on 26 November 2019).
- Okhrin, O.; Trimborn, S.; Waltz, M. GofCopula: Goodness-of-Fit Tests for Copulae. Available online: https://papers.ssrn.com/sol3/papers.cfm?abstract_id=3560825 (accessed on 14 June 2020).
- Bozdogan, H. Model selection and Akaike’s Information Criterion (AIC): The general theory and its analytical extensions. Psychometrika 1987, 52, 345–370. [Google Scholar] [CrossRef]
- Lee, J.; Sung, M.-J.; Song, S.-H.; Lee, Y.-M.; Lee, J.-J.; Cho, S.-M.; Park, M.-K.; Shin, Y.M. Psychological Factors Associated With Smartphone Addiction in South Korean Adolescents. J. Early Adolesc. 2016, 38, 288–302. [Google Scholar] [CrossRef]
- Razieh, J.; Ali, G.; Zaman, A.; Narjesskhatoon, S. The relationship between Internet addiction and anxiety in the universities students. Interdiscip. J. Contemp. Res. Bus. 2012, 4, 942–949. [Google Scholar]
- Park, S.M.; Park, Y.A.; Lee, H.W.; Jung, H.-Y.; Lee, J.-Y.; Choi, J.-S. The effects of behavioral inhibition/approach system as predictors of Internet addiction in adolescents. Pers. Individ. Differ. 2013, 54, 7–11. [Google Scholar] [CrossRef]
- Li, W.; Zhang, W.; Xiao, L.; Nie, J. The association of Internet addiction symptoms with impulsiveness, loneliness, novelty seeking and behavioral inhibition system among adults with attention-deficit/hyperactivity disorder (ADHD). Psychiatry Res. Neuroimaging 2016, 243, 357–364. [Google Scholar] [CrossRef] [PubMed]
- Ko, C.-H.; Yen, J.-Y.; Liu, S.-C.; Huang, C.-F.; Yen, C.-F. The Associations between Aggressive Behaviors and Internet Addiction and Online Activities in Adolescents. J. Adolesc. Heal. 2009, 44, 598–605. [Google Scholar] [CrossRef]
- Kim, Y.; Jeong, J.-E.; Cho, H.; Jung, D.-J.; Kwak, M.; Rho, M.J.; Yu, H.; Kim, D.-J.; Choi, I.Y. Personality Factors Predicting Smartphone Addiction Predisposition: Behavioral Inhibition and Activation Systems, Impulsivity, and Self-Control. PLoS ONE 2016, 11, e0159788. [Google Scholar] [CrossRef]
- Yen, J.-Y.; Ko, C.-H.; Yen, C.-F.; Wu, H.-Y.; Yang, M.-J. The Comorbid Psychiatric Symptoms of Internet Addiction: Attention Deficit and Hyperactivity Disorder (ADHD), Depression, Social Phobia, and Hostility. J. Adolesc. Health 2007, 41, 93–98. [Google Scholar] [CrossRef]
- Yen, J.-Y.; Yen, C.-F.; Chen, C.-S.; Tang, T.-C.; Ko, C.-H. The Association between Adult ADHD Symptoms and Internet Addiction among College Students: The Gender Difference. CyberPsychol. Behav. 2009, 12, 187–191. [Google Scholar] [CrossRef]
- Jeong, B.; Lee, J.Y.; Kim, B.M.; Park, E.; Kwon, J.-G.; Kim, D.-J.; Lee, Y.; Choi, J.-S.; Lee, D. Associations of personality and clinical characteristics with excessive Internet and smartphone use in adolescents: A structural equation modeling approach. Addict. Behav. 2020, 110, 106485. [Google Scholar] [CrossRef]
- Ha, J.H.; Kim, S.Y.; Bae, S.C.; Bae, S.; Kim, H.; Sim, M.; Lyoo, I.K.; Cho, S.C. Depression and Internet Addiction in Adolescents. Psychopathology 2007, 40, 424–430. [Google Scholar] [CrossRef]
- Ceyhan, A.A.; Ceyhan, E. Loneliness, Depression, and Computer Self-Efficacy as Predictors of Problematic Internet Use. CyberPsychol. Behav. 2008, 11, 699–701. [Google Scholar] [CrossRef]
- Young, K.S.; Rogers, R.C. The Relationship between Depression and Internet Addiction. CyberPsychol. Behav. 1998, 1, 25–28. [Google Scholar] [CrossRef]
- Lee, S.-Y.; Lee, D.; Nam, C.R.; Kim, D.Y.; Park, S.; Kwon, J.-G.; Kweon, Y.-S.; Lee, Y.; Kim, D.J.; Choi, J.-S. Distinct patterns of Internet and smartphone-related problems among adolescents by gender: Latent class analysis. J. Behav. Addict. 2018, 7, 454–465. [Google Scholar] [CrossRef] [PubMed]
- Choi, S.-W.; Mok, J.Y.; Kim, D.-J.; Choi, J.-S.; Lee, J.-W.; Ahn, H.-J.; Choi, E.-J.; Song, W.-Y. Latent class analysis on internet and smartphone addiction in college students. Neuropsychiatr. Dis. Treat. 2014, 10, 817–828. [Google Scholar] [CrossRef] [PubMed]
- Bianchi, A.; Phillips, J. Psychological Predictors of Problem Mobile Phone Use. CyberPsychol. Behav. 2005, 8, 39–51. [Google Scholar] [CrossRef] [PubMed]
- Joiner, R.; Gavin, J.; Brosnan, M.; Cromby, J.; Gregory, H.; Guiller, J.; Maras, P.; Moon, A. Gender, Internet Experience, Internet Identification, and Internet Anxiety: A Ten-Year Followup. Cyberpsychol. Behav. Soc. Netw. 2012, 15, 370–372. [Google Scholar] [CrossRef]
- Xin, M.; Xing, J.; Pengfei, W.; Houru, L.; Mengcheng, W.; Zeng, H. Online activities, prevalence of Internet addiction and risk factors related to family and school among adolescents in China. Addict. Behav. Rep. 2017, 7, 14–18. [Google Scholar] [CrossRef]


| Variable | Mean | SD | Correlations | |||||||
|---|---|---|---|---|---|---|---|---|---|---|
| Y_IAT | SAS | BDI | BAI | BIS | CASS | AQ | STAXI_E | |||
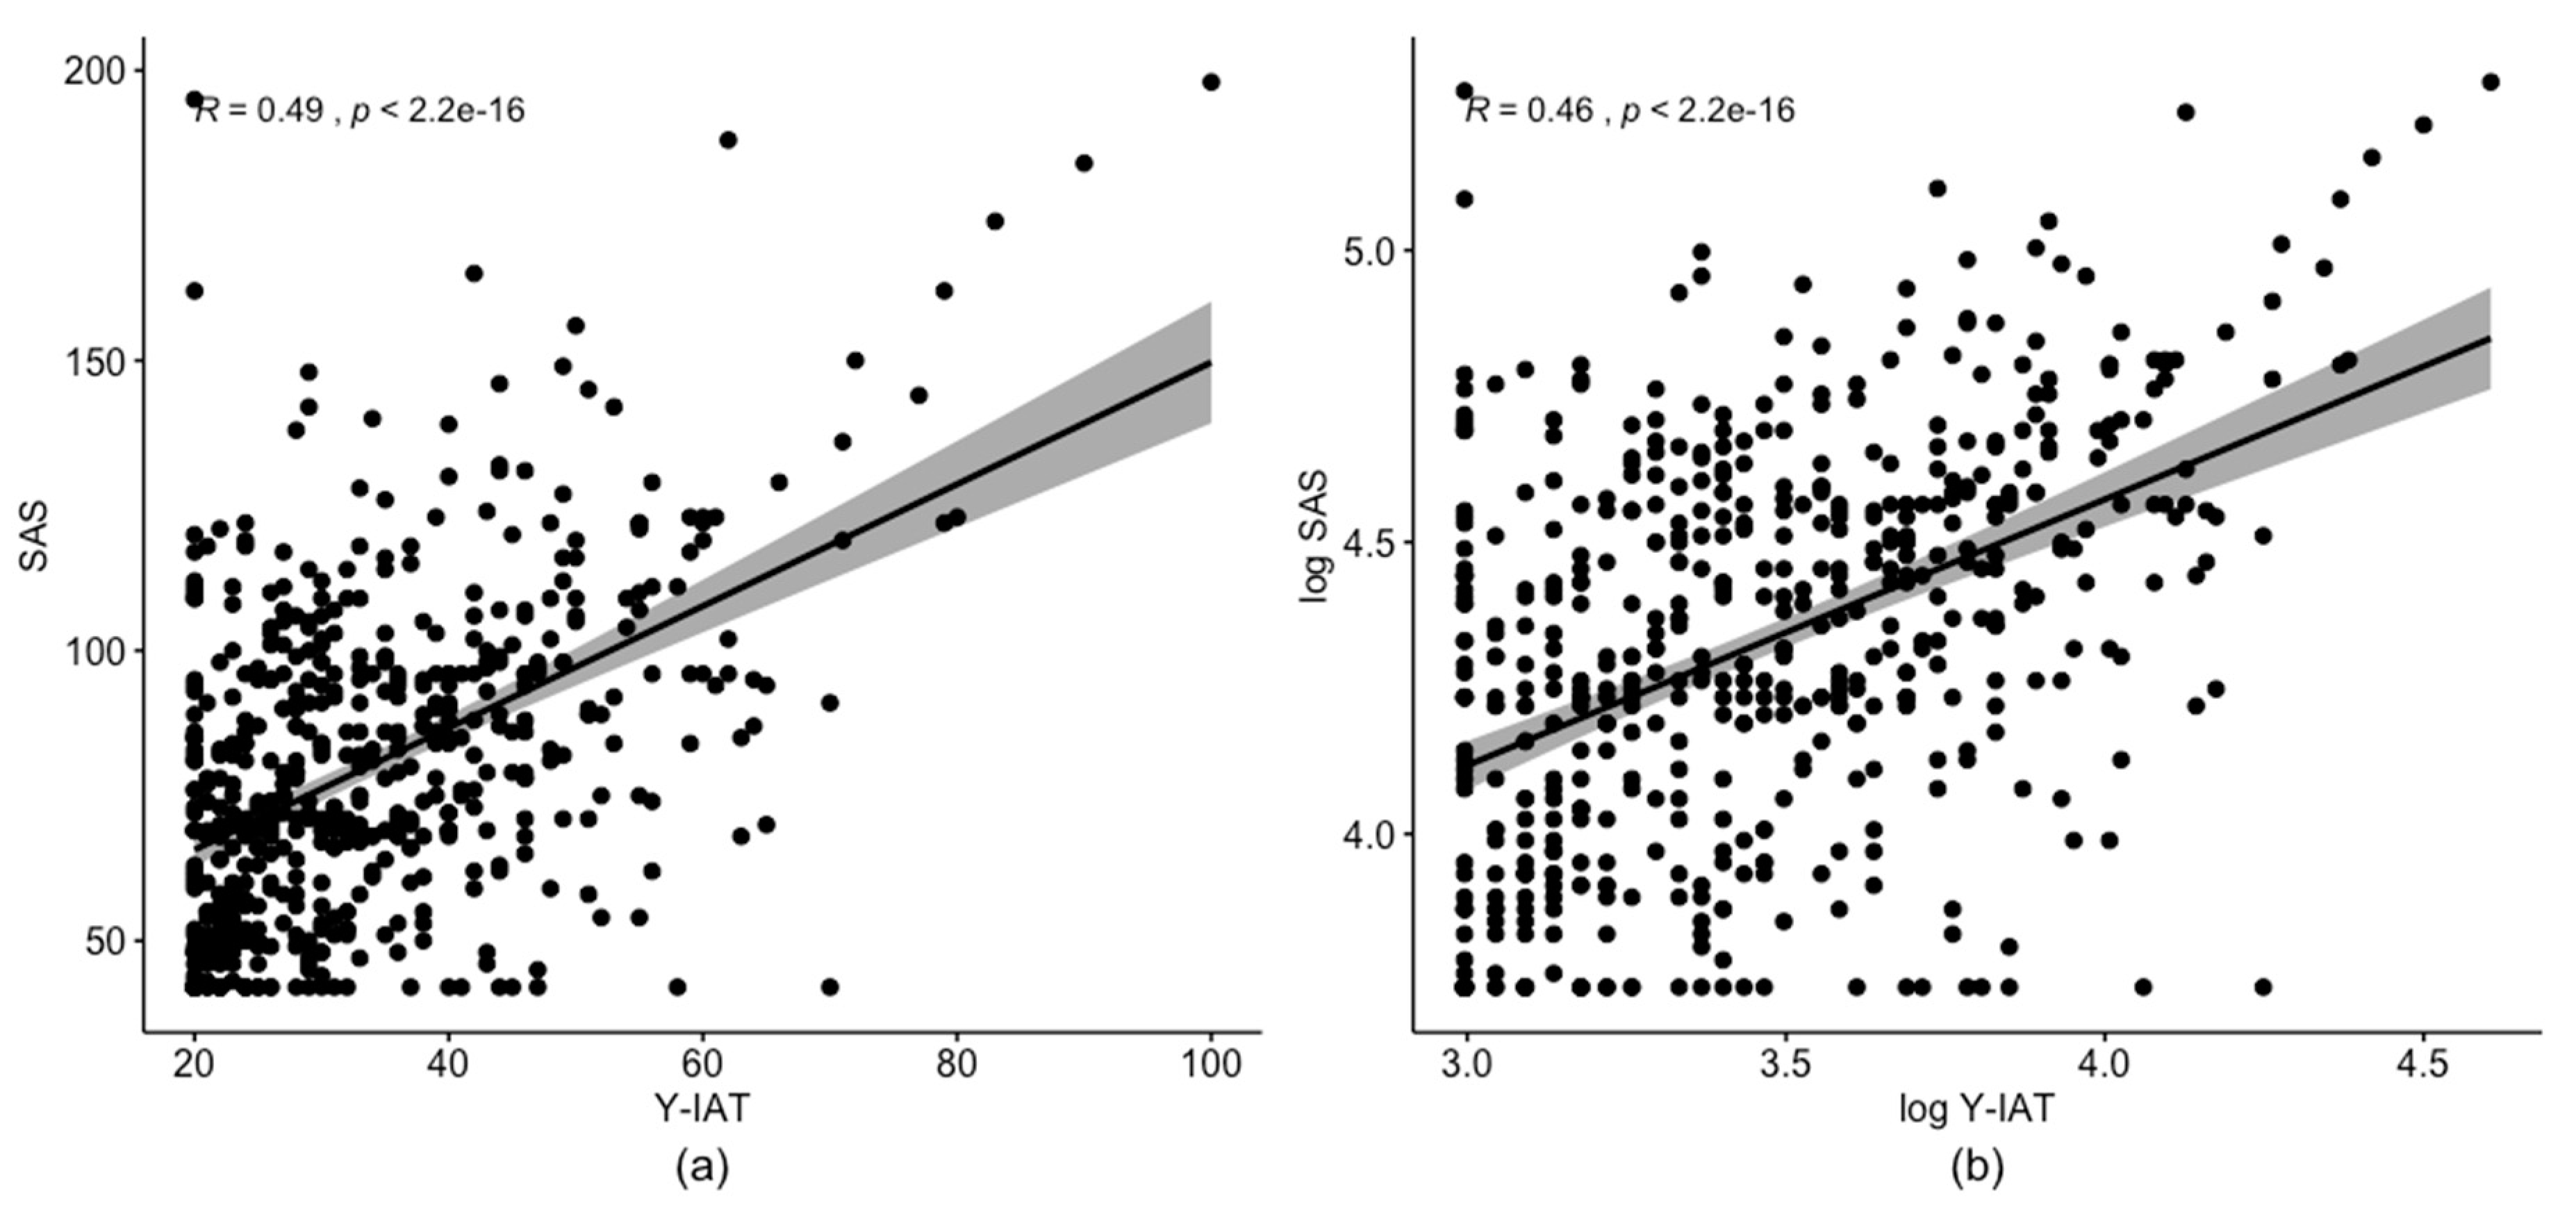
| Y_IAT | 33.88 | 13.05 | 1 | 0.49 | 0.23 | 0.44 | 0.32 | 0.42 | 0.4 | 0.23 |
| SAS | 80.25 | 27.94 | 1 | 0.39 | 0.48 | 0.39 | 0.39 | 0.49 | 0.26 | |
| BDI | 7.46 | 7.82 | 1 | 0.65 | 0.31 | 0.52 | 0.5 | 0.33 | ||
| BAI | 6.46 | 8.56 | 1 | 0.3 | 0.55 | 0.52 | 0.3 | |||
| BIS | 63.55 | 8.34 | 1 | 0.44 | 0.33 | 0.14 | ||||
| CASS | 17.91 | 12.59 | 1 | 0.6 | 0.44 | |||||
| AQ | 63.42 | 20.06 | 1 | 0.53 | ||||||
| STAXI_E | 53.28 | 11.39 | 1 | |||||||
| Parameters | Estimate | SE | AIC | BIC | |
|---|---|---|---|---|---|
| Gamma | shape | 8.073 | 0.488 | 4063.73 | 4072.26 |
| rate | 0.237 | 0.015 | |||
| Log-normal | mean | 3.464 | 0.015 | 4023.95 | 4032.48 |
| standard deviation | 0.346 | 0.011 | |||
| Weibull | shape | 2.700 | 0.083 | 4168.22 | 4177.15 |
| scale | 38.262 | 0.658 | |||
| Parameters | Estimate | SE | AIC | BIC | |
|---|---|---|---|---|---|
| Gamma | shape | 8.073 | 0.488 | 4063.732 | 4072.262 |
| rate | 0.237 | 0.015 | |||
| Log-normal | mean | 3.464 | 0.015 | 4023.95 | 4032.481 |
| sd | 0.346 | 0.011 | |||
| Weibull | shape | 2.70 | 0.083 | 4168.623 | 4177.154 |
| scale | 38.262 | 0.658 | |||
| Linear Regression | GLM | Copula | |||||||
|---|---|---|---|---|---|---|---|---|---|
| IAT | SAS | AIC | IAT | SAS | AIC | IAT | SAS | Copula | AIC |
| Norm. | Norm. | 8605.3 | Log. | Log. | 8587.1 | Log. | Gam. | Norm. | 8363.1 |
| Log. | Log. | 8421.8 | Gam. | Gam. | 8453.2 | Log. | Log. | t | 8362.2 |
| Norm. | Log. | 8572.6 | Log. | Gam. | 8567.4 | Log. | Gam. | t | 8348.5 |
| Log. | Norm. | 8454.5 | Gam. | Log. | 8472.9 | Gam. | Log. | t | 8373.4 |
| IAT | Estimate | SE | p-Value | SAS | Estimate | SE | p-Value |
|---|---|---|---|---|---|---|---|
| Intercept | 69.1356 | 72.4595 | 0.34 | Intercept | 114 | 71.86 | 0.11267 |
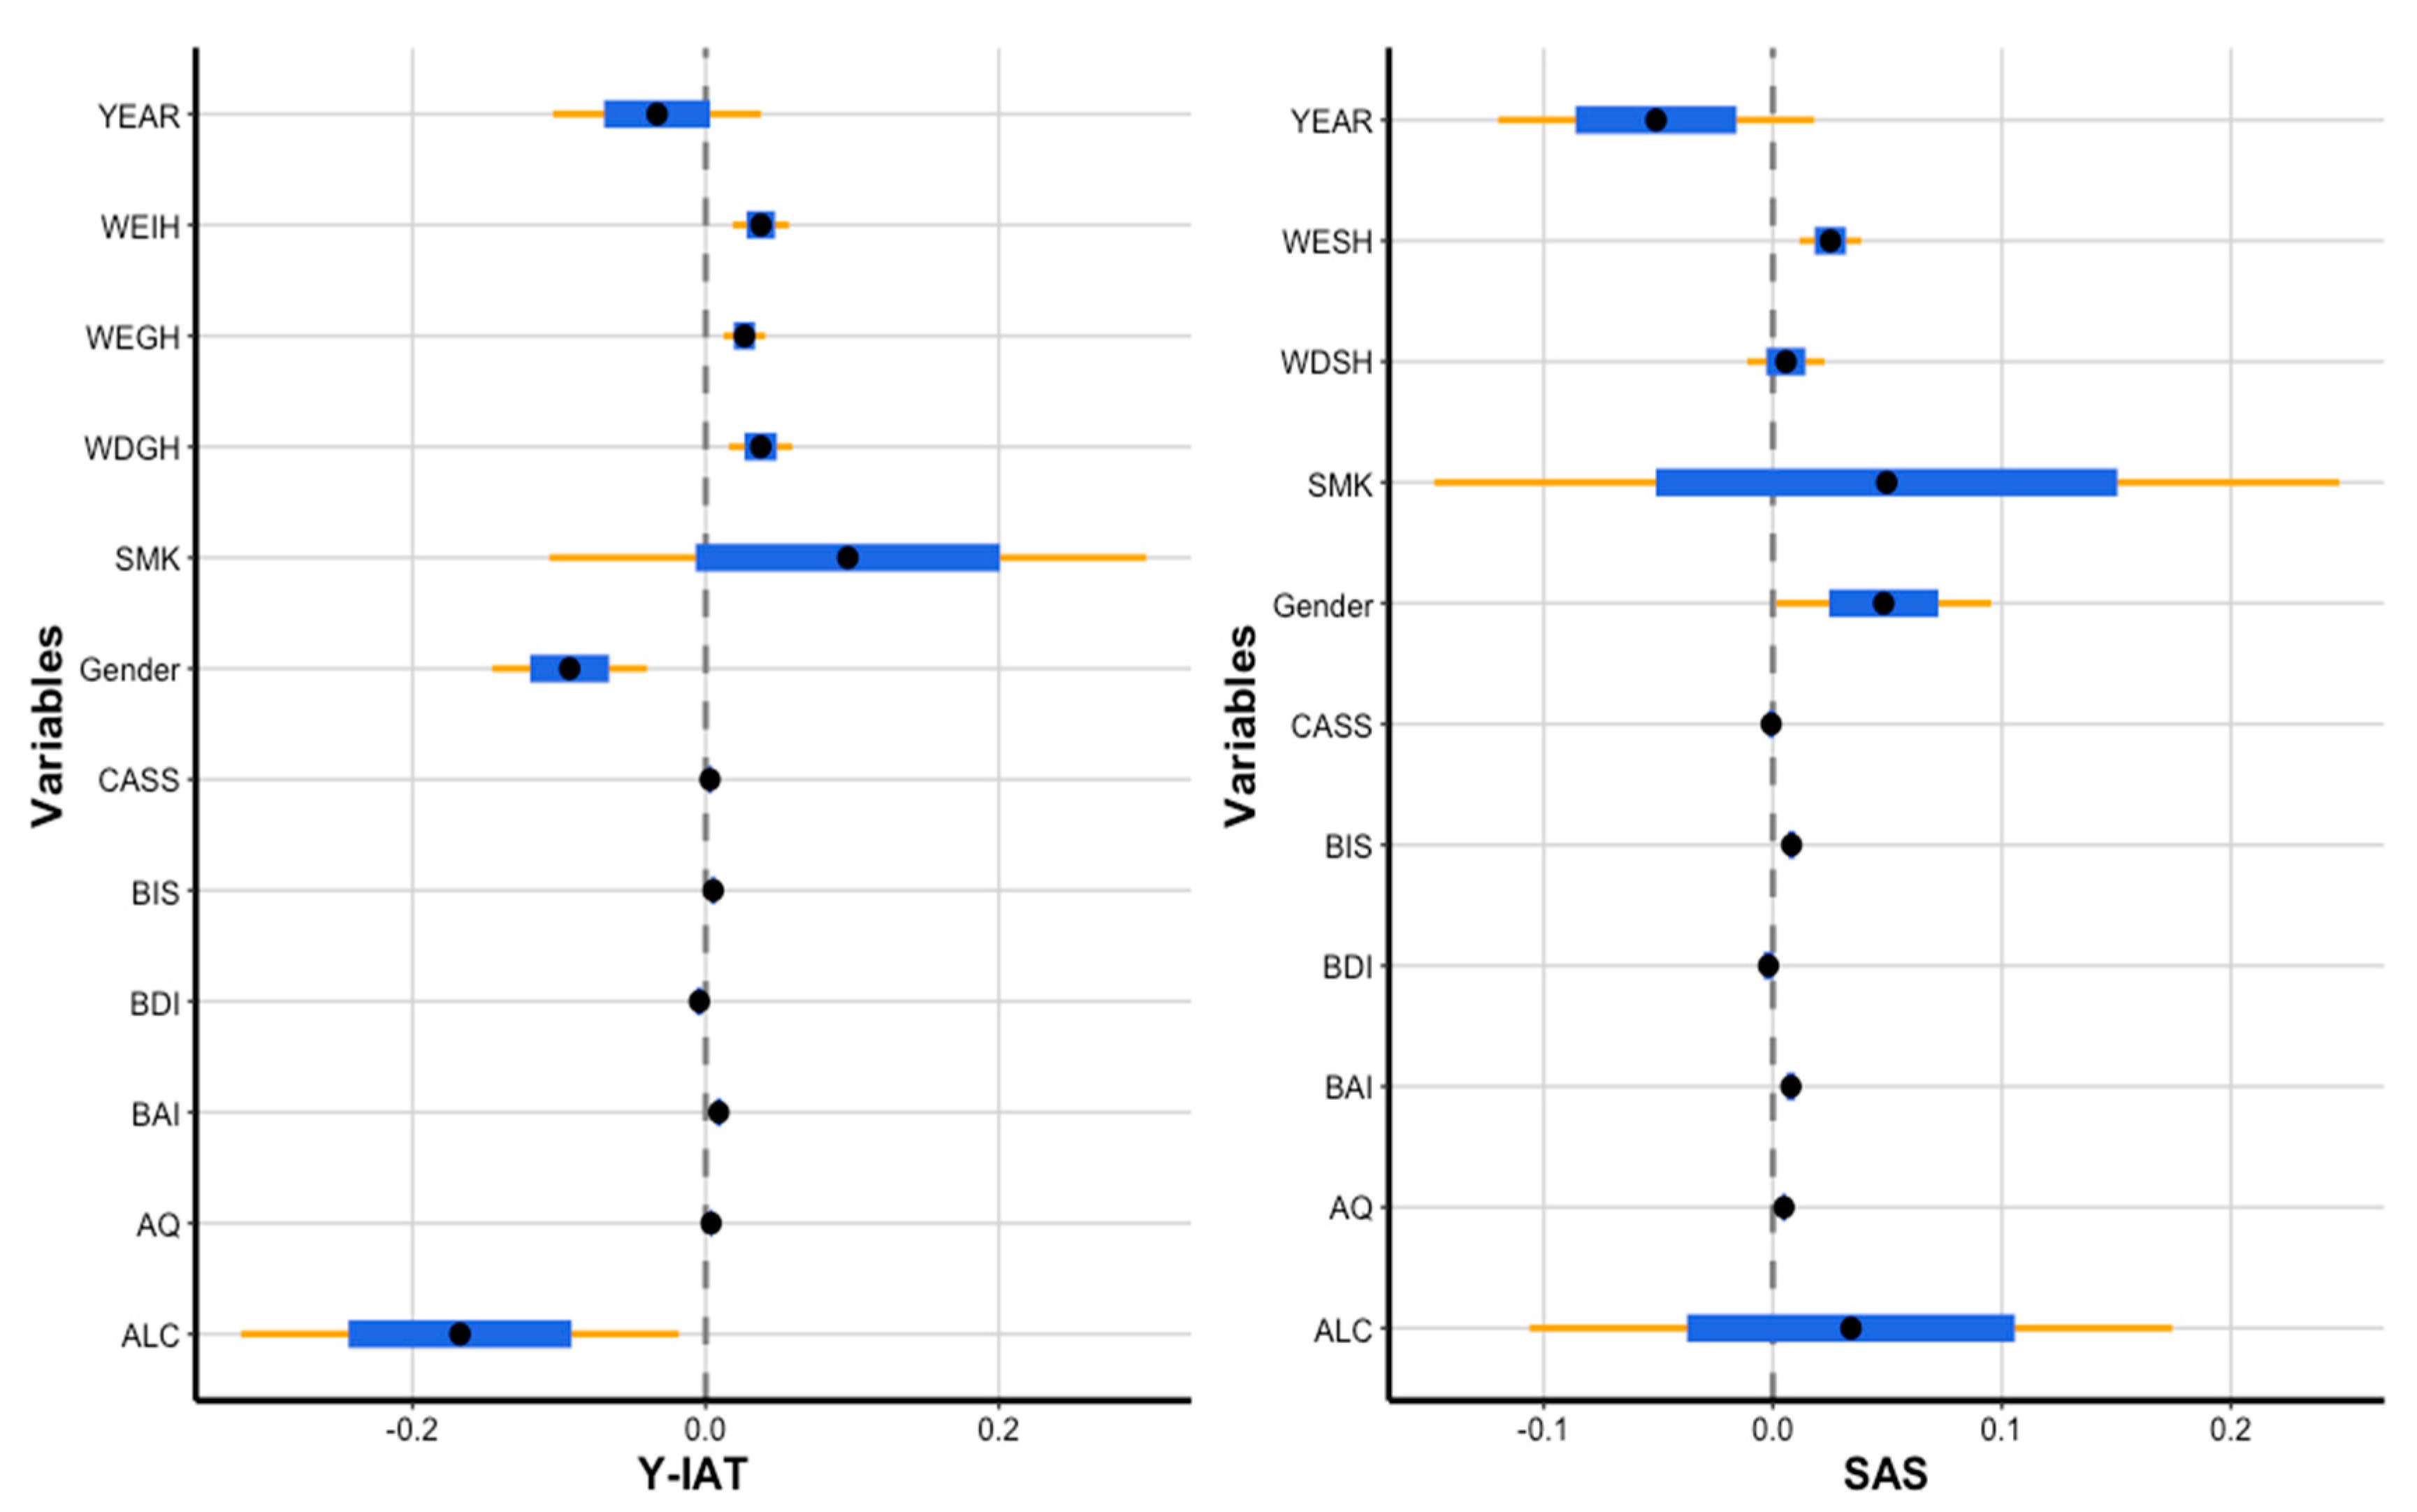
| GENDER | −0.0929 | 0.027 | 0.0006 | GENDER | 0.0484 | 0.0239 | 0.0428 |
| BDI | −0.0044 | 0.0021 | 0.0363 | BDI | −0.0019 | 0.0021 | 0.3732 |
| BAI | 0.0089 | 0.0019 | 0.0000 | BAI | 0.0079 | 0.0019 | 0.0000 |
| BIS | 0.0052 | 0.0016 | 0.0009 | BIS | 0.0082 | 0.0015 | 0.0000 |
| CASS | 0.0029 | 0.0013 | 0.0307 | CASS | −0.0007 | 0.0013 | 0.6154 |
| AQ | 0.0037 | 0.0008 | 0.0000 | AQ | 0.0049 | 0.0008 | 0.0000 |
| WDGH | 0.0375 | 0.0111 | 0.0008 | WDSH | 0.0057 | 0.0086 | 0.5077 |
| WEGH | 0.0264 | 0.0073 | 0.0003 | WESH | 0.0251 | 0.0069 | 0.0003 |
| WDIH | 0.0376 | 0.0098 | 0.0001 | YEAR | −0.051 | 0.0352 | 0.1478 |
| YEAR | −0.0332 | 0.0362 | 0.3595 | ALC | 0.0341 | 0.0716 | 0.6343 |
| ALC | −0.1677 | 0.0762 | 0.0277 | SMK | 0.0497 | 0.1008 | 0.622 |
| SMK | 0.0969 | 0.1039 | 0.3508 | ||||
| AIC | 8348.471 | ||||||
| Corr. | 0.364 (0.288, 0.429) | ||||||
© 2020 by the authors. Licensee MDPI, Basel, Switzerland. This article is an open access article distributed under the terms and conditions of the Creative Commons Attribution (CC BY) license (http://creativecommons.org/licenses/by/4.0/).
Share and Cite
Lee, M.; Chung, S.J.; Lee, Y.; Park, S.; Kwon, J.-G.; Kim, D.J.; Lee, D.; Choi, J.-S. Investigation of Correlated Internet and Smartphone Addiction in Adolescents: Copula Regression Analysis. Int. J. Environ. Res. Public Health 2020, 17, 5806. https://doi.org/10.3390/ijerph17165806
Lee M, Chung SJ, Lee Y, Park S, Kwon J-G, Kim DJ, Lee D, Choi J-S. Investigation of Correlated Internet and Smartphone Addiction in Adolescents: Copula Regression Analysis. International Journal of Environmental Research and Public Health. 2020; 17(16):5806. https://doi.org/10.3390/ijerph17165806
Chicago/Turabian StyleLee, Minji, Sun Ju Chung, Youngjo Lee, Sera Park, Jun-Gun Kwon, Dai Jin Kim, Donghwan Lee, and Jung-Seok Choi. 2020. "Investigation of Correlated Internet and Smartphone Addiction in Adolescents: Copula Regression Analysis" International Journal of Environmental Research and Public Health 17, no. 16: 5806. https://doi.org/10.3390/ijerph17165806
APA StyleLee, M., Chung, S. J., Lee, Y., Park, S., Kwon, J.-G., Kim, D. J., Lee, D., & Choi, J.-S. (2020). Investigation of Correlated Internet and Smartphone Addiction in Adolescents: Copula Regression Analysis. International Journal of Environmental Research and Public Health, 17(16), 5806. https://doi.org/10.3390/ijerph17165806