Is Achieving the Guidelines of Four Forms of Physical Activity Associated with Less Self-Reported Health Complaints? Cross-Sectional Study of Undergraduates at the University of Turku, Finland


Abstract
1. Introduction
- Describe the sample’s characteristics and achievement of guidelines of four forms of PA;
- Assess the frequency of 21 HCs during the last 12 months, and the level of HCs by gender; and,
- Assess the relationships between PA guideline achievement and students’ HCs before (bivariate relationships) and after (multivariate relationships) controlling for potential demographic and health behavior confounders.
2. Materials and Methods
2.1. Sample, Ethics and Procedures
2.2. Questionnaire
PA Variables
2.3. Statistical Analysis
3. Results
3.1. General and PA Characteristics of the Sample
3.2. Factor Analysis of 21 Self-Reported Health Complaints
3.3. Prevalence and Number of Health Complaints in Last 12 Months
3.4. Self-Reported Health Complaints Mean Score by Gender
3.5. Bivariate Relationships Between Achievement of Physical activity guidelines and Health Complaints
3.6. Achievement of Physical Activity Guidelines as Independent Factors Associated with Self-Reported Health Complaints
4. Discussion
5. Conclusions
Author Contributions
Funding
Acknowledgments
Conflicts of Interest
References
- El Ansari, W.; Suominen, S.; Berg-Beckhoff, G. Is healthier nutrition behaviour associated with better self-reported health and less health complaints? Evidence from Turku, Finland. Nutrients 2015, 7, 8478–8490. [Google Scholar] [CrossRef] [PubMed]
- El Ansari, W.; Moseley, L.; Mills, C.; Raybould, L. Health complaints in university students in England. In Exercise, Sports and Health; Schulz, H., Wright, P.R., Hauser, T., Eds.; Chemnitz University of Technology: Chemnitz, Germany, 2011; pp. 9–22. Available online: http://eprints.glos.ac.uk/2643 (accessed on 9 December 2015).
- Gulewitsch, M.D.; Enck, P.; Hautzinger, M.; Schlarb, A.A. Irritable bowel syndrome symptoms among German students: Prevalence, characteristics, and associations to somatic complaints, sleep, quality of life, and childhood abdominal pain. Eur. J. Gastroenterol. Hepatol. 2011, 23, 311–316. [Google Scholar] [CrossRef] [PubMed]
- Fischer, S.; Gaab, J.; Ehlert, U.; Nater, U.M. Prevalence, overlap, and predictors of functional somatic syndromes in a student sample. Int. J. Behav. Med. 2013, 20, 184–193. [Google Scholar] [CrossRef] [PubMed]
- Center, C.; Davis, M.; Detre, T.; Ford, D.E.; Hansbrough, W.; Hendin, H.; Laszlo, J.; Litts, D.A.; Mann, J.; Mansky, P.A.; et al. Confronting depression and suicide in physicians. JAMA 2003, 298, 3161–3166. [Google Scholar] [CrossRef] [PubMed]
- Givens, J.L.; Tjia, J. Depressed medical students’ use of mental health services and barriers to use. Acad. Med. 2002, 77, 918–921. [Google Scholar] [CrossRef]
- Roberts, L.W.; Hardee, J.T.; Franchini, G.; Stidley, C.A.; Siegler, M. Medical students as patients: A pilot study of their health care needs, practices, and concerns. Acad. Med. 1996, 71, 1225–1232. [Google Scholar] [CrossRef]
- Dahan, H.; Bedos, C. A typology of dental students according to their experience of stress: A qualitative study. J. Dent. Educ. 2010, 74, 95–103. [Google Scholar] [CrossRef]
- Coskun Benlidayi, I.; Al-Bayati, Z.; Guzel, R.; Sarpel, T. Neither got a good bill of musculoskeletal health: A comparative study among medical and dental students. Acta Clin. Belg. 2019, 74, 110–114. [Google Scholar] [CrossRef] [PubMed]
- Movahhed, T.; Ajami, B.; Soltani, M.; Shakeri, M.T.; Dehghani, M. Musculoskeletal pain reports among Mashhad dental students. Iran. Pak. J. Biol. Sci. 2013, 16, 80–85. [Google Scholar] [CrossRef]
- Khan, S.A.; Chew, K.Y. Effect of working characteristics and taught ergonomics on the prevalence of musculoskeletal disorders amongst dental students. BMC Musculoskelet. Disord. 2013, 14, 118. [Google Scholar] [CrossRef]
- Bruls, V.E.J.; Jansen, N.W.H.; van Kuijk, S.M.J.; Kant, I.; Bastiaenen, C.H.G. The course of complaints of arm, neck and/or shoulder: A cohort study in a university population participating in work or study. BMC Musculoskelet. Disord. 2018, 19, 208. [Google Scholar] [CrossRef] [PubMed]
- Stock, C.; Mikolajczyk, R.T.; Bilir, N.; Petkeviciene, J.; Naydenova, V.; Dudziak, U.; Marin-Fernandez, B.; El Ansari, W. Gender differences in students’ health complaints: A survey in seven countries. J. Public Health 2008, 16, 353–360. [Google Scholar] [CrossRef]
- El Ansari, W.; Oskrochi, R.; Stock, C. Symptoms and health complaints and their association with perceived stress: Students from seven universities in England, Wales and Northern Ireland. J. Public Health 2013, 21, 413–425. [Google Scholar] [CrossRef]
- Chu, J.J.; Khan, M.H.; Jahn, H.J.; Kraemer, A. Comparison of subjective health complaints between Chinese and German university students: A cross-sectional study. Int. J. Environ. Res. Public Health 2015, 12, 15794–15806. [Google Scholar] [CrossRef] [PubMed]
- Bartlett, J.; Fowler, K. Beyond the curriculum: A cross-sectional study of medical student psychological distress, and health care needs, practices and barriers. Soc. Psychiatry Psychiatr. Epidemiol. 2019. [Google Scholar] [CrossRef]
- Goebert, D.; Thompson, D.; Takeshita, J.; Beach, C.; Bryson, P.; Eph-grave, K.; Kent, A.; Kunkel, M.; Schechter, J.; Tate, J. Depressive symptoms in medical students and residents: A multischool study. Acad. Med. 2009, 84, 236–241. [Google Scholar] [CrossRef]
- Mata, D.A.; Ramos, M.A.; Bansal, N.; Khan, R.; Guille, C.; Di Ange-lantonio, E.; Srijan, S. Prevalence of depression and depressive symptoms among resident physicians: A systematic review and meta-analysis. JAMA 2015, 314, 2373–2383. [Google Scholar] [CrossRef]
- Hou, H.; Feng, X.; Li, Y.; Meng, Z.; Guo, D.; Wang, F.; Guo, Z.; Zheng, Y.; Peng, Z.; Zhang, W.; et al. Suboptimal health status and psychological symptoms among Chinese college students: A perspective of predictive, preventive and personalised health. EPMA J. 2018, 9, 367–377. [Google Scholar] [CrossRef]
- Melese, B.; Bayu, B.; Wondwossen, F.; Tilahun, K.; Lema, S.; Ayehu, M.; Eskindi. Prevalence of mental distress and associated factors among Hawassa University medical students, Southern Ethiopia: A cross-sectional study. BMC Res. Notes. 2016, 9, 485. [Google Scholar] [CrossRef]
- Gaspersz, R.; Frings-Dresen, M.H.; Sluiter, J.K. Prevalence of common mental disorders among Dutch medical students and related use and need of mental health care: A cross-sectional study. Int. J. Adolesc. Med. Health. 2012, 24, 169–172. [Google Scholar] [CrossRef]
- Deliens, T.; Deforche, B.; De Bourdeaudhuij, I.; Clarys, P. Determinants of physical activity and sedentary behaviour in university students: A qualitative study using focus group discussions. BMC Public Health 2015, 15, 201. [Google Scholar] [CrossRef] [PubMed]
- Martins Mdo, C.; Ricarte, I.F.; Rocha, C.H.; Maia, R.B.; da Silva, V.B.; Veras, A.B.; Filho, M.D.d. Blood pressure, excess weight and level of physical activity in students of a public university. Arq. Bras. Cardiol. 2010, 95, 192–199. [Google Scholar] [PubMed]
- Kgokong, D.; Parker, R. Physical activity in physiotherapy students: Levels of physical activity and perceived benefits and barriers to exercise. S. Afr. J. Physiother. 2020, 76, 1399. [Google Scholar] [CrossRef] [PubMed]
- Budzynski-Seymour, E.; Conway, R.; Wade, M.; Lucas, A.; Jones, M.; Mann, S.; Steele, J. Physical activity, mental and personal well-being, social isolation, and perceptions of academic attainment and employability in university students: The Scottish and British active students surveys. J. Phys. Act. Health 2020, 1–11. [Google Scholar] [CrossRef]
- Cup, E.H.; Pieterse, A.J.; Jessica, M.; Munneke, M.; Van Engelen, B.G.; Hendricks, H.T.; van der Wilt, G.J.; Oostendorp, R.A. Exercise therapy and other types of physical therapy for patients with neuromuscular diseases: A systematic review. Arch. Phys. Med. Rehab. 2007, 88, 1452–1464. [Google Scholar] [CrossRef]
- DeTurk, W.E.; Scott, L.B. Physical therapists as providers of care: Exercise prescriptions and resultant outcomes in cardiac and pulmonary rehabilitation programs in New York State. Cardiopulm. Phys. Ther. J. 2008, 19, 35. [Google Scholar] [CrossRef]
- Higgs, J.; Refshauge, K.; Ellis, E. Portrait of the physiotherapy profession. J. Interprof. Care 2001, 15, 79–89. [Google Scholar]
- Meisingset, I.; Stensdotter, A.K.; Woodhouse, A.; Vasseljen, O. Neck motion, motor control, pain and disability: A longitudinal study of associations in neck pain patients in physiotherapy treatment. Man. Ther. 2016, 22, 94–100. [Google Scholar] [CrossRef]
- Dehnavi, Z.M.; Jafarnejad, F.; Kamali, Z. The effect of aerobic exercise on primary dysmenorrhea: A clinical trial study. J. Educ. Health Promot. 2018, 7, 3. [Google Scholar] [CrossRef]
- Brandfonbrener, A.G. History of playing-related pain in 330 university freshman music students. Med. Probl. Perform. Art. 2009, 24, 30. [Google Scholar]
- Rosset-Llobet, J.; Rosinés-Cubells, D.; Saló-Orfila, J.M. Identification of risk factors for musicians in Catalonia. Med. Probl. Perform. Art. 2000, 15, 167–174. (In Spain) [Google Scholar]
- Baadjou, V.A.E.; Roussel, N.A.; Verbunt, J.; Smeets, R.J.E.M.; de Bie, R.A. Systematic review: Risk factors for musculoskeletal disorders in musicians. Occup. Med. 2016, 66, 614–622. [Google Scholar] [CrossRef] [PubMed]
- Naeem, S.S.; Siddiqui, E.U.; Kazi, A.N.; Memon, A.A.; Khan, S.T.; Ahmed, B. Prevalence and factors associated with irritable bowel syndrome among medical students of Karachi, Pakistan: a cross-sectional study. BMC Res. Notes 2012, 5, 255. [Google Scholar] [CrossRef] [PubMed]
- Loprinzi, P.D.; Wade, B. Exercise and cardiorespiratory fitness on subjective memory complaints. Psychol. Health Med. 2019, 24, 749–756. [Google Scholar] [CrossRef] [PubMed]
- Loprinzi, P.D.; Frith, E.; Edwards, M.K.; Sng, E.; Ashpole, N. The effects of exercise onmemory function among young to middle-aged adults: systematic review and recommendations for future research. Am. J. Health Promot. 2018, 32, 691–704. [Google Scholar] [CrossRef] [PubMed]
- Crush, E.A.; Frith, E.; Loprinzi, P.D. Experimental effects of acute exercise duration and exercise recovery on mood state. J. Affect. Disord. 2018, 229, 282–287. [Google Scholar] [CrossRef]
- Jaffery, A.; Edwards, M.K.; Loprinzi, P.D. Randomized control intervention evaluating the effects of acute exercise on depression and mood profile: solomon experimental design. Mayo Clin. Proc. 2017, 92, 480–481. [Google Scholar] [CrossRef]
- Small, M.; Bailey-Davis, L.; Morgan, N.; Maggs, J. Changes in eating and physical activity behaviors across seven semesters of college: Living on or off campus matters. Health Educ. Behav. 2013, 40, 435–441. [Google Scholar] [CrossRef]
- Kapinos, K.A.; Yakusheva, O. Environmental influences on young adult weight gain: evidence from a natural experiment. J. Adolesc. Health 2011, 48, 52–58. [Google Scholar] [CrossRef]
- Syväoja, H.J.; Kantomaa, M.T.; Ahonen, T.; Hakonen, H.; Kankaanpää, A.; Tammelin, T.H. Physical activity, sedentary behavior, and academic performance in Finnish children. Med. Sci. Sports Exerc. 2013, 45, 2098–2104. [Google Scholar] [CrossRef]
- Haapala, H.L.; Hirvensalo, M.H.; Laine, K.; Laakso, L.; Hakonen, H.; Lintunen, T.; Tammelin, T.H. Adolescents’ physical activity at recess and actions to promote a physically active school day in four Finnish schools. Health Educ. Res. 2014, 29, 840–852. [Google Scholar] [CrossRef]
- Jaakkola, T.; Kalaja, S.; Liukkonen, J.; Jutila, A.; Virtanen, P.; Watt, A. Relations among physical activity patterns, lifestyle activities, and fundamental movement skills for Finnish students in grade 7. Percept. Mot. Skills 2009, 108, 97–111. [Google Scholar] [CrossRef]
- Kestilä, L.; Mäki-Opas, T.; Kunst, A.E.; Borodulin, K.; Rahkonen, O.; Prättälä, R. Childhood adversities and socioeconomic position as predictors of leisure-time physical inactivity in early adulthood. J. Phys. Act. Health 2015, 12, 193–199. [Google Scholar] [CrossRef] [PubMed]
- Mikkola, I.; Jokelainen, J.J.; Timonen, M.J.; Härkönen, P.K.; Saastamoinen, E.; Laakso, M.A.; Peitso, A.J.; Juuti, A.; Keinänen-Kiukaanniemi, S.M.; Mäkinen, T.M. Physical activity and body composition changes during military service. Med. Sci. Sports Exerc. 2009, 41, 1735–1742. [Google Scholar] [CrossRef] [PubMed]
- Telama, R.; Yang, X.; Leskinen, E.; Kankaanpää, A.; Hirvensalo, M.; Tammelin, T.; Viikari, J.S.A.; Raitakari, O.T. Tracking of physical activity from early childhood through youth into adulthood. Med. Sci. Sports Exerc. 2014, 46, 955–962. [Google Scholar] [CrossRef]
- World Health Organization. Finland. Physical Activity Factsheet. Circa 2016. Available online: https://www.euro.who.int/__data/assets/pdf_file/0008/288107/FINLAND-Physical-Activity-Factsheet.pdf?ua=1 (accessed on 14 July 2020).
- Kuuppelomäki, M.; Utriainen, P. A 3 year follow-up study of health care students’ sense of coherence and related smoking, drinking and physical exercise factors. Int. J. Nurs. Stud. 2003, 40, 383–388. [Google Scholar] [CrossRef]
- El Ansari, W.; Suominen, S.; Draper, S. Correlates of achieving the guidelines of four forms of physical activity, and the relationship between guidelines achievement and academic performance: Undergraduate students in Finland. Cent. Eur. J. Public Health 2017, 25, 87–95. [Google Scholar] [CrossRef] [PubMed]
- El Ansari, W.; Stock, C. Is the health and wellbeing of university students associated with their academic performance? Cross sectional findings from the United Kingdom. Int. J. Environ. Res. Public Health 2010, 7, 509–527. [Google Scholar] [CrossRef] [PubMed]
- El Ansari, W.; Stock, C.; Mikolajczyk, R.T. Relationships between food consumption and living arrangements among university students in four European countries-a cross-sectional study. Nutr. J. 2012, 11, 28. [Google Scholar] [CrossRef]
- El Ansari, W.; Oskrochi, R.; Haghgoo, G. Are students’ symptoms and health complaints associated with perceived stress at university? Perspectives from the United Kingdom and Egypt. Int. J. Environ. Res. Public Health 2014, 11, 9981–10002. [Google Scholar] [CrossRef]
- El Ansari, W.; Stock, C. Relationship between attainment of recommended physical activity guidelines and academic achievement: Undergraduate students in Egypt. Glob. J. Health Sci. 2014, 6, 274–283. [Google Scholar] [CrossRef] [PubMed]
- El Ansari, W.; Vallentin-Holbech, L.; Stock, C. Predictors of illicit drug/s use among university students in Northern Ireland, Wales and England. Glob. J. Health Sci. 2014, 7, 18–29. [Google Scholar] [CrossRef] [PubMed]
- El Ansari, W.; Salam, A.; Suominen, S. Prevalence and socio-demographic, academic, health and lifestyle predictors of illicit drug/s use among university undergraduate students in Finland. Int. J. Environ. Res. Public Health 2020, 17, 5094. [Google Scholar] [CrossRef] [PubMed]
- El Ansari, W.; Stock, C.; Phillips, C.; Mabhala, A.; Stoate, M.; Adetunji, H.; Deeny, P.; John, J.; Davies, S.; Parke, S.; et al. Does the association between depressive symptomatology and physical activity depend on body image perception? A survey of students from seven universities in the UK. Int. J. Environ. Res. Public Health 2011, 8, 281–299. [Google Scholar] [CrossRef] [PubMed]
- El Ansari, W.; Khalil, K.; Stock, C. Symptoms and health complaints and their association with perceived stressors among students at nine Libyan universities. Int. J. Environ. Res. Public Health 2014, 11, 12088–12107. [Google Scholar] [CrossRef] [PubMed]
- El Ansari, W.; Khalil, K.A.; Ssewanyana, D.; Stock, C. Behavioral risk factor clusters among university students at nine universities in Libya. AIMS Public Health 2018, 5, 296–311. [Google Scholar] [CrossRef]
- El Ansari, W.; Adetunji, H.; Oskrochi, R. Food and mental health: Relationship between food and perceived stress and depressive symptoms among university students in the United Kingdom. Cent. Eur. J. Public Health 2014, 22, 90–97. [Google Scholar] [CrossRef]
- El Ansari, W.; Salam, A.; Suominen, S. Is alcohol consumption associated with poor perceived academic performance? Survey of undergraduates in Finland. Int. J. Environ. Res. Public Health 2020, 17, 1369. [Google Scholar] [CrossRef]
- Haskell, W.L.; Lee, I.M.; Pate, R.R.; Powell, K.E.; Blair, S.N.; Franklin, B.A.; Macera, C.A.; Heath, G.W.; Thompson, P.D.; Bauman, A. American heart association. physical activity and public health: Updated recommendation for adults from the american college of sports medicine and the american heart association. Circulation 2007, 116, 1081–1093. [Google Scholar] [CrossRef]
- Furr, S.R.; Westefeld, J.S.; McConnell, G.N.; Jenkins, J.M. Suicide and depression among college students: A decade later. Prof. Psychol.Res. Pr. 2001, 32, 97–100. [Google Scholar] [CrossRef]
- Lund, H.G.; Reider, B.D.; Whiting, A.B.; Prichard, J.R. Sleep patterns and predictors of disturbed sleep in a large population of college students. J. Adolesc. Health 2010, 46, 124–132. [Google Scholar] [CrossRef] [PubMed]
- Wald, A.; Muennig, P.A.; O’Connell, K.A.; Garber, C.E. Associations between healthy lifestyle behaviors and academic performance in U.S. undergraduates: A secondary analysis of the American College Health Association’s National College Health Assessment II. Am. J. Health Promot. 2014, 28, 298–305. [Google Scholar] [CrossRef] [PubMed]
- Werner, E.; Betz, H.H. Knowledge of physical activity and nutrition recommendations in college students. J. Am. Coll. Health. 2020, 1–7. [Google Scholar] [CrossRef]
- Abula, K.; Gröpel, P.; Chen, K.; Beckmann, J. Does knowledge of physical activity recommendations increase physical activity among Chinese college students? Empirical investigations based on the transtheoretical model. J. Sport Health Sci. 2018, 7, 77–82. [Google Scholar] [CrossRef]
- Iannotti, R.J.; Kogan, M.D.; Janssen, I.; Boyce, W.F. Patterns of adolescent physical activity, screen-based media use, and positive and negative health indicators in the U.S. and Canada. J. Adolesc. Health 2009, 44, 493–499. [Google Scholar] [CrossRef]
- Marques, A.; Calmeiro, L.; Loureiro, N.; Frasquilho, D.; de Matos, M.G. Health complaints among adolescents: Associations with more screen-based behaviours and less physical activity. J. Adolesc. 2015, 44, 150–157. [Google Scholar] [CrossRef]
- Gerber, M.; Pühse, U. Review article: Do exercise and fitness protect against stress-induced health complaints? A review of the literature. Scand. J. Public Health 2009, 37, 801–819. [Google Scholar] [CrossRef]
- Hills, A.P.; King, N.A.; Armstrong, T.P. The contribution of physical activity and sedentary behaviours to the growth and development of children and adolescents: Implications for overweight and obesity. Sports Med. 2007, 37, 533–545. [Google Scholar] [CrossRef]
- Strong, W.B.; Malina, R.M.; Blimkie, C.J.; Daniels, S.R.; Dishman, R.K.; Gutin, B.; Hergenroeder, A.C.; Must, A.; Nixon, P.A.; Pivarnik, J.M.; et al. Evidence based physical activity for school-age youth. J. Pediatr. 2005, 146, 732–737. [Google Scholar] [CrossRef]
- Dalton, E.D. Exercise-related coping beliefs predict physical activity levels in response to naturally occurring stress: A daily diary study of college students. J. Am. Coll. Health 2020, 1–9. [Google Scholar] [CrossRef]
- Lochbaum, M.R.; Lutz, R.S.; Sell, S.; Ready, A.; Carson, T. Perceived stress and health complaints: An examination of the moderating roles of personality and physical activity. Percept. Mot. Skills 2004, 99, 909–912. [Google Scholar] [CrossRef] [PubMed]
- Xu, Z.; Xu, Q.; Wang, Y.; Zhang, J.; Liu, J.; Xu, F. Association of sedentary behavior and depression among college students majoring in design. Int. J. Environ. Res. Public Health 2020, 17, E3545. [Google Scholar] [CrossRef] [PubMed]
- Janssen, I.; Katzmarzyk, P.T.; Boyce, W.F.; Pickett, W. The independent influence of physical inactivity and obesity on health complaints in 6th to 10th grade Canadian youth. J. Phys. Act. Health 2004, 1, 331–343. [Google Scholar] [CrossRef]
- Lee, P.L.; Hsiao, C.H.; Wang, C.L. Physical activity and memory complaints in middle-age Americans: Results from the MIDUS study. Am. J. Alzheimers Dis. Demen. 2013, 28, 600–605. [Google Scholar] [CrossRef] [PubMed]
- Lee, P.L. The relationship between memory complaints, activity and perceived health status. Scand. J. Psychol. 2014, 55, 136–141. [Google Scholar] [CrossRef]
- Cheng, J.; Wang, T.; Li, F.; Xiao, Y.; Bi, J.; Chen, J.; Sun, X.; Wu, L.; Wu, S.; Liu, Y.; et al. Self-rated health status and subjective health complaints associated with health-promoting lifestyles among urban Chinese women: A cross-sectional study. PLoS ONE 2015, 10, e0117940. [Google Scholar] [CrossRef] [PubMed]
- Tittlbach, S.A.; Jekauc, D.; Schmidt, S.C.E.; Woll, A.; Bös, K. The relationship between physical activity, fitness, physical complaints and BMI in German adults—Results of a longitudinal study. Eur. J. Sport Sci. 2017, 17, 1090–1099. [Google Scholar] [CrossRef]
- Rouse, D.M.; Tynan, A. Actual and perceived knowledge of research ethics guidelines in a sample of public health clinicians. Intern. Med. J. 2020. [Google Scholar] [CrossRef]
- Rotstein, S.; Caric, R.; Kulkarni, J.; Sharp, G. Australian junior doctors’ perspectives on psychiatry teaching in medical school. Acad. Psychiatry 2020. [Google Scholar] [CrossRef]
- Paudel, P.K.; Bastola, R.; Lopchan, P.T. The coverage of environmental issues in FM radios in Nepal: The current status and challenges. Heliyon 2020, 6, e04354. [Google Scholar] [CrossRef]


| Variable | Total 1177 | Male 346 (29.6%) | Female 823 (70.4%) | p Value * |
|---|---|---|---|---|
| N (%) | n (%) | n (%) | ||
| Age years a (M, SD) | 22.96 (5.21) | 22.83 (4.35) | 23.0 (5.55) | 0.58 |
| Year of Study | 0.017 | |||
| 1st | 549 (47.1) | 178 (51.7) | 371 (45.2) | |
| 2nd | 343 (29.4) | 106 (30.8) | 237(28.9) | |
| 3rd | 250 (21.5) | 54 (15.7) | 196 (23.9) | |
| ≥4th | 23(2.0) | 6 (1.7) | 17 (2.1) | |
| Marital status | 0.001 | |||
| Married or in relationship | 588 (50.6) | 148 (42.8) | 440 (53.9) | |
| Single | 575 (49.4) | 198 (57.2) | 377 (46.1) | |
| Accommodation during semester | 0.417 | |||
| With parents | 389 (33.4) | 109 (31.7) | 280 (34.1) | |
| Not with parents | 775 (66.6) | 235 (68.3) | 540 (65.9) | |
| Health awareness | <0.001 | |||
| Not at all/not much | 159 (13.7) | 70 (20.4) | 89 (10.9) | |
| To some extent/very much | 1001 (86.3) | 273 (79.6) | 728 (89.1) | |
| Physical activity achievement | ||||
| MPA guidelines | 196 (16.9) | 54 (15.7) | 142 (17.4) | 0.492 |
| VPA guidelines | 334 (29.0) | 110 (32.3) | 224 (27.6) | 0.110 |
| MVPA guidelines | 416 (36.1) | 127 (37.2) | 289 (35.6) | 0.604 |
| MSPA guidelines | 480 (41.4) | 186 (54.1) | 294 (36.0) | <0.001 |
| Health Complaint | Component | ||
|---|---|---|---|
| Psychological (9 Items) | Pains/Aches (7 Items) | Circulatory/Breathing (5 Items) | |
| Cronbach’s alpha | 0.858 | 0.735 | 0.736 |
| Eigenvalue | 6.868 | 1.536 | 1.278 |
| % of Variance | 32.703 | 7.313 | 6.088 |
| Depressive mood | 0.749 | ||
| Nervousness/anxiety | 0.699 | ||
| Mood swings | 0.719 | ||
| Difficulties to concentrate | 0.649 | ||
| Fear/phobia | 0.572 | ||
| Sleep disorders/insomnia | 0.594 | ||
| Nightmares | 0.564 | ||
| Fatigue | 0.536 | ||
| Lack of appetite | 0.463 | ||
| Stomach trouble/heartburn | 0.685 | ||
| Abdominal problems | 0.602 | ||
| Neck and shoulder pain | 0.601 | ||
| Back pain | 0.542 | ||
| Diarrhea | 0.591 | ||
| Constipation | 0.543 | ||
| Headaches | 0.419 | ||
| Trembling hands | 0.730 | ||
| Trembling | 0.759 | ||
| Rapid heartbeat/circulatory problems | 0.545 | ||
| Breathing difficulties | 0.533 | ||
| Speech impediment | 0.593 | ||
| Health Complaint | Total (n = 1177) | Male 346 (29.6%) | Female 823 (70.4%) | p Value* |
|---|---|---|---|---|
| Sometimes/ Very Often n (%) | Sometimes/ Very Often n (%) | Sometimes/ Very Often n (%) | ||
| Psychological | ||||
| Depressive mood | 387 (33.3) | 89 (25.8) | 298 (36.4) | <0.001 |
| Nervousness/anxiety | 493 (42.3) | 98 (28.5) | 395 (48.1) | <0.001 |
| Mood swings | 429 (36.8) | 62 (18) | 367 (44.7) | <0.001 |
| Difficulties to concentrate | 529 (45.4) | 122 (35.4) | 407 (49.7) | <0.001 |
| Fear/phobia | 159 (13.7) | 35 (10.2) | 124 (15.1) | 0.025 |
| Sleep disorders/insomnia | 390 (33.5) | 92 (26.8) | 298 (36.3) | 0.002 |
| Nightmares | 264 (22.7) | 42 (12.2) | 222 (27.1) | <0.001 |
| Fatigue | 701 (60.4) | 145 (42) | 556 (68.2) | <0.001 |
| Lack of appetite | 157 (16.1) | 25 (7.3) | 132 (13.5) | <0.001 |
| Pains/aches | ||||
| Stomach trouble/heartburn | 494 (42.5) | 88 (25.7) | 406 (49.5) | <0.001 |
| Abdominal problems | 225 (19.3) | 31 (9) | 194 (23.7) | <0.001 |
| Neck and shoulder pain | 695 (59.8) | 128 (37.2) | 567 (69.2) | <0.001 |
| Back pain | 534 (45.8) | 110 (31.9) | 424 (51.6) | <0.001 |
| Diarrhea | 212 (18.2) | 48 (14) | 164 (20) | 0.015 |
| Constipation | 134 (11.6) | 20 (5.8) | 114 (14.1) | <0.001 |
| Headaches | 544 (46.6) | 101 (29.3) | 443 (53.8) | <0.001 |
| Circulatory/breathing | ||||
| Trembling hands | 137 (11.8) | 45 (13.2) | 92 (11.2) | 0.329 |
| Trembling | 55 (4.8) | 11 (3.2) | 44 (5.4) | 0.105 |
| Rapid heartbeat/circulatory problems | 245 (21.1) | 35 (10.2) | 210 (25.6) | <0.001 |
| Breathing difficulties | 119 (10.2) | 20 (5.8) | 99 (12) | 0.001 |
| Speech impediment | 35 (3.1) | 12 (3.6) | 23 (3) | 0.575 |
| Health Complaint | Total (n = 1177) | Male 346 (29.6%) | Female 823 (70.4%) | p Value* |
|---|---|---|---|---|
| M (SD) | M (SD) | M (SD) | ||
| Psychological score a | 18.76 (5.45) | 16.46 (5.25) | 19.73 (5.25) | <0.001 |
| Pains/aches score b | 14.98 (3.72) | 12.98 (3.36) | 15.83 (3.53) | <0.001 |
| Circulatory/breathing score c | 7.14 (2.37) | 6.75 (2.21) | 7.31 (2.42) | <0.001 |
| Physical Activity Achievement | Health Complaint Score | |||||
|---|---|---|---|---|---|---|
| Psychological | Pains/Aches | Circulatory/ Breathing | ||||
| M ± SD | p Value | M ± SD | p Value | M ± SD | p Value | |
| MPA guidelines | 0.046 | 0.217 | 0.073 | |||
| Not achieved | 18.92 ± 5.43 | 15.06 ± 3.70 | 7.21 ± 2.38 | |||
| Achieved | 18.06 ± 5.50 | 14.69 ± 3.78 | 6.86 ± 2.33 | |||
| VPA guidelines | <0.001 | 0.002 | 0.010 | |||
| Not achieved | 19.12 ± 5.45 | 15.21 ± 3.68 | 7.26 ± 2.41 | |||
| Achieved | 17.84 ± 5.37 | 14.45 ± 3.72 | 6.85 ± 2.27 | |||
| MVPA guidelines | 0.003 | 0.006 | 0.044 | |||
| Not achieved | 19.12 ± 5.43 | 15.22 ± 3.69 | 7.26 ± 2.37 | |||
| Achieved* | 18.10 ± 5.45 | 14.59 ± 3.70 | 6.95 ± 2.37 | |||
| MSPA guidelines | <0.001 | <0.001 | 0.010 | |||
| Not achieved | 19.42 ± 5.43 | 15.45 ± 3.69 | 7.32 ± 2.44 | |||
| Achieved | 17.89 ± 5.37 | 14.39 ± 3.67 | 6.94 ± 2.26 | |||
| Health Complaint Score | ||||||
|---|---|---|---|---|---|---|
| Psychological | Pains/Aches | Circulatory/ Breathing | ||||
| (M, SD) | p Value | (M, SD) | p Value | (M, SD) | p Value | |
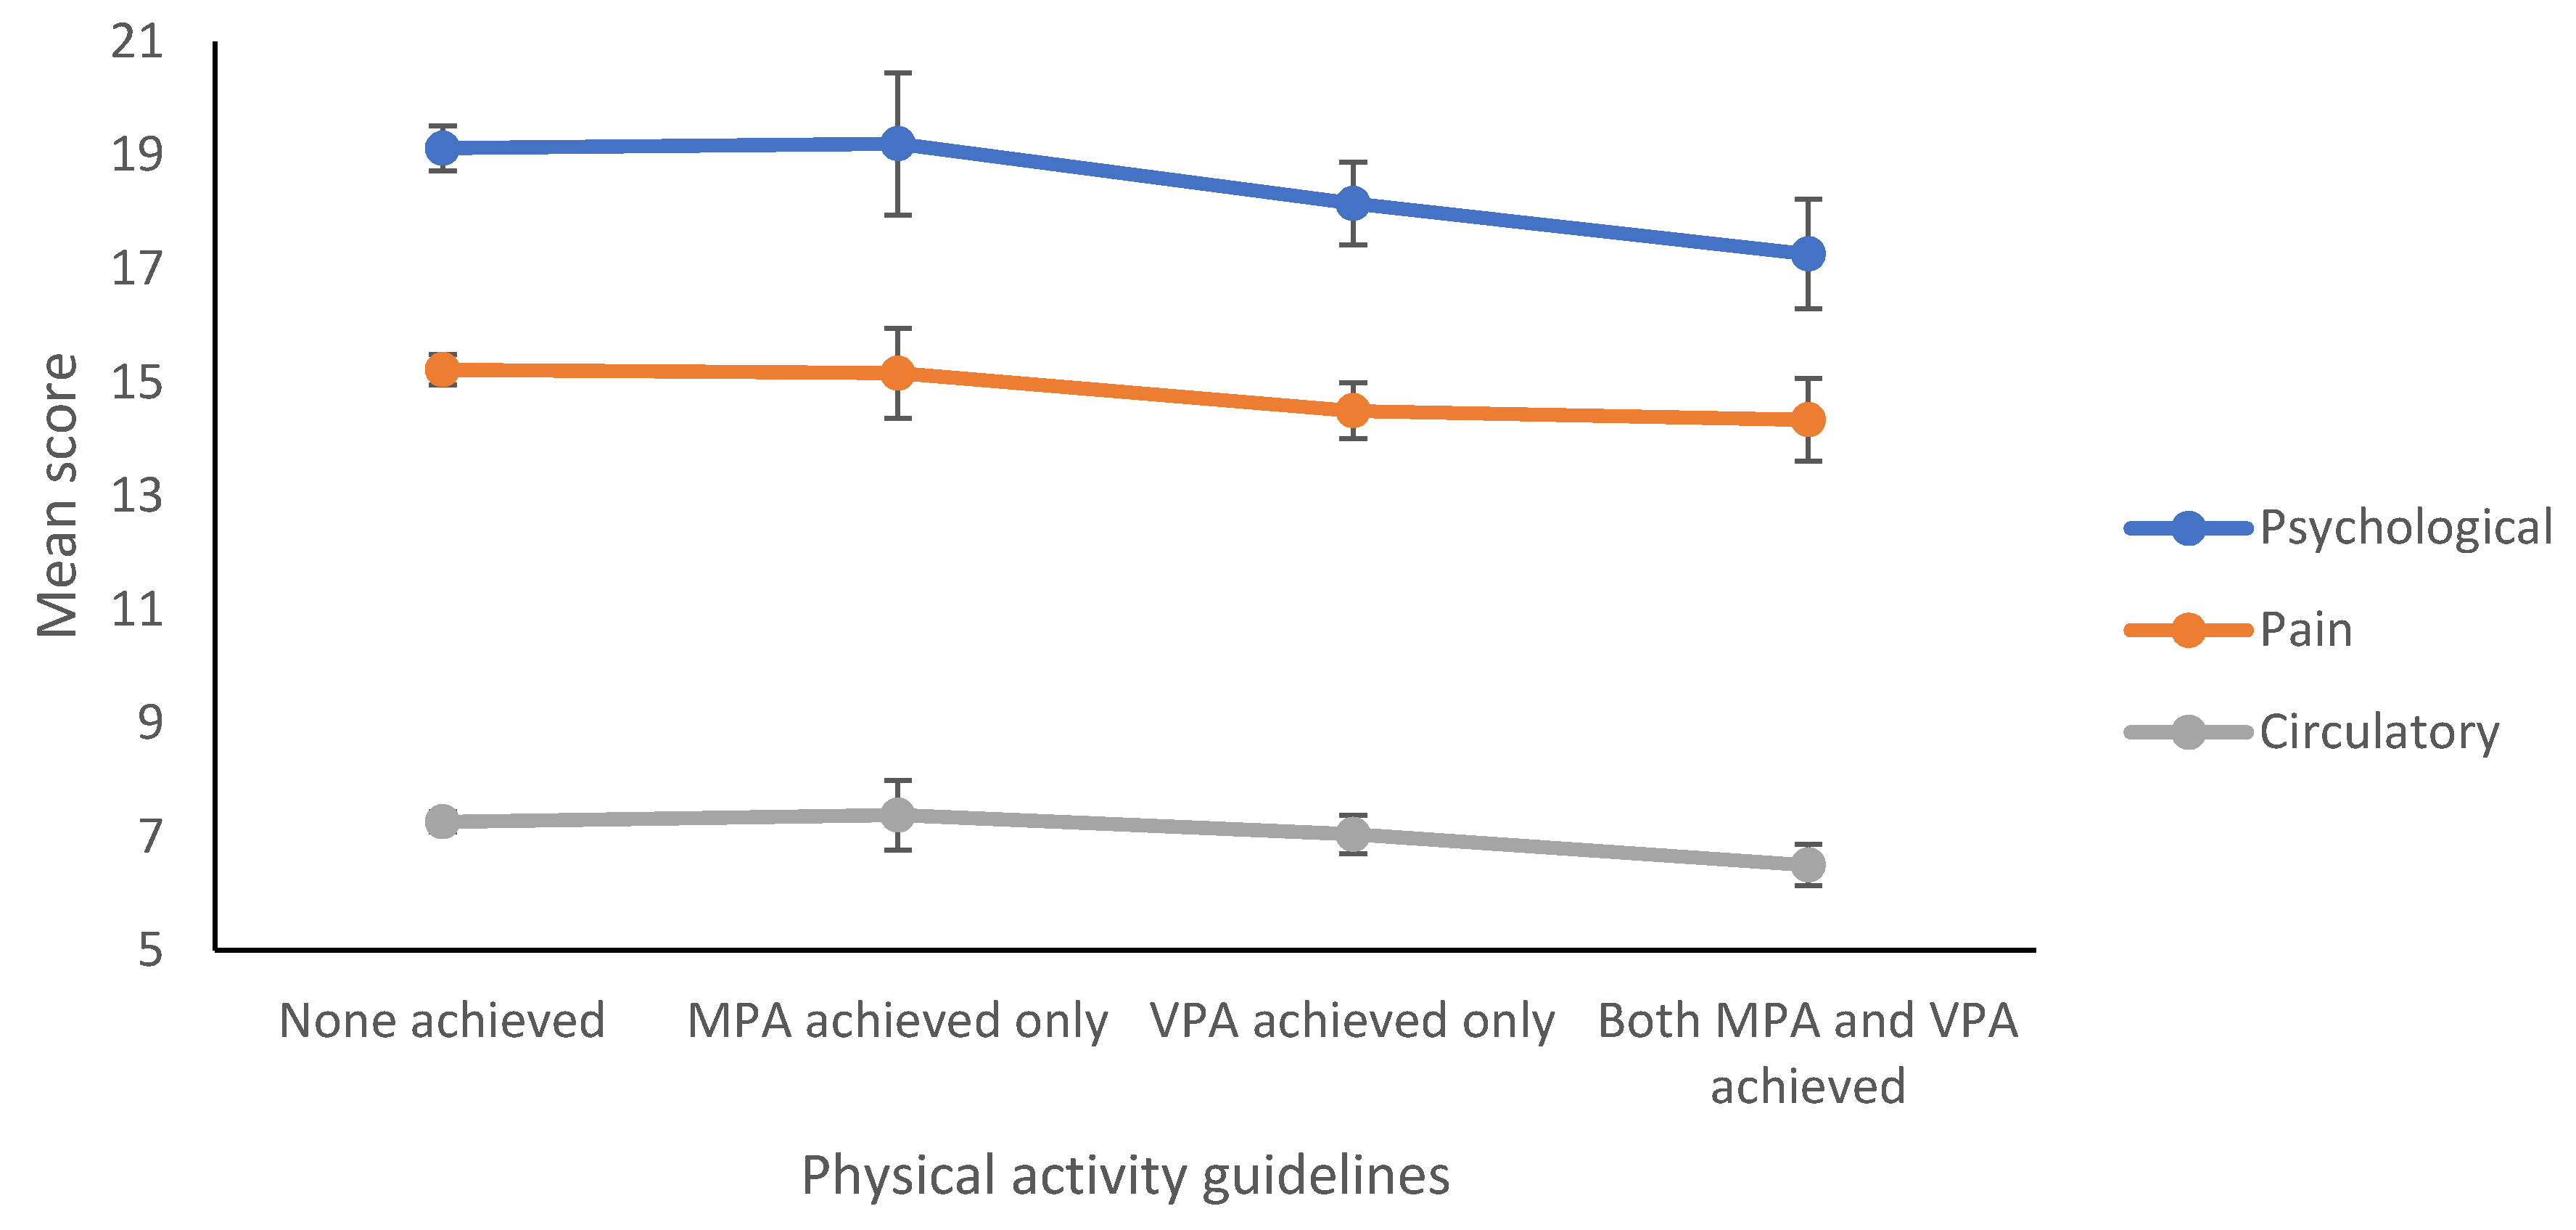
| Physical activity guidelines | 0.002 | 0.018 | 0.013 | |||
| None achieved | (19.12, 5.43) * | (15.22, 3.69) | (7.26, 2.37) * | |||
| MPA achieved only | (19.20, 5.67) | (15.16, 3.61) | (7.38, 2.74) | |||
| VPA achieved only | (18.15, 5.41) | (14.50, 3.64) | (7.04, 2.41) | |||
| Both MPA and VPA achieved | (17.26, 5.26) * | (14.34, 3.87) | (6.50, 1.94) * | |||
| Physical Activity Achievement | Health Complaint Score | ||||||||
|---|---|---|---|---|---|---|---|---|---|
| Psychological | Pains/Aches | Circulatory/Breathing | |||||||
| Std-β | β (95% CI) | Adj R2 (β) | Std-β | β (95% CI) | Adj R2 (β) | Std-β | β (95% CI) | Adj R2 (β) | |
| MPA achieved | −0.059 | −0.851 (−1.661; −0.041) p = 0.040 | 0.085 | −0.046 | −0.452 (−0.994;0.090) p = 0.102 | 0.122 | −0.054 | −0.341 (−0.714; 0.032) p = 0.073 | 0.017 |
| VPA achieved | −0.085 | −1.025 (−1.704; −0.347) p = 0.003 | 0.089 | −0.081 | −0.661 (−1.115; −0.208) p = 0.004 | 0.127 | −0.070 | −0.365 (−0.677; −0.052) p = 0.022 | 0.019 |
| MVPA achieved | −0.077 | −0.869 (−1.508; −0.230) p = 0.008 | 0.088 | −0.080 | −0.618 (−1.045; −0.191) p = 0.005 | 0.127 | −0.056 | −0.274 (−0.568; 0.020) p = 0.068 | 0.018 |
| MSPA achieved | −0.085 | −0.940 (−1.582; −0.299) p = 0.004 | 0.089 | −0.090 | −0.681 (−1.109; −0.252) p = 0.002 | 0.128 | −0.059 | −0.285 (−0.581; 0.010) p = 0.058 | 0.018 |
© 2020 by the authors. Licensee MDPI, Basel, Switzerland. This article is an open access article distributed under the terms and conditions of the Creative Commons Attribution (CC BY) license (http://creativecommons.org/licenses/by/4.0/).
Share and Cite
El Ansari, W.; Salam, A. Is Achieving the Guidelines of Four Forms of Physical Activity Associated with Less Self-Reported Health Complaints? Cross-Sectional Study of Undergraduates at the University of Turku, Finland. Int. J. Environ. Res. Public Health 2020, 17, 5595. https://doi.org/10.3390/ijerph17155595
El Ansari W, Salam A. Is Achieving the Guidelines of Four Forms of Physical Activity Associated with Less Self-Reported Health Complaints? Cross-Sectional Study of Undergraduates at the University of Turku, Finland. International Journal of Environmental Research and Public Health. 2020; 17(15):5595. https://doi.org/10.3390/ijerph17155595
Chicago/Turabian StyleEl Ansari, Walid, and Abdul Salam. 2020. "Is Achieving the Guidelines of Four Forms of Physical Activity Associated with Less Self-Reported Health Complaints? Cross-Sectional Study of Undergraduates at the University of Turku, Finland" International Journal of Environmental Research and Public Health 17, no. 15: 5595. https://doi.org/10.3390/ijerph17155595
APA StyleEl Ansari, W., & Salam, A. (2020). Is Achieving the Guidelines of Four Forms of Physical Activity Associated with Less Self-Reported Health Complaints? Cross-Sectional Study of Undergraduates at the University of Turku, Finland. International Journal of Environmental Research and Public Health, 17(15), 5595. https://doi.org/10.3390/ijerph17155595