Epidemics of HIV Infection among Heavy Drug Users of Depressants Only, Stimulants Only, and Both Depressants and Stimulants in Mainland China: A Series, Cross-Sectional Studies

 ,
,
Abstract
1. Introduction
2. Materials and Methods
2.1. Definitions
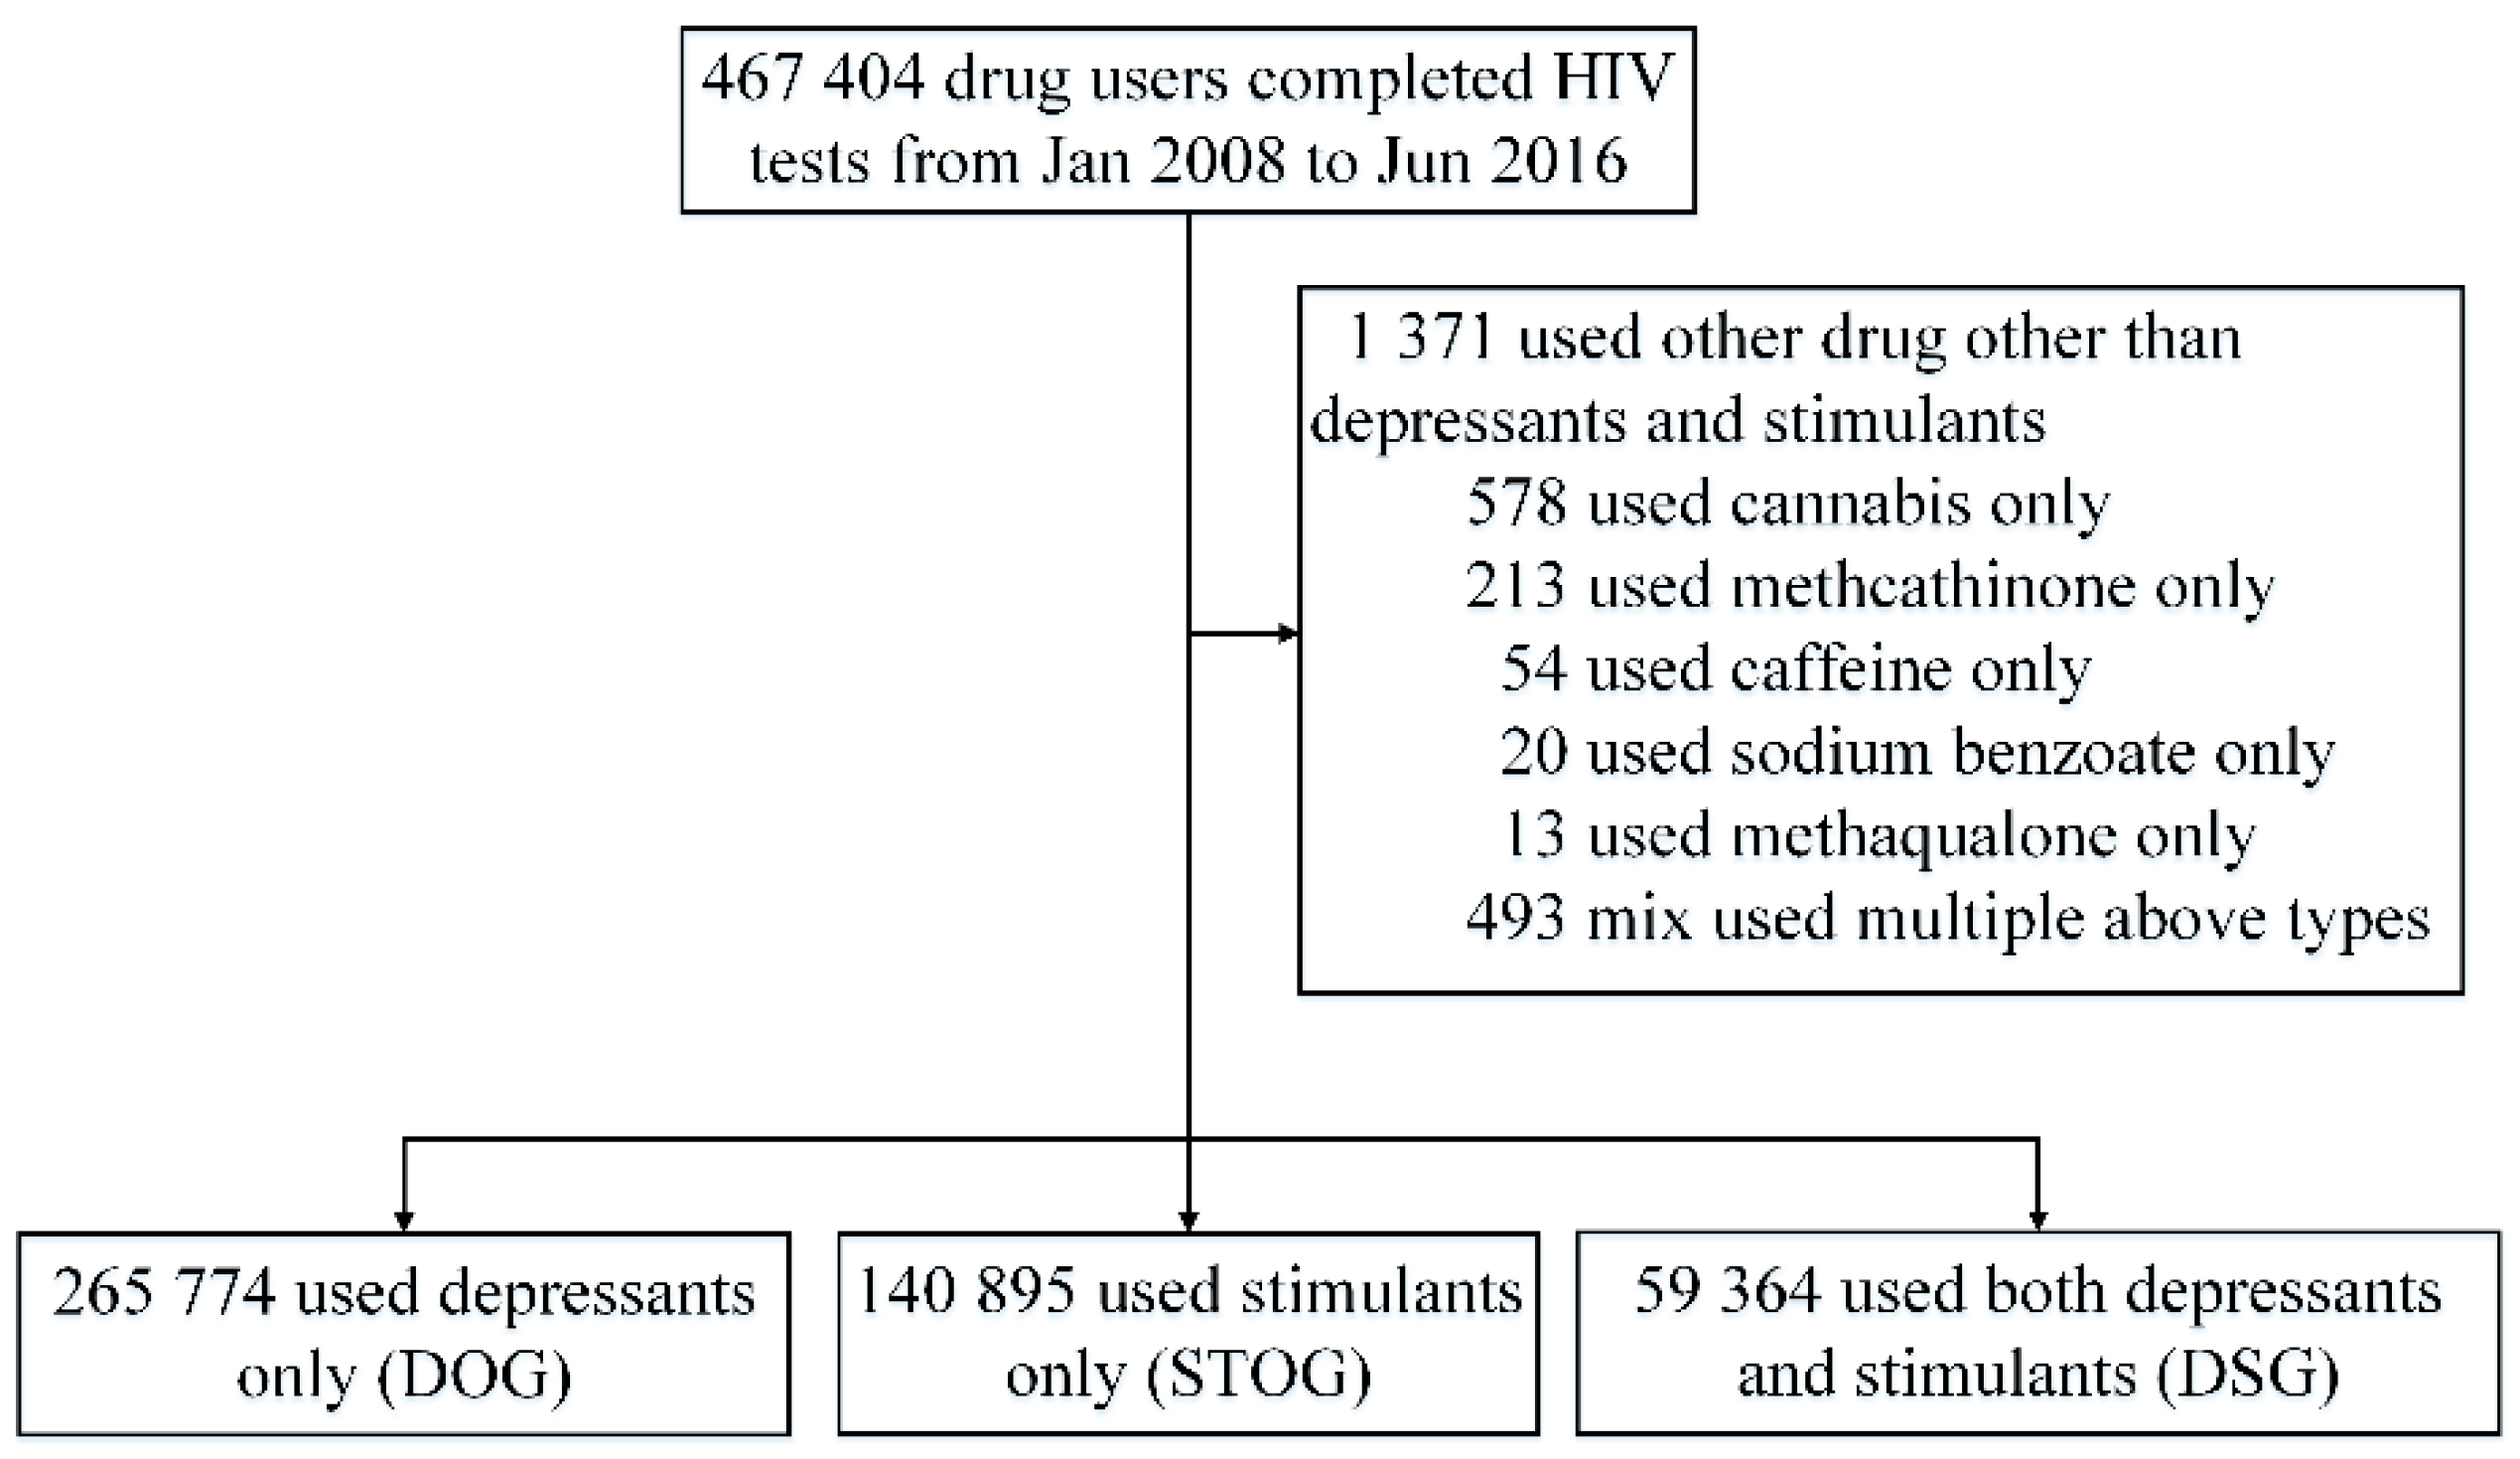
2.2. Study Design and Procedures
2.3. Measures
2.4. Statistical Analysis
2.5. Ethical Issues
3. Results
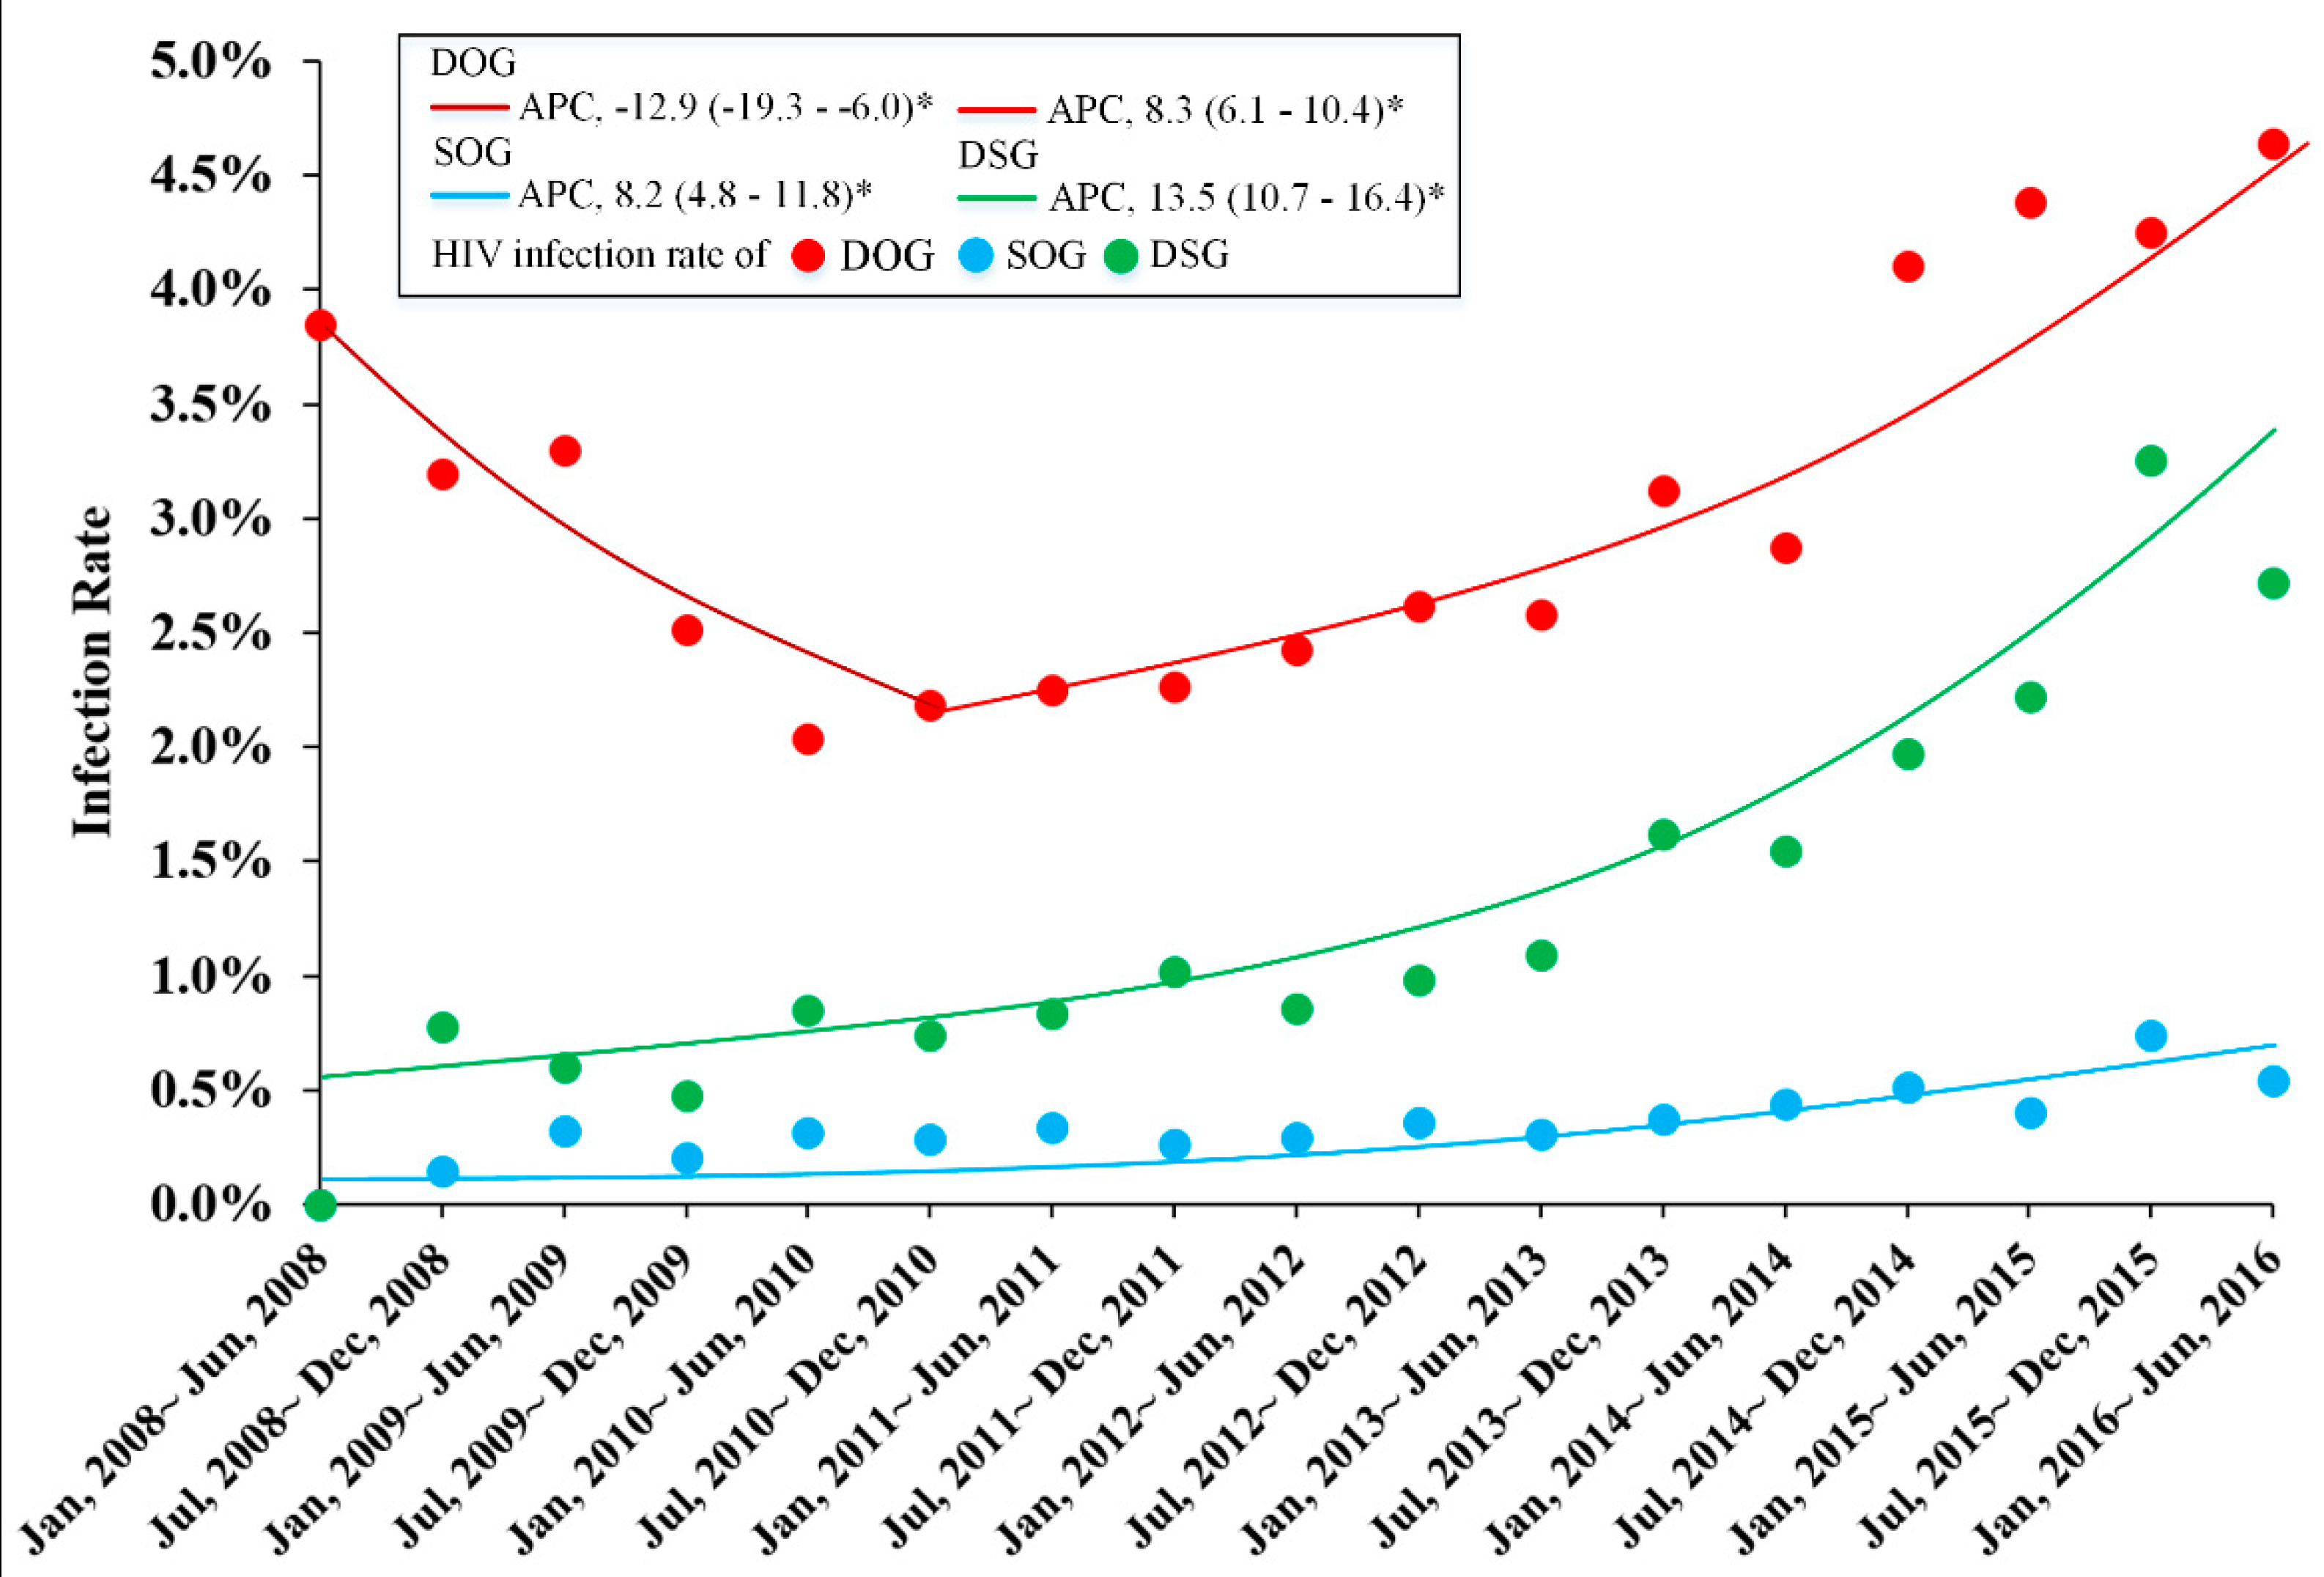
3.1. Trends and Socio-Demographic Characteristics of HIV Infection
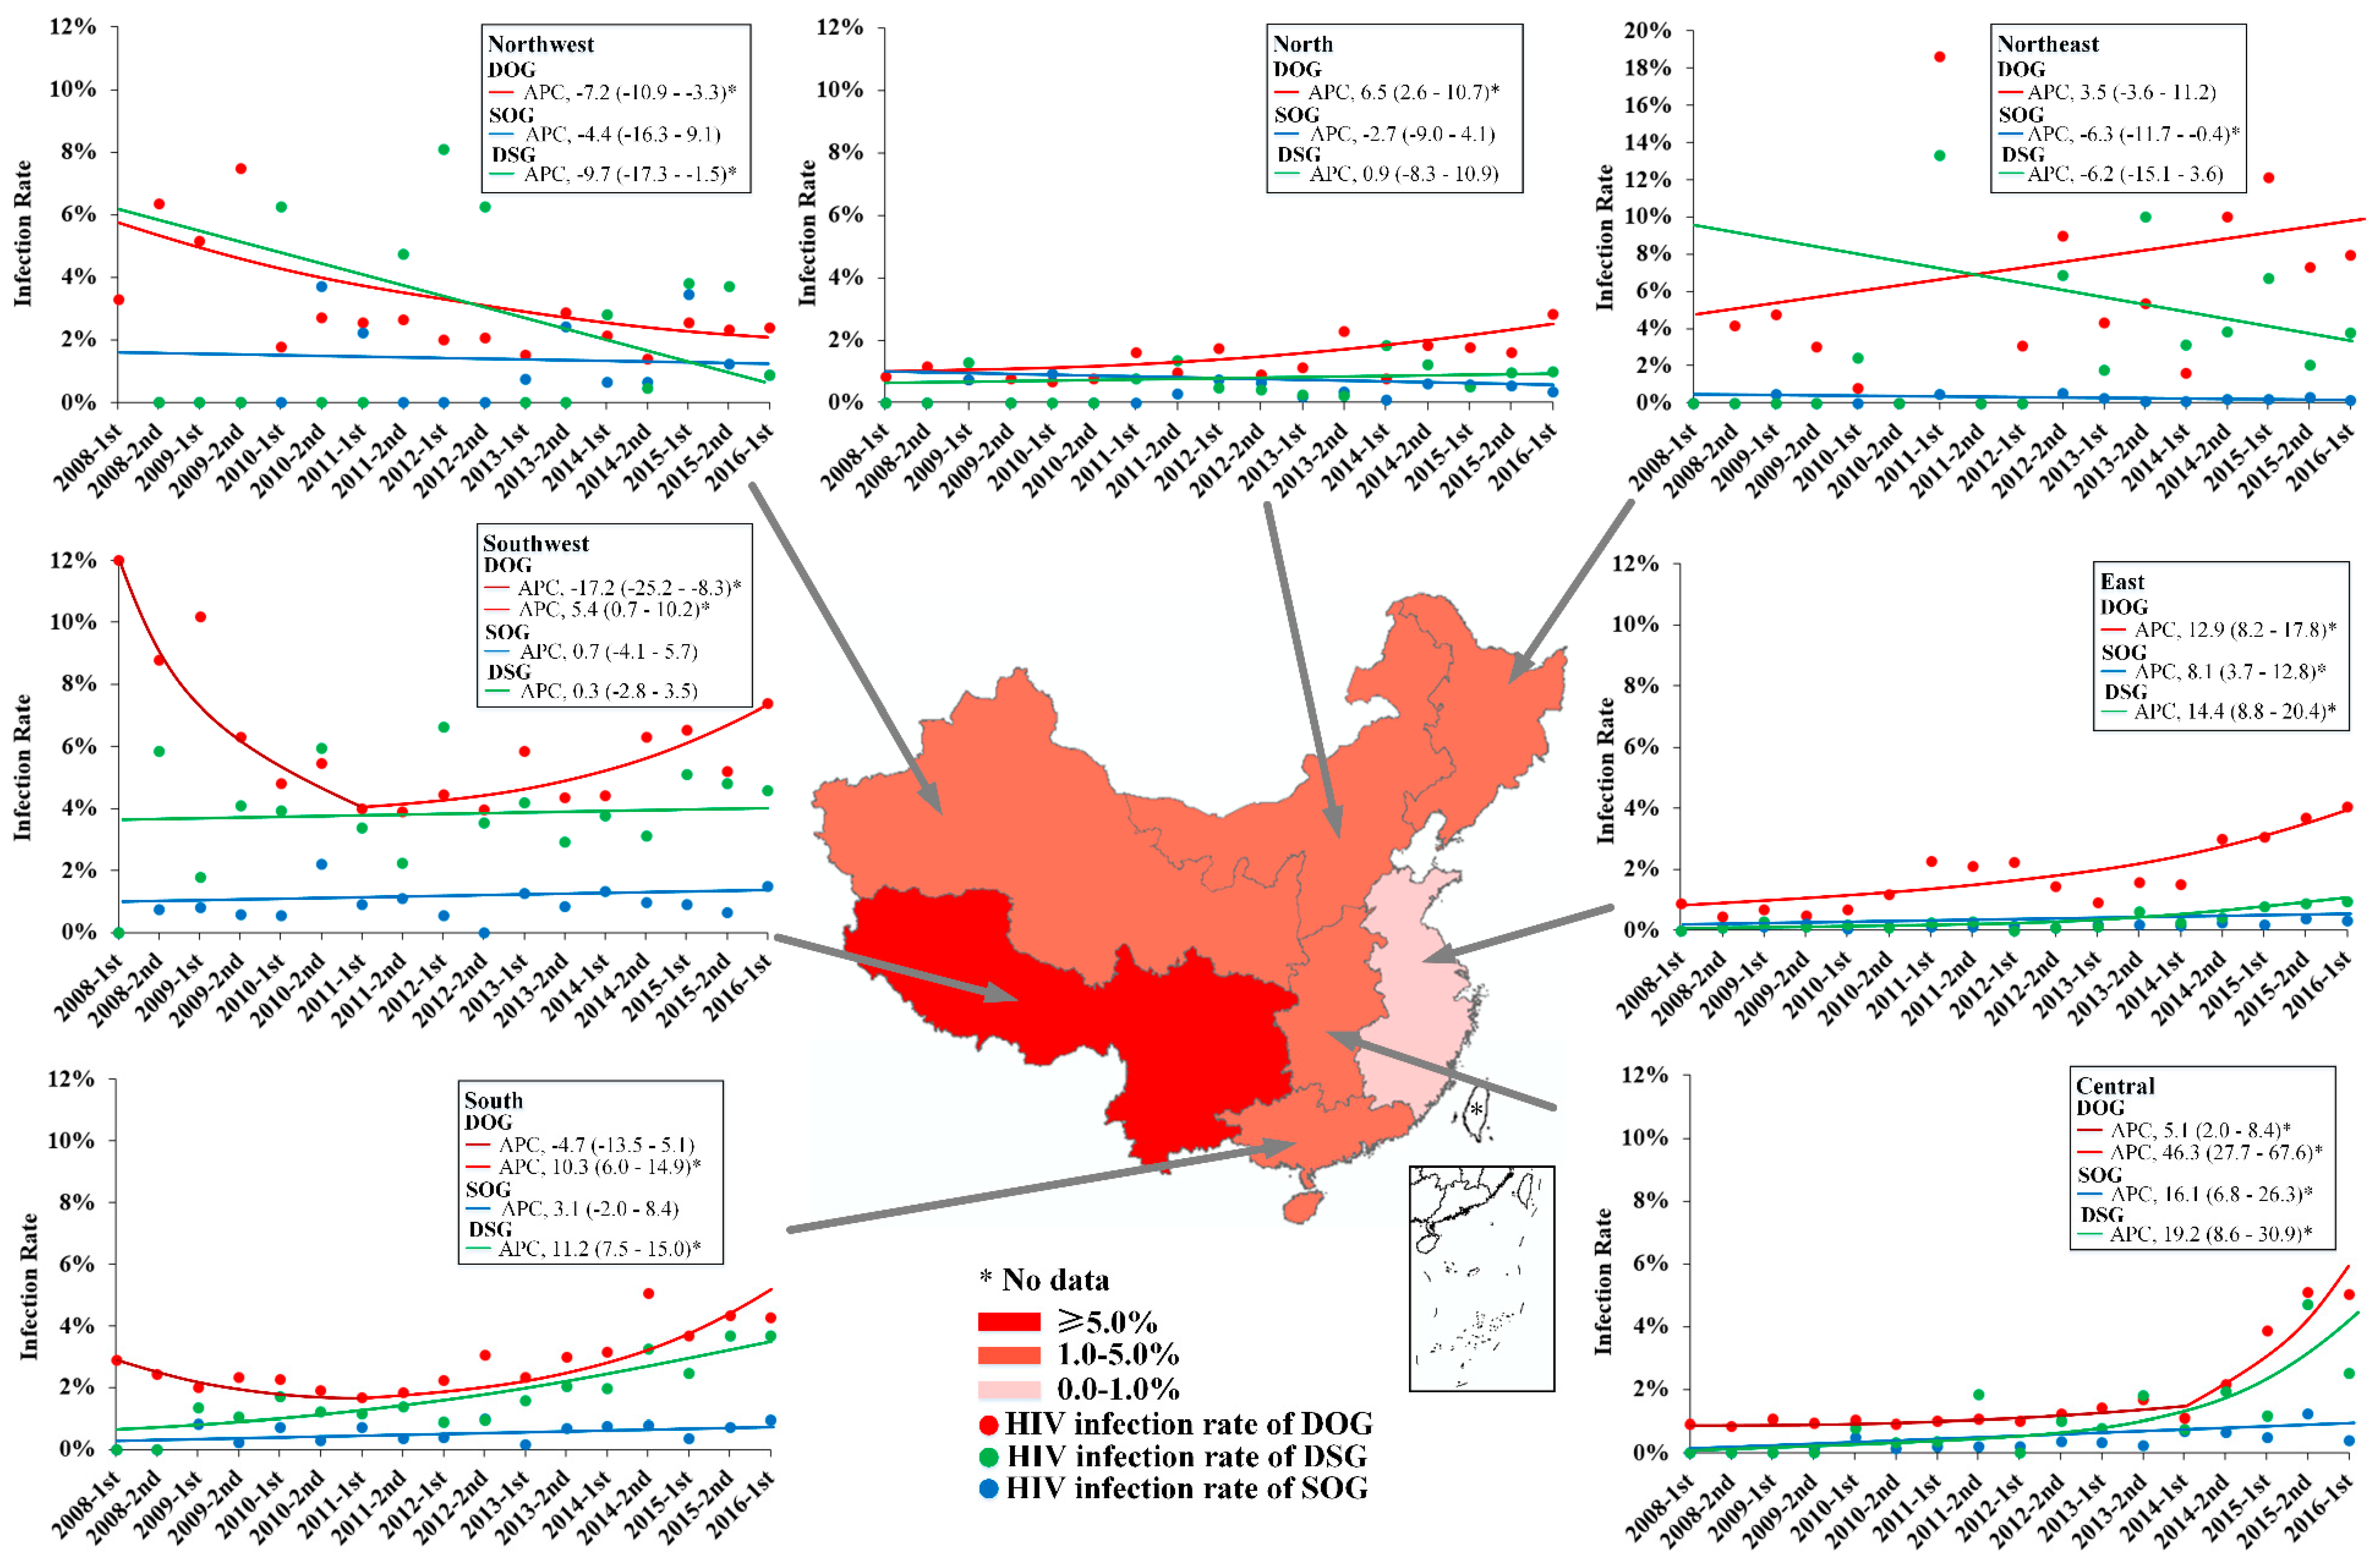
3.2. Geographic Trends in HIV Infection Rate
4. Discussion
5. Conclusions
Author Contributions
Funding
Acknowledgments
Conflicts of Interest
Appendix A
Data Extraction
Appendix B

| Characteristics | Total | Cannabis | Methcathinone | Caffeine | Sodium benzoate | Methaqualone | Mix Used Multiple Drugs N (%) |
|---|---|---|---|---|---|---|---|
| N (%) | N (%) | N (%) | N (%) | N (%) | N (%) | ||
| Total | 1371 | 578 | 213 | 54 | 20 | 13 | 493 |
| HIV | |||||||
| Positive | 23 (1.7) | 19 (3.3) | 0 (0.0) | 2 (3.7) | 0 (0.0) | 0 (0.0) | 2 (0.4) |
| Negative | 1348 (98.3) | 559 (96.7) | 213 (100.0) | 52 (96.3) | 20 (100.0) | 13 (100.0) | 491 (99.6) |
| Sex | |||||||
| Male | 1325 (96.6) | 563 (97.4) | 211 (99.1) | 54 (100.0) | 19 (95.0) | 12 (92.3) | 466 (94.5) |
| Female | 46 (3.4) | 15 (2.6) | 2 (0.9) | 0 (0.0) | 1 (5.0) | 1 (7.7) | 27 (5.5) |
| Age () | 32 (26–41) | 30 (25−38) | 37 (31−43) | 42 (32−47) | 36 (29−42) | 37 (32−46) | 31 (25−40) |
| Ethnicity | |||||||
| Han | 656 (47.8) | 36 (6.2) | 175 (82.2) | 32 (59.3) | 18 (90.0) | 12 (92.3) | 383 (77.7) |
| Minority | 552 (40.3) | 495 (85.6) | 0 (0.0) | 2 (3.7) | 1 (5.0) | 0 (0.0) | 54 (11.1) |
| Missing | 163 (11.9) | 47 (8.1) | 38 (17.8) | 20 (37.0) | 1 (5.0) | 1 (7.7) | 56 (11.4) |
| Education | |||||||
| High school or above | 122 (8.9) | 45 (7.8) | 29 (13.6) | 2 (3.7) | 0 (0.0) | 0 (0.0) | 46 (9.3) |
| Junior high school | 712 (51.9) | 214 (37.0) | 147 (69.0) | 30 (55.6) | 10 (50.0) | 6 (46.2) | 305 (61.9) |
| Primary school or below | 457 (33.4) | 270 (46.7) | 37 (17.4) | 20 (37.0) | 9 (45.0) | 5 (38.5) | 116 (23.5) |
| Missing | 80 (5.8) | 49 (8.5) | 0 (0.0) | 2 (3.7) | 1 (5.0) | 2 (15.4) | 26 (5.3) |
| Marital status | |||||||
| Married | 439 (32.0) | 206 (35.6) | 24 (11.3) | 8 (14.8) | 2 (10.0) | 2 (15.4) | 197 (40.0) |
| Unmarried | 811 (59.2) | 305 (52.8) | 182 (85.4) | 42 (77.8) | 16 (80.0) | 9 (69.2) | 257 (52.1) |
| Divorced or Widowed | 45 (3.3) | 18 (3.1) | 7 (3.3) | 2 (3.7) | 1 (5.0) | 0 (0.0) | 17 (3.4) |
| Missing | 76 (5.5) | 49 (8.5) | 0 (0.0) | 2 (3.7) | 1 (5.0) | 2 (15.4) | 22 (4.5) |
| Injection drug use | |||||||
| No | 186 (13.6) | 19 (3.3) | 69 (32.4) | 2 (3.7) | 2 (10.0) | 0 (0.0) | 94 (19.1) |
| Yes | 74 (5.4) | 12 (2.1) | 0 (0.0) | 4 (7.4) | 0 (0.0) | 0 (0.0) | 58 (11.8) |
| Not sure | 1111 (81.0) | 547 (94.6) | 144 (67.6) | 48 (88.9) | 18 (90.0) | 13 (100.0) | 341 (69.2) |
| Region | |||||||
| Southwest | 34 (2.5) | 4 (0.7) | 0 (0.0) | 3 (5.6) | 0 (0.0) | 0 (0.0) | 27 (5.5) |
| Northwest | 491 (35.8) | 457 (79.1) | 0 (0.0) | 1 (1.9) | 4 (20.0) | 0 (0.0) | 29 (5.9) |
| South | 165 (12.0) | 10 (1.7) | 0 (0.0) | 7 (13.0) | 0 (0.0) | 0 (0.0) | 148 (30.0) |
| Northeast | 29 (2.1) | 8 (1.4) | 0 (0.0) | 0 (0.0) | 0 (0.0) | 0 (0.0) | 21 (4.3) |
| Central | 133 (9.7) | 16 (2.8) | 13 (6.1) | 33 (61.1) | 0 (0.0) | 0 (0.0) | 71 (14.4) |
| North | 423 (30.9) | 23 (4.0) | 200 (93.9) | 3 (5.6) | 16 (80.0) | 13 (100.0) | 168 (34.1) |
| East | 96 (7.0) | 60 (10.4) | 0 (0.0) | 7 (13.0) | 0 (0.0) | 0 (0.0) | 29 (5.9) |
References
- United Nations Office on Drugs and Crime. World Drug Report 2019. Available online: https://wdr.unodc.org/wdr2019/ (accessed on 10 April 2020).
- Ladak, F.; Socias, E.; Nolan, S.; Dong, H.; Kerr, T.; Wood, E.; Montaner, J.; Milloy, M.-J. Substance use patterns and HIV-1 RNA viral load rebound among HIV-Positive illicit drug users in a Canadian setting. Antivir. Ther. 2018, 24, 19–25. [Google Scholar] [CrossRef] [PubMed]
- Manuzak, J.A.; Gott, T.M.; Kirkwood, J.S.; Coronado, E.; Hensley-McBain, T.; Miller, C.; Cheu, R.K.; Collier, A.C.; Funderburg, N.T.; Martin, J.N.; et al. Heavy Cannabis Use Associated with Reduction in Activated and Inflammatory Immune Cell Frequencies in Antiretroviral Therapy–Treated Human Immunodeficiency Virus–Infected Individuals. Clin. Infect. Dis. 2018, 66, 1872–1882. [Google Scholar] [CrossRef] [PubMed]
- Rainone, G.A.; Deren, S.; Kleinman, P.H.; Wish, E.D. Heavy Marijuana Users Not in Treatment: The Continuing Search for the “Pure” Marijuana User. J. Psychoact. Drugs 1987, 19, 353–359. [Google Scholar] [CrossRef]
- The Ministry of Public Security of the People’s Republic of China. China Drug Situation Report 2019. Available online: http://www.nncc626.com/2020-06/24/c_1210675813.htm (accessed on 25 June 2020).
- Lu, L.; Wang, X. Drug Addiction in China. Ann. N. Y. Acad. Sci. 2008, 1141, 304–317. [Google Scholar] [CrossRef] [PubMed]
- Bao, Y.-P.; Liu, Z.-M. Systematic review of HIV and HCV infection among drug users in China. Int. J. STD AIDS 2009, 20, 399–405. [Google Scholar] [CrossRef] [PubMed]
- Burki, T. HIV in China: A changing epidemic. Lancet Infect. Dis. 2018, 18, 1311–1312. [Google Scholar] [CrossRef]
- Zhang, L.; Chow, E.P.F.; Jing, J.; Zhuang, X.; Li, X.; He, M.; Sun, H.; Li, X.; Gorgens, M.; Wang, L.; et al. HIV prevalence in China: Integration of surveillance data and a systematic review. Lancet Infect. Dis. 2013, 13, 955–963. [Google Scholar] [CrossRef]
- World Health Organization, United Nations Office on Drugs and Crime, The Joint United Nations Programme on HIV/AIDS. Technical Guide for Countries to set Targets for Universal Access to HIV Prevention, Treatment and Care for Injecting Drug Users, 2012 Revision; WHO Press: Geneva, Switzerland, 2012. [Google Scholar]
- The Ministry of Public Security of the People’s Republic of China. China Drug Situation Report 2014. Available online: http://www.nncc626.com/2015-06/24/c_127945747.htm (accessed on 10 April 2020).
- Sun, H.; Bao, Y.-P.; Zhou, S.-J.; Meng, S.-Q.; Lu, L. The new pattern of drug abuse in China. Curr. Opin. Psychiatry 2014, 27, 251–255. [Google Scholar] [CrossRef]
- Su, S.; Mao, L.; Zhao, J.; Chen, L.; Jing, J.; Cheng, F.; Zhang, L. Epidemics of HIV, HCV and syphilis infection among synthetic drugs only users, heroin-Only users and poly-Drug users in Southwest China. Sci. Rep. 2018, 8, 6615. [Google Scholar] [CrossRef]
- Cordovilla-Guardia, S.; Lardelli-Claret, P.; Vilar-López, R.; López-Espuela, F.; Guerrero-López, F.; Fernández-Mondéjar, E. The effect of central nervous system depressant, Stimulant and hallucinogenic drugs on injury severity in patients admitted for trauma. Gac. Sanit. 2019, 33, 4–9. [Google Scholar] [CrossRef] [PubMed]
- Plankey, M.; Ostrow, D.G.; Stall, R.; Cox, C.; Li, X.; Peck, J.A.; Jacobson, L.P. The Relationship Between Methamphetamine and Popper Use and Risk of HIV Seroconversion in the Multicenter AIDS Cohort Study. JAIDS J. Acquir. Immune Defic. Syndr. 2007, 45, 85–92. [Google Scholar] [CrossRef] [PubMed]
- Sun, Y.; Guo, W.; Li, G.; He, S.; Lu, H. Increased synthetic drug abuse and trends in HIV and syphilis prevalence among female drug users from 2010–2014 from Beijing, China. Int. J. STD AIDS 2017, 29, 30–37. [Google Scholar] [CrossRef] [PubMed]
- Luo, W.; Hong, H.; Wang, X.; McGoogan, J.M.; Rou, K.; Wu, Z. Synthetic drug use and HIV infection among men who have sex with men in China: A sixteen-City, Cross-Sectional survey. PLoS ONE 2018, 13, e0200816. [Google Scholar] [CrossRef] [PubMed]
- Xu, J.-J.; Qian, H.-Z.; Chu, Z.-X.; Zhang, J.; Hu, Q.-H.; Jiang, Y.-J.; Geng, W.-Q.; Zhang, C.M.; Shang, H. Recreational Drug Use among Chinese Men Who Have Sex with Men: A Risky Combination with Unprotected Sex for Acquiring HIV Infection. BioMed Res. Int. 2014, 2014, 1–9. [Google Scholar] [CrossRef] [PubMed]
- Zhang, L.; Chow, E.P.F.; Zhang, J.; Jing, J.; Wilson, D.P. Describing the Chinese HIV Surveillance System and the Influences of Political Structures and Social Stigma. Open AIDS J. 2012, 6, 163–168. [Google Scholar] [CrossRef]
- Centers for Disease Control and Prevention. National HIV Behavioral Surveillance (NHBS). Available online: https://www.cdc.gov/hiv/statistics/systems/nhbs/index.html (accessed on 12 April 2020).
- Csete, J.; Kamarulzaman, A.; Kazatchkine, M.; Altice, F.L.; Balicki, M.; Buxton, J.; Cepeda, J.; Comfort, M.; Goosby, E.; Goulão, J.; et al. Public health and international drug policy. Lancet 2016, 387, 1427–1480. [Google Scholar] [CrossRef]
- National Bureau of Statistics of China. China Statistical Yearbook 2019. Available online: http://www.stats.gov.cn/tjsj/ndsj/2019/indexeh.htm (accessed on 17 April 2020).
- The Ministry of Public Security of the People’s Republic of China. China Drug Situation Report 2016. Available online: http://www.nncc626.com/2017-03/27/c_129519255_2.htm (accessed on 18 April 2020).
- Guang, S. Composition of dynamic control mechanism for drug addicts. J. Jiangsu Police Officer Coll. 2007, 2, 27–31. [Google Scholar]
- The Ministry of Public Security of the People’s Republic of China. Methods for identifying drug addiction. Chin. J. Drug Abuse Control 2011, 17, 63–64. [Google Scholar]
- Ministry of Health P.R. China. Diagnostic criteria for HIV/AIDS. Chin. J. AIDS STD 2012, 18, 354–356. [Google Scholar]
- Herman, T. The Physical Geography of China. Geogr. Rev. 1970, 60, 590–592. [Google Scholar] [CrossRef]
- Kim, H.-J.; Luo, J.; Chen, H.-S.; Green, D.; Buckman, D.; Byrne, J.; Feuer, E.J. Improved confidence interval for average annual percent change in trend analysis. Stat. Med. 2017, 36, 3059–3074. [Google Scholar] [CrossRef] [PubMed]
- Degenhardt, L.; Peacock, A.; Colledge, S.; Leung, J.; Grebely, J.; Vickerman, P.; Stone, J.; Cunningham, E.B.; Trickey, A.; Dumchev, K.; et al. Global prevalence of injecting drug use and sociodemographic characteristics and prevalence of HIV, HBV, and HCV in people who inject drugs: A multistage systematic review. Lancet Glob. Health 2017, 5, e1192–e1207. [Google Scholar] [CrossRef]
- United Nations Office on Drugs and Crime. World Drug Report 2017. Available online: https://www.unodc.org/wdr2017/ (accessed on 16 July 2020).
- U.S. Centers for Disease Control and Prevention. National HIV Behavioral Surveillance (NHBS) Reports. Available online: https://www.cdc.gov/hiv/statistics/systems/nhbs/reports.html (accessed on 16 July 2020).
- Meylakhs, P.A.; Friedman, S.R.; Meylakhs, A.; Mateu-Gelabert, P.; Ompad, D.C.; Alieva, A.; Dmitrieva, A. A New Generation of Drug Users in St. Petersburg, Russia? HIV, HCV, and Overdose Risks in a Mixed-Methods Pilot Study of Young Hard Drug Users. AIDS Behav. 2019, 23, 3350–3365. [Google Scholar] [CrossRef] [PubMed]
- Otiashvili, D.; Kirtadze, I.; Bergen-Cico, D. Exploring the New Phenomena of Home-Made Extraction and Injection of Ephedra Plant Product in Georgia. Subst. Use Misuse 2017, 52, 826–829. [Google Scholar] [CrossRef]
- Wang, C.; Shi, C.X.; Zhang, B.; Chen, H.; Wang, H.; Zhang, N.; Rou, K.; Cao, X.; Luo, W.; Wu, Z. HIV seroconversion and risk factors among drug users receiving methadone maintenance treatment in China: A qualitative study. Drug Alcohol Depend. 2016, 167, 169–174. [Google Scholar] [CrossRef] [PubMed]
- Yin, W.; Pang, L.; Cao, X.; McGoogan, J.M.; Liu, M.; Zhang, C.; Li, Z.; Li, J.; Rou, K. Factors associated with depression and anxiety among patients attending community-Based methadone maintenance treatment in China. Addiction 2015, 110, 51–60. [Google Scholar] [CrossRef]
- The Joint United Nations Programme on HIV/AIDS. UNAIDS Data 2020. Available online: https://www.unaids.org/en/resources/documents/2020/unaids-data (accessed on 10 July 2020).
- Philbin, M.M.; Fujie, Z. Exploring Stakeholder Perceptions of Facilitators and Barriers to Using Needle Exchange Programs in Yunnan Province, China. PLoS ONE 2014, 9, e86873. [Google Scholar] [CrossRef]
- Zhang, L.; Chen, X.; Zheng, J.; Zhao, J.; Jing, J.; Zhang, J.; Chow, E.P.F.; Wilson, D.P. Ability to access community-Based needle-Syringe programs and injecting behaviors among drug users: A cross-Sectional study in Hunan Province, China. Harm Reduct. J. 2013, 10, 8. [Google Scholar] [CrossRef]
- Wu, J.; Zhang, Y.; Shen, Y.; Wang, X.; Xing, H.; Yang, X.; Ding, X.; Hu, B.; Li, H.; Han, J.; et al. Phylogenetic analysis highlights the role of older people in the transmission of HIV-1 in Fuyang, Anhui Province, China. BMC Infect. Dis. 2019, 19, 562. [Google Scholar] [CrossRef]
- Pan, S.; Carpiano, R.M.; Li, N.; Zhang, Z.; Schechter, M.T.; Spittal, P.M.; Ruan, Y. Ethnicity and HIV vulnerabilities among men who have sex with men in China. AIDS Care 2018, 30, 1025–1030. [Google Scholar] [CrossRef]
- Zhang, Y.; Shan, H.; Trizzino, J.; Ruan, Y.; Beauchamp, G.; Masse, B.; Ma, J.; Gu, Y.; He, Y.; Rui, B.; et al. Demographic characteristics and risk behaviors associated with HIV positive injecting drug users in Xinjiang, China. J. Infect. 2007, 54, 285–290. [Google Scholar] [CrossRef] [PubMed]
- National Bureau of Statistics. Annual National Economic Data. Available online: http://data.stats.gov.cn/easyquery.htm?cn=C01 (accessed on 13 July 2020).
- Jia, Z.; Liu, Z.; Chu, P.; McGoogan, J.M.; Cong, M.; Shi, J.; Lu, L. Tracking the evolution of drug abuse in China, 2003-10: A retrospective, Self-Controlled study. Addiction 2015, 110, 4–10. [Google Scholar] [CrossRef] [PubMed]
- National Bureau of Statistics. Main Data Bulletin of the Sixth National Population Census 2010 (No. 2). Available online: http://www.stats.gov.cn/tjsj/tjgb/rkpcgb/qgrkpcgb/201104/t20110429_30328.html (accessed on 20 April 2020).


| Characteristics | Total | DOG | SOG | DSG | p-Value |
|---|---|---|---|---|---|
| N (%) | N (%) | N (%) | N (%) | ||
| Total | 466,033 | 265,774 | 140,895 | 59,364 | |
| HIVa,b,c | <0.001 | ||||
| Positive | 9522 (2.0) | 7906 (3.0) | 635 (0.5) | 981 (1.7) | |
| Negative | 456,511 (98.0) | 257,868 (97.0) | 140,260 (99.5) | 58,383 (98.3) | |
| Sexa,b,c | <0.001 | ||||
| Male | 409792 (87.9) | 240,730 (90.6) | 117,297 (83.3) | 51,765 (87.2) | |
| Female | 56241 (12.1) | 25,044 (9.4) | 23,598 (16.7) | 7599 (12.8) | |
| Agea,b,c,d () | 34 (28–40) | 35 (29–41) | 29 (25–36) | 36 (30–42) | <0.001 |
| Ethnicitya,b,c | <0.001 | ||||
| Han | 387,488 (83.1) | 215,647 (81.1) | 119,358 (84.7) | 52,483 (88.4) | |
| Minority | 46,698 (10.1) | 35,014 (13.2) | 7485 (5.3) | 4199 (7.1) | |
| Missing | 31,847 (6.8) | 15,113 (5.7) | 14,052 (10.0) | 2682 (4.5) | |
| Educationa,b,c | <0.001 | ||||
| High school or above | 54,002 (11.6) | 24,874 (9.4) | 21,977 (15.6) | 7151 (12.0) | |
| Junior high school | 287,312 (61.6) | 154,243 (58.0) | 94,789 (67.3) | 38,280 (64.5) | |
| Primary school or below | 111,886 (24.0) | 77,349 (29.1) | 21,666 (15.4) | 12,871 (21.7) | |
| Missing | 12,833 (2.8) | 9308 (3.5) | 2463 (1.7) | 1062 (1.8) | |
| Marital statusa,b,c | <0.001 | ||||
| Married | 201,101 (43.2) | 100,079 (37.7) | 76,786 (54.5) | 24,236 (40.8) | |
| Unmarried | 217,183 (46.6) | 135,569 (51.0) | 52,955 (37.6) | 28,659 (48.3) | |
| Divorced or Widowed | 38,190 (8.1) | 22,748 (8.6) | 9592 (6.8) | 5850 (9.9) | |
| Missing | 9559 (2.1) | 7378 (2.8) | 1562 (1.1) | 619 (1.0) | |
| Injection drug usea,b,c | <0.001 | ||||
| No | 146,537 (31.4) | 59,374 (22.3) | 65,330 (46.4) | 21,833 (36.8) | |
| Yes | 103,117 (22.1) | 87,142 (32.8) | 726 (0.5) | 15,249(25.7) | |
| Not sure | 216,379 (46.4) | 119,258 (44.9) | 74,839 (53.1) | 22,282 (37.5) | |
| Methadone treatmenta,b,c | <0.001 | ||||
| No | 419,313 (90.0) | 229,374 (86.3) | 140,895 (100.0) | 50,169 (84.5) | |
| Yes | 46,720(10.0) | 36,400 (13.7) | 0(0.0) | 9195 (15.5) | |
| Date of HIV testa,b,c | <0.001 | ||||
| Jan, 2008~Jun, 2008 | 2266 (0.5) | 2078 (0.8) | 116 (0.1) | 72 (0.1) | |
| Jul, 2008~Dec, 2008 | 24,754 (5.3) | 21,040 (7.9) | 2045 (1.5) | 1669 (2.8) | |
| Jan, 2009~Jun, 2009 | 27,565 (5.9) | 24,030 (9.0) | 1877 (1.3) | 1658 (2.8) | |
| Jul, 2009~Dec, 2009 | 31,843 (6.8) | 24,894 (9.4) | 4416 (3.1) | 2533 (4.3) | |
| Jan, 2010~Jun, 2010 | 27,677 (6.0) | 20,936 (7.9) | 4150 (2.9) | 2591 (4.4) | |
| Jul, 2010~Dec, 2010 | 24,673 (5.3) | 18,062 (6.8) | 4176 (3.0) | 2435 (4.1) | |
| Jan, 2011~Jun, 2011 | 22,418 (4.8) | 16,181 (6.1) | 3846 (2.7) | 2391 (4.0) | |
| Jul, 2011~Dec, 2011 | 19,075 (4.1) | 13,425 (5.1) | 3388 (2.4) | 2262 (3.8) | |
| Jan, 2012~Jun, 2012 | 22,412 (4.8) | 14,519 (5.5) | 5091 (3.6) | 2802 (4.7) | |
| Jul, 2012~Dec, 2012 | 21,898 (4.7) | 13,360 (5.0) | 5595 (4.0) | 2943 (5.0) | |
| Jan, 2013~Jun, 2013 | 26,754 (5.7) | 14,420 (5.4) | 8207 (5.8) | 4127 (7.0) | |
| Jul, 2013~Dec, 2013 | 31,350 (6.8) | 16,439 (6.2) | 10,473 (7.4) | 4438 (7.5) | |
| Jan, 2014~Jun, 2014 | 31,597 (6.7) | 14,687 (5.5) | 11,871 (8.4) | 5048 (8.5) | |
| Jul, 2014~Dec, 2014 | 40,380 (8.7) | 14,769 (5.6) | 19,063 (13.5) | 6548 (11.0) | |
| Jan, 2015~Jun, 2015 | 40,248 (8.6) | 13,391 (5.0) | 20,191 (14.3) | 6666 (11.2) | |
| Jul, 2015~Dec, 2015 | 40,451 (8.7) | 13,188 (5.0) | 20,902 (14.8) | 6361 (10.7) | |
| Jan, 2016~Jun, 2016 | 30,672 (6.6) | 10,364 (3.9) | 15,488 (11.0) | 4820 (8.1) | |
| Regiona,b,c | <0.001 | ||||
| Southwest | 79,040 (17.0) | 60,507 (22.8) | 11,452 (8.1) | 7081 (11.9) | |
| Northwest | 32,790 (7.0) | 29,397 (11.1) | 2047 (1.5) | 1346 (2.3) | |
| South | 120,146 (25.8) | 80,841 (30.4) | 23,049 (16.4) | 16,256 (27.4) | |
| Northeast | 13,321 (2.8) | 1703 (0.6) | 10,685 (7.6) | 933 (1.6) | |
| Central | 64,177 (13.8) | 32,475 (12.2) | 24,522 (17.4) | 7180 (12.1) | |
| North | 38,622 (8.3) | 21,309 (8.0) | 12,712 (9.0) | 4601 (7.8) | |
| East | 117,878 (25.3) | 39,491 (14.9) | 56,420 (40.0) | 21,967 (37.0) | |
| Missing | 59 (0.0) | 51 (0.0) | 8 (0.0) | 0 (0.0) |
| Characteristics | DOG | SOG | DSG | AOR (95%CI) | AOR (95%CI) | AOR (95%CI) | ||||||
|---|---|---|---|---|---|---|---|---|---|---|---|---|
| HIV | N | Rate (95%CI) | HIV | N | Rate (95%CI) | HIV | N | Rate (95%CI) | (DOG vs SOG) | (DSG vs SOG) | (DOG vs DSG) | |
| Total | 7906 | 26,5774 | 2.97 (2.91–3.04) | 635 | 140,895 | 0.45 (0.42–0.49) | 981 | 59,364 | 1.65 (1.55–1.76) | 2.07 (1.88–2.28) *** | 1.95 (1.72–2.22) *** | 1.28 (1.19–1.37) *** |
| Sex | ||||||||||||
| Male | 7078 | 24,0730 | 2.94 (2.87–3.01) | 521 | 117,297 | 0.44 (0.41–0.48) | 832 | 51,765 | 1.61 (1.50–1.72) | 2.17 (1.95–2.40) *** | 1.91 (1.67–2.20) *** | 1.32 (1.22–1.42) *** |
| Female | 828 | 25,044 | 3.31 (3.09–3.54) | 114 | 23,598 | 0.48 (0.40–0.58) | 149 | 7599 | 1.96 (1.67–2.29) | 1.60 (1.24–2.07) *** | 2.18 (1.59–2.99) *** | 1.08 (0.89–1.31) |
| Age | ||||||||||||
| ≤17 | 11 | 911 | 1.21 (0.68–2.02) | 2 | 1564 | 0.13 (0.04–0.36) | 0 | 137 | 0 (-) | 1.79 (0.18–17.77) | - | - |
| 18~24 | 405 | 23,946 | 1.69 (1.53–1.86) | 137 | 32,951 | 0.42 (0.35–0.49) | 39 | 4636 | 0.84 (0.62–1.13) | 1.66 (1.28–2.15) *** | 1.35 (0.88–2.05) | 1.27 (0.90–1.81) |
| 25~44 | 6406 | 20,1105 | 3.19 (3.11–3.26) | 435 | 95,836 | 0.45 (0.41–0.50) | 727 | 44,416 | 1.64 (1.52–1.76) | 2.24 (2.00–2.51) *** | 1.92 (1.66–2.23) *** | 1.34 (1.24–1.46) *** |
| 45~ | 1082 | 39,786 | 2.72 (2.56–2.88) | 60 | 10,528 | 0.57 (0.44–0.72) | 215 | 10,172 | 2.11 (1.85–2.41) | 1.59 (1.17–2.15) ** | 2.67 (1.91–3.74) *** | 1.00 (0.86–1.18) |
| Missing | 2 | 26 | 7.69 (2.38–21.43) | 1 | 16 | 6.25 (1.51–23.06) | 0 | 3 | 0 (-) | 1.25 (0.10–15.01) a | - | - |
| Ethnicity | ||||||||||||
| Han | 5040 | 215,647 | 2.34 (2.27–2.40) | 467 | 119,358 | 0.39 (0.36–0.43) | 761 | 52,483 | 1.45 (1.35–1.55) | 1.72 (1.53–1.92) *** | 1.87 (1.62–2.16) *** | 1.18 (1.09–1.28) *** |
| Minority | 2520 | 35,014 | 7.20 (6.92–7.48) | 68 | 7485 | 0.91 (0.72–1.14) | 158 | 4199 | 3.76 (3.22–4.37) | 3.96 (3.04–5.15) *** | 2.13 (1.51–3.01) *** | 1.65 (1.39–1.97) *** |
| Missing | 346 | 15,113 | 2.29 (2.06–2.54) | 100 | 14,052 | 0.71 (0.59–0.86) | 62 | 2682 | 2.31 (1.81–2.92) | 2.23 (1.67–2.97) *** | 2.35 (1.61–3.41) *** | 1.09 (0.81–1.45) |
| Education | ||||||||||||
| High school or above | 477 | 24,874 | 1.92 (1.75–2.09) | 88 | 21,977 | 0.40 (0.33–0.49) | 69 | 7151 | 0.96 (0.76–1.21) | 1.27 (0.95–1.71) | 1.51 (1.00–2.28) | 1.09 (0.83–1.44) |
| Junior high school | 3847 | 15,4243 | 2.49 (2.42–2.57) | 400 | 94,789 | 0.42 (0.38–0.46) | 564 | 38,280 | 1.47 (1.36–1.60) | 1.83 (1.61–2.07) *** | 1.98 (1.68–2.33) *** | 1.18 (1.07–1.29) ** |
| Primary school or below | 3261 | 77,349 | 4.22 (4.07–4.36) | 134 | 21,666 | 0.62 (0.52–0.73) | 329 | 12,871 | 2.56 (2.29–2.84) | 2.75 (2.28–3.32) *** | 2.06 (1.62–2.63) *** | 1.38 (1.22–1.55) *** |
| Missing | 321 | 9308 | 3.45 (3.09–3.84) | 13 | 2463 | 0.53 (0.31–0.85) | 19 | 1062 | 1.79 (1.15–2.68) | 3.06 (1.66–5.67) *** | 2.70 (1.15–6.33) ** | 1.46 (0.88–2.44) |
| Marital status | ||||||||||||
| Married | 3325 | 100,079 | 3.32 (3.21–3.44) | 348 | 76,786 | 0.45 (0.41–0.50) | 444 | 24,236 | 1.83 (1.67–2.01) | 2.10 (1.84–2.41) *** | 2.04 (1.70–2.44) *** | 1.32 (1.18–1.46) *** |
| Unmarried | 3571 | 135,569 | 2.63 (2.55–2.72) | 240 | 52,955 | 0.45 (0.40–0.51) | 415 | 28,659 | 1.45 (1.32–1.59) | 1.96 (1.68–2.27) *** | 1.76 (1.45–2.14) *** | 1.28 (1.15–1.43) *** |
| Divorced or Widowed | 735 | 22,748 | 3.23 (3.01–3.47) | 40 | 9592 | 0.42 (0.31–0.56) | 116 | 5850 | 1.98 (1.65–2.36) | 2.11 (1.46–3.06) *** | 2.40 (1.55–3.72) *** | 1.05 (0.85–1.31) |
| Missing | 275 | 7378 | 3.73 (3.31–4.18) | 7 | 1562 | 0.45 (0.22–0.84) | 6 | 619 | 0.97 (0.45–1.89) | 3.40 (1.52–7.61) ** | 2.28 (0.65–8.04) | 2.33 (1.02–5.34) * |
| Injection drug use | ||||||||||||
| No | 759 | 59,374 | 1.28 (1.19–1.37) | 233 | 65,330 | 0.36 (0.31–0.40) | 228 | 21,833 | 1.04 (0.92–1.18) | 1.86 (1.54–2.23) *** | 2.14 (1.74–2.62) *** | 0.95 (0.81–1.12) |
| Yes | 4635 | 87,142 | 5.32 (5.17–5.47) | 24 | 726 | 3.31 (2.23–4.75) | 472 | 15,249 | 3.10 (2.83–3.38) | 1.38 (0.90–2.09) | 0.81 (0.53–1.26) | 1.55 (1.40–1.72) *** |
| Not sure | 2512 | 119,258 | 2.11 (2.03–2.19) | 378 | 74,839 | 0.51 (0.46–0.56) | 281 | 22,282 | 1.26 (1.12–1.41) | 2.39 (2.10–2.72) *** | 1.90 (1.59–2.26) *** | 1.23 (1.08–1.40) ** |
| Methadone treatment | ||||||||||||
| No | 6257 | 229,374 | 2.73 (2.66–2.80) | 635 | 140,895 | 0.45 (0.41–0.48) | 759 | 50,169 | 1.51 (1.41–1.62) | 2.18 (1.97–2.40) *** | 1.94 (1.70–2.21) *** | 1.26 (1.16–1.36) *** |
| Yes | 1649 | 36,400 | 4.53 (4.32–4.75) | 0 | 0 | - | 222 | 9195 | 2.41 (2.12–2.74) | - | - | 1.33 (1.14–1.54) *** |
| Date of HIV test | ||||||||||||
| Jan, 2008~Jun, 2008 | 80 | 2078 | 3.85 (3.10–4.74) | 0 | 116 | 0 (-) | 0 | 72 | 0 (-) | - | - | - |
| Jul, 2008~Dec, 2008 | 673 | 21,040 | 3.20 (2.97–3.44) | 3 | 2045 | 0.15 (0.05–0.35) | 13 | 1669 | 0.78 (0.46–1.26) | 9.08 (2.88–28.64) *** | 5.36 (1.40–20.56) * | 2.07 (1.17–3.65) * |
| Jan, 2009~ Jun, 2009 | 792 | 24,030 | 3.30 (3.07–3.53) | 6 | 1877 | 0.32 (0.15–0.62) | 10 | 1658 | 0.60 (0.33–1.03) | 3.16 (1.37–7.30) ** | 1.27 (0.39–4.11) | 2.32 (1.22–4.40) * |
| Jul, 2009~ Dec, 2009 | 626 | 24,894 | 2.51 (2.33–2.72) | 9 | 4416 | 0.20 (0.11–0.36) | 12 | 2533 | 0.47 (0.27–0.78) | 2.83 (1.42–5.65) ** | 1.74 (0.60–5.12) | 1.97 (1.10–3.54) * |
| Jan, 2010~ Jun, 2010 | 427 | 20936 | 2.04 (1.86–2.24) | 13 | 4150 | 0.31 (0.18–0.51) | 22 | 2591 | 0.85 (0.56–1.24) | 1.47 (0.82–2.65) | 1.86 (0.81–4.25) | 1.14 (0.73–1.79) |
| Jul, 2010~ Dec, 2010 | 395 | 18,062 | 2.19 (1.98–2.41) | 12 | 4176 | 0.29 (0.17–0.47) | 18 | 2435 | 0.74 (0.47–1.12) | 2.09 (1.14–3.81) * | 0.71 (0.27–1.85) | 1.64 (1.01–2.68) * |
| Jan, 2011~ Jun, 2011 | 364 | 16,181 | 2.25 (2.03–2.49) | 13 | 3846 | 0.34 (0.20–0.55) | 20 | 2391 | 0.84 (0.54–1.24) | 2.97 (1.60–5.53) ** | 1.92 (0.81–4.55) | 1.95 (1.22–3.12) ** |
| Jul, 2011~ Dec, 2011 | 304 | 13,425 | 2.26 (2.02–2.53) | 9 | 3388 | 0.27 (0.14–0.47) | 23 | 2262 | 1.02 (0.68–1.47) | 2.36 (1.16–4.79) * | 3.05 (1.26–7.42) * | 1.34 (0.86–2.10) |
| Jan, 2012~ Jun, 2012 | 352 | 14,519 | 2.42 (2.18–2.68) | 15 | 5091 | 0.29 (0.18–0.46) | 24 | 2802 | 0.86 (0.58–1.23) | 2.89 (1.65–5.05) *** | 1.49 (0.65–3.38) | 1.89 (1.22–2.91) ** |
| Jul, 2012~ Dec, 2012 | 350 | 13,360 | 2.62 (2.36–2.90) | 20 | 5595 | 0.36 (0.23–0.53) | 29 | 2943 | 0.99 (0.69–1.38) | 1.72 (1.03–2.87) * | 1.12 (0.53–2.38) | 1.64 (1.01–2.43) * |
| Jan, 2013~ Jun, 2013 | 372 | 14,420 | 2.58 (2.33–2.85) | 25 | 8207 | 0.30 (0.21–0.44) | 45 | 4127 | 1.09 (0.82–1.43) | 2.00 (1.26–3.16) ** | 1.87 (1.04–3.38) * | 1.46 (1.06–2.02) * |
| Jul, 2013~ Dec, 2013 | 514 | 16,439 | 3.13 (2.87–3.40) | 39 | 10,473 | 0.37 (0.27–0.50) | 72 | 4438 | 1.62 (1.29–2.02) | 2.43 (1.67–3.54) *** | 2.07 (1.25–3.43) ** | 1.32 (1.01–1.71) * |
| Jan, 2014~ Jun, 2014 | 422 | 14,687 | 2.87 (2.61–3.15) | 52 | 11,871 | 0.44 (0.33–0.56) | 78 | 5048 | 1.55 (1.24–1.91) | 1.57 (1.11–2.23) * | 1.83 (1.19–2.79) ** | 1.11 (0.86–1.44) |
| Jul, 2014~ Dec, 2014 | 606 | 14,769 | 4.1 (3.79–4.44) | 98 | 19,063 | 0.51 (0.42–0.62) | 129 | 6548 | 1.97 (1.66–2.32) | 2.32 (1.77–3.04) *** | 1.73 (1.23–2.44) ** | 1.60 (1.30–1.95) *** |
| Jan, 2015~ Jun, 2015 | 587 | 13,391 | 4.38 (4.04–4.75) | 82 | 20,191 | 0.41 (0.33–0.50) | 148 | 6666 | 2.22 (1.89–2.59) | 2.85 (2.13–3.81) *** | 2.28 (1.61–3.22) *** | 1.40 (1.15–1.70) ** |
| Jul, 2015~ Dec, 2015 | 561 | 13188 | 4.25 (3.92–4.61) | 155 | 20,902 | 0.74 (0.63–0.86) | 207 | 6361 | 3.25 (2.84–3.71) | 2.37 (1.87–3.00) *** | 2.56 (1.97–3.33) *** | 1.03 (0.87–1.22) |
| Jan, 2016~ Jun, 2016 | 481 | 10364 | 4.64 (4.24–5.06) | 84 | 15,488 | 0.54 (0.44–0.66) | 131 | 4820 | 2.72 (2.29–3.20) | 2.83 (2.11–3.78) *** | 1.73 (1.19–2.51) ** | 1.42 (1.16–1.75) ** |
| Region | ||||||||||||
| Southwest | 3589 | 60,507 | 5.93 (5.74–6.13) | 114 | 11,452 | 1.00 (0.83–1.19) | 300 | 7081 | 4.24 (3.78–4.73) | 2.47 (2.03–3.01) *** | 2.52 (1.96–3.25) *** | 1.36 (1.20–1.54) *** |
| Northwest | 812 | 29,397 | 2.76 (2.58–2.96) | 25 | 2047 | 1.22 (0.83–1.74) | 29 | 1346 | 2.15 (1.50–3.01) | 1.15 (0.75–1.77) | 1.00 (0.51–1.93) | 0.94 (0.63–1.40) |
| South | 2142 | 80,841 | 2.65 (2.54–2.76) | 147 | 23,049 | 0.64 (0.54–0.74) | 380 | 16256 | 2.34 (2.11–2.58) | 2.12 (1.75–2.55) *** | 1.99 (1.58–2.50) *** | 1.23 (1.09–1.39) ** |
| Northeast | 102 | 1703 | 5.99 (4.94–7.21) | 21 | 10,685 | 0.20 (0.13–0.29) | 39 | 933 | 4.18 (3.06–5.59) | 7.69 (3.21–18.38) *** | 4.32 (1.58–11.86) ** | 1.33 (0.88–2.00) |
| Central | 464 | 32,475 | 1.43 (1.3–1.56) | 155 | 24,522 | 0.63 (0.54–0.74) | 122 | 7180 | 1.70 (1.42–2.01) | 3.40 (2.66–4.34) *** | 2.60 (1.95–3.48) *** | 1.29 (1.04–1.61) * |
| North | 281 | 21,309 | 1.32 (1.17–1.48) | 54 | 12,712 | 0.42 (0.33–0.55) | 36 | 4601 | 0.78 (0.57–1.06) | 2.10 (1.49–2.95) *** | 1.00 (0.57–1.75) | 1.59 (1.10–2.30) * |
| East | 516 | 39,491 | 1.31 (1.2–1.42) | 119 | 56,420 | 0.21 (0.18–0.25) | 75 | 21,967 | 0.34 (0.27–0.42) | 3.04 (2.33–3.96) *** | 1.10 (0.73–1.64) | 2.46 (1.90–3.19) *** |
| Missing | 0 | 51 | 0(-) | 0 | 8 | 0(-) | 0 | 0 | - | - | - | - |
| Characteristics | DOG | SOG | DSG | |||
|---|---|---|---|---|---|---|
| OR (95% CI) | AOR (95% CI) | OR (95% CI) | AOR (95% CI) | OR (95% CI) | AOR (95% CI) | |
| Sex | ||||||
| Male | 1 | 1 | 1 | 1 | 1 | 1 |
| Female | 1.13 (1.05–1.21) ** | 1.17 (1.08–1.26) *** | 1.09 (0.89–1.33) | 1.34 (1.09–1.66) ** | 1.22 (1.03–1.46) * | 1.55 (1.29–1.86) *** |
| Age when first HIV test | ||||||
| ≤17 | 1 | 1 | 1 | 1 | - | - |
| 18~24 | 1.41 (0.77–2.57) | 1.66 (0.90–3.04) | 3.26 (0.81–13.18) | 3.82 (0.94–15.47) | 1 | 1 |
| 25~44 | 2.69 (1.48–4.88) ** | 3.78 (2.07–6.89) *** | 3.56 (0.89–14.30) | 4.90 (1.21–19.80) * | 1.96 (1.42–2.71) *** | 2.18 (1.56–3.04) *** |
| 45~ | 2.29 (1.26–4.16) ** | 3.69 (2.01–6.76) *** | 4.48 (1.09–18.33) * | 7.20 (1.73–29.89) ** | 2.55 (1.81–3.59) *** | 3.04 (2.10–4.39) *** |
| Missing | 6.82 (1.43–32.45) * | 4.84 (0.99–23.58) | 52.07 (4.48–605.62) ** | 30.63 (2.53–370.29) ** | - | - |
| Ethnicity | ||||||
| Han | 1 | 1 | 1 | 1 | 1 | 1 |
| Minority | 3.24 (3.09–3.40) *** | 2.87 (2.72–3.02) *** | 2.33 (1.81–3.01) *** | 1.68 (1.29–2.20) *** | 2.66 (2.23–3.16) *** | 1.87 (1.56–2.25) *** |
| Missing | 0.98 (0.88–1.09) | 1.11 (0.99–1.24) | 1.83 (1.47–2.27) *** | 1.32 (1.05–1.65) * | 1.61 (1.24–2.09) *** | 1.42 (1.08–1.86) * |
| Education | ||||||
| High school or above | 1 | 1 | 1 | 1 | 1 | 1 |
| Junior high school | 1.31 (1.19–1.44) *** | 1.34 (1.22–1.48) *** | 1.05 (0.84–1.33) | 1.05 (0.83–1.33) | 1.54 (1.19–1.97) ** | 1.41 (1.09–1.82) ** |
| Primary school or below | 2.25 (2.04–2.48) *** | 1.89 (1.70–2.09) *** | 1.55 (1.18–2.03) ** | 1.35 (1.03–1.78) * | 2.69 (2.07–3.50) *** | 1.97 (1.50–2.58) *** |
| Missing | 1.83 (1.58–2.11) *** | 1.75 (1.28–2.39) *** | 1.32 (0.74–2.37) | 1.07 (0.46–2.49) | 1.87 (1.12–3.12) * | 2.01 (1.08–3.73) * |
| Marital status | ||||||
| Married | 1 | 1 | 1 | 1 | 1 | 1 |
| Unmarried | 0.79 (0.75–0.83) *** | 0.83 (0.79–0.87) *** | 1.00 (0.85–1.18) | 0.98 (0.81–1.17) | 0.79 (0.68–0.90) ** | 0.82 (0.72–0.95) ** |
| Divorced or Widowed | 0.97 (0.90–1.05) | 0.92 (0.84–1.00) | 0.92 (0.66–1.28) | 0.94 (0.67–1.33) | 1.08 (0.88–1.33) | 1.06 (0.85–1.32) |
| Missing | 1.13 (0.99–1.28) | 1.22 (0.88–1.68) | 0.99 (0.47–2.09) | 1.94 (0.61–6.14) | 0.52 (0.23–1.18) | 0.82 (0.29–2.27) |
| Injection drug use | ||||||
| No | 1 | 1 | 1 | 1 | 1 | 1 |
| Yes | 4.34 (4.02–4.69) *** | 4.96 (4.58–5.37) *** | 9.55 (6.23–14.64) *** | 7.42 (4.79–11.48) *** | 3.03 (2.58–3.55) *** | 2.68 (2.28–3.17) *** |
| Not sure | 1.66 (1.53–1.80) *** | 1.53 (1.40–1.66) *** | 1.42 (1.20–1.67) *** | 1.16 (0.97–1.38) | 1.21 (1.02–1.44) * | 0.96 (0.80–1.15) |
| Methadone treatment | ||||||
| No | 1 | 1 | 1 | 1 | 1 | 1 |
| Yes | 1.69 (1.60–1.79) *** | 1.80 (1.69–1.91) *** | - | - | 1.61 (1.39–1.87) *** | 1.42 (1.21–1.67) *** |
| Date of HIV test | ||||||
| Jan, 2008~Jun, 2008 | 1 | 1 | - | - | - | - |
| Jul, 2008~Dec, 2008 | 0.83 (0.65–1.05) | 0.79 (0.62–1.01) | 1 | 1 | 1 | 1 |
| Jan, 2009~Jun, 2009 | 0.85 (0.67–1.08) | 0.80 (0.63–1.02) | 2.18 (0.55–8.74) | 2.32 (0.58–9.30) | 0.77 (0.34–1.77) | 0.83 (0.36–1.91) |
| Jul, 2009~Dec, 2009 | 0.64 (0.51–0.82) *** | 0.68 (0.53–0.87) ** | 1.39 (0.38–5.14) | 1.50 (0.40–5.55) | 0.61 (0.28–1.33) | 0.65 (0.29–1.45) |
| Jan, 2010~Jun, 2010 | 0.52 (0.41–0.66) *** | 0.51 (0.40–0.66) *** | 2.14 (0.61–7.51) | 2.39 (0.68–8.45) | 1.09 (0.55–2.17) | 1.12 (0.55–2.25) |
| Jul, 2010~Dec, 2010 | 0.56 (0.44–0.71) *** | 0.57 (0.44–0.73) *** | 1.96 (0.55–6.96) | 2.08 (0.58–7.45) | 0.95 (0.46–1.94) | 0.89 (0.43–1.85) |
| Jan, 2011~Jun, 2011 | 0.58 (0.45–0.74) *** | 0.55 (0.43–0.71) *** | 2.31 (0.66–8.11) | 2.53 (0.71–9.04) | 1.08 (0.53–2.17) | 0.93 (0.46–1.90) |
| Jul, 2011~Dec, 2011 | 0.58 (0.45–0.74) *** | 0.50 (0.39–0.65) *** | 1.81 (0.49–6.70) | 2.08 (0.55–7.80) | 1.31 (0.66–2.59) | 1.09 (0.54–2.19) |
| Jan, 2012~Jun, 2012 | 0.62 (0.49–0.80) *** | 0.55 (0.43–0.71) *** | 2.01 (0.58–6.96) | 2.18 (0.62–7.66) | 1.10 (0.56–2.17) | 0.87 (0.43–1.74) |
| Jul, 2012~Dec, 2012 | 0.67 (0.53–0.86) ** | 0.57 (0.44–0.74) *** | 2.44 (0.73–8.23) | 2.77 (0.81–9.50) | 1.27 (0.66–2.45) | 0.93 (0.47–1.82) |
| Jan, 2013~Jun, 2013 | 0.66 (0.52–0.85) ** | 0.53 (0.41–0.68) *** | 2.08 (0.63–6.90) | 2.33 (0.69–7.86) | 1.40 (0.76–2.61) | 0.96 (0.51–1.82) |
| Jul, 2013~Dec, 2013 | 0.81 (0.63–1.03) | 0.62 (0.48–0.79) *** | 2.54 (0.79–8.24) | 2.76 (0.84–9.08) | 2.10 (1.16–3.80) * | 1.28 (0.70–2.37) |
| Jan, 2014~Jun, 2014 | 0.74 (0.58–0.94) * | 0.54 (0.42–0.69) *** | 3.00 (0.93–9.60) | 3.22 (0.99–10.51) | 2.00 (1.11–3.61) * | 1.24 (0.68–2.28) |
| Jul, 2014~Dec, 2014 | 1.07 (0.84–1.36) | 0.82 (0.64–1.05) | 3.52 (1.11–11.11) * | 3.80 (1.18–12.21) * | 2.56 (1.44–4.54) ** | 1.49 (0.82–2.69) |
| Jan, 2015~Jun, 2015 | 1.15 (0.90–1.45) | 0.81 (0.63–1.04) | 2.78 (0.88–8.79) | 3.07 (0.95–9.89) | 2.89 (1.64–5.11) *** | 1.55 (0.86–2.80) |
| Jul, 2015~Dec, 2015 | 1.11 (0.87–1.41) | 0.86 (0.67–0.11) | 5.09 (1.62–15.95) ** | 4.75 (1.49–15.20) ** | 4.29 (2.44–7.52) *** | 2.21 (1.24–3.97) ** |
| Jan, 2016~Jun, 2016 | 1.22 (0.96–1.55) | 0.96 (0.75–1.24) | 3.71 (1.17–11.75) * | 3.90 (1.21–12.58) * | 3.56 (2.01–6.31) *** | 1.76 (0.97–3.17) |
| Region | ||||||
| Southwest | 1 | 1 | 1 | 1 | 1 | 1 |
| Northwest | 0.45 (0.42–0.49) *** | 0.50 (0.46–0.54) *** | 1.23 (0.80–1.90) | 1.21 (0.78–1.88) | 0.50 (0.34–0.73) *** | 0.60 (0.40–0.88) * |
| South | 0.43 (0.41–0.46) *** | 0.43 (0.40–0.45) *** | 0.64 (0.50–0.82) *** | 0.70 (0.55–0.91) ** | 0.54 (0.46–0.63) *** | 0.64 (0.54–0.75) *** |
| Northeast | 1.01 (0.83–1.24) | 0.83 (0.67–1.02) | 0.20 (0.12–0.31) *** | 0.19 (0.12–0.31) *** | 0.99 (0.70–1.39) | 0.90 (0.63–1.28) |
| Central | 0.23 (0.21–0.25) *** | 0.20 (0.18–0.22) *** | 0.63 (0.50–0.81) *** | 0.63 (0.49–0.82) *** | 0.39 (0.32–0.48) *** | 0.44 (0.35–0.55) *** |
| North | 0.21 (0.19–0.24) *** | 0.29 (0.25–0.32) *** | 0.42 (0.31–0.59) *** | 0.45 (0.32–0.62) *** | 0.18 (0.13–0.25) *** | 0.22 (0.15–0.31) *** |
| East | 0.21 (0.19–0.23) *** | 0.20 (0.18–0.22) *** | 0.21 (0.16–0.27) *** | 0.25 (0.19–0.33) *** | 0.08 (0.06–0.10) *** | 0.10 (0.08–0.13) *** |
| Missing | - | - | - | - | - | - |
© 2020 by the authors. Licensee MDPI, Basel, Switzerland. This article is an open access article distributed under the terms and conditions of the Creative Commons Attribution (CC BY) license (http://creativecommons.org/licenses/by/4.0/).
Share and Cite
Zhang, B.; Yan, X.-Y.; Li, Y.-J.; Liu, Z.-M.; Lu, Z.-H.; Jia, Z.-W. Epidemics of HIV Infection among Heavy Drug Users of Depressants Only, Stimulants Only, and Both Depressants and Stimulants in Mainland China: A Series, Cross-Sectional Studies. Int. J. Environ. Res. Public Health 2020, 17, 5483. https://doi.org/10.3390/ijerph17155483
Zhang B, Yan X-Y, Li Y-J, Liu Z-M, Lu Z-H, Jia Z-W. Epidemics of HIV Infection among Heavy Drug Users of Depressants Only, Stimulants Only, and Both Depressants and Stimulants in Mainland China: A Series, Cross-Sectional Studies. International Journal of Environmental Research and Public Health. 2020; 17(15):5483. https://doi.org/10.3390/ijerph17155483
Chicago/Turabian StyleZhang, Bo, Xiang-Yu Yan, Yong-Jie Li, Zhi-Min Liu, Zu-Hong Lu, and Zhong-Wei Jia. 2020. "Epidemics of HIV Infection among Heavy Drug Users of Depressants Only, Stimulants Only, and Both Depressants and Stimulants in Mainland China: A Series, Cross-Sectional Studies" International Journal of Environmental Research and Public Health 17, no. 15: 5483. https://doi.org/10.3390/ijerph17155483
APA StyleZhang, B., Yan, X.-Y., Li, Y.-J., Liu, Z.-M., Lu, Z.-H., & Jia, Z.-W. (2020). Epidemics of HIV Infection among Heavy Drug Users of Depressants Only, Stimulants Only, and Both Depressants and Stimulants in Mainland China: A Series, Cross-Sectional Studies. International Journal of Environmental Research and Public Health, 17(15), 5483. https://doi.org/10.3390/ijerph17155483