1. Introduction
The subway is a major transportation system in South Korea used by approximately eight million commuters per day [
1,
2]. In order to secure a comfortable environment for passengers, it is important to investigate air quality in the system [
3]. While the subway has provided environmentally sustainable transit by reducing traffic congestion on the road, it has become evident that subway systems have air pollution problems. Such problems may present potential health risks to commuters and working staff because the concentration level of particulate matter (PM
10) is generally higher than that above ground, proven by published studies [
4,
5,
6,
7,
8,
9,
10].
According to many researchers, most aerosol particles in subway tunnels are by-products of friction between the wheels of an operating subway car and the train rails. Unlike pollutants above ground, particulate matter in subway tunnels is generally composed of metals such as iron, copper, magnesium, zinc, silicon, barium, and manganese [
7,
11,
12,
13,
14]. Additionally, air pollutants are carried by natural air circulation or commuters. The government has been diversifying its efforts to improve the air quality of subway systems by installing air purifiers, installing wind guard doors, and conducting national research projects [
15,
16,
17,
18]. Unfortunately, increased amounts of PM
10 have been deteriorating lung function and causing respiratory difficulties [
19,
20,
21,
22,
23]. It is clear that investigating the contamination level of air quality in subways, especially with PM
10, is required to provide basic data for establishing an improvement plan.
In this study, an Internet of Things (IoT)-based air quality monitoring system was developed to monitor particulate matter and was implemented in a subway tunnel in Incheon, South Korea. The main purpose of this system was to monitor particulate matter in real-time and to analyze the condition of PM10. In this study, IoT technology was used to measure and transmit air quality data, while cloud computing technology was applied to analyze and store data. In addition, an instant alert system was developed to inform personnel to take immediate action when a change in air quality was detected.
2. IoT-Based Air Quality Monitoring System
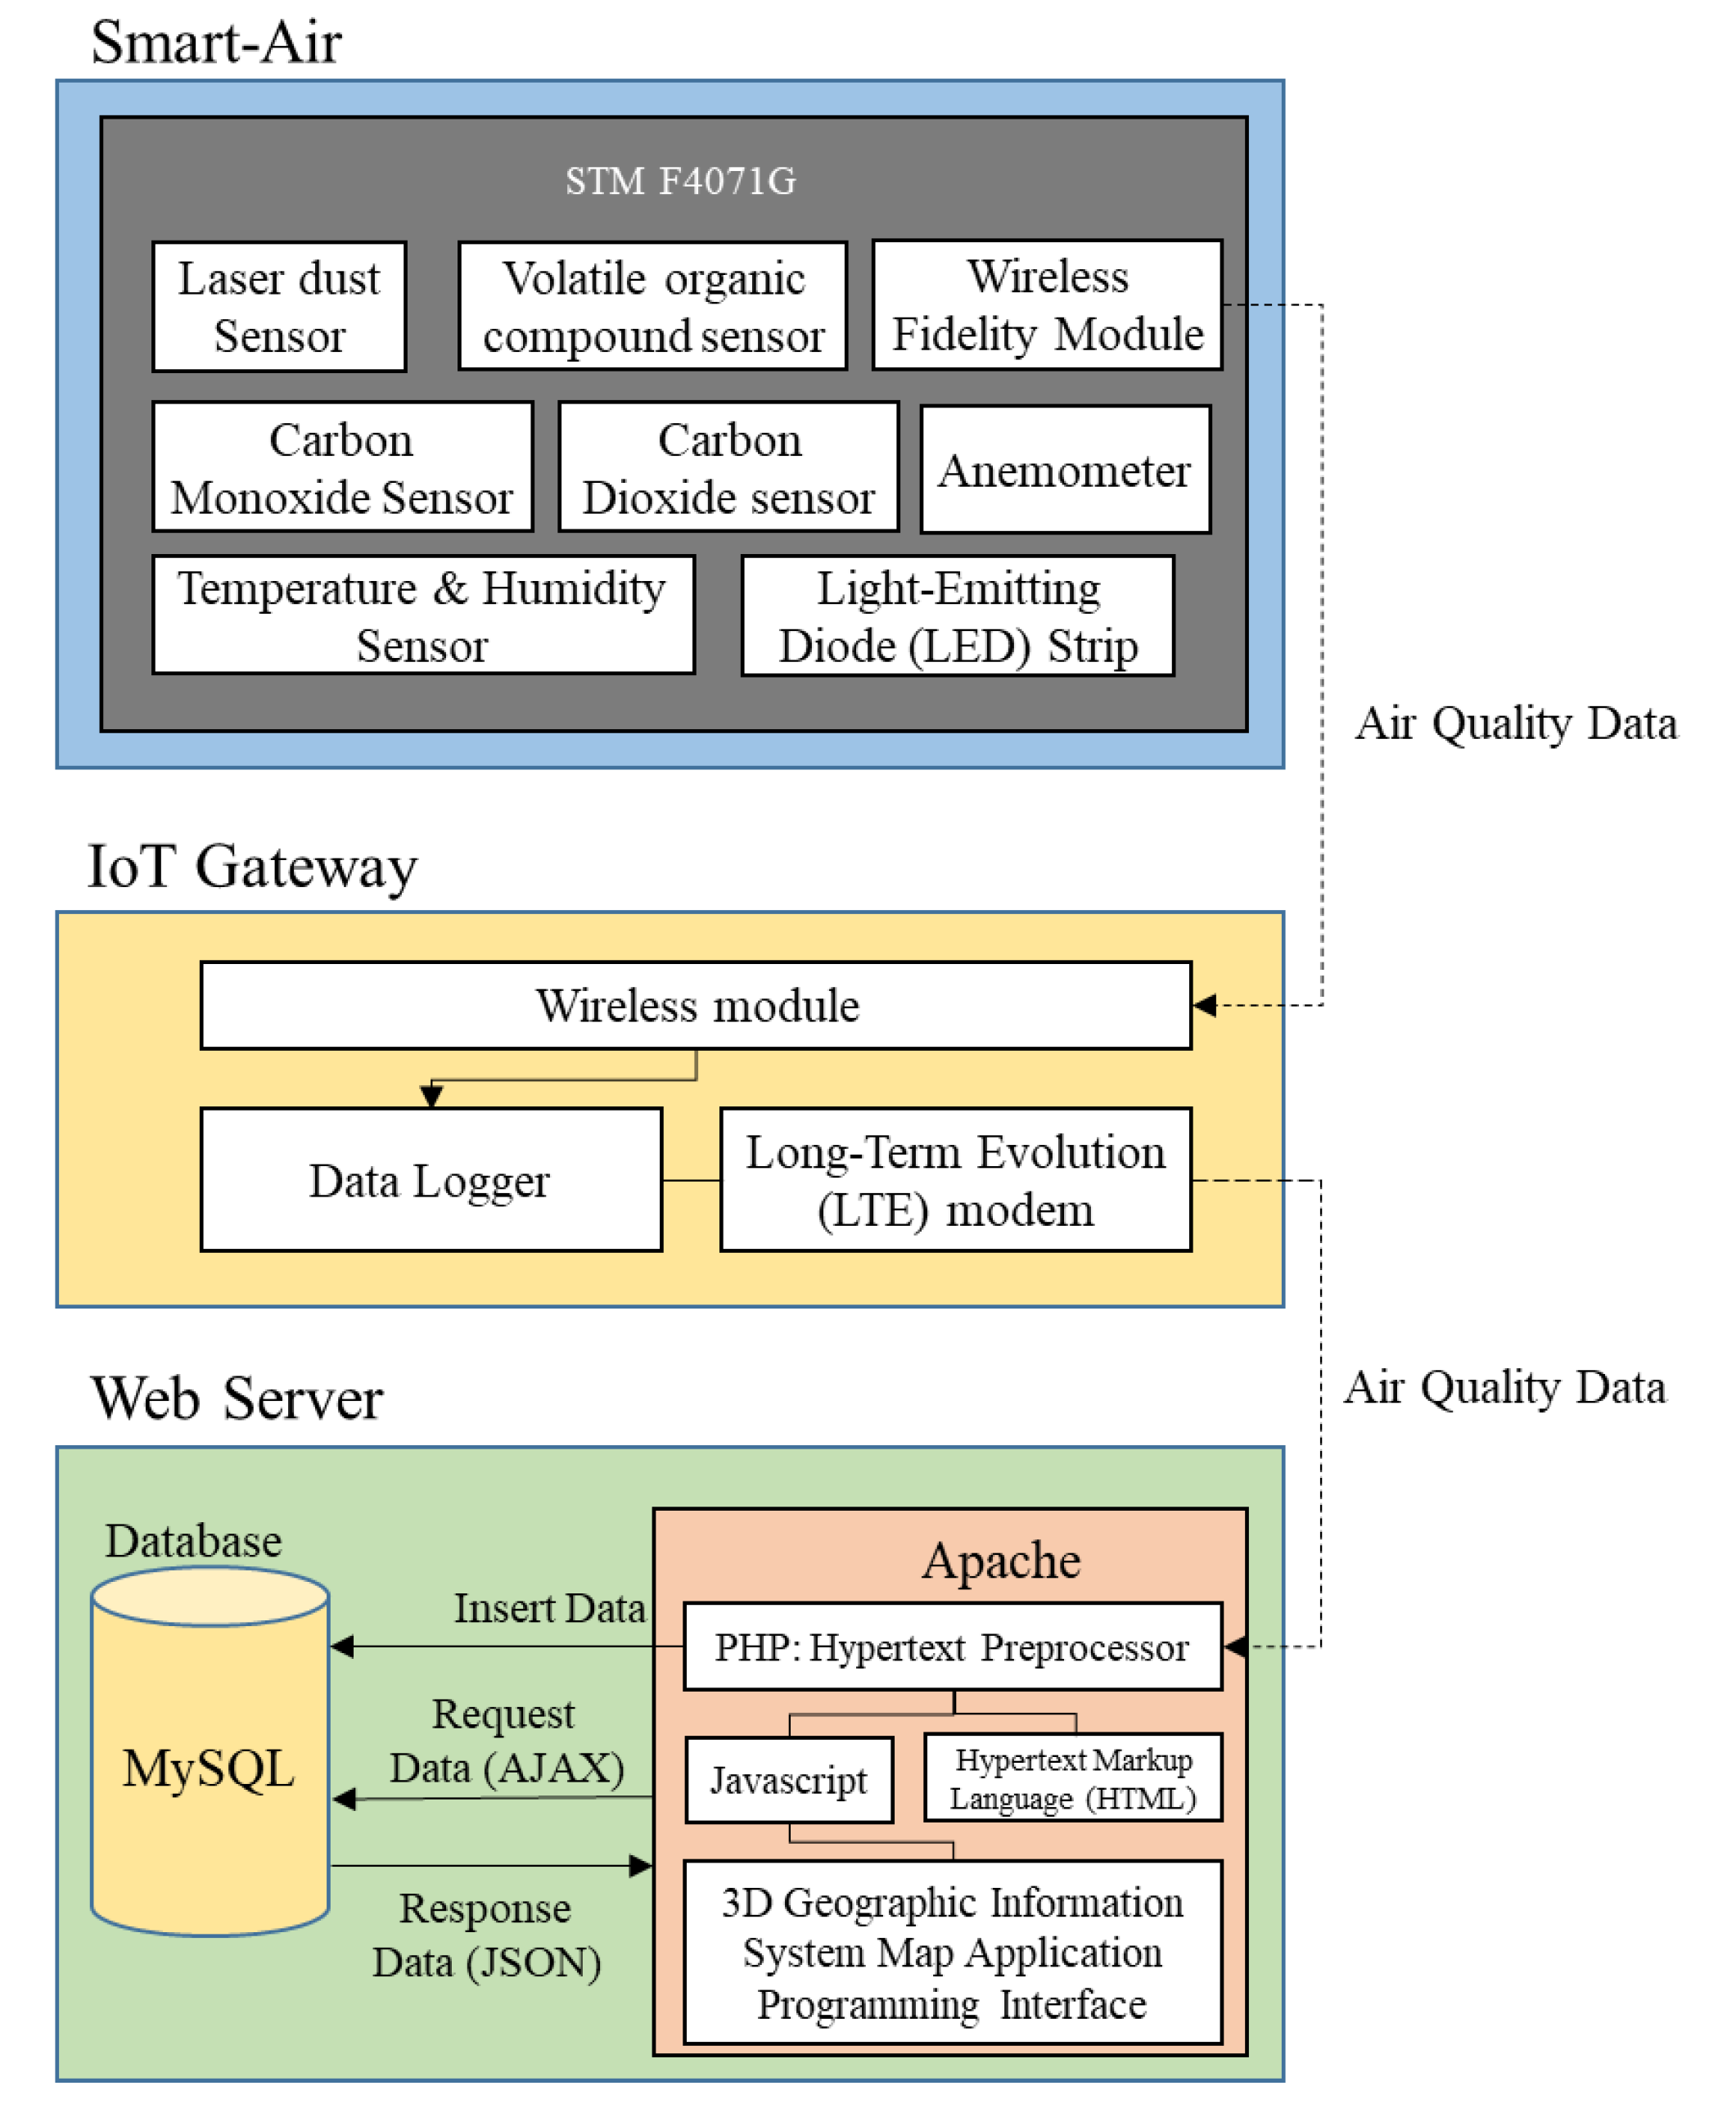
In order to monitor air quality accurately and efficiently in real-time, an IoT-based air quality monitoring system was developed for subway tunnels to monitor air quality by measuring the concentration levels of particulate matter. As shown in
Figure 1, the system was primarily divided into three parts: A Smart-Air device, an IoT gateway, and a cloud computing-based web server. We used Smart-Air devices for the measurement of PM
10 to monitor and determine air quality in subway tunnels. The gateway was used as a bridge, wirelessly connecting the Smart-Air device with the web server. The web server allowed us to analyze and determine air quality conditions. It has the ability to calculate the Air Quality Index (AQI) for particulate matter, to visualize the concentrations of each pollutant, and to store the data for further analysis [
24].
2.1. Smart-Air
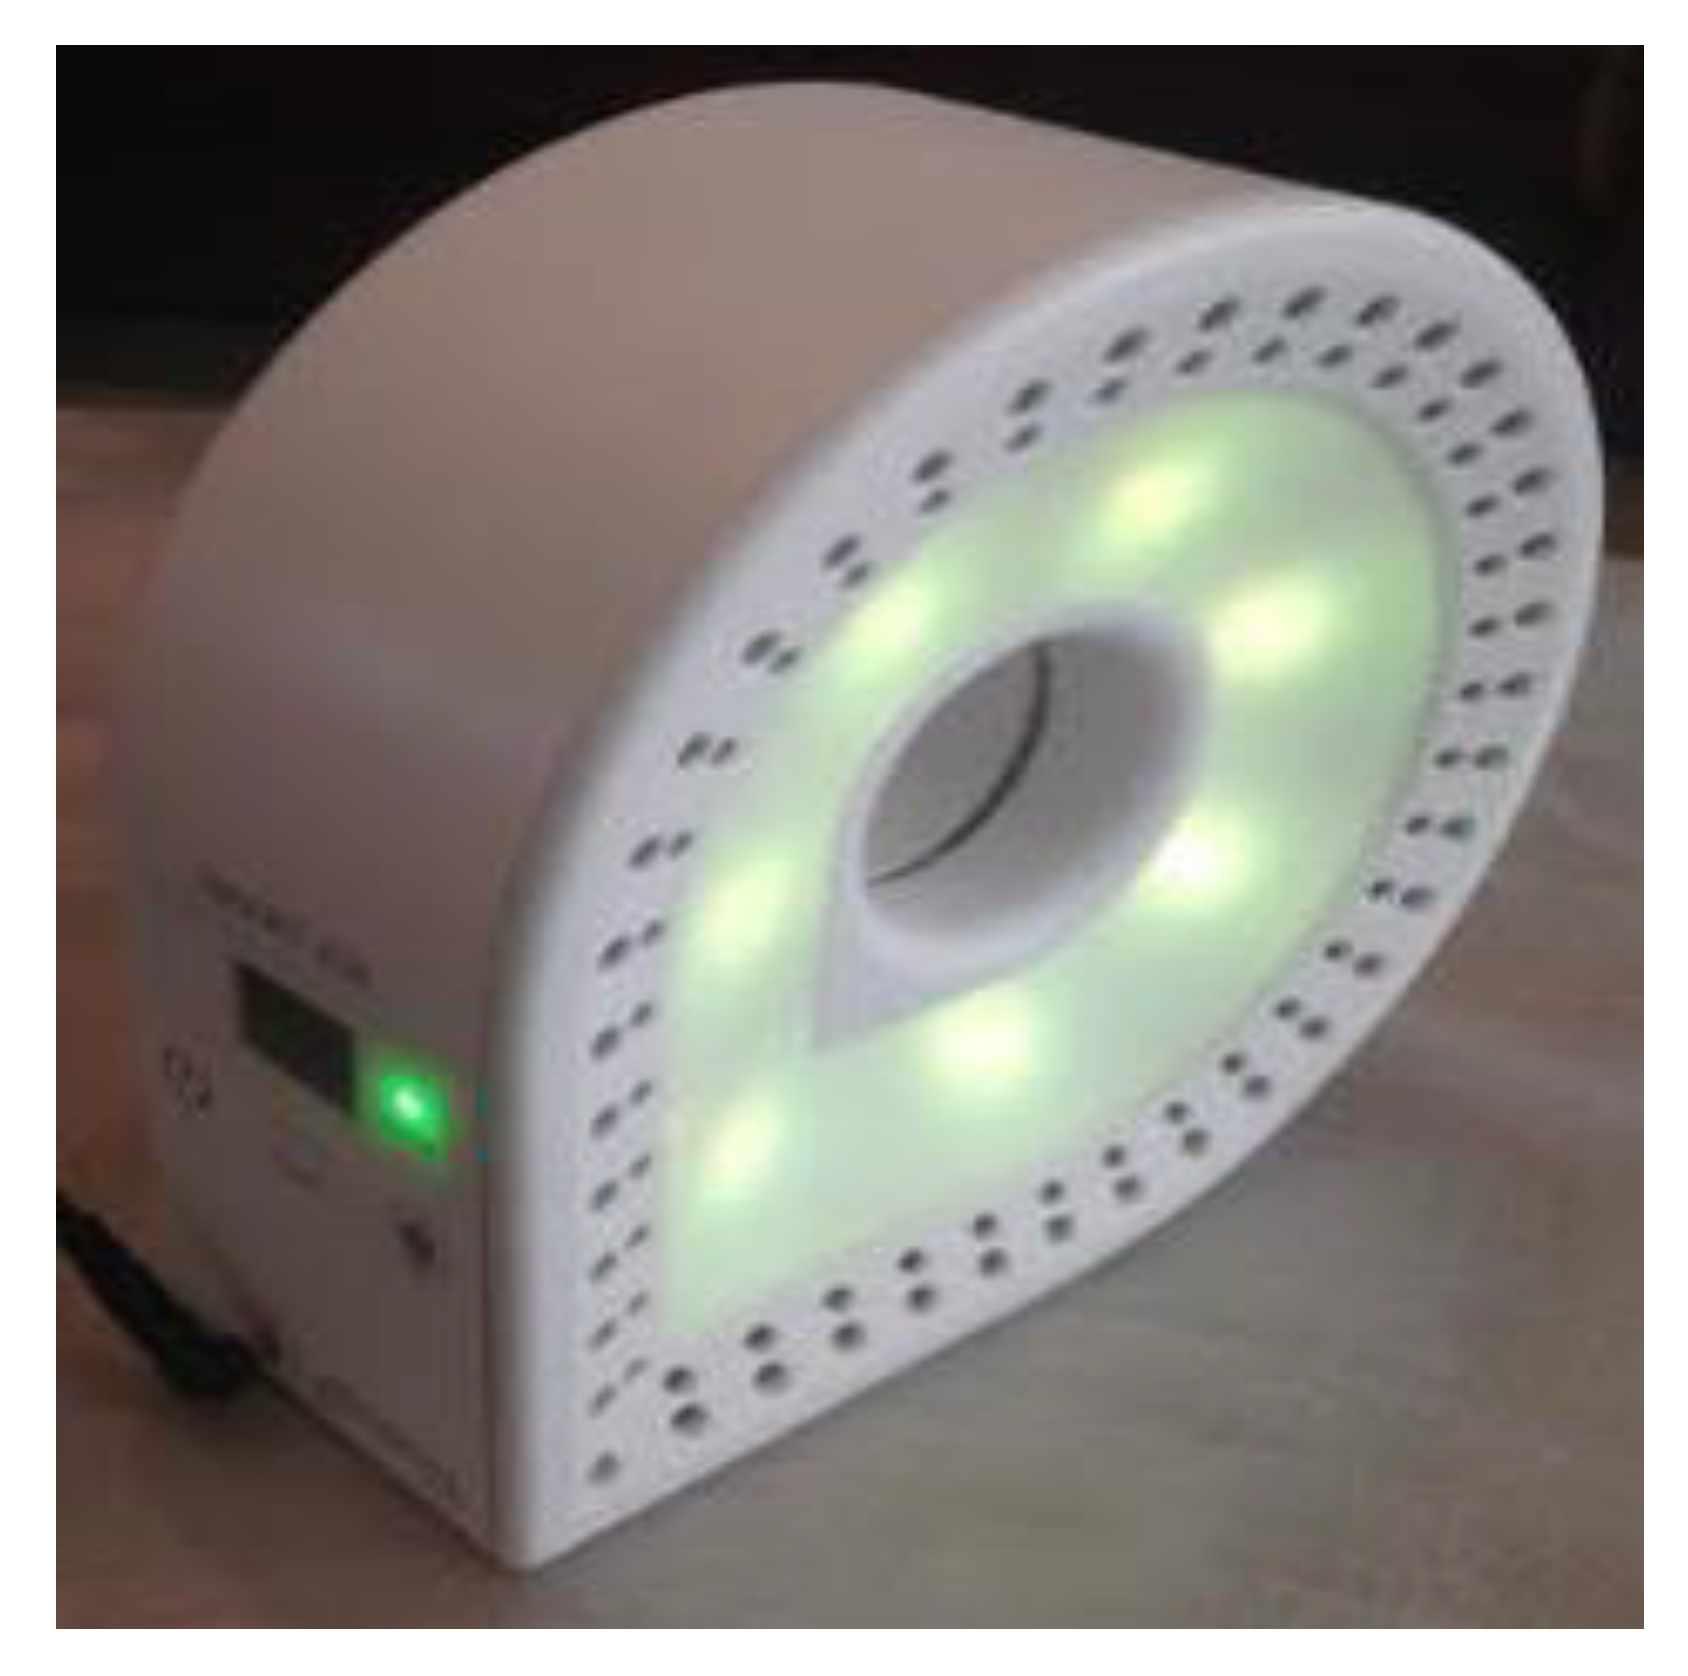
The Smart-Air device is an air quality monitoring device from Smart-Is that is designed to monitor indoor air quality with accuracy and reliability by using an expandable interface as shown in
Figure 2. Therefore, multiple sensors can be easily installed or edited according to monitoring requirements. Moreover, a Light-Emitting Diode (LED) strip mounted in the device displays different colors to indicate the condition of air quality in real-time. The color code for this display is defined by AQI.
Since the Smart-Air device has an expandable interface, it can measure any pollutants, including other particulate matter beyond PM
10, through installation of appropriate sensors in the device. In addition, it is possible to install several devices to expand coverage when the monitoring area is too large for only one device. However, the device was designed to measure concentrations of PM
10, and a laser dust sensor mounted in the device was used in the research. In the device, a laser dust sensor (PM 2007, from Wuhan Cubic Opto-electronics Co.) was installed to measure particle sizes from 0.3 to 10 μm. The sensor was successfully verified for reliability by following the prescribed procedure from the Ministry of Environment, Korea [
24].
To test the reliability of the laser dust sensor mounted in the device, a combination of a chamber experiment and field test were performed based on concentration of particulate matter. The sensor data on the Smart-Air device were compared to a different certified particulate matter measurement device to test the reliability. The Korean Ministry of Environment recommended and requested that light-scattering particulate matter measurement device from GRIMM Aerosol Technik Ainring GmbH & Co. KG was used due to its ability to detect concentration of particulate matter by a light-scattering method, the most reliable method for detection. Three Smart-Air devices and a GRIMM 1109 device were placed in an acrylic chamber. Then, external air was injected at a rate of 1L/min and then 2.5L/min. Data were measured at 1, 30, and 60 min marks as seen in
Table 1. The readings of the Smart-Air devices were compared to those of the GRIMM 1109 device to assess the reliability of the Smart-Air devices [
24].
In each experiment, the three Smart-Air devices, labeled Smart-Air (a), Smart-Air (b), and Smart-Air(c), measured the concentration of particulate matter. The three devices showed constant and stable values. In addition, the devices were very similar to the GRIMM 1109 device. At 1L/min and 30 min, the Smart-Air devices and GRIMM 1109 device both measured 93 μg/m. At 2.5L/min and 30 min, the Smart-Air devices and GRIMM 1109 device measured a similar concentration of 97 μg/m. As shown through the experiments, the Smart-Air devices measured similar concentrations of fine dust to the GRIMM 1109 device. This indicates that the laser dust sensor on Smart-Air devices has a high reliability [
24].
2.2. IoT Gateway
Since multiple Smart-Air devices were installed for monitoring, a wireless network was required to connect the devices with the web server. The IoT gateway gathers data from multiple devices and transmits the data to the web server for monitoring purposes. The gateway consists of a wireless module and a data logger to transmit and gather the sensing data. Two types of wireless modules are mounted in the gateway: a Wi-Fi module and a Long-Term Evolution (LTE) module. The data from each device are gathered via Wi-Fi and transferred in the form of Transmission Control Protocol/Internet Protocol (TCP/IP) packets to the web server via LTE. Then, the data are analyzed through the web server for visualization while being saved in a database.
2.3. Web Server
The web server is designed to visualize concentrations of each pollutant and to calculate AQI for particulate matter. The web server stores data in the database to support future analysis that may be required, such as for monthly or annual air quality monitoring analysis.
In this research, the cloud-computing-based web server from Amazon Web Services (AWS) was used to manage measurement of the air quality efficiently and effectively. AWS is a certified commercial cloud computing platform that offers open source libraries for various applications, such as an alarming service and a cloud storage service. Thus, using AWS reduces the time and cost needed to create customized versions of these applications. In addition, AWS provides the highest standard of security to protect data stored in the database.
For research, an Apache web server was designed with a web programming language called hypertext preprocessor, while MySQL was used as the database. Moreover, EC2 (elastic compute cloud) was used for programming interfaces to support configuration of the virtual machine instance and dynamic instantiation. For an extensible instance among EC2, a t2.medium server was used for the web server with the specifications shown in
Table 2 [
25,
26].
3. Methods
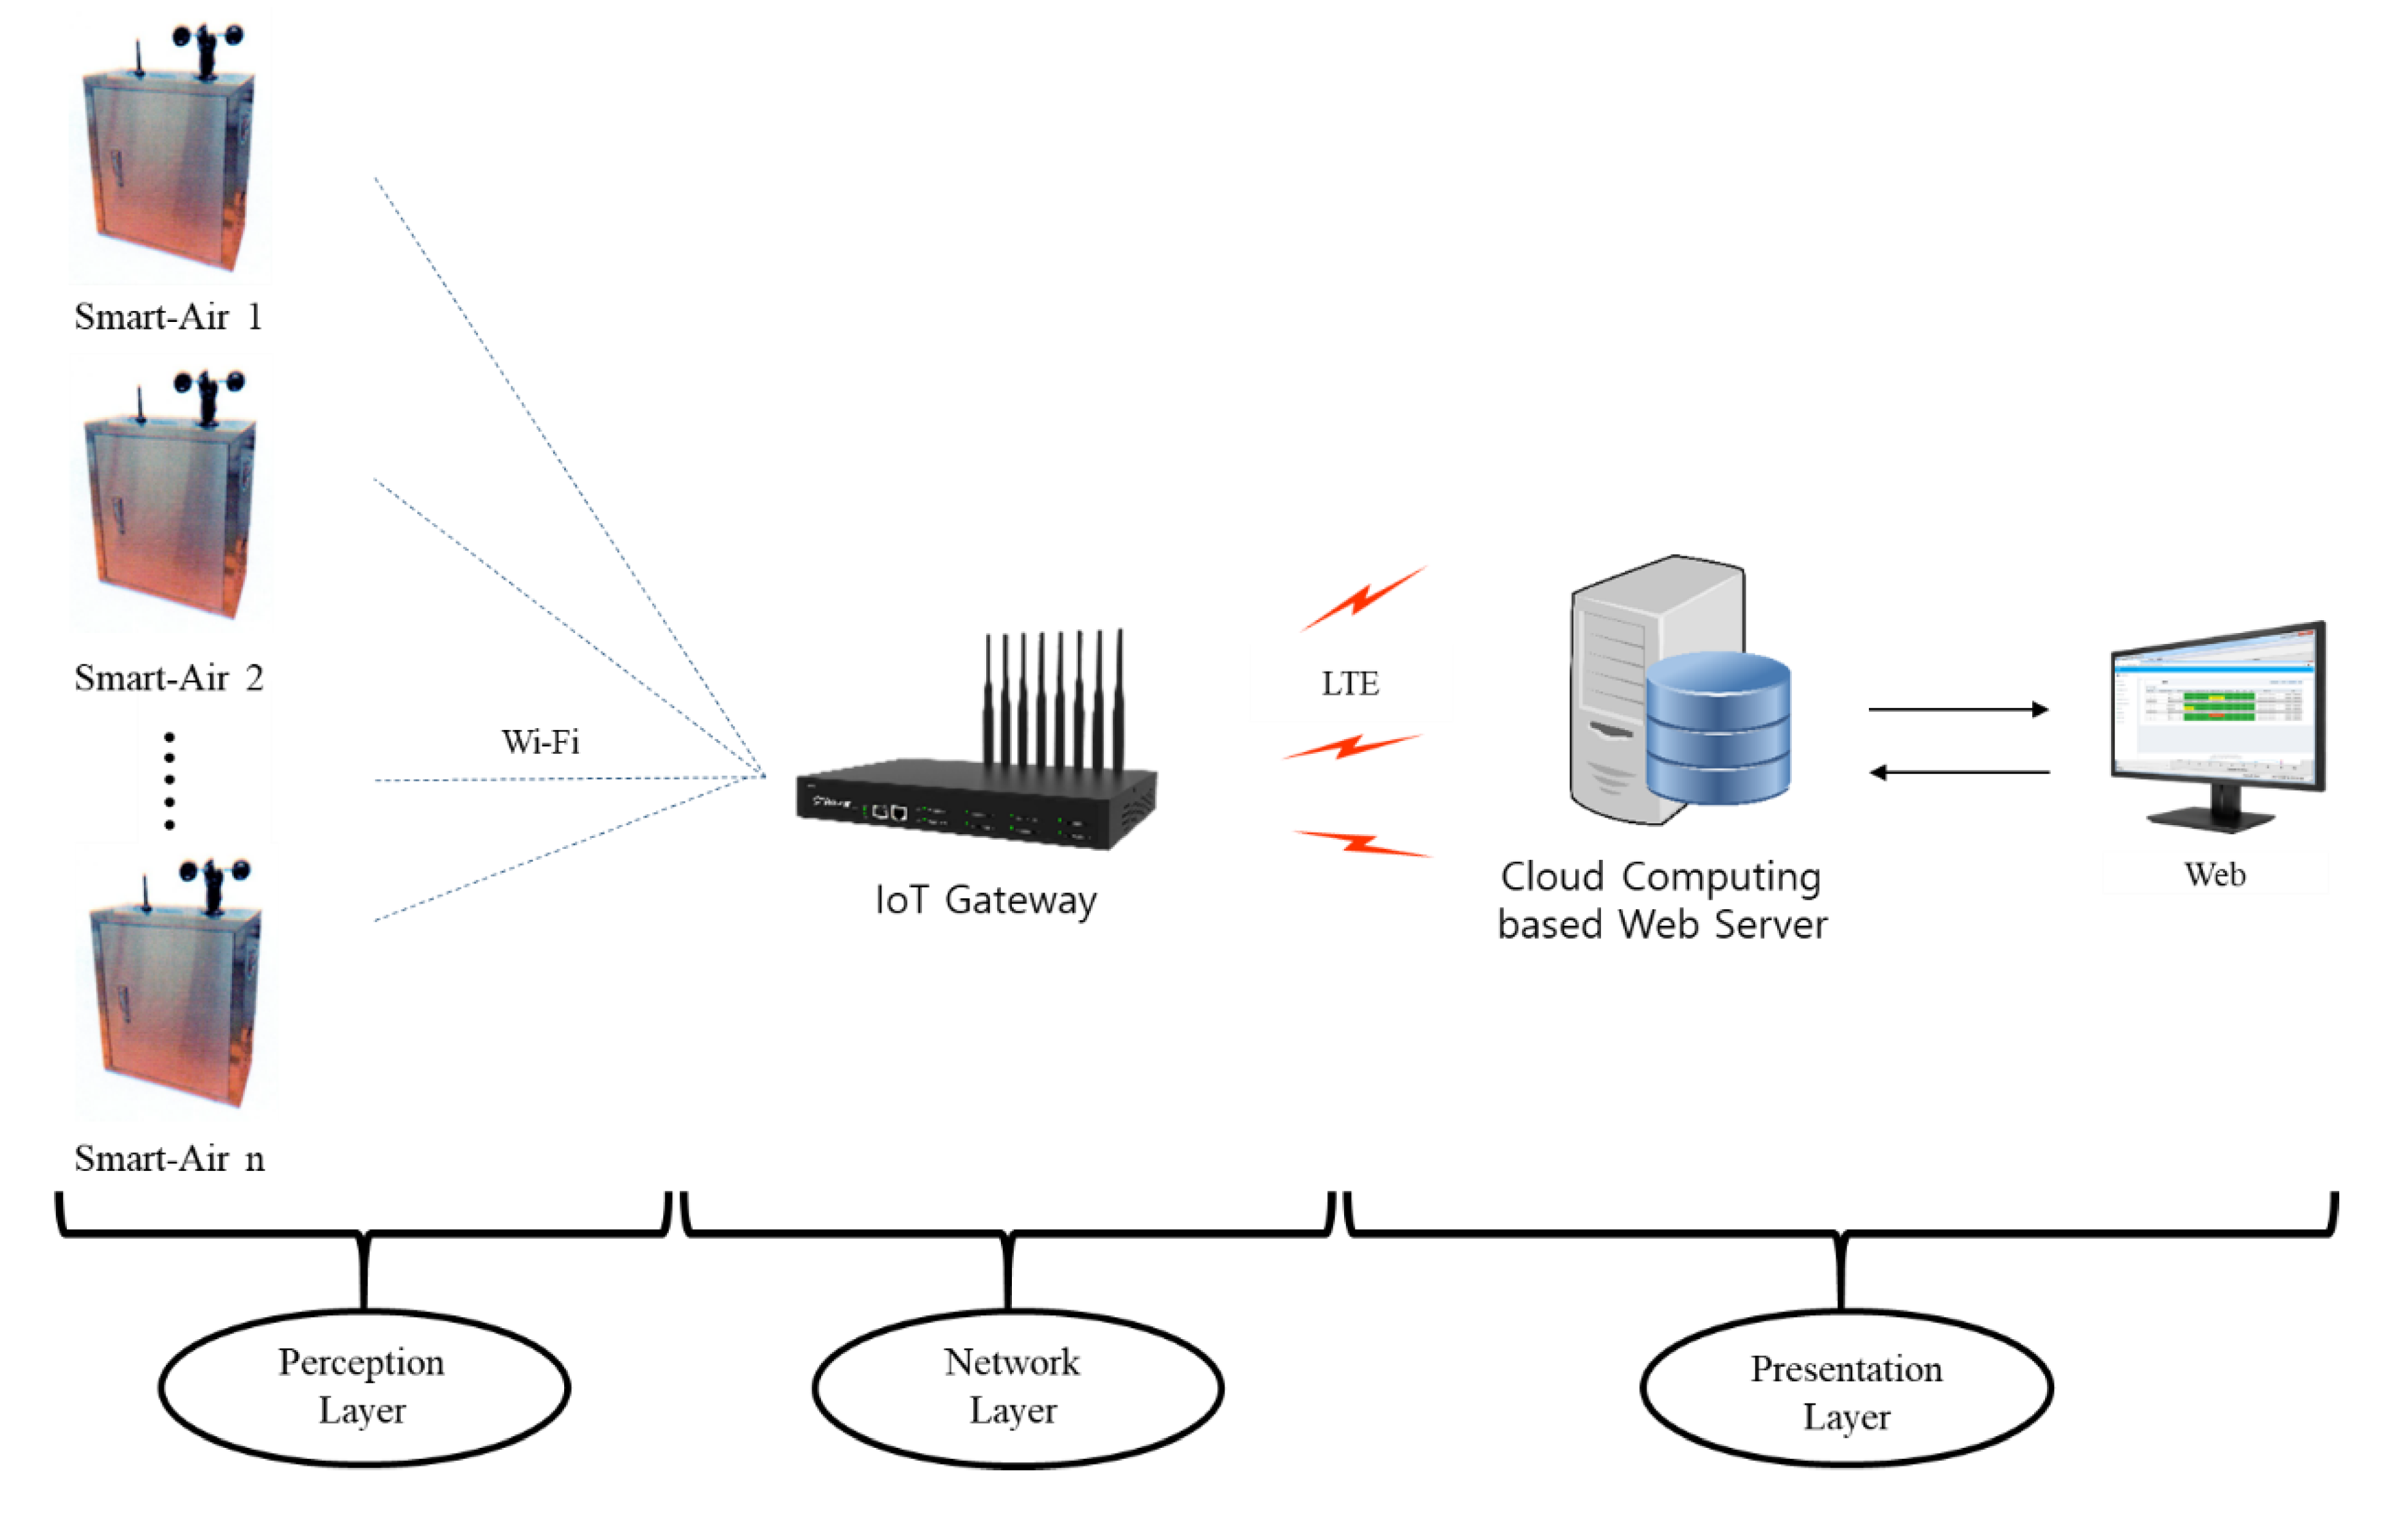
The monitoring method in this study was based on the IoT monitoring platform. The IoT platform is a network of physical devices that interconnects objects within systems, using networking technologies to make more intelligent interactions between each object [
27]. By integrating IoT technology into a monitoring platform, sensors are directly connected with a monitoring system to provide real-time analysis of particulate matter in the tunnel. The IoT platform comprises three main components: a perception layer, a network, and a presentation layer, as shown in
Figure 3 [
28,
29,
30]. For the perception layer, multiple Smart-Air devices were used to detect air quality, with a focus on particulate matter. The measurements collected from the Smart-Air devices were transmitted to the gateway via Wi-Fi. The gateway was the network layer of the platform, and the Smart-Air devices were connected to the cloud computing web server via LTE. Then, the web server analyzed the received data to determine air quality and visualize the AQI for particulate matter. Using the cloud server, managers or related personnel could monitor particulate matter levels at any time, from anywhere.
This research focused on implementing an IoT-based air quality monitoring system in subway tunnels. An additional research goal was to analyze the contamination level and determine the state of the air quality regarding particulate matter in the tunnel. The experiment was performed between January 2017 and January 2019 in selected subway tunnels in Incheon, South Korea.
3.1. Monitoring Locations
Between 2012 and 2017, the South Korean government implemented a subway facility maintenance project to enhance air quality in subway stations [
1]. The maintenance included installing air purifiers, replacing asbestos used in the tunnels, installing screen doors and wind guard doors to block the inflow of fresh air from outside, and improving the filter system. By 2018, the ventilation operating time was changed to 20 h per day, and stations began to stop the ventilation system temporarily (to block airflow from outside of the tunnel) when the concentration of particulate matter was 150 µg/m
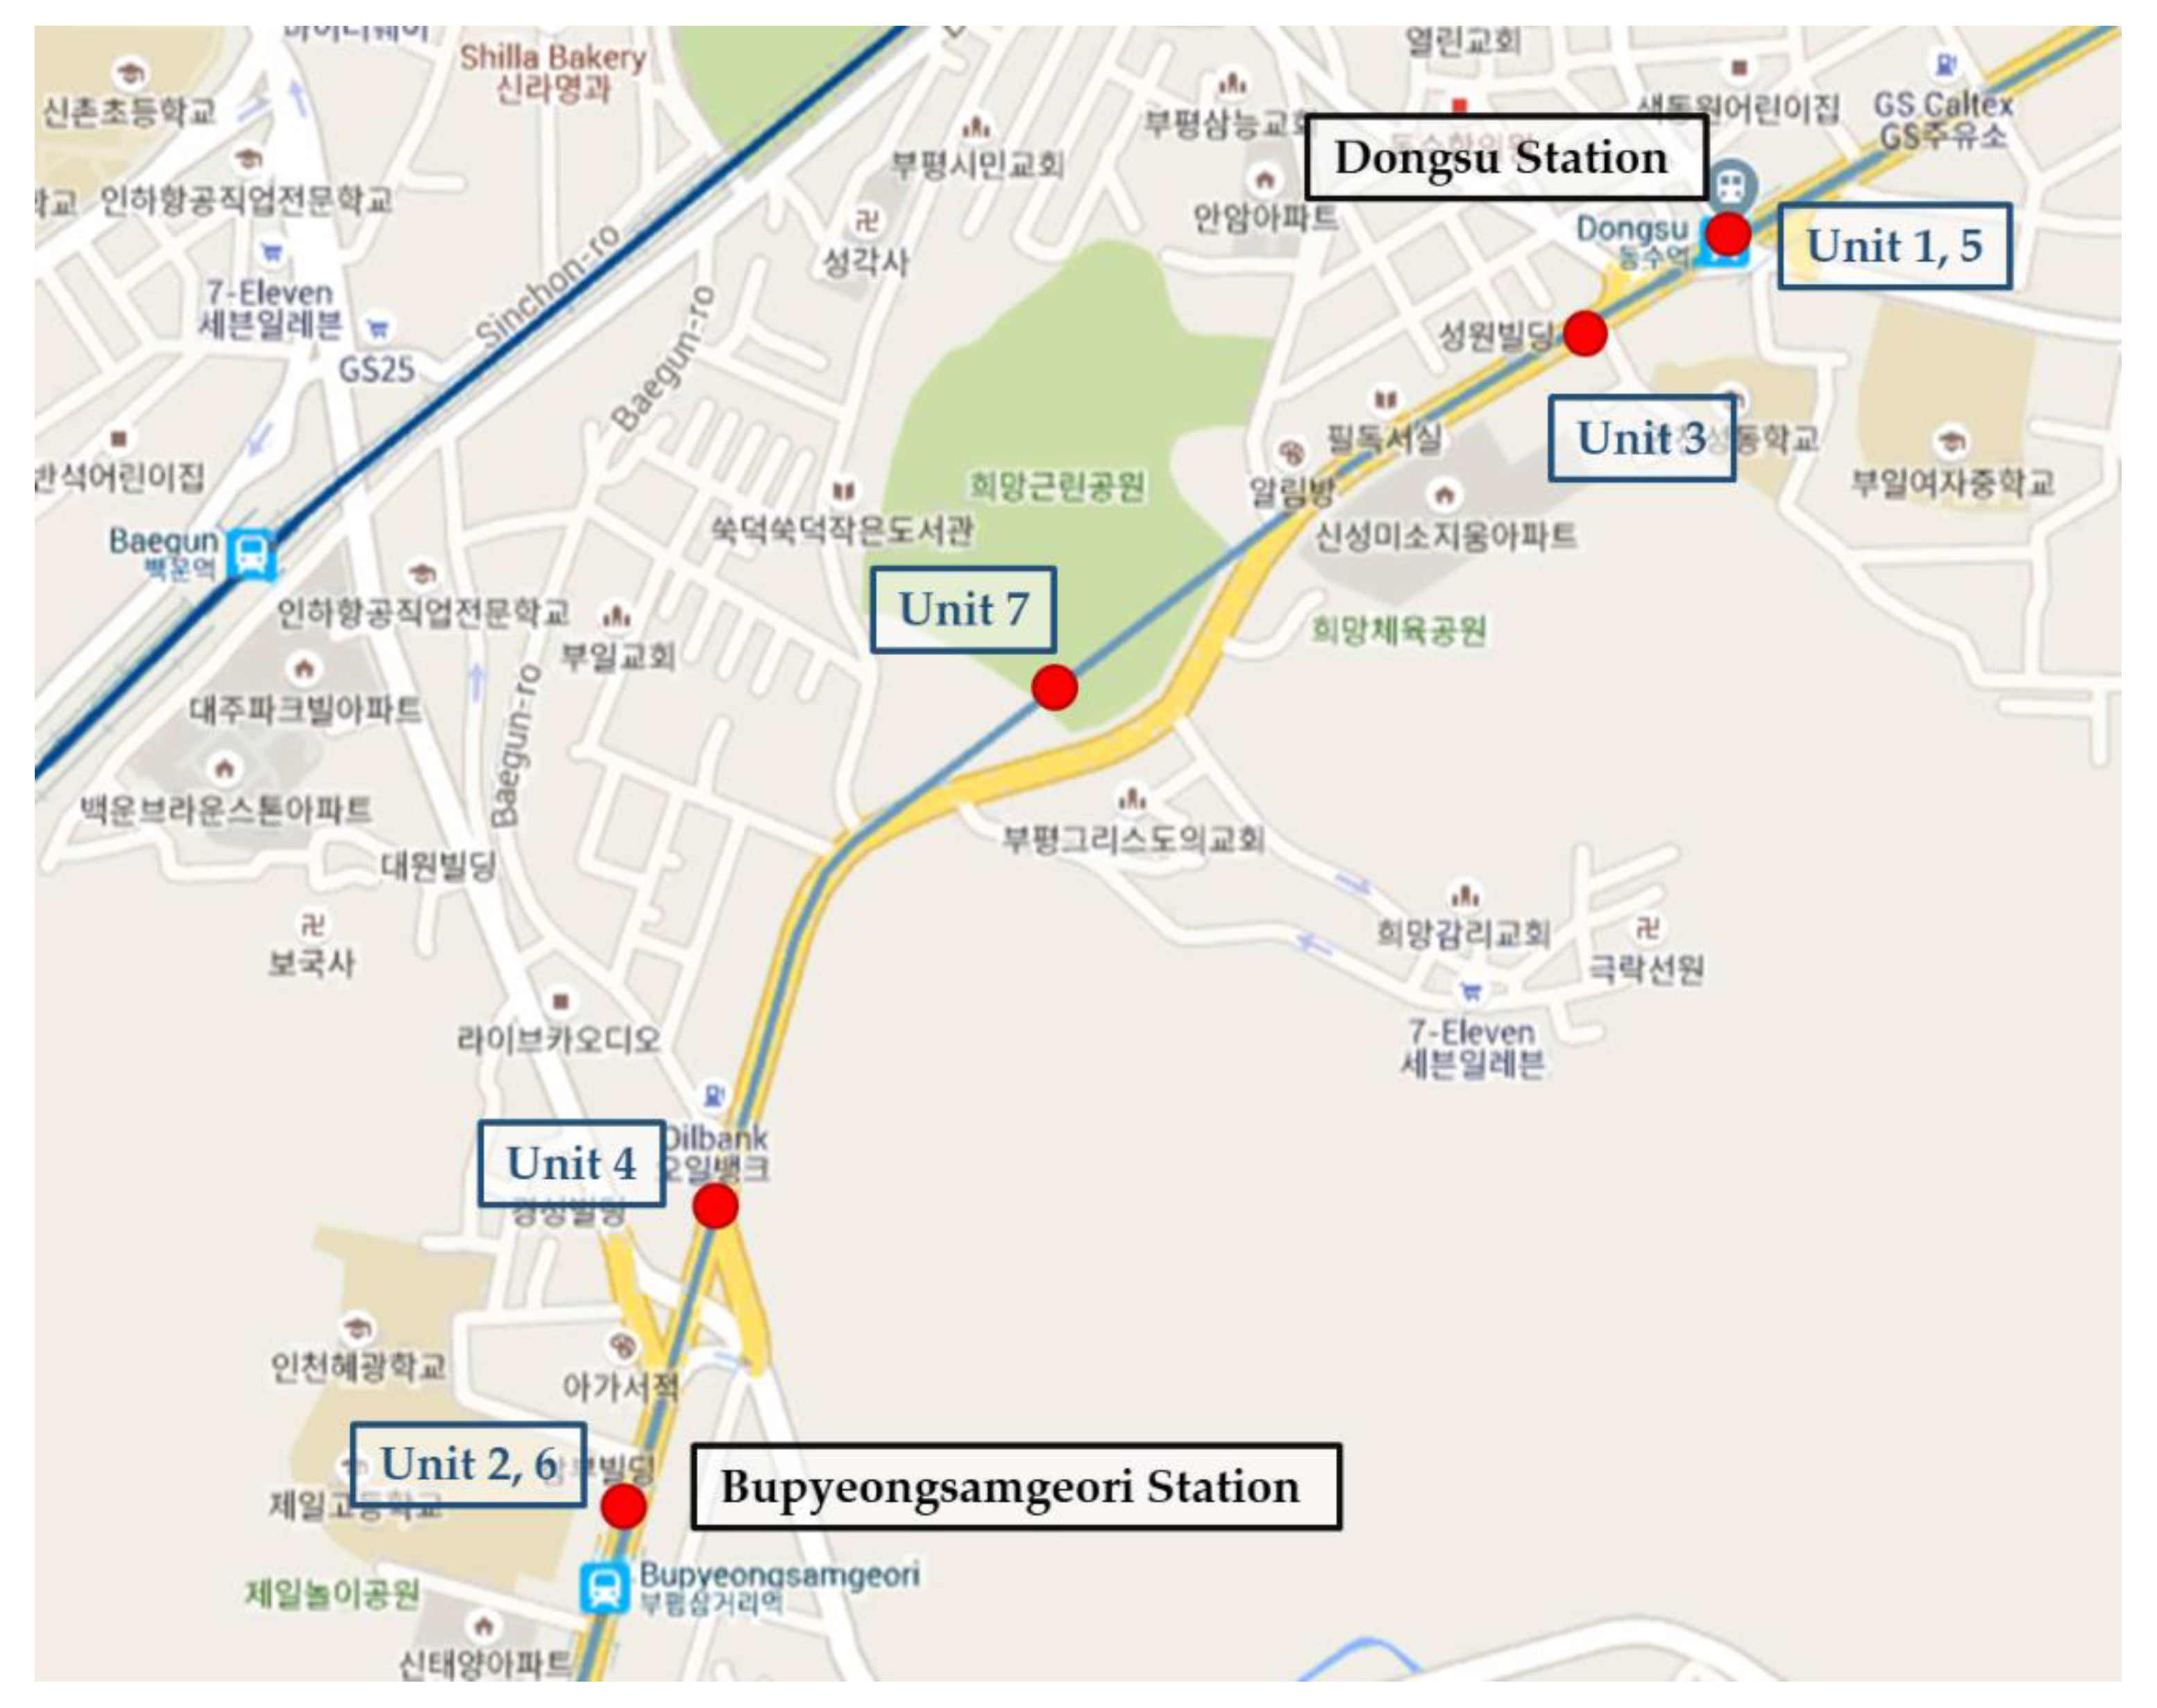
3 or more outside. Since Smart-Air devices were installed and collected data between Bupyeongsamgeori station and Dongsu station, we analyzed the change in the concentration level of particulate matter in the tunnel in the course of the maintenance project.
For this research, seven Smart-Air devices were installed from Bupyeongsamgeori station to Dongsu station as shown in
Figure 4. Two devices (units 1 and 2) were installed at the center of each station platform to monitor the air quality of the platforms. Two other devices (units 3 and 4) were installed on the starting points of each tunnel to collect data as trains entered or left the stations. In addition, two devices (units 5 and 6) were installed near the central ventilation rooms of each station, and the last device (unit 7) was installed in the center of the tunnel to measure the change in values when train speeds were at their maximum.
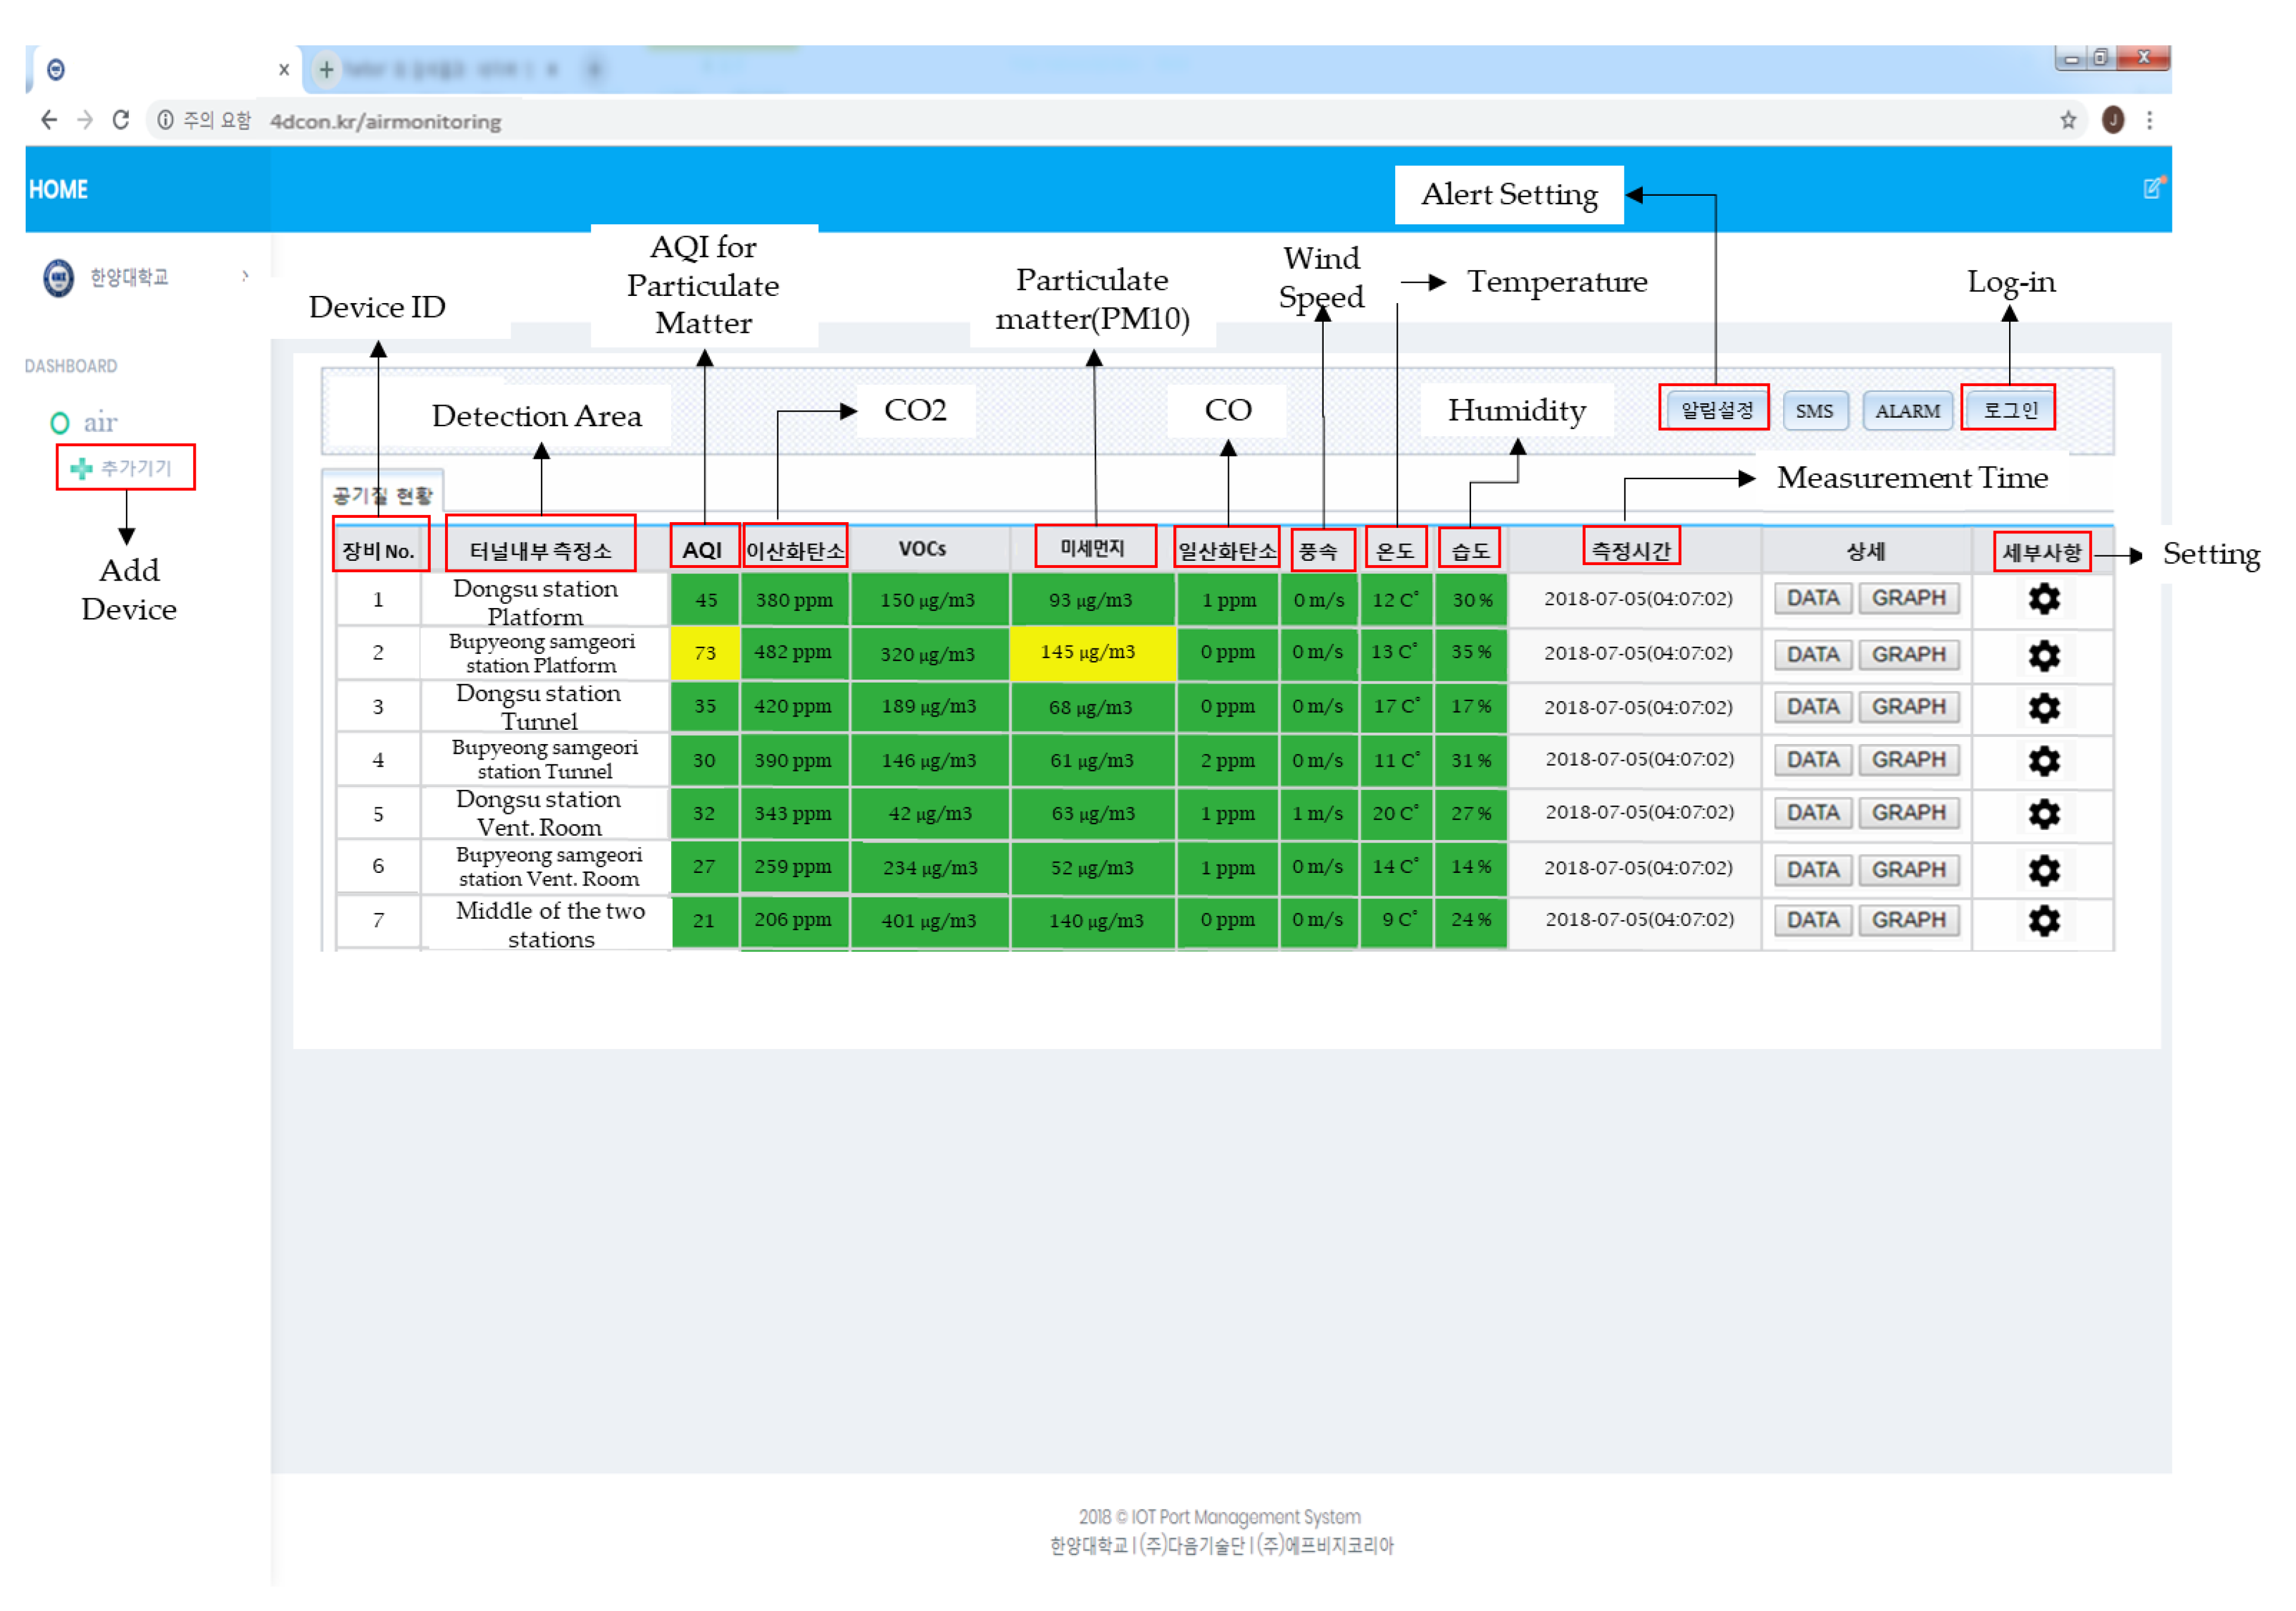
3.2. Cloud-Computing-Based Web Server
In this research, the most essential role of the web server was to analyze the measurements received from Smart-Air devices. The web server (as shown in
Figure 5) visualized the data and calculated AQI based on PM
10. Then, the web server communicated with the sensors installed in the devices to display concentrations of particulate matter through the LED strips. In addition, the AQI and concentrations of PM
10 were stored in the server database for detailed analysis.
The data were classified according to the ID and location of the devices in the web server. Graphs and data sheets from stored data could be extracted for detailed analysis. The data were displayed with color based on the AQI. The web server was designed to alert users by pop-up message when air quality was moderate or poor, so that users could take immediate action if needed.
3.3. Air Quality Index
The AQI for particulate matter was calculated using data from Smart-Air devices connected to the web server. The AQI is a value defined by the United States Environmental Protection Agency (EPA) to characterize the quality of air. Concentrations of PM
10 were used to compute the AQI, which is described in Equation (1) [
31]:
where I = Air Quality Index, C = rounded concentration of pollutant (PM
10), C
h = concentration breakpoint that is greater than or equal to C, C
l = concentration breakpoint that is less than or equal to C, I
h = AQI value corresponding to C
h, and I
1 = AQI value corresponding to C
l.
Furthermore, each level of health concern is assigned a range of AQI and color code as shown in
Table 3 [
31,
32]. In this research, the Smart-Air devices display colors to passengers who are in the monitored area. In addition, the web server was set up to alert managers by pop-up message on a smartphone when the level of health concern is below good, so that immediate action can be taken.
4. Results
The goal of this study was to implement an IoT-based air quality monitoring system in a subway tunnel in order to investigate the condition of particulate matter. The AQIs for particulate matter were successively analyzed and displayed on the web server with a 95% confidence level. The results showed that the AQI and concentration of particulate matter varied based on location and time, even in the same tunnel. In addition, data on the AQI for particulate matter (AQI data from 2017 and 2018) demonstrated that air quality conditions improved after implementing the national maintenance project.
4.1. Analysis of AQI
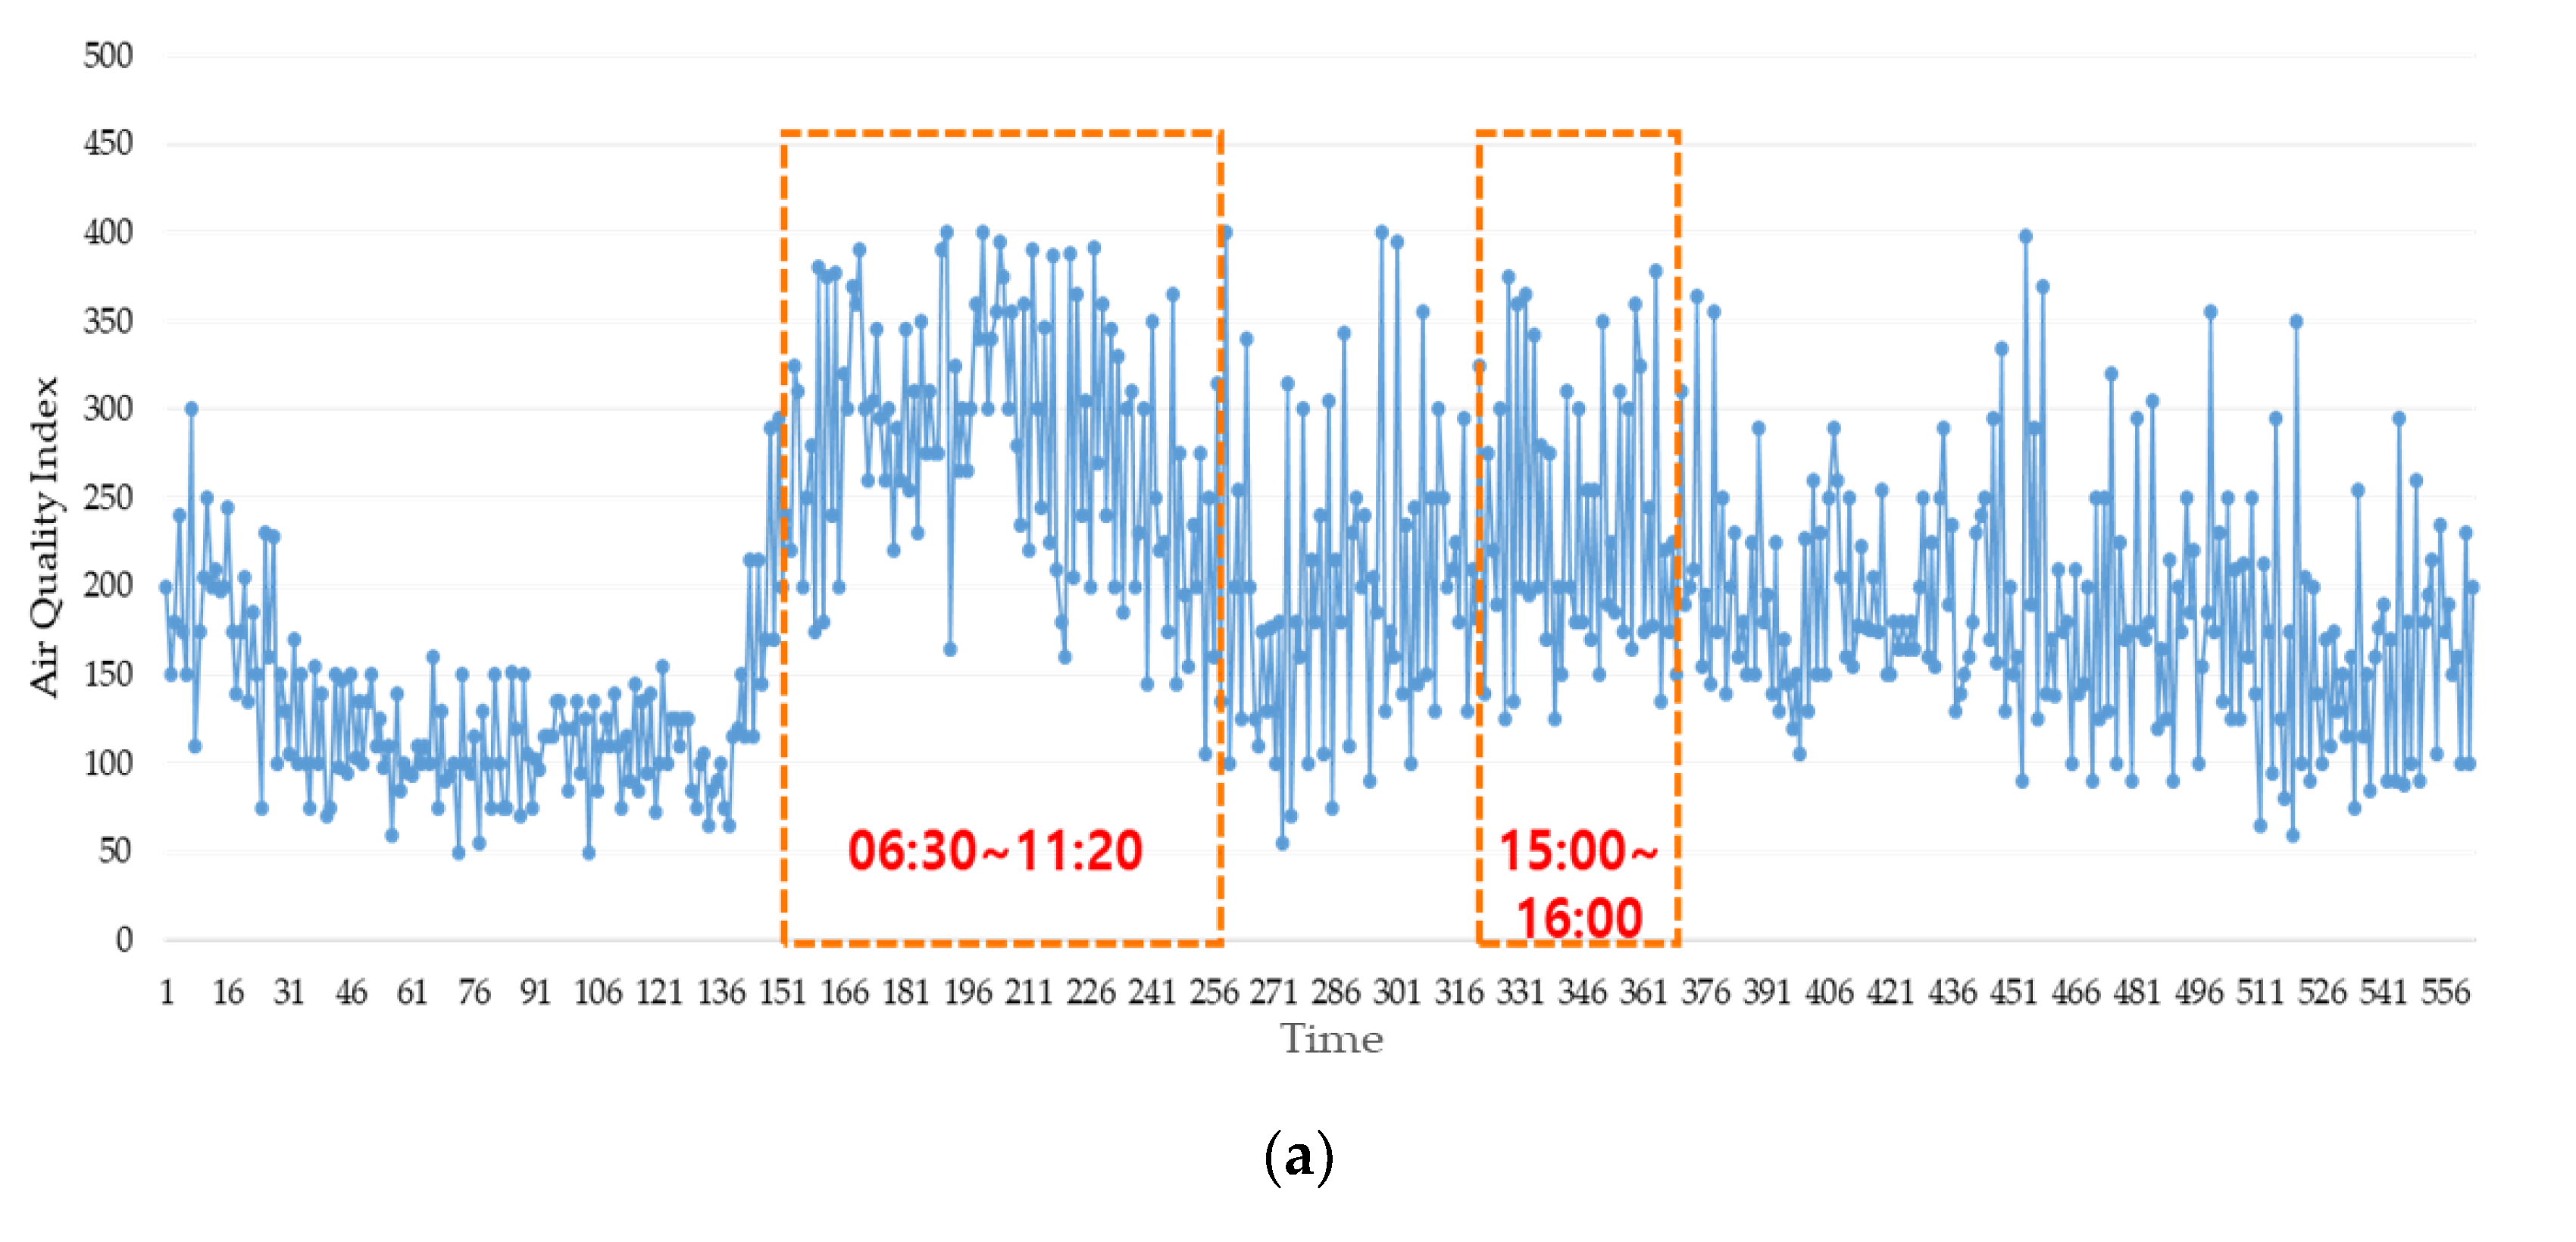
The air quality in terms of particulate matter was analyzed using the AQI from each of seven monitoring locations. The highest (worst) AQI measured was 405, in Dongsu’s main ventilation room, as shown in
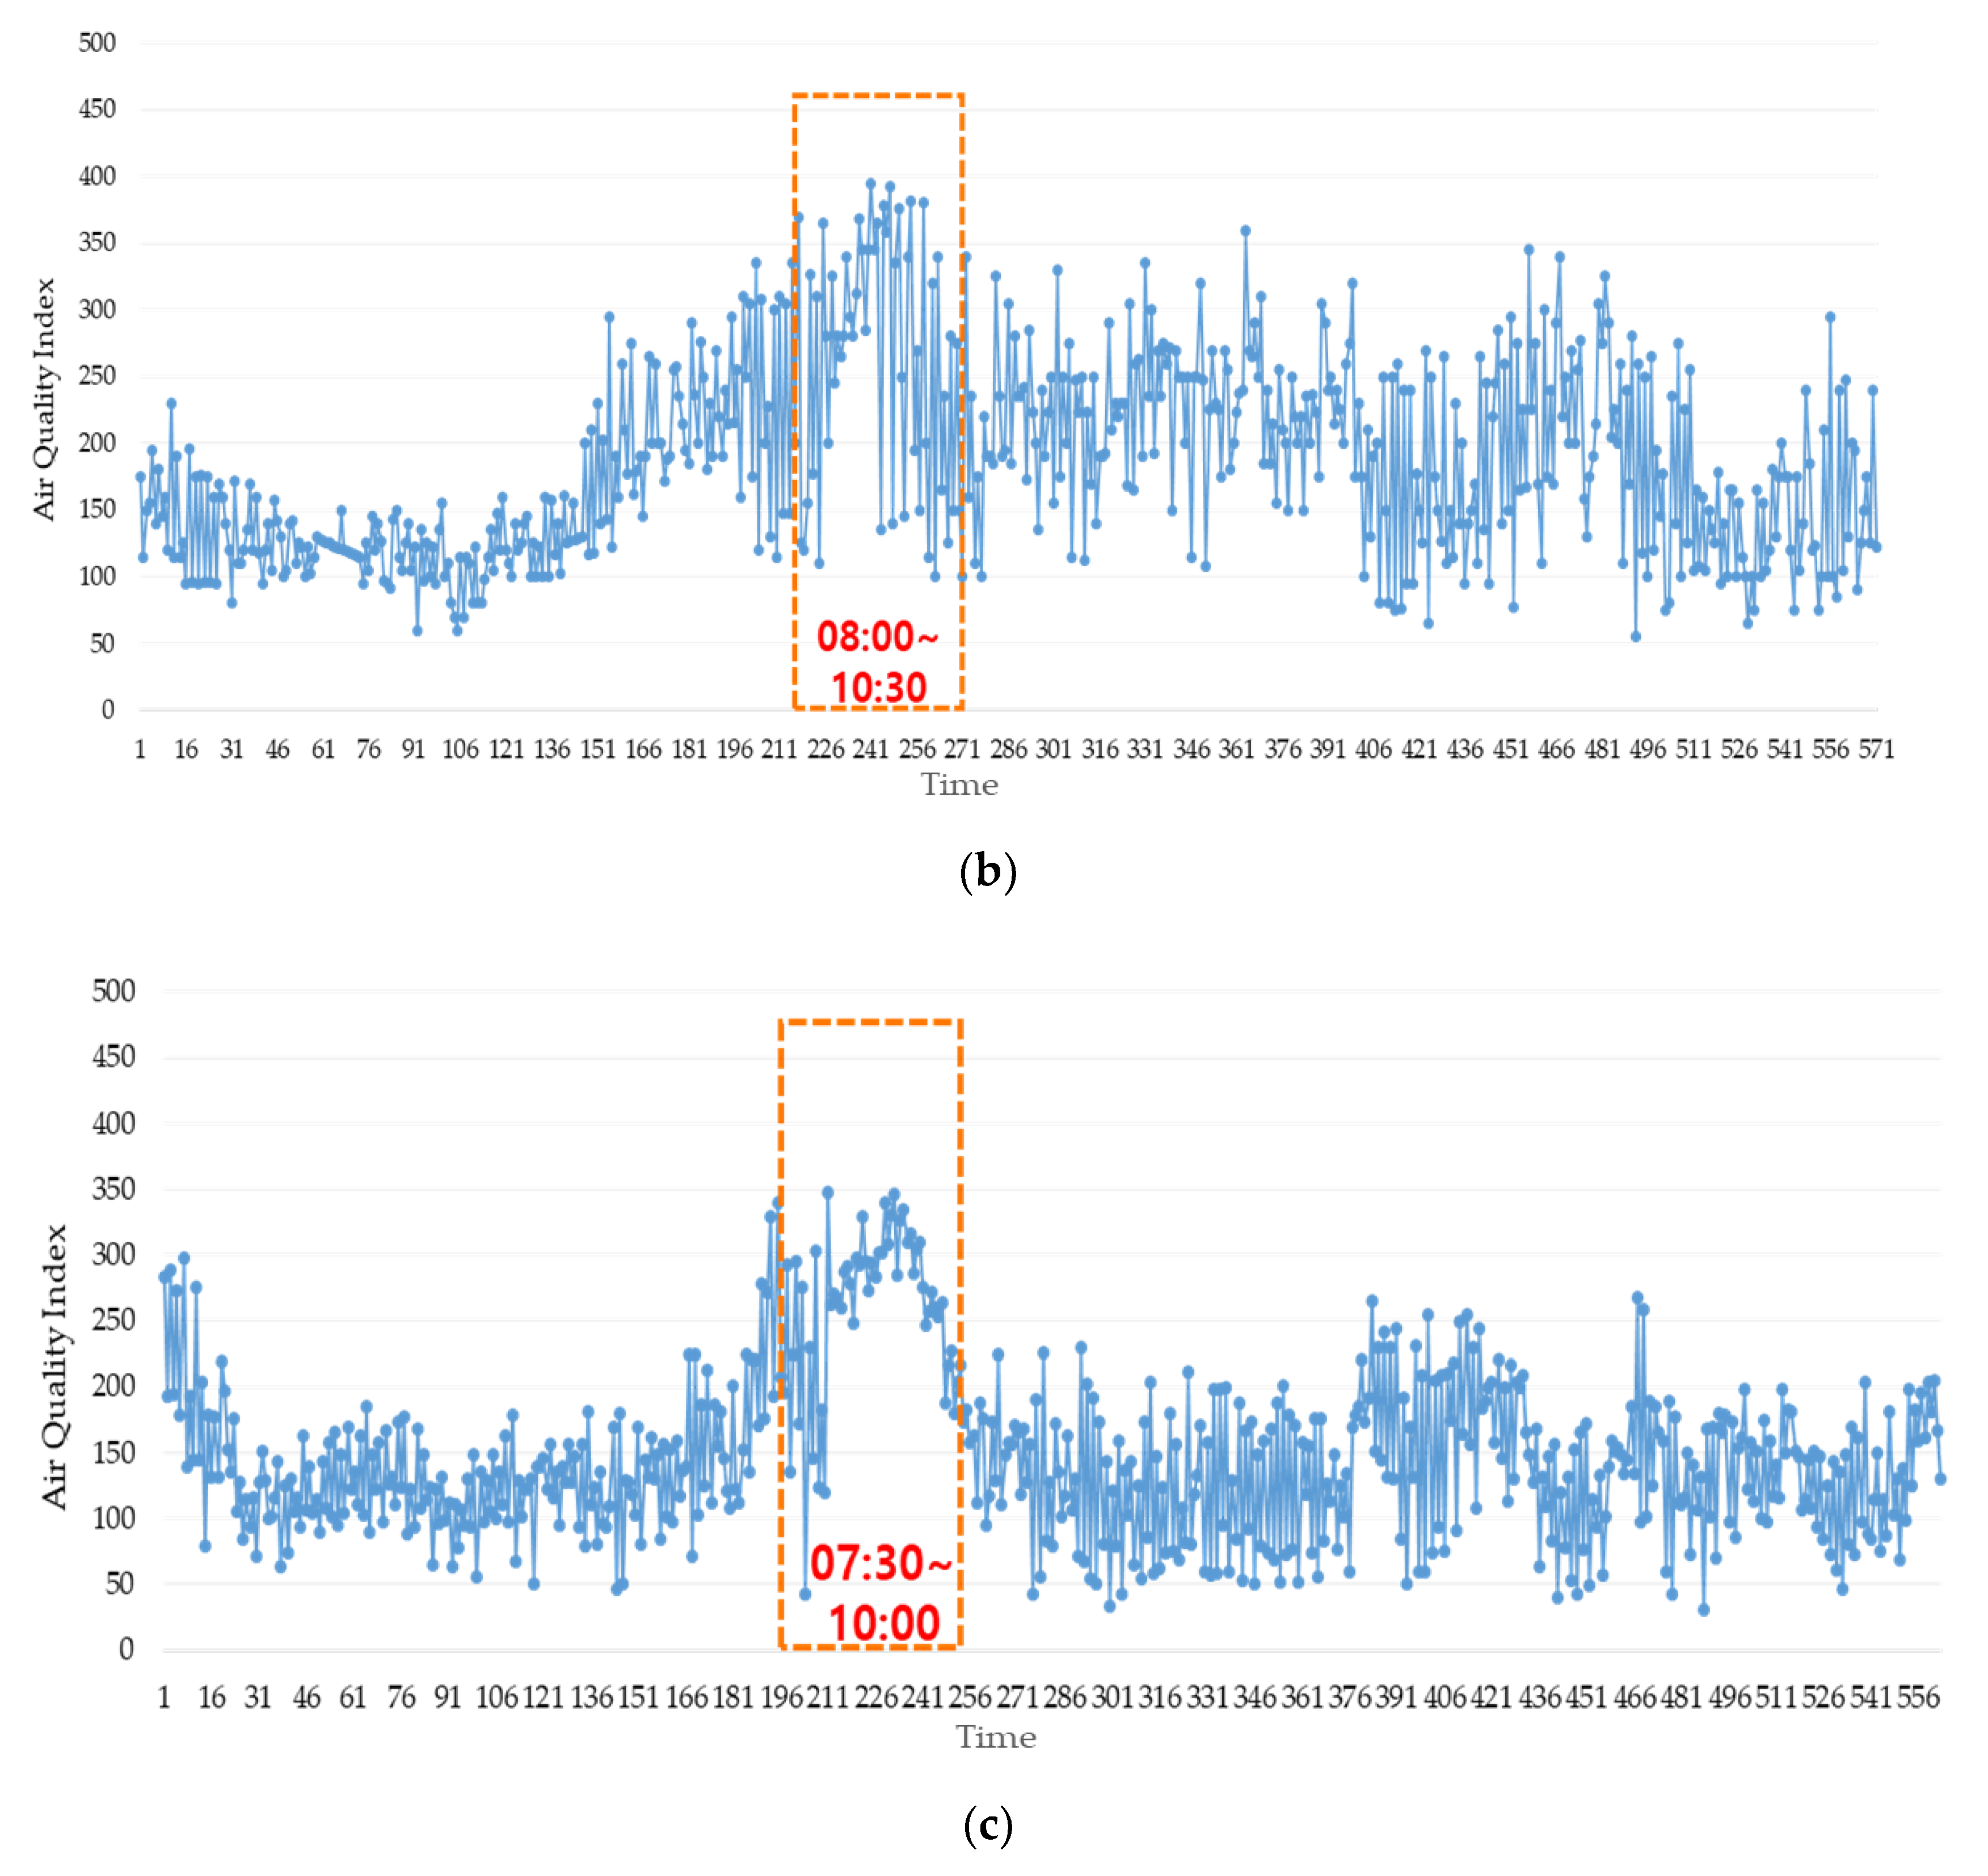
Figure 6a. In the same room, the highest concentrations of particulate matter were observed for 5 h in the morning (from 06:30 to 11:20) and an hour in the afternoon (from 15:00 to 16:00), which were the longest residence times at the monitoring locations. The second highest AQI was detected in Dongsu tunnel, close to the main ventilation room. In this case, particulate matter had a residence time of 2.5 h (08:00 to 10:30), as shown in
Figure 6b. Analysis of AQI revealed that the residence times of particulate matter were longer in locations deeper underground. The depth of Dongsu’s main ventilation room is 30 m, the deepest of all measurement locations. In addition, Bupyeongsamgeori is located 25 m underground, and it showed a residence time of 2.5 h, as depicted in
Figure 6c. Since high concentrations of particulate matter seem to stay longer in subway tunnel locations that are deep underground, it is necessary to change air quality management systems to create better airflow and decrease concentrations and residence times of particulate matter.
4.2. Analysis of Particulate Matter Concentration
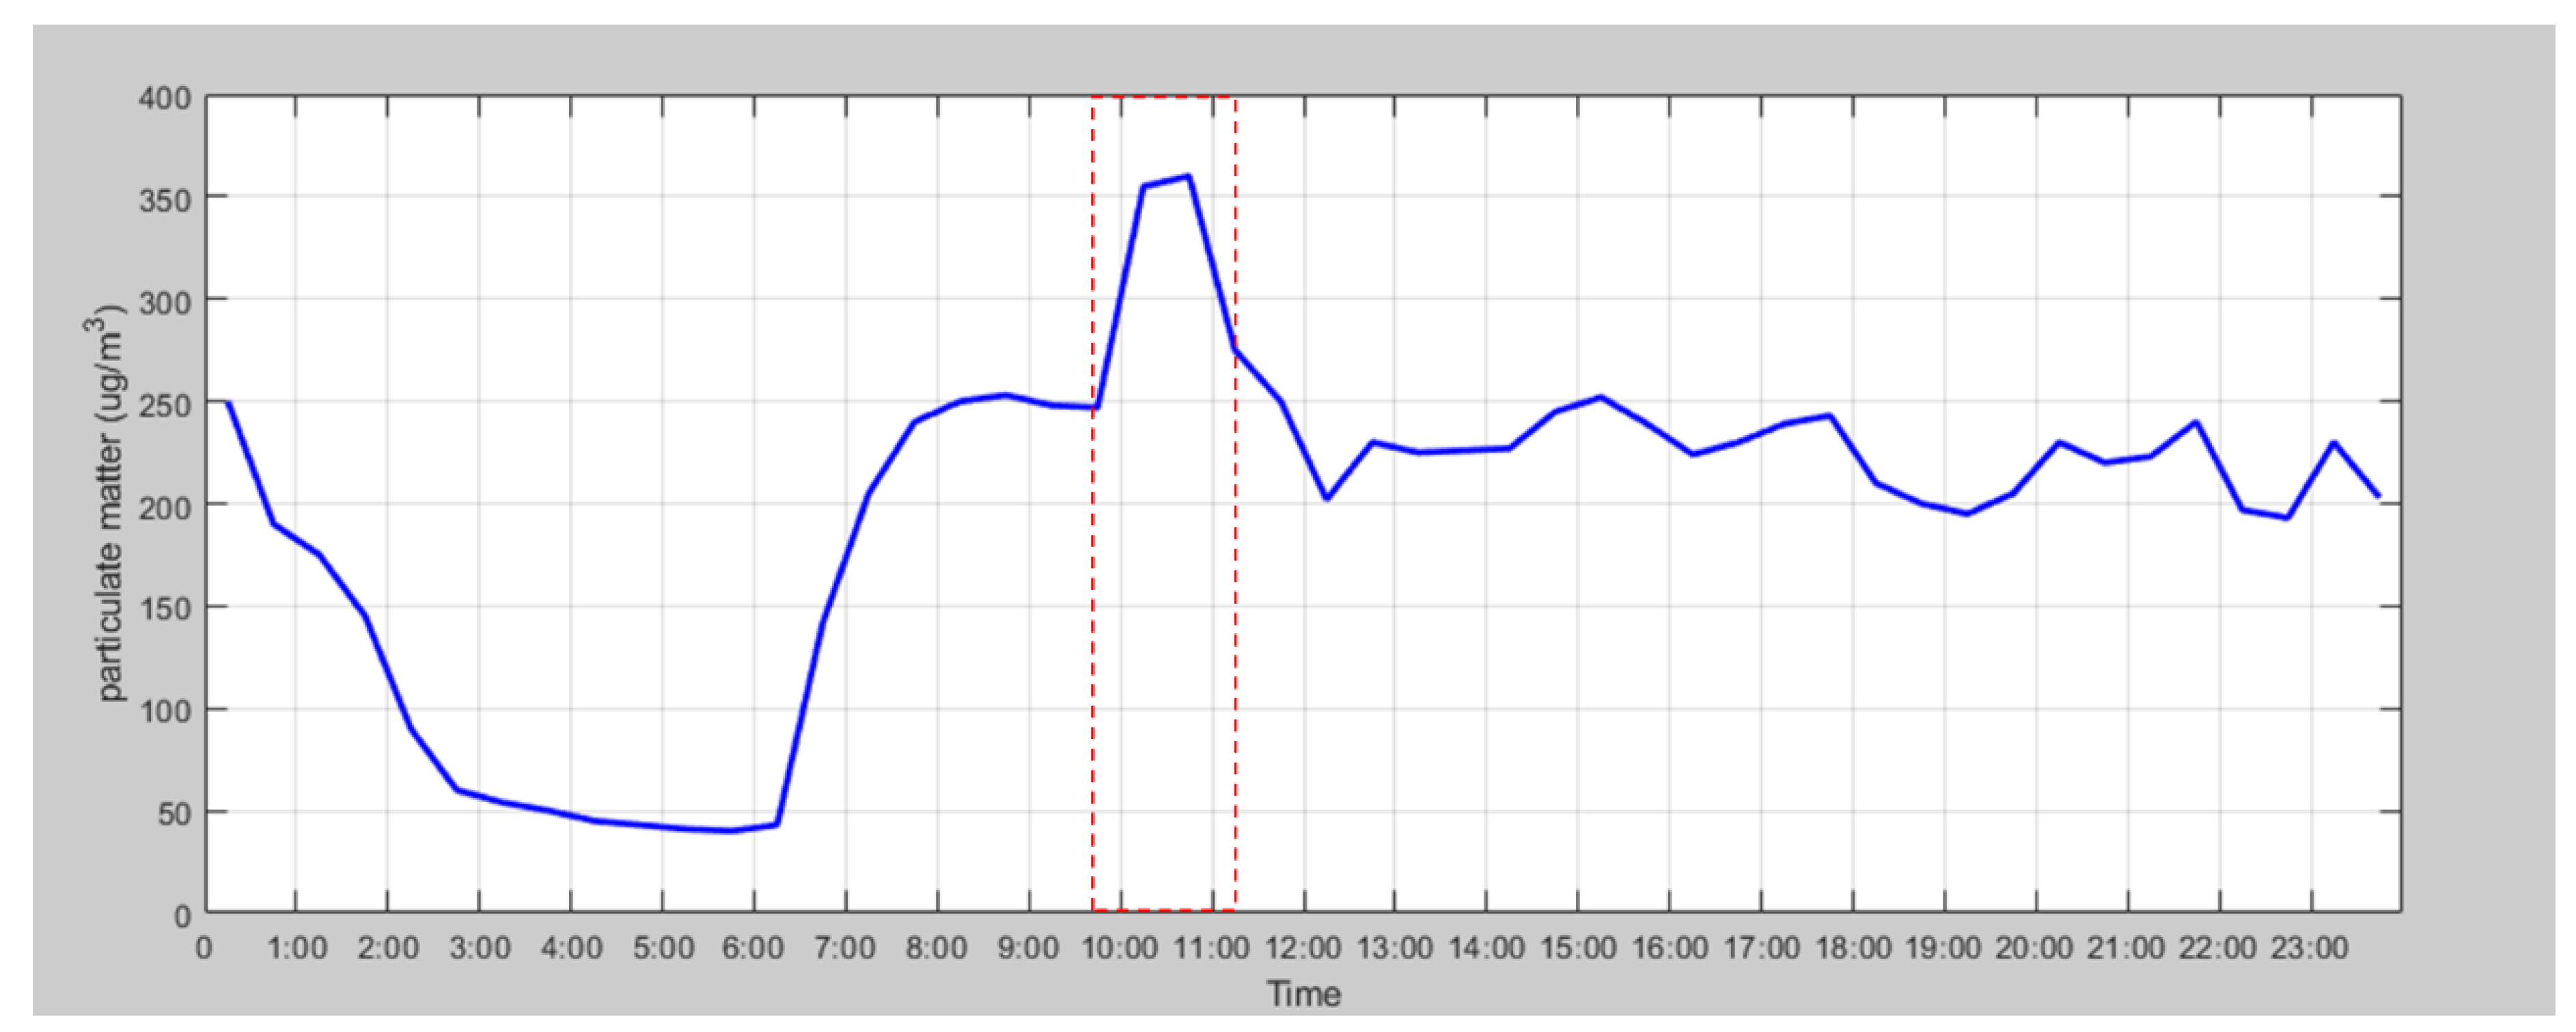
To investigate air quality for particulate matter during subway operation times, data measured from Bupyeongsamgeori station tunnel were analyzed and are shown in
Figure 7. The operating hours of the subway are from 05:37 to 00:37. The concentration of PM
10 decreased from 01:00 and reached the lowest value between 02:30 and 03:00, when trains were not operating. The concentration level remained unchanged after operating hours and gradually decreased after an hour. According to the Ministry of Environment, Korea, the permissible hourly PM
10 concentration is 80 µg/m
3. The ministry recommends refraining from long-term activities in the area when the concentration is over the limit and avoiding any activities when the concentration is higher than 150 µg/m
3 for PM
10 [
33]. Although the concentration was measured in the tunnel where only trains operate, the concentration was only measured below the limit when the trains were not in service, which shows that train operation has an impact on the concentration of PM
10. Likewise, the increase in the concentration level did not occur right after trains started operating. The concentration of PM
10 in the tunnel slowly increased from 07:00 to 09:00, i.e., during rush hours. Furthermore, the maximum concentration was measured between morning and afternoon rush hours after 10:00. After that peak, it seems that particulate matter followed the air flow generated by operation of trains.
4.3. Annual Comparison of Particulate Matter Concentration
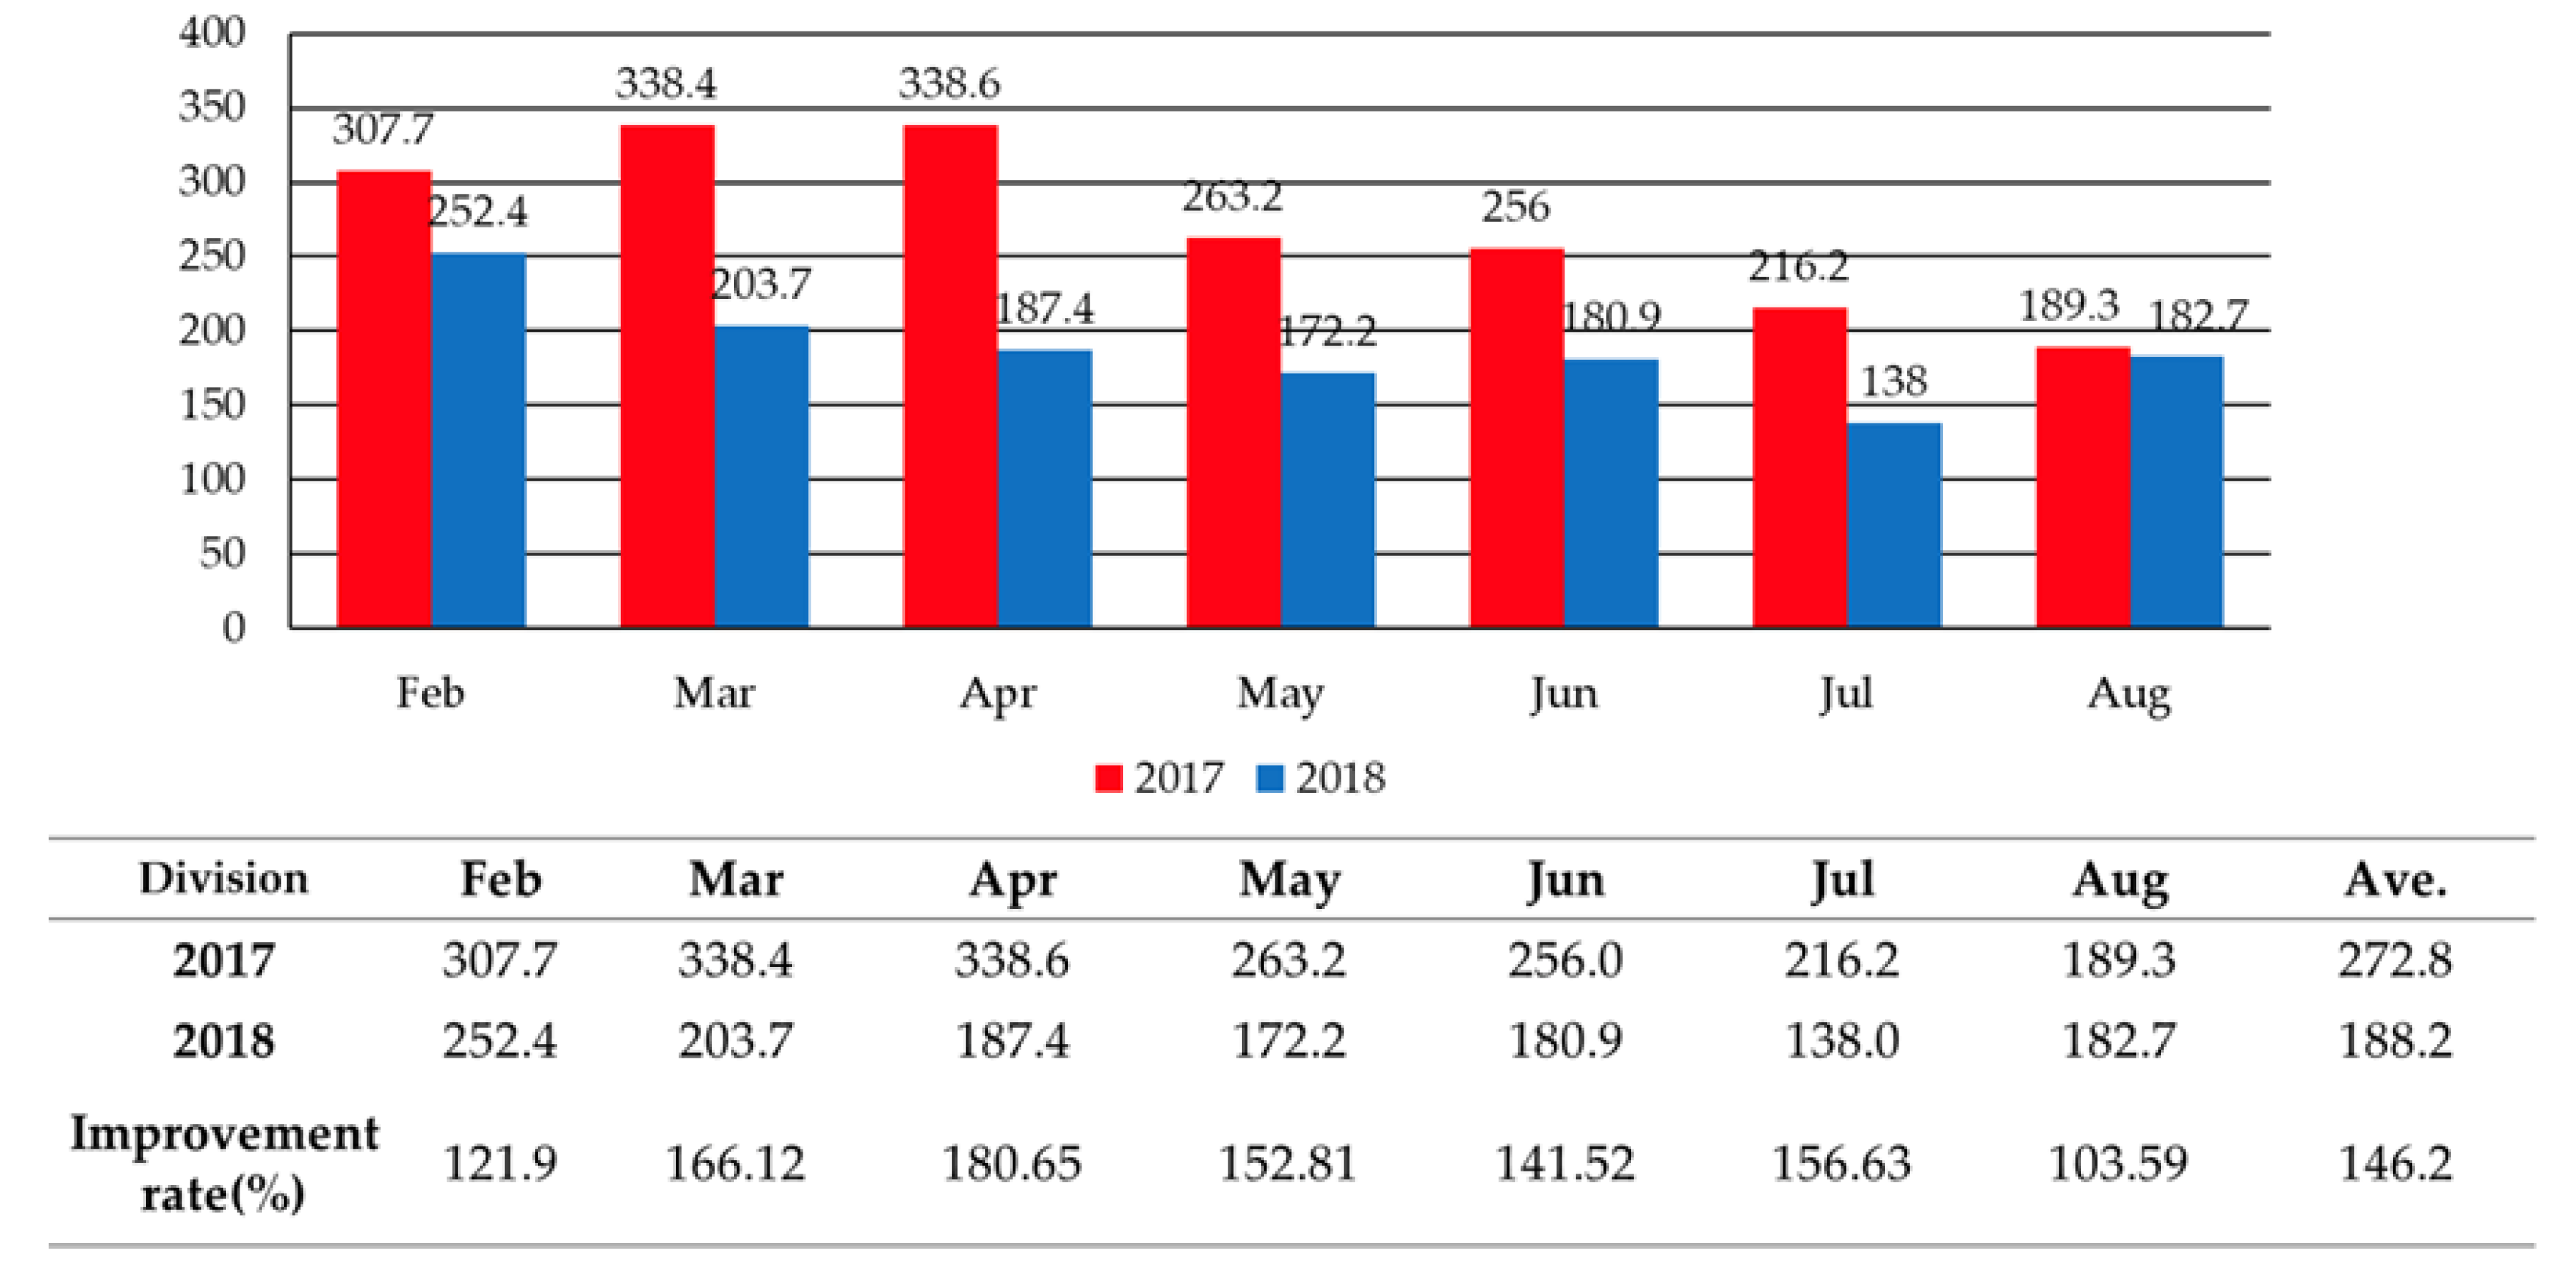
From 1 February 2017 until 31 August 2018, the measurement of real-time particulate matter PM
10 concentration was conducted in front of Bupyungsamgori station platform to measure the change in concentration in the tunnel. As mentioned, the analysis was performed to see whether changes in the management system affected air quality, by comparing the concentration level before and after the changes were implemented. The results of the analysis are depicted in
Figure 8. The 2018 particulate matter concentration showed an improvement of 146.2% when compared to 2017, proving that the new management system was effective. It is considered that particulate matter concentration was reduced due to airflow in the tunnel (created by changes in the management system, including operating the ventilation system for 20 h per day and utilizing wind guard doors).
5. Conclusions
In this paper, the implementation of an IoT-based air quality monitoring system to improve the monitoring of particulate matter (PM10) levels was presented. For the experiments, the system was implemented in subway tunnels in Incheon, South Korea. The results demonstrated good performance of the system and convenience of monitoring air quality with a focus on particulate matter. Several conclusions were drawn, including the following: (1) The IoT-based air quality monitoring system efficiently monitored air quality in the tunnel. (2) The air quality in the subway tunnel could be monitored consistently using the IoT and cloud computing technology. (3) It was easy to expand the monitoring area by extending the system.
The following observations were also made: (1) The particulate matter in deeper locations had longer residence times. (2) The maximum concentration of particulate matter occurred between the morning and afternoon rush hours. (3) The air quality improved significantly when the operation time of the ventilation system was changed to 20 h per day, and the system was temporarily stopped when the concentration of particulate matter from outside of the tunnel was 150 µg/m3 or more.
More tests are necessary to exclude or correlate additional factors, such as the presence of other pollutants, the detailed impact of tunnel ventilation, and varying environments in the tunnel. In addition, an automatic air quality management application (a convergence of artificial intelligence and big data) can be added. These technologies would be able to automatically predict and improve air quality in subway systems.
Author Contributions
J.H.J. and B.J. conceptualized the study, and J.H.K. and I.C. performed investigations. J.H.J. developed the methodology. J.H.J. wrote the original draft of the manuscript, while B.J. supervised the research. J.H.J., J.H.K., and I.C. reviewed and edited the manuscript. All authors read and approved the final manuscript.
Funding
This research received no external funding.
Acknowledgments
We thank WoonYong Han, Smart-Is, for providing multiple Smart-Air devices to the project.
Conflicts of Interest
The authors declare no conflicts of interest.
References
- Yuh, K. A Study on the Improvement of Fine dust in Domestic Subway, Korea. Environ. Ind. Technol. Inst. 2015, 21, 1–11. [Google Scholar]
- Kwon, S.; Jeong, W.; Park, D.; Kim, K.; Cho, K. A multivariate study for characterizing particulate matter (PM10, PM2.5, and PM1) in Seoul metropolitan subway stations. Korea. J. Hazard. Mater. 2015, 297, 295–303. [Google Scholar] [CrossRef] [PubMed]
- Xu, B.; Hao, J.L. Air quality inside subway metro indoor environment worldwide: A review. Environ. Int. 2017, 107, 33–46. [Google Scholar] [CrossRef] [PubMed]
- Moreno, T.; Miguel, E.D. Improving air quality in subway systems: An overview. Environ. Pollut. 2018, 239, 829–831. [Google Scholar] [CrossRef] [PubMed]
- Nguyen, T.; Park, D.; Lee, Y. Particulate Matter (PM10 and PM2.5) in Subway Systems: Health-Based Economic Assessment. Sustainability 2017, 9, 2135. [Google Scholar] [CrossRef]
- Byeon, S.; Willis, R.; Peters, T.M. Chemical Characterization of Outdoor and Subway Fine (PM2.5–1.0) and Coarse (PM10–2.5) Particulate Matter in Seoul (Korea) by Computer-Controlled Scanning Electron Microscopy (CCSEM). Int. J. Environ. Res. Public Health 2015, 12, 2090–2104. [Google Scholar] [CrossRef]
- Barmparesos, N.; Assimakopoulos, V.D.; Assimakopoulos, M.N.; Tsairidi, E. Particulate matter levels and comfort conditions in the trains and platforms of the Athens underground metro. AIMS Environ. Sci. 2016, 3, 199–219. [Google Scholar] [CrossRef]
- Vilcassim, M.J.R.; Thurston, G.D.; Peltier, R.E.; Gordon, T. Black Carbon and Particulate Matter (PM2.5) Concentrations in New York City’s Subway Stations. Environ. Sci. Technol. 2014, 48, 14738–14745. [Google Scholar] [CrossRef] [PubMed]
- Martins, V.; Moreno, T.; Minguillón, M.C.; Amato, F.; Miguel, E.D.; Capdevila, M.; Querol, X. Exposure to airborne particulate matter in the subway system. Sci. Total Environ. 2015, 511, 711–722. [Google Scholar] [CrossRef]
- Jeong, W.; Lee, Y.; Choi, K.; Park, D. Particulate Matters Levels in Subway Tunnels and Cabins. Int. J. Environ. Monit. Anal. 2016, 4, 89–93. [Google Scholar] [CrossRef]
- Ma, C.; Lee, K.; Kim, S.; Sera, K. Chemical Properties and Source Profiles of Particulate Matter Collected on an Underground Subway Platform. Asian J. Atmos. Environ. 2015, 9, 165–172. [Google Scholar] [CrossRef]
- Su´arez, L.; Mes´ıas, S.; Iglesias, V.; Silva, C.; C´aceres, D.D.; Ruiz-Rudolph, P. Personal exposure to particulate matter in commuters using different transport modes (bus, bicycle, car and subway) in an assigned route in downtown Santiago, Chile. Environ. Sci. Process Impacts 2014, 16, 1309–1317. [Google Scholar] [CrossRef] [PubMed]
- Colombi, C.; Angius, S.; Lazzarini, M. Particulate matter concentrations, physical characteristics and elemental composition in the Milan underground transport system. Atmos. Environ. 2013, 70, 166–178. [Google Scholar] [CrossRef]
- Minguillón, M.C.; Reche, C.; Martins, V.; Amato, F.; Miguel, E.D.; Capdevila, M.; Centelles, S.; Querol, X.; Moreno, T. Aerosol sources in subway environments. Environ. Res. 2018, 167, 314–328. [Google Scholar] [CrossRef] [PubMed]
- Kim, K.; Ho, D.; Jeon, J.; Kim, J. A noticeable shift in particulate matter levels after platform screen door installation in a Korean subway station. Atmos. Environ. 2012, 49, 219–223. [Google Scholar] [CrossRef]
- Jung, H.; Kim, B.; Ryu, J.; Maskey, S.; Kim, J.; Sohn, J.; Ro, C. Source identification of particulate matter collected at underground subway stations in Seoul, Korea using quantitative single-particle analysis. Atmos. Environ. 2010, 44, 2287–2293. [Google Scholar] [CrossRef]
- Kim, J.; Kim, S.; Lee, G.; Bae, G.; Cho, Y.; Park, D.; Lee, D.; Kwon, S. Status of PM in Seoul metropolitan subway cabins and effectiveness of subway cabin air purifier (SCAP). Clean Technol. Environ. Policy 2014, 16, 1193–1200. [Google Scholar] [CrossRef]
- Lee, Y.; Lee, Y.; Kim, T.; Choi, J.; Park, D. Sources and Characteristics of Particulate Matter in Subway Tunnels in Seoul, Korea. Int. J. Environ. Res. Public Health 2018, 15, 2534. [Google Scholar] [CrossRef] [PubMed]
- Wang, J.; Zhao, L.; Zhu, D.; Gao, H.O.; Xie, Y.; Li, H.; Xu, X.; Wang, H. Characteristics of particulate matter (PM) concentrations influenced by piston wind and train door opening in the Shanghai subway system. Transp. Res. Part D Transp. Environ. 2016, 47, 77–88. [Google Scholar] [CrossRef]
- Jung, M.; Kim, H.; Park, Y.; Park, D.; Chung, K.; Oh, S. Genotoxic effects and oxidative stress induced by organic extracts of particulate matter (PM10) collected from a subway tunnel in Seoul, Korea. Mutat. Res. Toxicol. Environ. Mutagen. 2012, 749, 39–47. [Google Scholar] [CrossRef] [PubMed]
- Querol, X.; Moreno, T.; Karanasiou, A.; Reche, C.; Alastuey, A.; Viana, M.; Fomt, O.; Gil, J.; Miguel, E.D.; Capdevila, M. Variability of levels and composition of PM10 and PM2.5 in the Barcelona metro system. Atmos. Chem. Phys. 2012, 12, 5005–5076. [Google Scholar] [CrossRef]
- Guo, L.; Hu, Y.; Hu, Q.; Lin, J.; Li, C.; Chen, J.; Li, L.; Fu, H. Characteristics and chemical compositions of particulate matter collected at the selected metro stations of Shanghai, China. Sci. Total Environ. 2014, 496, 443–452. [Google Scholar] [CrossRef] [PubMed]
- Park, D.; Ha, K. Characteristics of PM10, PM2.5, CO2 and CO monitored in interiors and platforms of subway train in Seoul, Korea. Environ. Int. 2008, 34, 629–634. [Google Scholar] [CrossRef] [PubMed]
- Jo, J.; Jo, B.; Kim, J.; Kim, S.; Han, W. Development of an IoT-Based Indoor Air Quality Monitoring Platform. J. Sens. 2020. [Google Scholar] [CrossRef]
- Jo, B.; Jo, J.; Khan, R.M.A.; Kim, J.; Lee, Y. Development of a cloud computing-based pier type port structure stability evaluation platform using fiber bragg grating sensors. Sensors 2018, 18, 1681. [Google Scholar] [CrossRef]
- Jo, J.; Jo, B.; Khan, R.M.A.; Kim, J. A cloud computing-based damage prevention system for marine structures during berthing. Ocean Eng. 2019, 180, 23–28. [Google Scholar] [CrossRef]
- Gubbi, J.; Buyya, R.; Marusic, S.; Palaniswami, M. Internet of Things (IoT): A vision, architectural elements, and future directions. Future Gener. Comput. Syst. 2013, 29, 1645–1660. [Google Scholar] [CrossRef]
- Fan, Y.J.; Yin, Y.H.; Xu, L.D.; Zeng, Y.; Wu, F. IoT-based smart rehabilitation system. IEEE Trans. Ind. Inform. 2014, 10, 1577–1598. [Google Scholar]
- Pavithra, D.; Balakrishnan, R. IoT based monitoring and control system for home automation. In Proceedings of the 2015 Global Conference on Communication Technologies, Thuckalay, India, 23–24 April 2015. [Google Scholar]
- Sun, E.; Zhang, X.; Li, Z. The internet of things (IOT) and cloud computing (CC) based tailings dam monitoring and pre-alarm system in mines. Saf. Sci. 2012, 50, 811–815. [Google Scholar] [CrossRef]
- Mintz, D. Technical Assistance Document for the Reporting of Daily Air Quality—The Air Quality Index (AQI). U.S. Environ. Prot. Agency 2012, 29, 29. [Google Scholar]
- Bhattacharya, S.; Sridevi, S.; Pitchiah, R. Indoor Air Quality Monitoring using Wireless Sensor Network. In Proceedings of the 2012 Sixth International Conference on Sensing Technology, Kolkata, India, 18–21 December 2012; pp. 422–427. [Google Scholar]
- AirKorea. Available online: https://www.airkorea.or.kr/index (accessed on 24 July 2020).
© 2020 by the authors. Licensee MDPI, Basel, Switzerland. This article is an open access article distributed under the terms and conditions of the Creative Commons Attribution (CC BY) license (http://creativecommons.org/licenses/by/4.0/).


