Spatial Heterogeneity Influences of Environmental Control and Informal Regulation on Air Pollutant Emissions in China


Abstract
1. Introduction
2. Literature Review
2.1. Air Pollution Control Policy
2.2. Informal Environmental Regulation
2.3. Comments
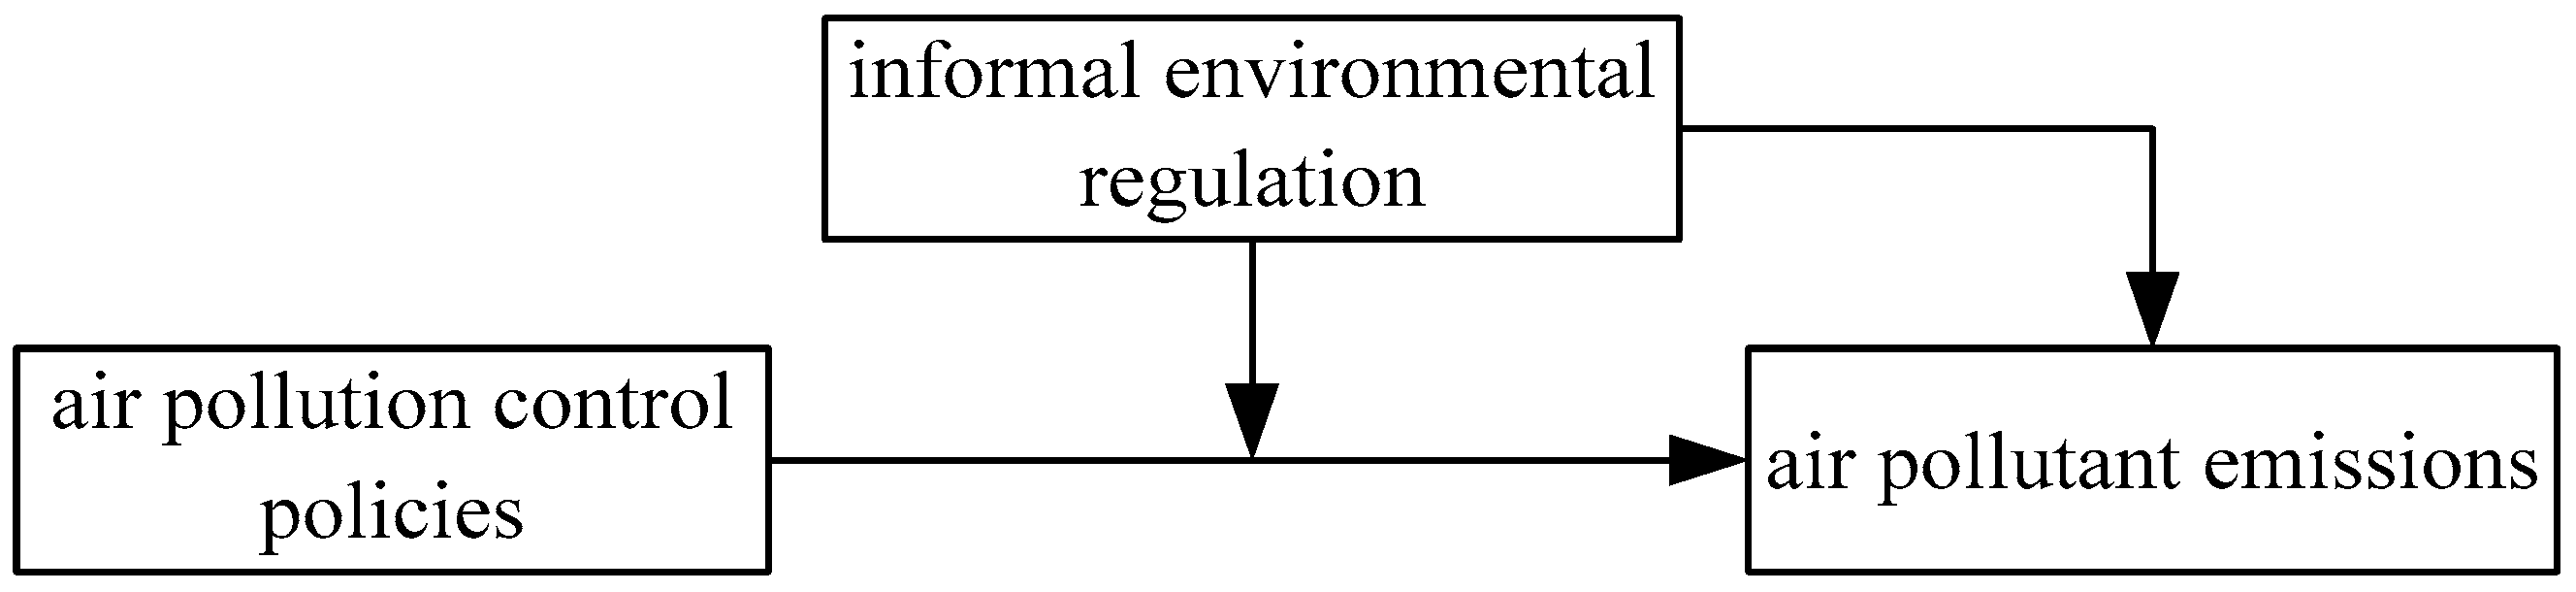
3. Research Design
3.1. Non-Spatial Econometric Model
3.2. Spatial Estimation Method
4. Variables and Data
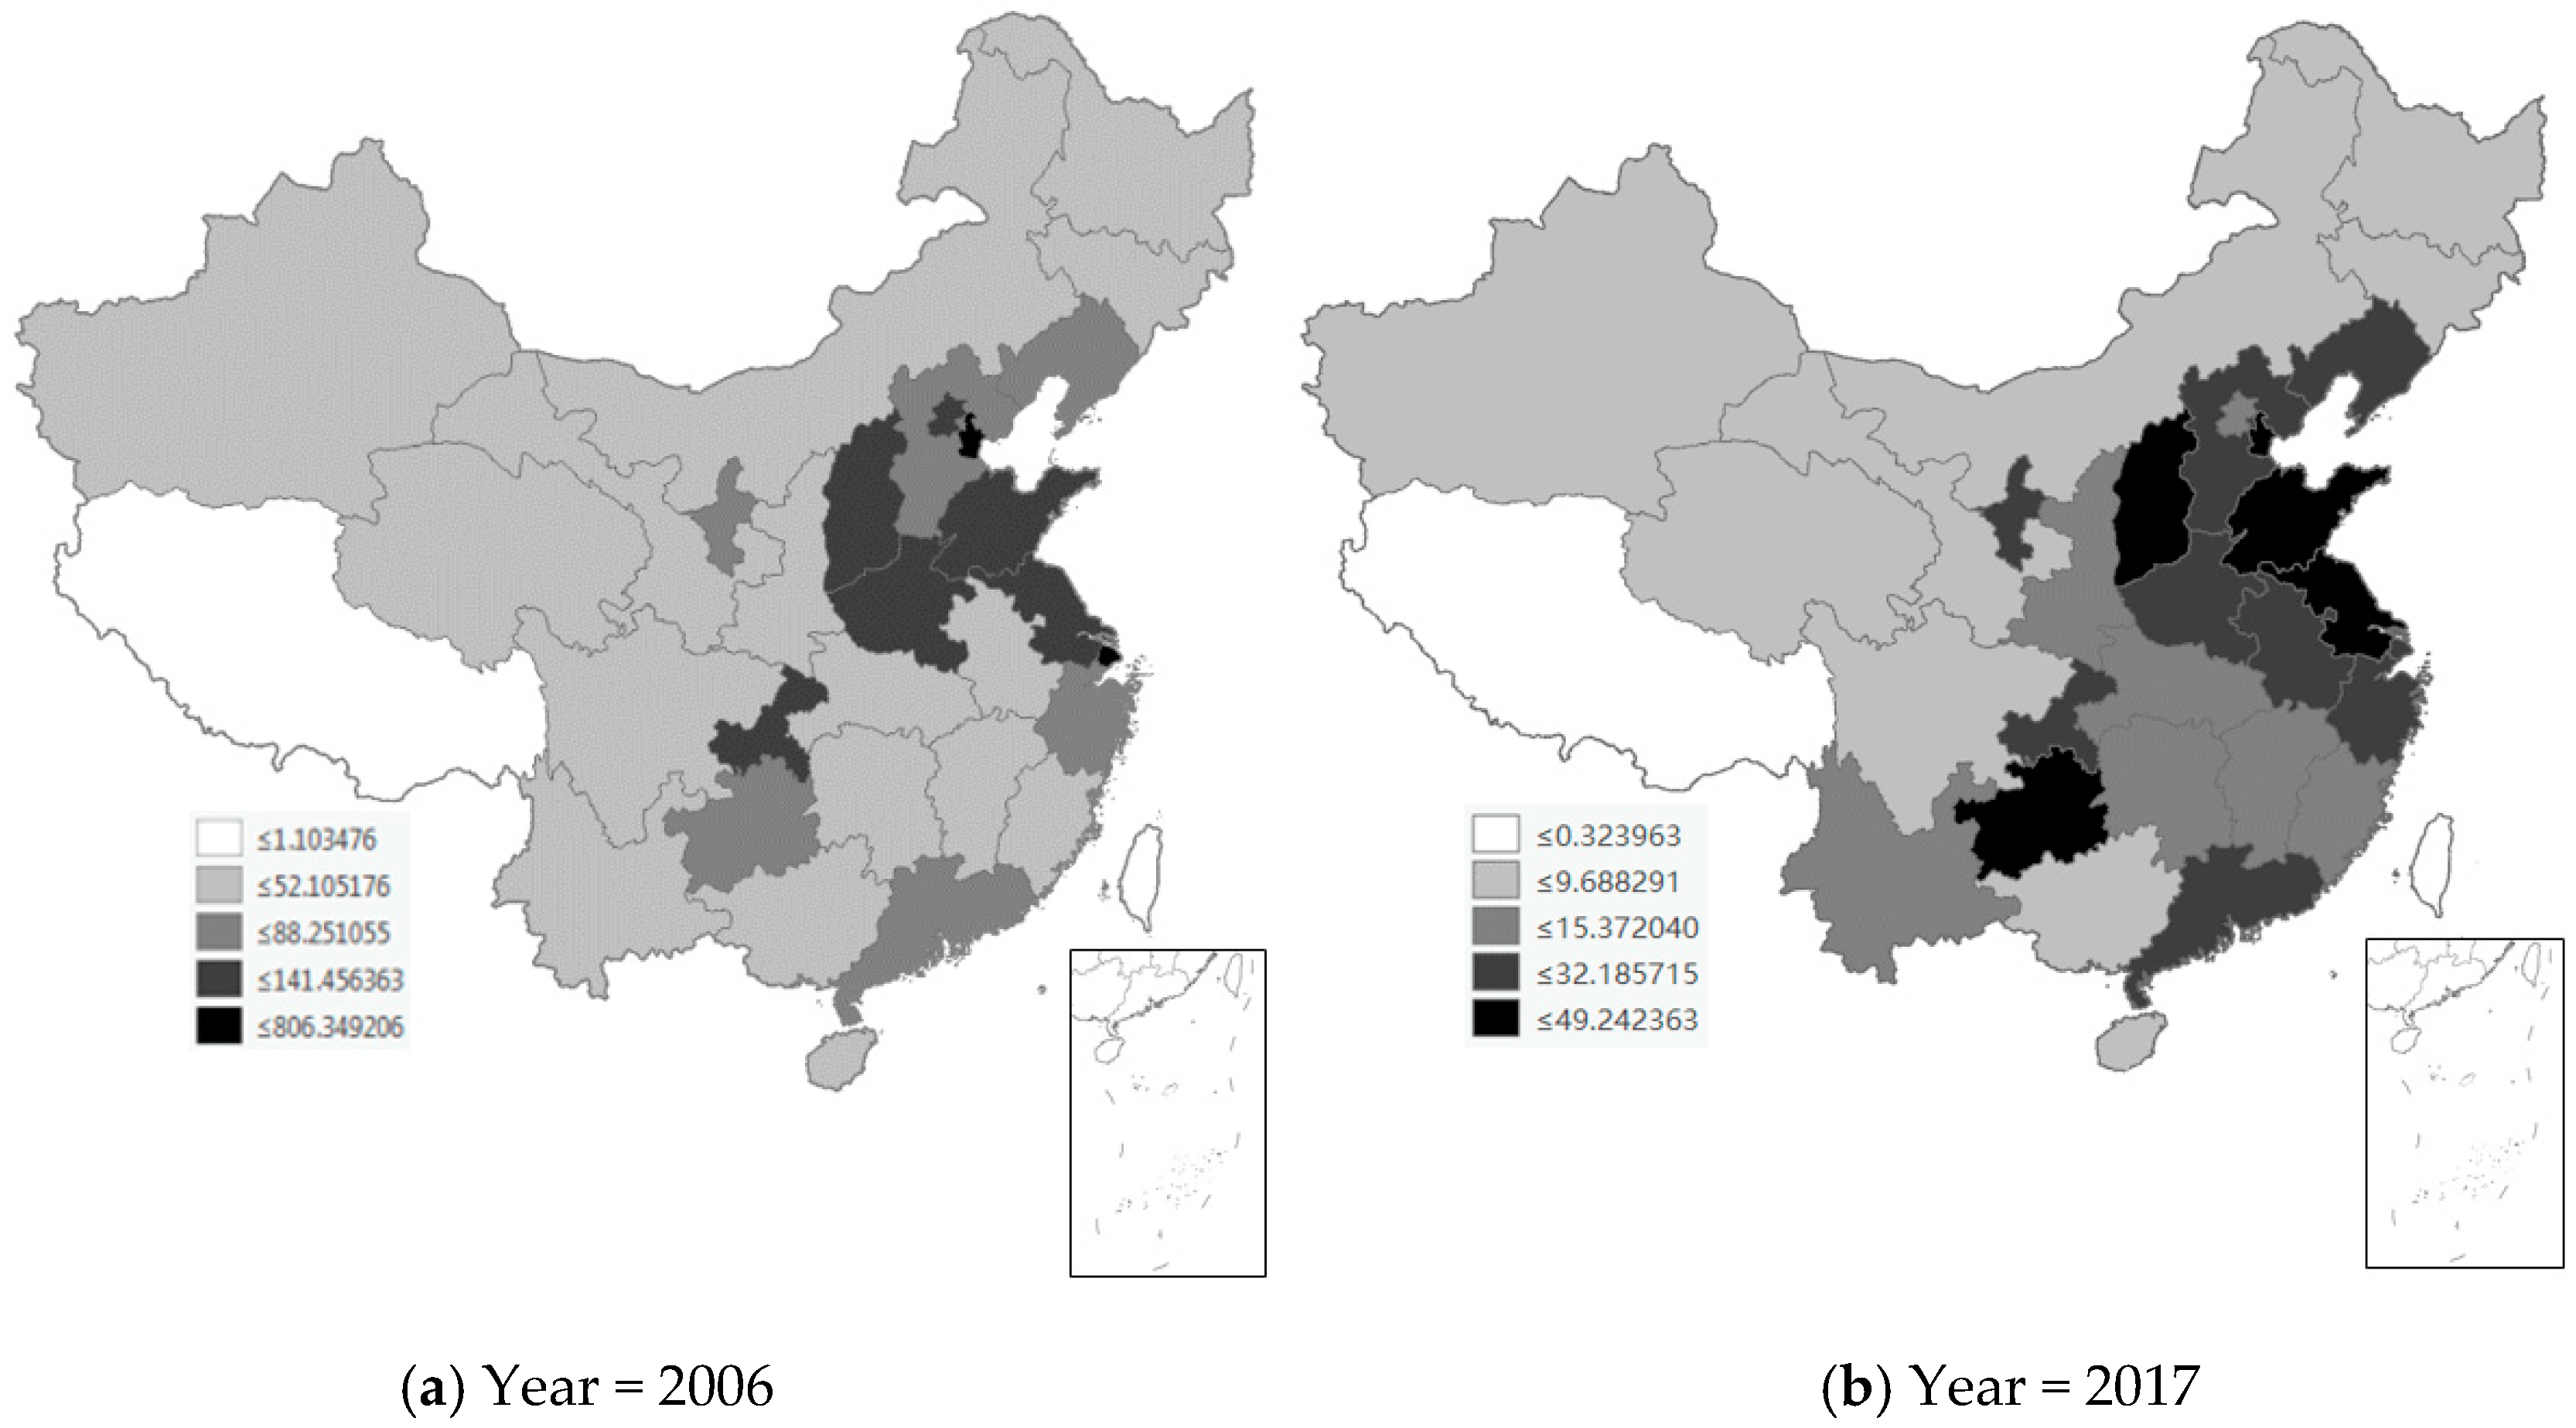
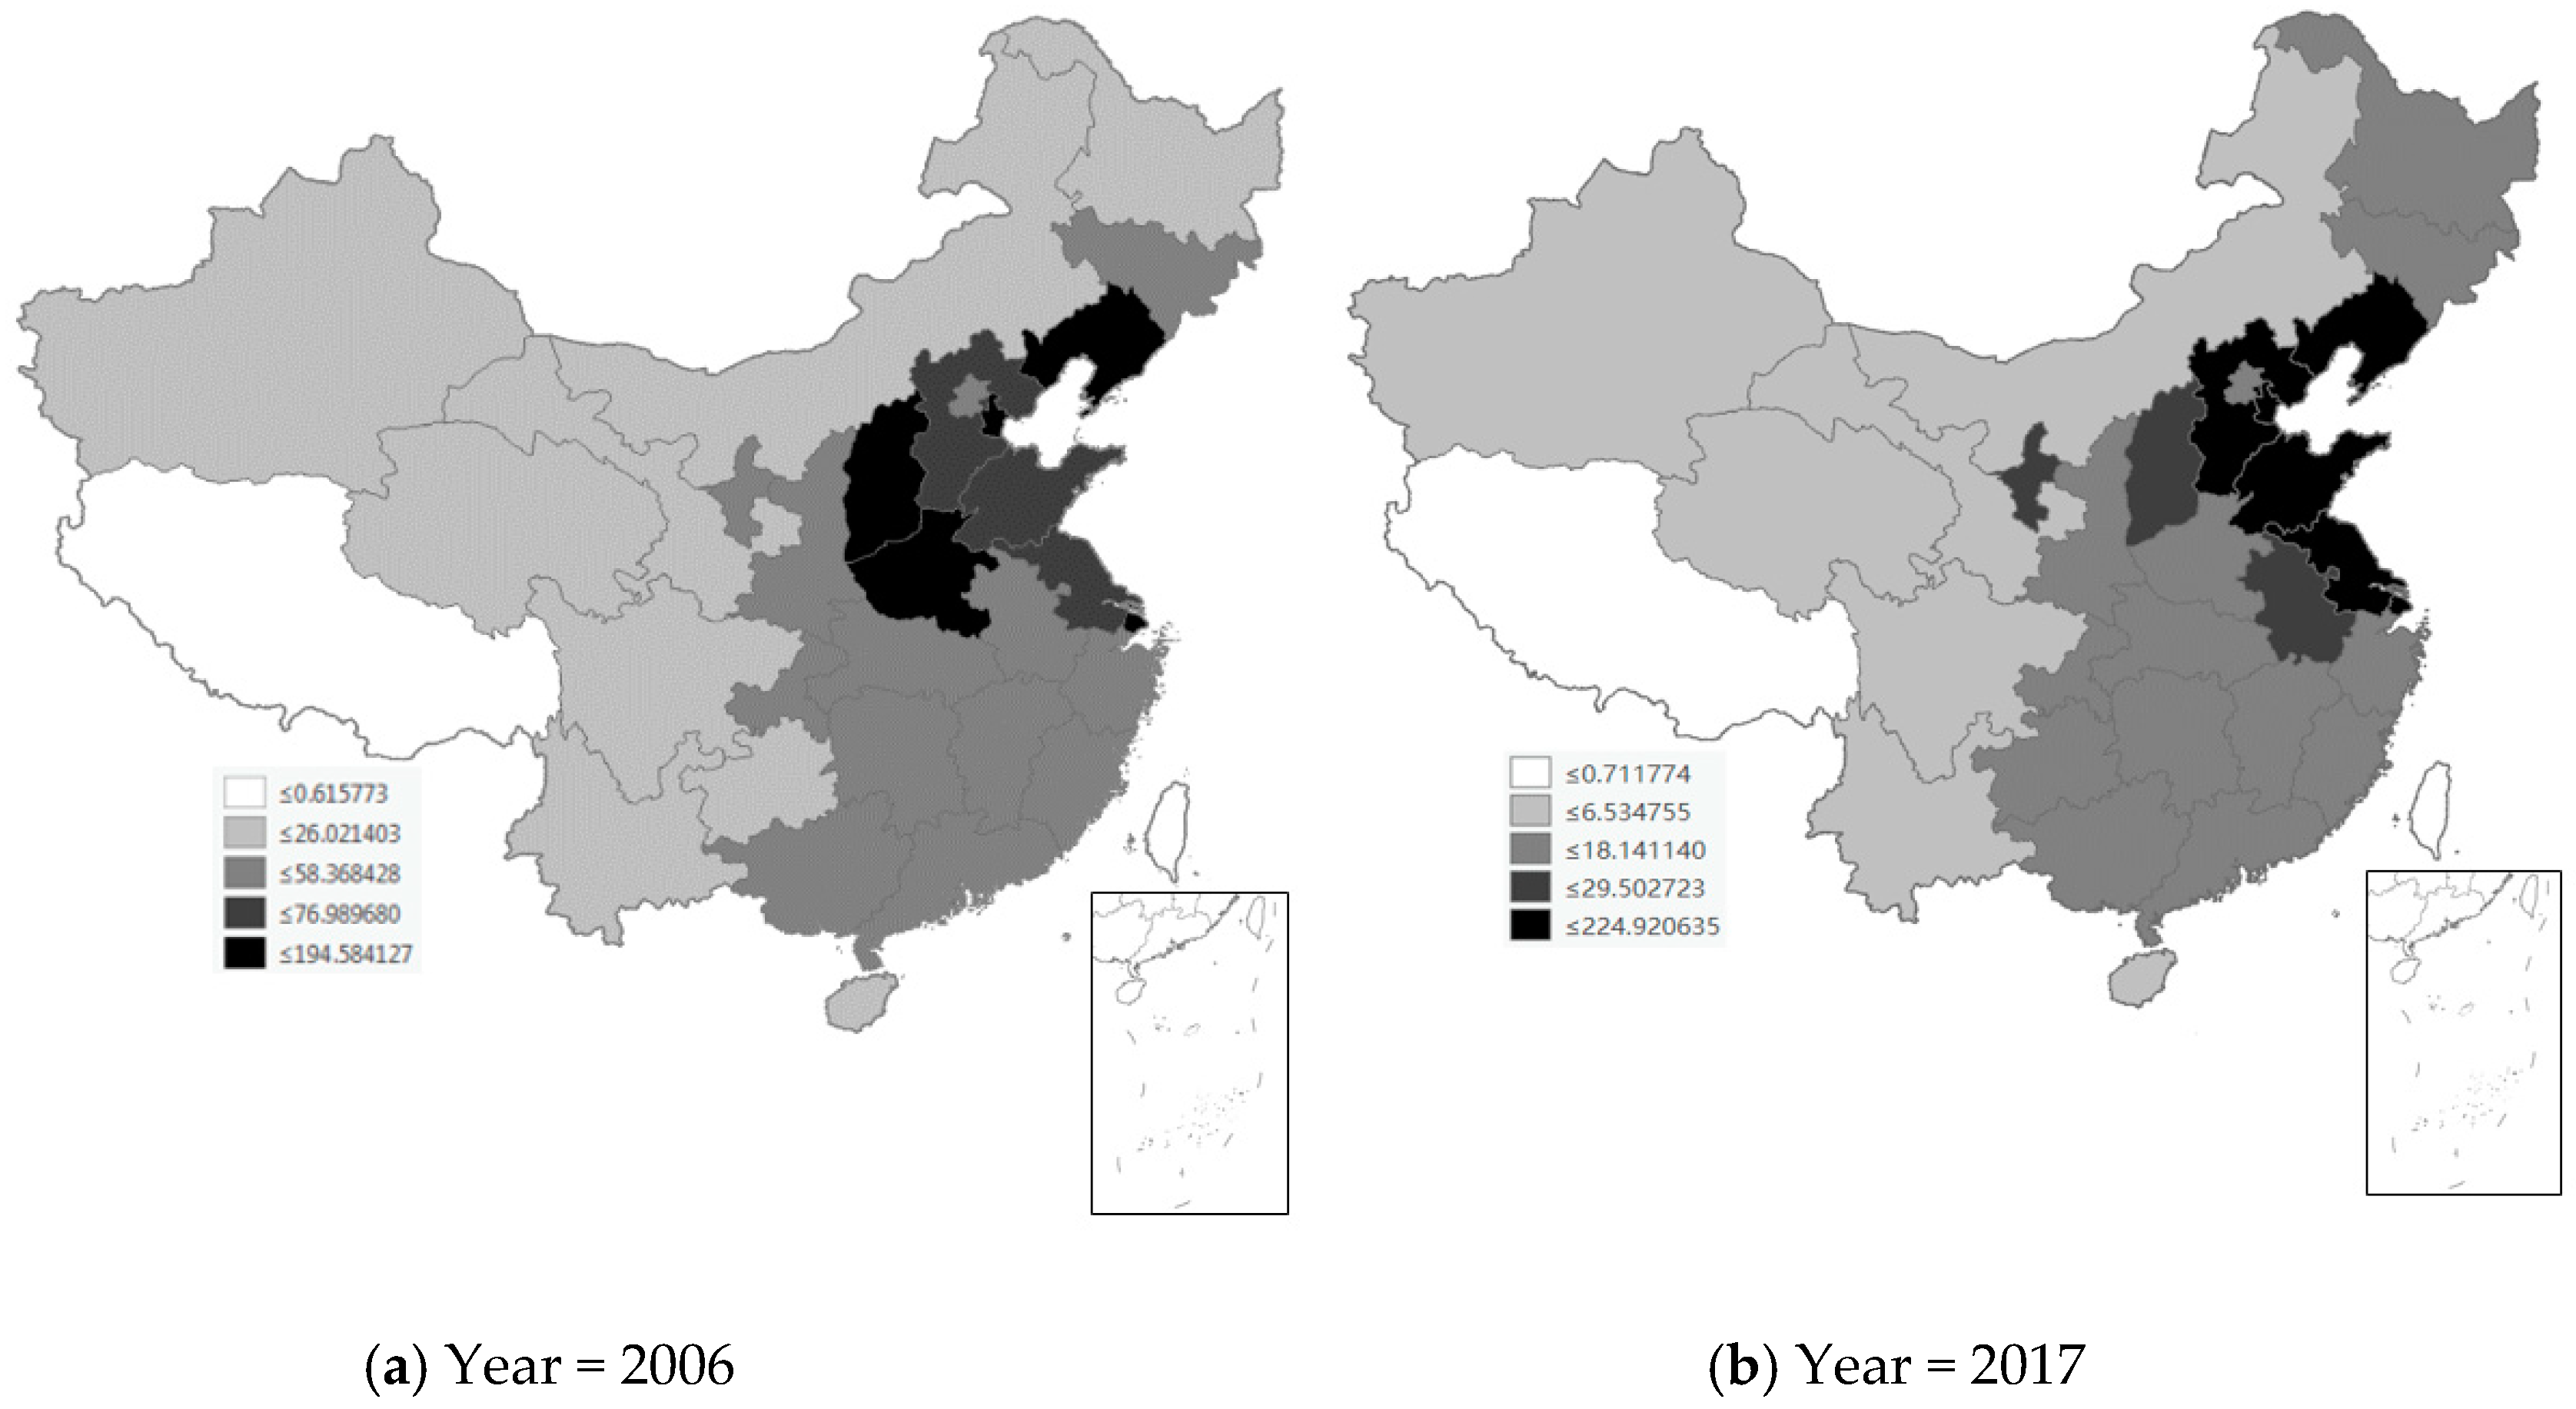
4.1. Air Pollutant Emissions
4.2. Air Pollution Control Policy
4.3. Informal Environmental Regulation
4.4. Control Variables
- (1)
- Economic development. GDP is the representative of economic growth and has a direct impact on air pollutant emissions [31]. Compared with underdeveloped areas, areas with higher economic development usually have more resources and capabilities for environmental governance. To control the impact of per capita economic scale on air pollutant emissions, we control the per capita GDP (PGDP) in this paper.
- (2)
- Industrial structure. The industrial layout and industrial development scale are closely related to environmental quality. Different industrial structures correspond to different pollution discharge structures [5]. We use the industrial structure (IND) variable, calculated as the proportion of the secondary industry’s GDP to the total GDP, to control the impact of regional industrialization development on air pollutant emissions.
- (3)
- S&T expenditure. Previous studies have shown that S&T has a positive impact on environmental protection [32]. Based on this, we construct the technology expenditure ratio (TEC) variable to control the impact of S&T expenditure on air pollutant emissions by calculating the proportion of provincial government S&T expenditure to the total fiscal expenditure of the year.
- (4)
- Energy consumption. Energy consumption is a key factor affecting air pollutant emissions. Al-Mulali and Ozturk [33] found that energy consumption and air pollution showed a positive long-term two-way relationship. To control the impact of energy consumption on air pollutant emissions, we use the per capita energy consumption (PEC) for control.
- (5)
- Population density. Population size is one of the biggest drivers of atmospheric pollutant emissions [31]. Considering the large differences in administrative divisions and population size between provinces, the direct use of absolute population indicators is not scientifically comparable. Therefore, we use population density (PPOP), the population per unit area, to characterize the impact of population agglomeration on air pollutant emissions.
- (6)
- The degree of opening-up. The degree of opening-up reflected by FDI is an essential factor for China’s environmental pollution research. Existing research shows that the direction of FDI impact on environmental quality is not certain. For example, Pollution Halo Hypothesis suggests that FDI can improve environmental quality by introducing environmentally friendly technologies and products [34], but Pollution Haven Hypothesis argues that FDI can deteriorate its environmental quality by transferring highly polluting industries to host countries [44]. We use the proportion of FDI in GDP to measure the degree of opening-up to examine its impact on China’s air pollutant emissions.
4.5. Descriptive Statistics
5. Results and Discussion
5.1. Spatial Regression Analysis
5.2. Discussions
5.3. Robust Tests
6. Conclusions
Author Contributions
Funding
Acknowledgments
Conflicts of Interest
Appendix A

References
- Liu, M.; Shadbegian, R.; Zhang, B. Does environmental regulation affect labor demand in China? Evidence from the textile printing and dyeing industry. J. Environ. Econ. Manag. 2017, 86, 277–294. [Google Scholar] [CrossRef]
- Song, Y.; Liu, B.; Chen, X.; Liu, J. The Agglomeration of manufacturing industry, innovation and haze pollution in China: Theory and evidence. Int. J. Environ. Res. Public Health 2020, 17, 817. [Google Scholar] [CrossRef] [PubMed]
- Zheng, D.; Shi, M. Multiple environmental policies and pollution haven hypothesis: Evidence from China’s polluting industries. J. Clean. Prod. 2017, 141, 295–304. [Google Scholar] [CrossRef]
- Li, G.; He, Q.; Shao, S.; Cao, J. Environmental non-governmental organizations and urban environmental governance: Evidence from China. J. Environ. Manag. 2018, 206, 1296–1307. [Google Scholar] [CrossRef] [PubMed]
- Ning, L.; Wang, F. Does FDI Bring Environmental knowledge spillovers to developing countries? The role of the local industrial structure. Environ. Resour. Econ. 2018, 71, 381–405. [Google Scholar] [CrossRef]
- Marconi, D. Environmental regulation and revealed comparative advantages in Europe: Is China a pollution haven? Rev. Int. Econ. 2012, 20, 616–635. [Google Scholar] [CrossRef]
- Kathuria, V. Informal regulations of pollution in a developing country: Evidence from India. Ecol. Econ. 2007, 63, 403–417. [Google Scholar] [CrossRef]
- Emerson, K.; Nabatchi, T.; Balogh, S. An integrative framework for collaborative governance. J. Public Adm. Res. Theory 2012, 22, 1–29. [Google Scholar] [CrossRef]
- Auffhammer, M.; Kellogg, R. Clearing the air? The effects of gasoline content regulation on air quality. Am. Econ. Rev. 2011, 101, 2687–2722. [Google Scholar] [CrossRef]
- Viard, V.B.; Fu, S.H. The effect of Beijing’s driving restrictions on pollution and economic activity. J. Public Econ. 2015, 125, 98–115. [Google Scholar] [CrossRef]
- Greenstone, M. The impacts of environmental regulations on industrial activity: Evidence from the 1970 and 1977 Clean Air Act Amendments and the census of manufactures. J. Political Econ. 2002, 110, 1175–1219. [Google Scholar] [CrossRef]
- Jin, Y.; Andersson, H.; Zhang, S. Air pollution control policies in China: A retrospective and prospects. Int. J. Environ. Res. Public Health 2016, 13, 1219. [Google Scholar] [CrossRef] [PubMed]
- Fowlie, M. Emissions trading, electricity restructuring, and investment in pollution abatement. Am. Econ. Rev. 2010, 100, 837–869. [Google Scholar] [CrossRef]
- Merel, P.; Smith, A.; Williams, J.; Wimberger, E. Cars on crutches: How much abatement do smog check repairs actually provide? J. Environ. Econ. Manag. 2014, 67, 371–395. [Google Scholar] [CrossRef]
- Perino, G.; Talavera, O. The benefits of spatially differentiated regulations: The response to acid rain by U.S. States prior to the Acid Rain Program. Am. J. Agric. Econ. 2014, 96, 108–123. [Google Scholar] [CrossRef]
- Schlottmann, A. A regional analysis of air quality standards, coal conversion, and the steam-electric coal market. J. Reg. Sci. 1976, 16, 375–387. [Google Scholar] [CrossRef]
- Blackman, A.; Kildegaard, A. Clean technological change in developing-country industrial clusters: Mexican leather tanning. Environ. Econ. Policy Stud. 2010, 12, 115–132. [Google Scholar] [CrossRef]
- Wang, H.; Wheeler, D. Financial incentives and endogenous enforcement in China’s pollution levy system. J. Environ. Econ. Manag. 2005, 49, 174–196. [Google Scholar] [CrossRef]
- Keller, W.; Levinson, A. Pollution abatement costs and foreign direct investment inflows to US states. Rev. Econ. Stat. 2002, 84, 691–703. [Google Scholar] [CrossRef]
- Zhang, G.; Zhang, Z.; Gao, X.; Yu, L.; Wang, S.; Wang, Y. Impact of energy conservation and emissions reduction policy means coordination on economic growth: Quantitative evidence from China. Sustainability 2017, 9, 686. [Google Scholar] [CrossRef]
- Goldar, B.; Banerjee, N. Impact of informal regulations of pollution on water quality in rivers in India. J. Environ. Manag. 2004, 73, 117–130. [Google Scholar] [CrossRef] [PubMed]
- Feres, J.; Reynaud, A. Assessing the impact of formal and informal regulations on environmental and economic performance of Brazilian manufacturing firms. Environ. Resour. Econ. 2012, 52, 65–85. [Google Scholar] [CrossRef]
- Cole, M.A.; Elliott, R.J.R.; Wu, S. Industrial activity and the environment in China: An industry-level analysis. China Econ. Rev. 2008, 19, 393–408. [Google Scholar] [CrossRef]
- Blackman, A. Alternative pollution control policies in developing countries. Rev. Environ. Econ. Policy 2010, 4, 234–253. [Google Scholar] [CrossRef]
- Zheng, S.; Kahn, M.E.; Sun, W.; Luo, D. Incentives for China’s urban mayors to mitigate pollution externalities: The role of the central government and public environmentalism. Reg. Sci. Urban Econ. 2014, 47, 61–71. [Google Scholar] [CrossRef]
- Dasgupta, S.; Laplante, B.; Mamingi, N.; Wang, H. Industrial environmental performance in China: The impact of inspections. World Bank Policy Res. Work. Pap. 2000. [Google Scholar] [CrossRef]
- Ehrlich, P.R.; Holdren, J.P. Impact of population growth. Science 1971, 171, 1212–1217. [Google Scholar] [CrossRef]
- Dietz, T.; Rosa, E.A. Rethinking the environmental impacts of population, affluence and technology. Hum. Ecol. Rev. 1994, 1, 277–300. [Google Scholar]
- Shao, S.; Yang, L.; Yu, M.; Yu, M. Estimation, characteristics, and determinants of energy-related industrial CO2 emissions in Shanghai (China), 1994–2009. Energy Policy 2011, 39, 6476–6494. [Google Scholar] [CrossRef]
- York, R.; Rosa, E.A.; Dietz, T. STIRPAT, IPAT and ImPACT: Analytic tools for unpacking the driving forces of environmental impacts. Ecol. Econ. 2003, 46, 351–365. [Google Scholar] [CrossRef]
- Zhu, L.; Gan, Q.; Liu, Y.; Yan, Z. The impact of foreign direct investment on SO2 emissions in the Beijing-Tianjin-Hebei region: A spatial econometric analysis. J. Clean. Prod. 2017, 166, 189–196. [Google Scholar] [CrossRef]
- Yu, S.; Wei, Y.-M.; Wang, K. Provincial allocation of carbon emission reduction targets in China: An approach based on improved fuzzy cluster and Shapley value decomposition. Energy Policy 2014, 66, 630–644. [Google Scholar] [CrossRef]
- Al-Mulali, U.; Ozturk, I. The effect of energy consumption, urbanization, trade openness, industrial output, and the political stability on the environmental degradation in the MENA (Middle East and North African) region. Energy 2015, 84, 382–389. [Google Scholar] [CrossRef]
- Eskeland, G.A.; Harrison, A.E. Moving to greener pastures? Multinationals and the pollution haven hypothesis. Natl. Bur. Econ. Res. 2002. [Google Scholar] [CrossRef]
- Elhorst, J.P. Spatial panel data models. In Spatial Econometrics: From Cross-Sectional Data to Spatial Panels; Springer: Berlin/Heidelberg, Germany, 2014; pp. 37–93. [Google Scholar]
- LeSage, J.P.; Pace, R.K. Spatial econometric models. In Handbook of Applied Spatial Analysis; Springer: Berlin/Heidelberg, Germany, 2010; pp. 355–376. [Google Scholar]
- Chen, X.; Shao, S.; Tian, Z.; Xie, Z.; Yin, P. Impacts of air pollution and its spatial spillover effect on public health based on China’s big data sample. J. Clean. Prod. 2017, 142, 915–925. [Google Scholar] [CrossRef]
- Cole, M.A.; Elliott, R.J.R.; Zhang, J. Growth, foreign direct investment, and the environment: Evidence from Chinese cities. J. Reg. Sci. 2011, 51, 121–138. [Google Scholar] [CrossRef]
- Albrizio, S.; Kozluk, T.; Zipperer, V. Environmental policies and productivity growth: Evidence across industr.ies and firms. J. Environ. Econ. Manag. 2017, 81, 209–226. [Google Scholar] [CrossRef]
- Calel, R.; Dechezlepretre, A. Environmental policy and directed technological change: Evidence from the European carbon market. Rev. Econ. Stat. 2016, 98, 173–191. [Google Scholar] [CrossRef]
- Dean, J.M.; Lovely, M.E.; Wang, H. Are foreign investors attracted to weak environmental regulations? Evaluating the evidence from China. J. Dev. Econ. 2009, 90, 1–13. [Google Scholar] [CrossRef]
- Ning, L.; Wang, F.; Li, J. Urban innovation, regional externalities of foreign direct investment and industrial agglomeration: Evidence from Chinese cities. Res. Policy 2016, 45, 830–843. [Google Scholar] [CrossRef]
- Langpap, C.; Shimshack, J.P. Private citizen suits and public enforcement: Substitutes or complements? J. Environ. Econ. Manag. 2010, 59, 235–249. [Google Scholar] [CrossRef]
- List, J.A.; Co, C.Y. The effects of environmental regulations on foreign direct investment. J. Environ. Econ. Manag. 2000, 40, 1–20. [Google Scholar] [CrossRef]
- Liu, X.; Wang, C.; Wei, Y. Do local manufacturing firms benefit from transactional linkages with multinational enterprises in China? J. Int. Bus. Stud. 2009, 40, 1113–1130. [Google Scholar] [CrossRef]
- Su, B.; Ang, B.W. Input-output analysis of CO2 emissions embodied in trade: A multi-region model for China. Appl. Energy 2014, 114, 377–384. [Google Scholar] [CrossRef]
- Zhang, J.; Fu, X. FDI and environmental regulations in China. J. Asia Pac. Econ. 2008, 13, 332–353. [Google Scholar] [CrossRef]
- Cole, M.A.; Elliott, R.J.R.; Strobl, E. The environmental performance of firms: The role of foreign ownership, training, and experience. Ecol. Econ. 2008, 65, 538–546. [Google Scholar] [CrossRef]
- Kemp, R.; Pontoglio, S. The innovation effects of environmental policy instruments—A typical case of the blind men and the elephant? Ecol. Econ. 2011, 72, 28–36. [Google Scholar] [CrossRef]
- Chang, C.H.; Sam, A.G. Corporate environmentalism and environmental innovation. J. Environ. Manag. 2015, 153, 84–92. [Google Scholar] [CrossRef]
- Horbach, J.; Rammer, C.; Rennings, K. Determinants of eco-innovations by type of environmental impact—The role of regulatory push/pull, technology push and market pull. Ecol. Econ. 2012, 78, 112–122. [Google Scholar] [CrossRef]
- Lanoie, P.; Laurent-Lucchetti, J.; Johnstone, N.; Ambec, S. Environmental policy, innovation and performance: New insights on the Porter hypothesis. J. Econ. Manag. Strategy 2011, 20, 803–842. [Google Scholar] [CrossRef]
- Pretty, J. The Consumption of a finite planet: Well-being, convergence, divergence and the nascent green economy. Environ. Resour. Econ. 2013, 55, 475–499. [Google Scholar] [CrossRef]
- Abdouli, M.; Hammami, S. Economic growth, FDI inflows and their impact on the environment: An empirical study for the MENA countries. Qual. Quant. 2017, 51, 121–146. [Google Scholar] [CrossRef]
- Zheng, X.; Li, F.; Song, S.; Yu, Y. Central government’s infrastructure investment across Chinese regions: A dynamic spatial panel data approach. China Econ. Rev. 2013, 27, 264–276. [Google Scholar] [CrossRef]


| Scores | Quantitative Criterion | |
|---|---|---|
| 5 | Make sure the legal status or enforced requirements for reducing and preventing the atmospheric pollutant emissions; formulate mandatory standards for reducing the atmospheric pollutant emissions; forcibly require strictly implementing environmental impact assessment, formulating prevention of pollution program and implementing “three simultaneousness” system; enforce to implement charging discharge fees system, establish new credit or price punitive system for pollution projects, require eliminating equipment of high pollution and high emissions; require formulating relevant policies to promote air pollution prevention and control from the legislation; formulate enforced methods to promote preventing air pollution, etc. | Detailed |
| 3 | Clearly require reducing atmospheric pollutant emissions, formulate specific embodiment of air pollution prevention; support pollution prevention and control from the aspects of administrative licensing, taxation, finance and fees, and also formulate support program; forcibly require strictly implementing environmental impact assessment, formulating prevention of pollution program and implementing “three simultaneousness” system; have formulated pollutant recycling program and program for eliminating equipment of high pollution and high emissions; have formulated a clear air pollution prevention and control goals, but not required to enforce, etc. | General |
| 1 | Only mention the above terms without formulated relevant measures and methods. | Mentioned |
| Type | Variable | Variable Name | Data Source |
|---|---|---|---|
| Air pollutant emissions | PSO2 | SO2 emission intensity | China Environment Yearbook Website: (https://navi.cnki.net/KNavi/YearbookDetail?pcode=CYFD&pykm=YHJSD&bh=) |
| PSD | SD emission intensity | ||
| Air pollution control policy | PSPE | Air pollution control policy intensity | Policy quantification [20] and China Environment Yearbook Website: (https://navi.cnki.net/KNavi/YearbookDetail?pcode=CYFD&pykm=YHJSD&bh=) |
| Informal environmental regulation | PPTC | Public environmental participation | China Environment Yearbook Website: (https://navi.cnki.net/KNavi/YearbookDetail?pcode=CYFD&pykm=YHJSD&bh=) |
| SEE | Media environmental monitoring | ||
| Control variables | PGDP | Per capita GDP | China Statistical Yearbook Website: (http://www.stats.gov.cn/tjsj/ndsj/) |
| IND | Industrial structure | ||
| TEC | Technology expenditure ratio | ||
| PEC | Per capita energy consumption | ||
| PPOP | Population density | ||
| FDI | Degree of opening-up |
| Variables | Mean | SD | 1 | 2 | 3 | 4 | 5 | 6 | 7 | 8 | 9 | 10 | 11 |
|---|---|---|---|---|---|---|---|---|---|---|---|---|---|
| 1. PSO2# | 3.458 | 1.139 | 1.000 | ||||||||||
| 2. PSD# | 3.074 | 1.005 | 0.925 *** | 1.000 | |||||||||
| 3. PSPE# | 12.620 | 0.505 | −0.239 *** | −0.123 ** | 1.000 | ||||||||
| 4. PPTC# | 7.037 | 3.438 | 0.368 *** | 0.269 *** | −0.579 *** | 1.000 | |||||||
| 5. SEE# | 2.167 | 1.186 | 0.373 *** | 0.317 *** | −0.205 *** | 0.123 ** | 1.000 | ||||||
| 6. PGDP# | 5.660 | 0.562 | 0.264 *** | 0.305 *** | 0.447 *** | −0.280 *** | 0.161 *** | 1.000 | |||||
| 7. IND | 0.464 | 0.081 | 0.177 *** | 0.172 *** | −0.060 | 0.372 *** | −0.055 | −0.176 *** | 1.000 | ||||
| 8. TEC | 0.019 | 0.013 | 0.486 *** | 0.468 *** | −0.135 ** | 0.006 | 0.415 *** | 0.660 *** | −0.284 *** | 1.000 | |||
| 9. PEC# | 3.519 | 0.540 | 0.001 | −0.006 | 0.471 *** | −0.284 *** | −0.044 | 0.584 *** | 0.042 | 0.289 *** | 1.000 | ||
| 10. PPOP# | 5.441 | 1.278 | 0.818 *** | 0.805 *** | −0.147 *** | 0.100 * | 0.397 *** | 0.450 *** | −0.159 *** | 0.668 *** | −0.127 ** | 1.000 | |
| 11. FDI | 0.387 | 0.520 | 0.200 *** | 0.195 *** | −0.141 *** | −0.024 | 0.244 *** | 0.279 *** | −0.340 *** | 0.413 *** | 0.033 | 0.406 *** | 1.000 |
| DV: PSO2 | Model (1) | Model (2) | Model (3) | Model (4) | Model (5) |
|---|---|---|---|---|---|
| PGDP | 0.061 (0.369) | 0.088 (0.315) | 0.049 (0.300) | 0.014 (0.277) | 0.015 (0.262) |
| IND | −0.338 (0.300) | −0.368 (0.269) | −0.293 (0.266) | −0.332 (0.218) | −0.289 (0.219) |
| TEC | −0.043 ** (0.018) | −0.044 ** (0.017) | −0.041 ** (0.017) | −0.034 ** (0.015) | −0.031 ** (0.014) |
| PEC | 0.772 *** (0.127) | 0.790 *** (0.129) | 0.781 *** (0.125) | 0.838 *** (0.144) | 0.834 *** (0.141) |
| PPOP | −0.034 (0.539) | −0.235 (0.422) | −0.079 (0.465) | −0.080 (0.407) | 0.108 (0.444) |
| FDI | −0.051 *** (0.015) | −0.048 *** (0.013) | −0.046*** (0.013) | −0.041 *** (0.013) | −0.039 *** (0.013) |
| PSPE | −0.257 *** (0.088) | −0.247 ** (0.097) | −0.217 ** (0.089) | −0.200 ** (0.096) | |
| PPTC | −0.007 (0.007) | −0.012 (0.008) | |||
| PSPE*PPTC | −0.036 (0.029) | −0.037 (0.025) | |||
| SEE | −0.013 * (0.007) | −0.014 * (0.007) | |||
| PSPE*SEE | −0.044 ** (0.02) | −0.046 ** (0.020) | |||
| W*PGDP | −0.884 (0.572) | −0.647 (0.58) | −0.550 (0.799) | −0.899 (0.559) | −0.767 (0.800) |
| W*IND | 0.494 (0.566) | 0.671 (0.529) | 0.831 (0.726) | 0.804 * (0.444) | 0.698 (0.655) |
| W*TEC | −0.204 *** (0.056) | −0.197 *** (0.063) | −0.196 *** (0.08) | −0.155 ** (0.064) | −0.130 (0.091) |
| W*PEC | −0.029 (0.580) | −0.124 (0.553) | −0.381 (0.999) | 0.172 (0.515) | 0.125 (0.962) |
| W*PPOP | 2.808 (2.394) | 2.620 (2.212) | 2.149 (2.265) | 1.628 (2.113) | 0.786 (2.355) |
| W*FDI | 0.598 *** (0.148) | 0.626 *** (0.15) | 0.532 *** (0.154) | 0.732 *** (0.135) | 0.678 *** (0.170) |
| W*PSPE | 0.091 (0.172) | 0.209 (0.340) | 0.221 (0.191) | 0.162 (0.275) | |
| W*PPTC | −0.006 (0.023) | 0.013 (0.023) | |||
| W*PSPE*PPTC | 0.015 (0.088) | 0.048 (0.085) | |||
| W*SEE | −0.001 (0.025) | 0.002 (0.027) | |||
| W*PSPE * SEE | −0.135 * (0.078) | −0.132 (0.092) | |||
| W*PSO2 | −0.045 (0.309) | −0.056 (0.297) | −0.055 (0.275) | −0.139 (0.304) | −0.063 (0.279) |
| LM-LAG | 3.610 ** | 4.672 *** | 4.657 ** | 3.661 * | 2.988 * |
| Robust LM-LAG | 16.852 *** | 18.968 *** | 16.605 *** | 19.271 *** | 16.658 *** |
| LM-ERR | 328.001 *** | 389.331 *** | 356.630 *** | 374.515 *** | 321.366 *** |
| Robust LM-ERR | 341.243 *** | 403.627 *** | 368.578 *** | 390.125 *** | 335.036 *** |
| LR test spatial effect | 668.250 *** | 674.030 *** | 709.260 *** | 690.380 *** | 707.940 *** |
| Spatial Hausman tests | 19.350 *** | 149.260 *** | 147.790 *** | 14.120 ** | 20.090 ** |
| R2 | 0.600 | 0.618 | 0.633 | 0.648 | 0.663 |
| DV: PSD | Model (6) | Model (7) | Model (8) | Model (9) | Model (10) |
|---|---|---|---|---|---|
| PGDP | −0.787 ** (0.316) | −0.493 ** (0.245) | −0.595 ** (0.234) | −0.486 ** (0.251) | −0.595 ** (0.239) |
| IND | −1.056 *** (0.307) | −1.227 *** (0.293) | −1.135 *** (0.294) | −1.233 *** (0.295) | −1.137 *** (0.295) |
| TEC | −0.020 (0.027) | −0.019 (0.023) | −0.017 (0.022) | −0.022 (0.024) | −0.019 (0.023) |
| PEC | 0.747 *** (0.151) | 0.807 *** (0.163) | 0.799 *** (0.148) | 0.796 *** (0.163) | 0.796 *** (0.149) |
| PPOP | 0.477 (0.888) | 0.333 (0.603) | 0.324 (0.684) | 0.290 (0.609) | 0.303 (0.681) |
| FDI | 0.001 (0.022) | 0.006 (0.017) | 0.011 (0.016) | 0.009 (0.018) | 0.014 (0.017) |
| PSPE | −0.393 *** (0.132) | −0.345 *** (0.131) | −0.391 *** (0.143) | −0.341 ** (0.14) | |
| PPTC | −0.039 *** (0.015) | −0.038 ** (0.015) | |||
| PSPE*PPTC | −0.061 * (0.033) | −00.061 * (0.033) | |||
| SEE | 0.008 (0.01) | 0.005 (0.011) | |||
| PSPE*SEE | −0.002 (0.026) | −0.006 (0.023) | |||
| Spatial effects W | 0.734 *** (0.086) | 0.727 *** (0.066) | 0.720 *** (0.070) | 0.725 *** (0.066) | 0.719 *** (0.071) |
| LM-LAG | 78.765 *** | 68.331 *** | 67.412 *** | 59.220 *** | 55.780 *** |
| Robust LM-LAG | 0.216 | 0.868 | 0.779 | 1.569 | 1.844 |
| LM-ERR | 389.975 *** | 314.106 *** | 317.177 *** | 256.673 *** | 236.446 *** |
| Robust LM-ERR | 311.426 *** | 246.642 *** | 250.545 *** | 199.022 *** | 182.51 *** |
| LR test spatial effect | 475.05 *** | 469.51 *** | 492.53 *** | 463.04 *** | 479.58 *** |
| Spatial Hausman tests | 68.680 *** | 18.680 *** | 498.730 *** | 16.560 ** | 110.670 *** |
| R2 | 0.321 | 0.349 | 0.386 | 0.353 | 0.389 |
| DV: PSO2 | Direct Impact | Indirect Impact | Total Impact |
|---|---|---|---|
| PGDP | 0.032 (0.270) | −0.648 (0.758) | −0.616 (0.714) |
| IND | −0.286 (0.231) | 0.754 (0.695) | 0.468 (0.696) |
| TEC | −0.030 * (0.015) | −0.128 (0.094) | −0.158 * (0.093) |
| PEC | 0.848 *** (0.143) | −0.063 (0.970) | 0.786 (0.935) |
| PPOP | 0.120 (0.448) | 0.885 (2.511) | 1.005 (2.261) |
| FDI | −0.040 *** (0.013) | 0.675 ** (0.285) | 0.635 ** (0.292) |
| PSPE | −0.198 ** (0.099) | 0.160 (0.299) | −0.038 (0.31) |
| PPTC | −0.013 (0.008) | 0.012 (0.024) | 0.000 (0.026) |
| PSPE*PPTC | −0.035 (0.025) | 0.049 (0.089) | 0.013 (0.079) |
| SEE | −0.014 * (0.007) | 0.004 (0.027) | −0.011 (0.028) |
| PSPE*SEE | −0.047 ** (0.019) | −0.130 (0.12) | −0.177 (0.123) |
| DV: PSO2 | Model (A1) | Model (A2) | Model (A3) | Model (A4) | Model (A5) |
|---|---|---|---|---|---|
| PGDP | −0.144 (0.341) | −0.127 (0.312) | −0.152 (0.288) | −0.171 (0.278) | −0.201 (0.261) |
| IND | −0.349 (0.284) | −0.379 (0.257) | −0.231 (0.230) | −0.329 (0.228) | −0.183 (0.185) |
| TEC | −0.043 ** (0.018) | −0.041 ** (0.017) | −0.040 ** (0.018) | −0.032 * (0.018) | −0.032 * (0.018) |
| PEC | 0.695 *** (0.191) | 0.741 *** (0.196) | 0.701 *** (0.192) | 0.803 *** (0.201) | 0.766 *** (0.194) |
| PPOP | 0.210 (0.819) | −0.014 (0.810) | 0.450 (0.852) | 0.141 (0.730) | 0.624 (0.758) |
| FDI | −0.071 *** (0.022) | −0.067 *** (0.021) | −0.075 *** (0.021) | −0.061 *** (0.023) | −0.069 *** (0.022) |
| PSPE | −0.255 *** (0.092) | −0.214 ** (0.100) | −0.198 ** (0.098) | −0.158 * (0.098) | |
| PPTC | −0.005 (0.009) | −0.008 (0.010) | |||
| PSPE*PPTC | −0.048 (0.033) | −0.049 (0.031) | |||
| SEE | −0.013 * (0.007) | −0.013 * (0.007) | |||
| PSPE*SEE | −0.042 * (0.023) | −0.039 ** (0.019) | |||
| LW*PGDP | −0.533 (0.400) | −0.302 (0.399) | −0.181 (0.426) | −0.460 (0.392) | −0.326 (0.417) |
| LW*IND | 0.383 (0.614) | 0.507 (0.586) | 0.492 (0.604) | 0.497 (0.505) | 0.480 (0.516) |
| LW*TEC | −0.029 (0.045) | −0.03 (0.048) | −0.020 (0.040) | −0.024 (0.044) | −0.014 (0.039) |
| LW*PEC | −0.028 (0.386) | −0.087 (0.397) | −0.167 (0.419) | 0.028 (0.375) | −0.056 (0.392) |
| LW*PPOP | −0.783 (1.466) | −0.423 (1.444) | −1.022 (1.440) | −0.573 (1.296) | −1.252 (1.278) |
| LW*FDI | 0.188 ** (0.078) | 0.196 *** (0.074) | 0.229 *** (0.074) | 0.213 *** (0.075) | 0.250 *** (0.067) |
| LW*PSPE | −0.008 (0.189) | −0.036 (0.199) | 0.006 (0.205) | −0.017 (0.197) | |
| LW*PPTC | −0.007 (0.009) | −0.003 (0.010) | |||
| LW*PSPE*PPTC | 0.047 (0.050) | 0.057 (0.042) | |||
| LW*SEE | −0.001 (0.013) | −0.003 (0.014) | |||
| LW*PSPE*SEE | −0.041 (0.039) | −0.054 * (0.029) | |||
| LW*PSO2 | 0.128 (0.163) | 0.099 (0.155) | 0.164 (0.167) | 0.064 (0.150) | 0.137 (0.156) |
| Spatial Hausman tests | 44.960 *** | 30.330 *** | 15.830 ** | 1099.780 *** | 19.950 ** |
| R2 | 0.548 | 0.570 | 0.599 | 0.600 | 0.631 |
| DV: PSD | Model (A6) | Model (A7) | Model (A8) | Model (A9) | Model (A10) |
|---|---|---|---|---|---|
| PGDP | −0.798 *** (0.186) | −0.492 ** (0.199) | −0.596 *** (0.189) | −0.469 ** (0.207) | −0.574 *** (0.196) |
| IND | −1.074 *** (0.314) | −1.253 *** (0.292) | −1.120 *** (0.302) | −1.273 *** (0.292) | −1.134 *** (0.303) |
| TEC | −0.020 (0.026) | −0.014 (0.023) | −0.016 (0.022) | −0.018 (0.023) | −0.020 (0.023) |
| PEC | 0.658 *** (0.157) | 0.742 *** (0.174) | 0.697 *** (0.154) | 0.724 *** (0.172) | 0.683 *** (0.154) |
| PPOP | 0.262 (0.804) | 0.073 (0.565) | 0.234 (0.664) | 0.015 (0.571) | 0.197 (0.665) |
| FDI | 0.007 (0.014) | 0.014 (0.012) | 0.019 * (0.011) | 0.016 (0.012) | 0.021 * (0.012) |
| PSPE | −0.388 *** (0.14) | −0.325 ** (0.142) | −0.396 *** (0.151) | −0.333 ** (0.152) | |
| PPTC | −0.035 ** (0.014) | −0.034 ** (0.014) | |||
| PSPE*PPTC | −0.069 ** (0.031) | −0.068 ** (0.031) | |||
| SEE | 0.011 (0.011) | 0.009 (0.011) | |||
| PSPE*SEE | 0.011 (0.028) | 0.009 (0.024) | |||
| Spatial effects LW | 0.476 *** (0.085) | 0.482 *** (0.077) | 0.473 *** (0.079) | 0.482 *** (0.079) | 0.475 *** (0.083) |
| Spatial Hausman tests | 13.890 ** | 17.520 ** | 44.790 *** | 157.110 *** | 41.310 *** |
| R2 | 0.344 | 0.360 | 0.403 | 0.361 | 0.403 |
| DV: PSO2 | Model (B1) | Model (B2) | Model (B3) | Model (B4) | Model (B5) |
|---|---|---|---|---|---|
| PGDP_1 | −0.003 (0.353) | 0.010 (0.323) | 0.075 (0.322) | −0.040 (0.295) | 0.039 (0.302) |
| IND_1 | −0.360 (0.276) | −0.384 (0.253) | −0.414 (0.255) | −0.361 (0.225) | −0.405 * (0.213) |
| TEC_1 | −0.062 *** (0.017) | −0.063 *** (0.016) | −0.065 *** (0.014) | −0.057 *** (0.015) | −0.059 *** (0.012) |
| PEC_1 | 0.673 *** (0.116) | 0.686 *** (0.118) | 0.684 *** (0.116) | 0.719 *** (0.131) | 0.718 *** (0.131) |
| PPOP_1 | −0.249 (0.524) | −0.413 (0.460) | −0.273 (0.477) | −0.320 (0.459) | −0.141 (0.465) |
| FDI_1 | −0.066 *** (0.014) | −0.064 *** (0.012) | −0.056 *** (0.014) | −0.059 *** (0.011) | −0.045 *** (0.013) |
| PSPE_1 | −0.196 ** (0.085) | −0.195 ** (0.089) | −0.164 * (0.088) | −0.159 * (0.092) | |
| PPTC_1 | −0.002 (0.005) | −0.005 (0.005) | |||
| PSPE_1*PPTC_1 | −0.011 (0.022) | −0.011 (0.018) | |||
| SEE_1 | −0.005 * (0.009) | −0.006 * (0.009) | |||
| PSPE_1*SEE_1 | −0.037 * (0.023) | −0.041 ** (0.021) | |||
| W*PGDP_1 | −0.254 (0.438) | −0.111 (0.497) | −0.046 (0.594) | −0.210 (0.485) | −0.099 (0.634) |
| W*IND_1 | 0.992 ** (0.491) | 1.118 ** (0.476) | 0.477 (0.615) | 1.199 *** (0.401) | 0.369 (0.562) |
| W*TEC_1 | −0.200 *** (0.064) | −0.201 *** (0.071) | −0.191 *** (0.073) | −0.163 ** (0.079) | −0.131 * (0.074) |
| W*PEC_1 | −0.589 (0.393) | −0.661 (0.41) | −0.213 (0.856) | −0.511 (0.422) | 0.119 (0.819) |
| W*PPOP_1 | 3.710 (2.437) | 3.621 (2.215) | 2.770 (2.395) | 2.917(2.212) | 1.346 (2.572) |
| W*FDI_1 | 0.650 *** (0.187) | 0.667 *** (0.194) | 0.698 *** (0.179) | 0.726 *** (0.192) | 0.862 *** (0.189) |
| W*PSPE_1 | 0.113 (0.252) | −0.293 (0.399) | 0.181 (0.244) | −0.305 (0.315) | |
| W*PPTC_1 | 0.026 (0.021) | 0.042 ** (0.019) | |||
| W*PSPE_1*PPTC_1 | 0.113 (0.075) | 0.168 * (0.097) | |||
| W*SEE_1 | −0.009 (0.028) | 0.018 (0.041) | |||
| W*PSPE_1*SEE_1 | −0.078 (0.086) | −0.133 (0.096) | |||
| W*PSO2 | 0.227 (0.192) | 0.220 (0.191) | 0.108 (0.211) | 0.242 (0.195) | 0.129 (0.198) |
| Spatial Hausman tests | 21.270 *** | 25.440 *** | 19.790 ** | 80.970 *** | 131.880 *** |
| R2 | 0.595 | 0.606 | 0.621 | 0.620 | 0.646 |
| DV: PSD | Model (B6) | Model (B7) | Model (B8) | Model (B9) | Model (B10) |
|---|---|---|---|---|---|
| PGDP_1 | −0.403 (0.267) | −0.115 (0.216) | −0.195 (0.207) | −0.131 (0.231) | −0.220 (0.223) |
| IND_1 | −0.872 *** (0.313) | −1.044 *** (0.315) | −1.004 *** (0.299) | −1.047 *** (0.311) | −1.003 *** (0.299) |
| TEC_1 | −0.004 (0.025) | −0.003 (0.024) | −0.002 (0.023) | −0.006 (0.024) | −0.005 (0.023) |
| PEC_1 | 0.438 *** (0.131) | 0.497 *** (0.14) | 0.499 *** (0.131) | 0.500 *** (0.147) | 0.509 *** (0.138) |
| PPOP_1 | 0.298 (0.884) | 0.160 (0.647) | 0.060 (0.76) | 0.116 (0.656) | 0.029 (0.747) |
| FDI_1 | −0.033 (0.022) | −0.028 (0.017) | −0.024 (0.016) | −0.021 (0.015) | −0.018 (0.015) |
| PSPE_1 | −0.383 *** (0.141) | −0.347 ** (0.138) | −0.363 ** (0.148) | −0.323 ** (0.144) | |
| PPTC_1 | −0.033 ** (0.016) | −0.033 ** (0.015) | |||
| PSPE_1*PPTC_1 | −0.035 * (0.034) | −0.034 * (0.032) | |||
| SEE_1 | 0.010 (0.012) | 0.007 (0.012) | |||
| PSPE_1*SEE_1 | −0.028 (0.031) | −0.032 (0.029) | |||
| Spatial effects W | 0.731 *** (0.066) | 0.710 *** (0.067) | 0.693 *** (0.07) | 0.703 *** (0.07) | 0.688 *** (0.072) |
| Spatial Hausman tests | 10.900 ** | 12.140 ** | 16.660 ** | 16.060 ** | 27.530 *** |
| R2 | 0.158 | 0.228 | 0.268 | 0.244 | 0.281 |
© 2020 by the authors. Licensee MDPI, Basel, Switzerland. This article is an open access article distributed under the terms and conditions of the Creative Commons Attribution (CC BY) license (http://creativecommons.org/licenses/by/4.0/).
Share and Cite
Zhang, Z.; Zhang, G.; Song, S.; Su, B. Spatial Heterogeneity Influences of Environmental Control and Informal Regulation on Air Pollutant Emissions in China. Int. J. Environ. Res. Public Health 2020, 17, 4857. https://doi.org/10.3390/ijerph17134857
Zhang Z, Zhang G, Song S, Su B. Spatial Heterogeneity Influences of Environmental Control and Informal Regulation on Air Pollutant Emissions in China. International Journal of Environmental Research and Public Health. 2020; 17(13):4857. https://doi.org/10.3390/ijerph17134857
Chicago/Turabian StyleZhang, Zhenhua, Guoxing Zhang, Shunfeng Song, and Bin Su. 2020. "Spatial Heterogeneity Influences of Environmental Control and Informal Regulation on Air Pollutant Emissions in China" International Journal of Environmental Research and Public Health 17, no. 13: 4857. https://doi.org/10.3390/ijerph17134857
APA StyleZhang, Z., Zhang, G., Song, S., & Su, B. (2020). Spatial Heterogeneity Influences of Environmental Control and Informal Regulation on Air Pollutant Emissions in China. International Journal of Environmental Research and Public Health, 17(13), 4857. https://doi.org/10.3390/ijerph17134857