Article

Knowledge, Attitude, and Practice of Adolescent Parents on Free Sugar and Influencing Factors about Recognition

Department of Nutrition Science and Food Hygiene, Xiangya School of Public Health, Central South University, 110 Xiangya Road, Changsha 410078, China
*
Author to whom correspondence should be addressed.
These authors contributed equally to this work.
Int. J. Environ. Res. Public Health 2020, 17(11), 4003; https://doi.org/10.3390/ijerph17114003
Submission received: 10 May 2020 / Revised: 1 June 2020 / Accepted: 2 June 2020 / Published: 4 June 2020
(This article belongs to the Section Health Behavior, Chronic Disease and Health Promotion)

Abstract

:
Physiological problems caused by excessive intake of free sugar have been concerning important public health issues, especially the impact on adolescents. The World Health Organization (WHO) strongly recommends controlling daily sugar intake in order to reduce the stress caused by high sugar uptake. Finding out the factors that affect adolescents’ sugar intake will help further interventions to control the intake of sugar. Therefore, we conducted a cross-sectional study among 10 middle schools in Changsha, the capital of Hunan province. Two classes of the first and second grades were randomly selected from each school, and their parents in these classes participated in the survey. Questionnaires were used to access the status of adolescent parents’ knowledge, attitude and practice (KAP) towards free sugar. Out of 1136 valid participants, 70.4% of respondents were female with the mean (Standard Deviation) age of 41.76 (±5.27) years. They had a good attitude but relatively poor knowledge and behavior towards free sugar. Binary logistic regression analysis found that parents whose gender is female, with a high education level and a girl as their child, hold a high level of free sugar recognition. These findings could help free sugar control interventions for adolescents in the future.

1. Introduction

Free sugar includes monosaccharides and disaccharides added to food and beverages by manufacturers, cook or consumers, as well as sugars naturally present in honey, syrups, fruit juices and fruit juice concentrates. Nevertheless, the endogenous sugars in whole fresh fruits and vegetables do not belong to this group. Added sugar is also a widely accepted concept, and its main difference from free sugar is that free sugar contains natural sugars in nonwhole fruits and vegetables. That is, added sugar is part of free sugar [1,2]. Free sugars are simple sugars, and studies have shown that carbohydrates are the main source of energy for the body. Contrary to complex carbohydrates derived from intact and unprocessed vegetables, excessive amounts of simple carbohydrates can easily lead to health problems such as weight gain, while complex carbohydrates can prevent diet-related chronic noncommunicable diseases [3]. Epidemiological and clinical studies reported that added sugar was associated with the prevalence of obesity and diabetes. Sugar-sweetened beverages (SSBs), one of the main sources of free sugar intake, have also been confirmed to result in overweight/obesity, type 2 diabetes and cardiovascular disease and other unhealthy health consequences [4,5,6]. Sugar intake in adolescents is still at a high level [7,8,9], the main sources being SSBs, biscuits, candies, cakes, breads and so on [10,11,12].
From 2002 to 2012, the consumption rate of sugary food for residents over the age of two in China showed an upward trend, from 20.04% to 26.90%. The overall consumption trend was higher in cities than in rural areas, and higher in women than in men. Children and adolescents were high-consumption groups, and the sugary food consumption rate among adolescents aged 12–18 increased from 21.4% to 27.4% (consumption rate—the proportion of people who consumed sugary foods one or more times during the three days of the survey) [13]. In 2015, 10.7% of sugar intake of Chinese children and adolescents exceeded 25 g/d, and sugar intake from beverages accounted for the largest proportion of prepackaged foods, with an average of 13.2 g/d [14]. In recent years, developed countries have taken many strategies to reduce sugar intake, but sugar intake is still a problem needing to be addressed. The medium daily sugar intake of adolescents aged 9–18 in the United States accounts for 14.1% of total energy, and the total sugar intake of children and adolescents in Europe accounts for 11–17% [15,16]. The ELANS study conducted in Latin American found that there were 78.4% of adolescents whose energy intake from added sugar exceeded 10% of total daily energy. Furthermore, 70% of Swedish adolescents consumed free sugar exceeding 10% of total energy [17,18].
Studies have showed that free sugar is an important risk factor for the occurrence of noncommunicable diseases. A high-sugar diet means excessive calorie intake, which not only increased the risk of obesity, diabetes, dental caries, and nonalcoholic fatty liver disease, but also caused metabolic changes such as lipid derangements, coronary heart disease, and other vascular diseases [19,20,21].
Adolescent sugar intake is closely related to parents and family factors. Studies showed that adolescents’ sugar intake was positively correlated with parental intake, and adolescents consumed much more sugar at home (65%) than they consumed outside (35%) [22,23]. Mothers’ sugary food expenditure also affected children’s free sugar consumption. For example, children of mothers who consumed soft drinks every day were 1.8 times more likely to take foods with free sugars as those of mothers who never consumed soft drinks [24]. A study on the dietary relationship between Norwegian adolescents and parents found that the intake of adolescents’ sugary drinks was significantly positively related to parental intake, and was significantly negatively related to parental education level [25]. In addition, a study conducted in China found that adolescents with low parental education level were more likely to drink SSBs than others [26].
Therefore, this study intends to investigate the knowledge, attitudes and practices of adolescents’ parents about free sugar, understand the current situation of adolescents’ parents buying/storing behaviors of beverages and desserts, and behaviors of sugar-containing food in adolescents, in order to lay the foundation for further control of adolescents’ free sugar intake in the future.

2. Materials and Methods

2.1. Study Design

Data analyzed by the cross-sectional study was collected among parents whose children were studying at middle school between May to July 2019 in Changsha, Hunan. It is a medium-sized city and has certain representativeness nationwide. With the assistance of the Changsha Education Bureau and district education bureaus, the survey team used stratified sampling to sample in five districts in Changsha. In the first stage, two middle schools were randomly selected from each of the five administrative districts, and a total of 10 schools were included. In the second stage, two classes were randomly selected from the first grade and the second grade of each school. A total of 40 classes were surveyed. This study consists of a parental questionnaire and student physical measurements. The questionnaire needed to be filled out by the primary caregivers. The students’ physical measurements and information collection are surveyed and filled in by investigators who have been uniformly trained. The survey was advanced after approval by the Education Bureau, also was approved by the Ethics Committee of Xiangya School of Public Health, Central South University (IRB number: XYGW-2019-025).

2.2. Participants

We calculated the required sample size through the formula to be 824. Considering the 20% no response rate, the minimum survey sample was finally determined to be 989. We collected 1136 subjects to meet the minimum requirements. All students in the class were the survey object, except for students or parents who did not agree to participate. Written informed consent was obtained from all participants before the survey.

2.3. Questionnaire Investigation

A structured questionnaire was completed by consulting relevant domestic, foreign literature and related materials and after many rounds of expert discussion. The questionnaire contains four parts.

2.3.1. Demographic Information

This demographic data included parents’ gender, age, ethnicity, height, weight, education level and monthly household income per capita, and were collected through the first part of the questionnaire. When taking physical measurements such as height and weight of students, their age and gender were also collected.

2.3.2. Parent’s Knowledge of Free Sugar

The knowledge section consists of 4 single-choice questions and 2 multiple-choice questions and was aimed at assessing and evaluating parents’ awareness of the definition of free sugar and free sugar content of food, sugar intake guidelines, and the perception of the effects of free sugars on health. For this section, each option could be correctly selected to score 1 point, and incorrectly selected (or uncertain) to score 0 points. The total score was 12 points.

2.3.3. Parent’s Attitude to Free Sugar

The Attitude section contains 6 entries about parents’ attitudes towards eating too much sugary food, drinking too many sugary drinks can be addictive and reducing/controlling children’s intake of sugary foods (free sugar). For the attitude section, selecting “strongly agree” and “agree” scored 1 point, other options were not counted, and the highest score was 6 points. Higher scores indicate a more positive attitude, and parents were more supportive of controlling youth sugar/free sugar intake.

2.3.4. Parental Practice of Free Sugar

The behavior part includes the behavior of parents buying or storing beverages and desserts for their children and boot behaviors of parents in the previous month before the survey. There were 8 items in total. For the practice section, a score of 1 was given for choosing the answer reflecting a good practice and 0 was given for choosing the answer reflecting poor practice. The total score was 8 points.

2.3.5. Classification of Knowledge, Attitude and Practice

We divided them into two categories according to the 75th percentile of the respondents’ knowledge, attitude, and practice scores. Values greater than P75 were positioned as high levels of knowledge, positive attitudes, and good behaviors. Otherwise, they were defined as low levels of free sugar knowledge, negative attitude and poor performance. A score of ≥9 indicates good cognition, ≥6 indicates positive attitude, and ≥7 indicates good behavior.

2.4. Data Processing and Statistical Analysis

Data entry was performed using EpiData 3.1 software (The EpiData Association, Odense, Denmark), with double entry and consistency check. Statistical analysis was performed using SPSS 18.0 software (IBM Corp., Armonk, NY, USA). Counting data were expressed as mean ± standard deviation (Mean ± SD), and measurement data were expressed as percentages. Demographic data and KAP scores were descriptive statistical methods. After statistical testing, knowledge, attitude and behavior scores followed a skewed distribution, and the difference in scores between groups was analyzed using a nonparametric test. Multivariate analysis was performed using binary logistic regression analysis. Spearman correlation analysis was used to describe the strength of the relationship between knowledge, attitude and behavior. p < 0.05 indicated statistical significance.

3. Results

3.1. Sociodemographic Data

We recovered a total of 1212 questionnaires, and after removing incomplete questionnaires, there were 1136 left, with an effective recovery rate of 93.7%. There were 336 male parents (29.6%) and 800 female parents (70.4%), with an average age of 41.76 ± 5.266 years. Most parents were Han, only 3.6% of parents were ethnic minorities; 69.8% of them were mothers, 28.6% were fathers, 1.6% were grandparents. More than half (57.5%) of families had only one child. Parents who had received university education or above account for 30.5% of the total number, and there were still 2.3% of parents had only primary education, as shown in Table 1.

3.2. Knowledge, Attitude and Practice (KAP) Related to Free Sugar

The average scores of knowledge, attitude, and behavior were 7.04, 5.17 and 5.39. The proportion of people with scores above the 75th percentile was 21.2% (knowledge), 51.1% (attitude), and 19.2% (practice). Nearly half of the parents had a positive attitude, but parents’ knowledge and practice of free sugar were not very good (Table 2).

3.2.1. Free Sugar-Related Knowledge

Nearly one-fifth of the parents had a high level of free sugar awareness. The lowest score of knowledge item was for the questions ‘Know the definition of free sugar’. According to Table 3, 7.4% of parents reported they knew “free sugar”. Furthermore, 34.0% of parents knew the daily sugar intake recommended in “The Chinese Dietary Guidelines”, and 30.5% of parents could choose the correct daily sugar restriction recommended by the World Health Organization. About 80% of the respondents could correctly distinguish the free sugar content in biscuits, cakes, vegetables, and fruits, but only 27.5% of parents could correctly recognize that the free sugar content in 100% fruit juice was higher. Most parents (90.1%) agreed that excessive intake of sugar-sweetened beverages will affect adolescent growth and development. The results showed that 75.4% of parents recognized that excessive sugar intake is related to dental caries, and 89.9% of parents recognized that excessive sugar intake is related to overweight/obesity, but parents had low awareness of chronic diseases (41.7%) in adulthood (Table 3).

3.2.2. Free Sugar-Related Attitude

Table 4 showed the answers of parents’ attitudes to free sugar. Only 63.1% of parents thought it is not good to eat too much sugary food. However, 80.1% of parents agreed that drinking too much SSBs would be addictive; and more than 90% of parents agreed to reduce the consumption of sugary foods by the teenage years, limit the amount of sugar added to drinks and desserts, limiting sugary foods is good to children’s health, and parents should consciously control children’s intake of sugary foods.

3.2.3. Free Sugar-Related Practice

Table 5 shows the performance of parents buying and storing beverages, desserts, and boot behaviors one month before the survey. Only a few parents bought more than three kinds of beverages (5.9%) or desserts (8.5%) for their children. More parents stored desserts (60.6%) than stored drinks at home (36.7%). A total of 36.7% of parents stored drinks at home, and 60.6% of parents stored desserts. More than 90% of parents did not use drinks or desserts as a reward for their child’s performance. However, those who consciously avoided buying sugary drinks or drinking sugary drinks in front of children were 34.7% and 37.1%.

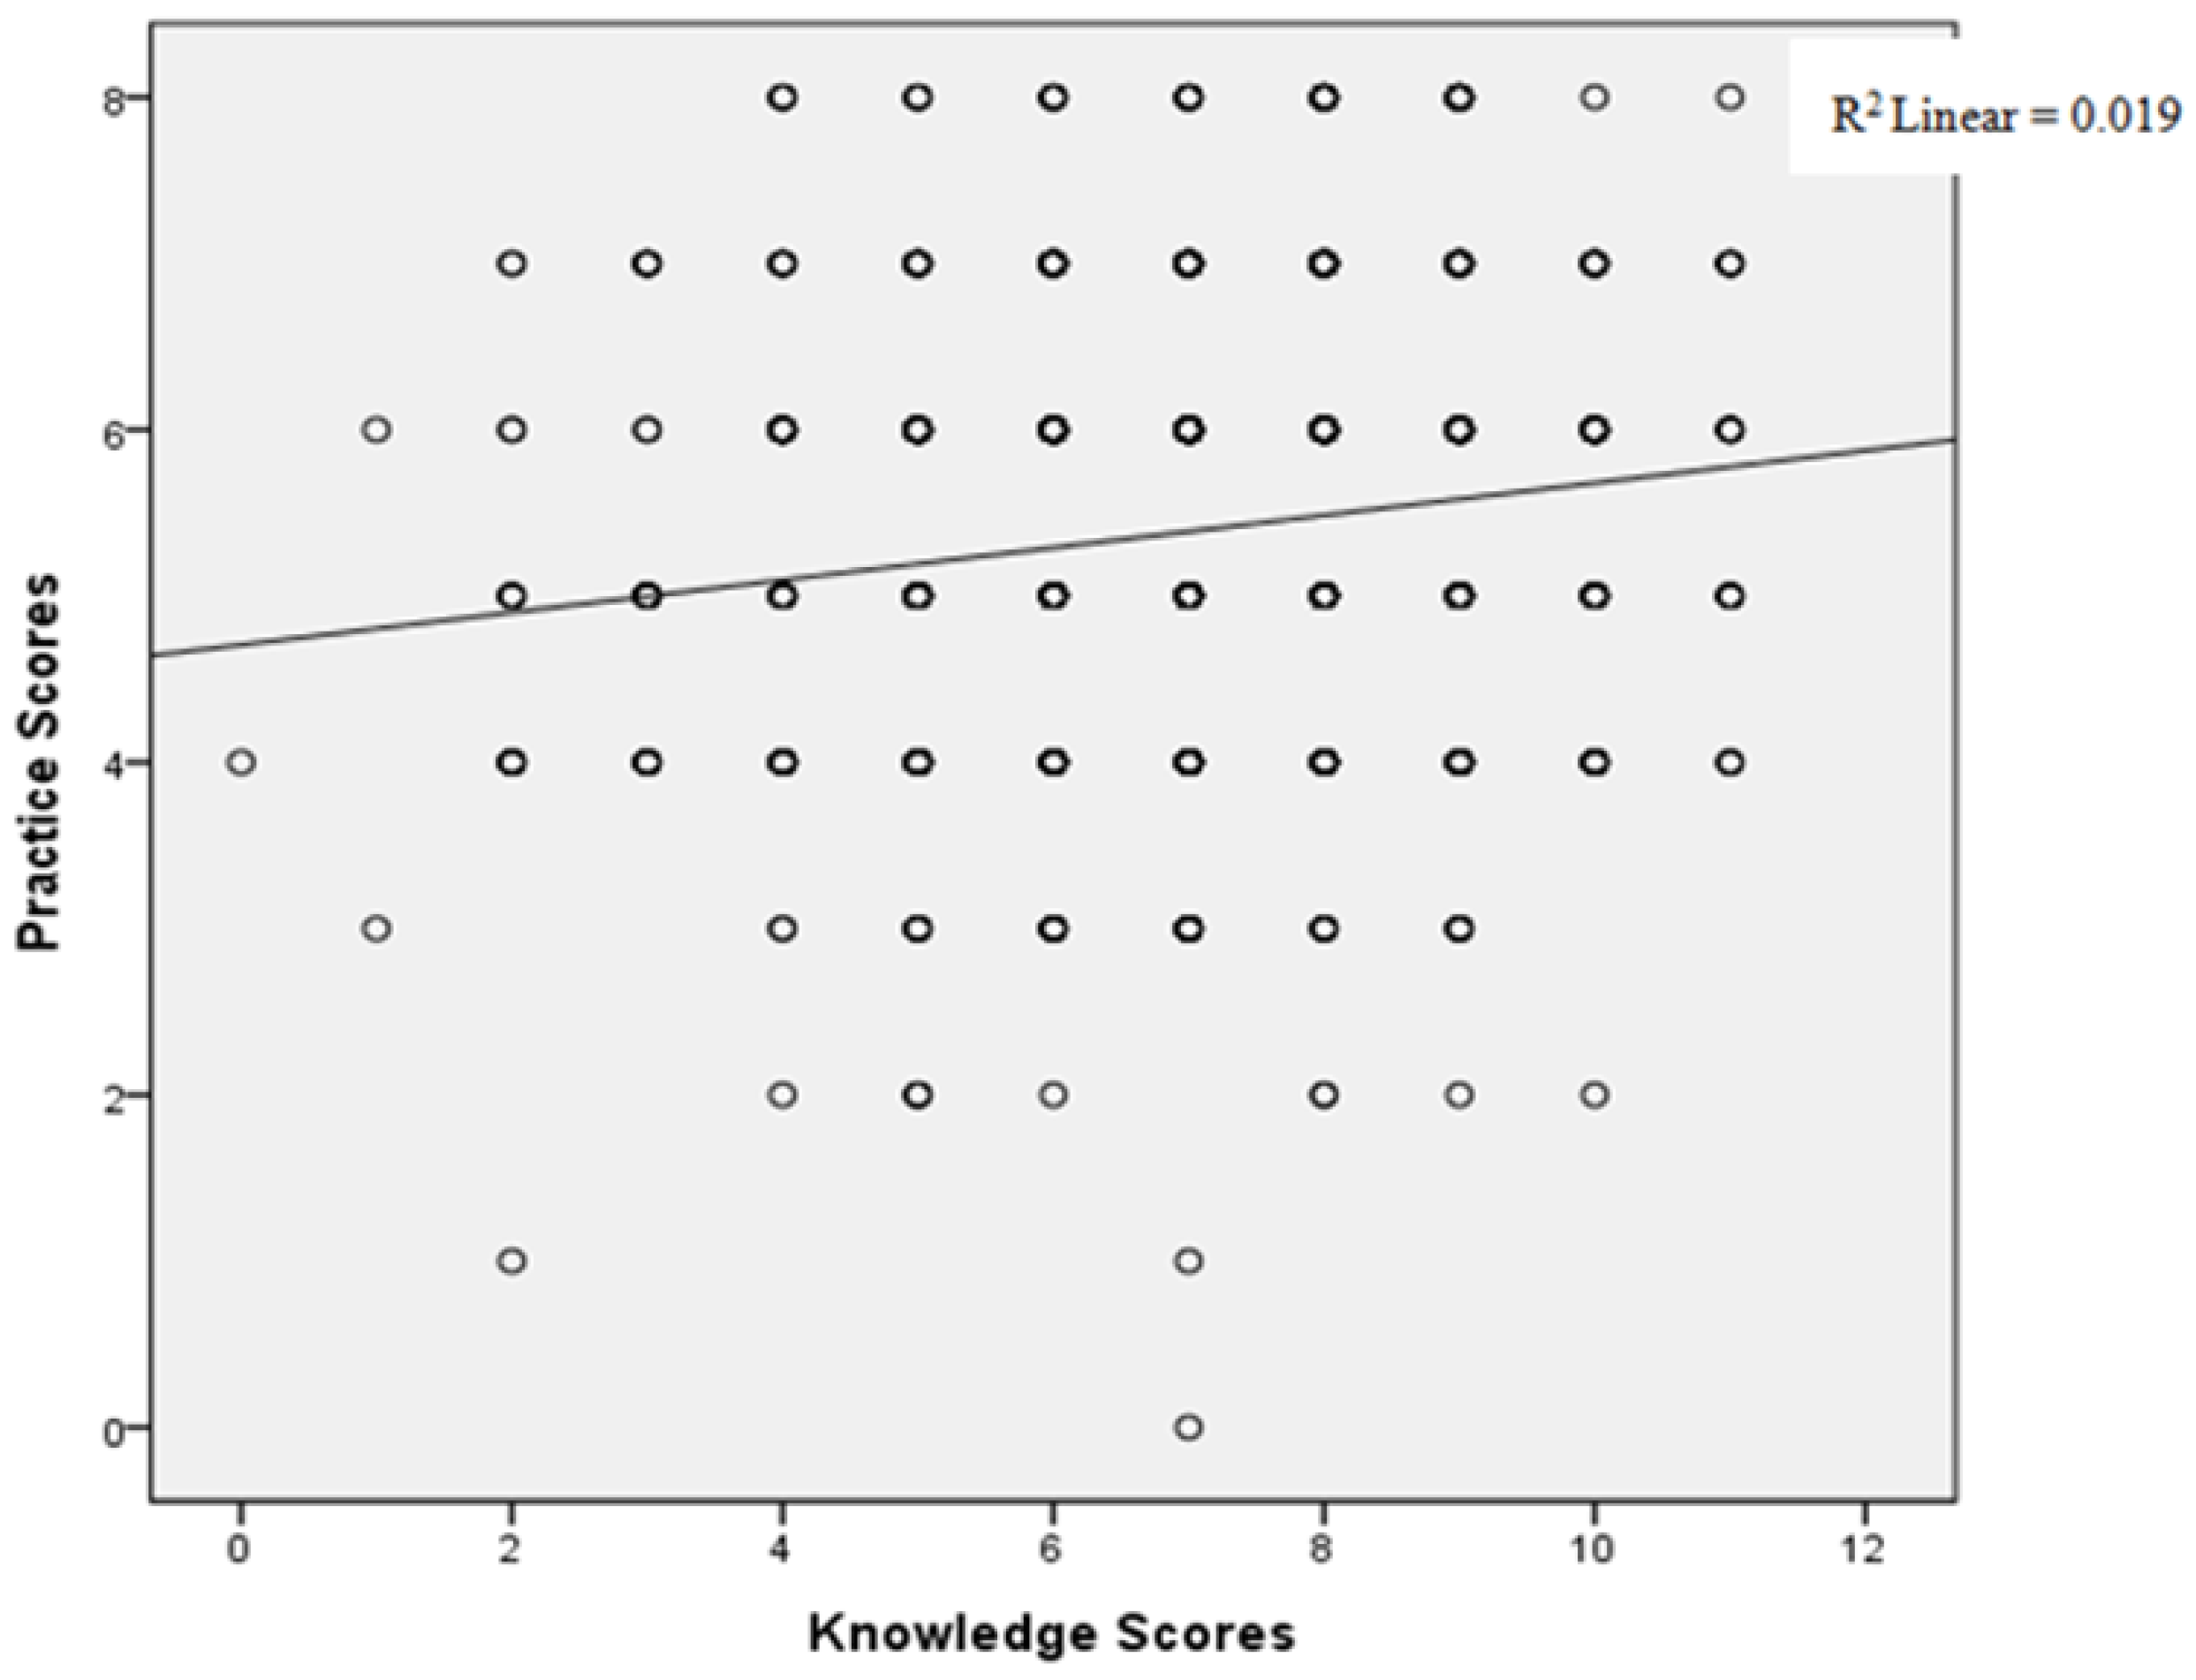
3.2.4. Correlation between Knowledge Scores and Practice Scores

After relevant analysis, there was a positive correlation between knowledge scores and behavior scores of parents (R2 = 0.019, p < 0.000, Figure 1).

3.3. Relevant Factors Affecting the Knowledge of Adolescent Parents

We took parents’ gender, age, education level, family’s monthly income per capita, kinship with children, parents’ correctness of children’s body size, student gender, age, classification of students’ body type, and whether they are only children as independent variables, and parents’ high/low level of free sugar awareness as the dependent variable for binary logistic regression analysis.
The results showed that parents’ gender, parents’ education level and students’ gender had effects on parents’ free sugar cognition. We found that women’s awareness of free sugar was higher than men. As education level rises, parents had better level of free sugar awareness. Parents of female students had higher level of knowledge. All of the statistical results were significant (p < 0.05, Table 6).

4. Discussion

At present, data on the knowledge, attitude and practice towards free sugar is still lacking. This study is the first to report parents’ KAP about free sugar in China. Adolescent parents had a more positive attitude towards controlling adolescents’ free sugar intake, but their perception and practice of free sugar were poor in Changsha, China. Our results suggested that higher knowledge level played a positive role in parents’ buying, storing and boot behaviors related to free sugar.
We found that the knowledge of free sugar in the parents of teenagers in Changsha, Hunan, was insufficient, and they did not understand the concept of free sugar. Only 7.4% of the respondents indicated that they knew the concept of “free sugar”. Tierney et al. [27] and Wang et al. [28] showed that even well-educated residents had very limited knowledge of free sugars. At present, the self-reported awareness rate of free sugar in Chinese parents is very low, and people in other countries have low awareness of the WHO guidelines, as well. They knew the free sugar content in vegetables, cakes, milk tea, and carbonated drinks more accurately, but the perception of free sugar content in other foods and 100% fruit juice was inaccurate. The low awareness of free sugar may be related to its limited pathways. Parents may evaluate the free sugar content based on the taste of the food. The study by Dallacker et al. [29] found that parents often underestimated the amount of sugar in food or beverages. Similarly, our results showed that only 27.5% of parents could correctly recognize the free sugar content in 100% fruit juice, which was lower than the 40% recognition rate of the American population [30]. The 100% fruit juice is a beverage that contains no added sugar but contains free sugar. Drinking it in moderation can provide high-quality vitamins and minerals, but it has a similar composition of free sugar as sugary beverages. So, excessive drinking of 100% fruit juice may cause weight gain [31,32]. Excessive free sugar intake can affect adolescent growth and development; most (89.9%) parents will first consider overweight/obesity, which was consistent with the findings of Boles et al. [33] Parents were more likely to associate the harm caused by excessive sugar intake with overweight and obesity, but they ignored other health hazards, such as diabetes, nonalcoholic fatty liver, and cardiovascular disease.
A good attitude is the foundation of good behavior, and positive attitude can help improve the level of knowledge and correct inappropriate behavior. Most parents showed a very positive attitude towards controlling the intake of free sugar among adolescents in this study, and most of them agreed to reduce or control added sugar intake. An intervention study conducted by Christopher et al. [34] to reduce the intake of children’s sugary drinks showed most parents were neutral or supportive about the establishment of “SSB-free zones”. Parents’ diet is a key factor that affects their children’s diet. To a certain extent, it affects the attitude of parents in feeding children. Many researchers believe that by improving parental behavior, it could help parents to improve their attitudes toward controlling the intake of sugary foods/free sugar in adolescents [34,35,36,37]. Some family physicians and parents in the United States believe that adding too much sugar in the diet will have a negative impact on health, and recommended controlling the added sugar in food and beverages [38,39]. A positive attitude is a necessary prerequisite for behavior improvement. The awareness of Chinese residents about sugar is constantly improving, and their attitude will become better and better.
Adolescents’ autonomy in eating behavior is gradually increasing, and they can choose or buy food by themselves. This may be one of the reasons why parents’ purchase behavior was better than storage behavior. Parents’ subjective reluctance to purchase beverages and desserts for children could also reflect parents’ good purchasing behavior. However, parents’ performance of storing beverages and desserts at home was poor. Compared with storing drinks at home, more parents stored desserts at home, which may be related to their own desire for sweetness [40]. Ares et al. [41] also found that the packaging or label images will increase consumers’ willingness to buy desserts, which may cause parents to buy more desserts at home. Previous studies have shown that when children were rewarded with food or allowed to eat desserts on a regular basis, this may lead to the increment of likelihood that children will eat sweets every day [42]. In this study, 33.6% of parents used beverages as rewards, and 42.5% used dessert as rewards when children performed well. There is a strong need for this to be improved. Many parents have realized that the consumption of children’s sugary drinks is related to their own drinking behavior [12], but only about one-third of parents in this study consciously avoided drinking or buying beverages in front of their children. In this regard, it was found that the higher the level of education, the better the performance of the parents. A positive correlation between parents’ low education level and high free sugar intake of adolescents was found in the HELENA-CSS study. A cohort study in the Netherlands also found a negative correlation between the mother’s education level and children’s consumption of sugary drinks. It was shown that the higher the education level, the more likely the parents were to formulate rules for children’s sugary foods, so the less intake of children’s sugary foods [11,43,44].
Knowledge is the driving force for changing behaviors, and good knowledge can guide individuals to take corrective actions [45]. In our research we found a weak but meaningful positive correlation between knowledge level and practice through correlation analysis. Relevant knowledge guidance can help parents understand the nutritional value and sugar content of food, which is conducive to better food choice for children [46]. Therefore, it is very necessary to provide health education about free sugar to adolescents’ parents. Binary logistic regression analysis results showed that being female was a protective factor of higher levels of awareness than male parents. Women are the leader of daily life in Chinese families. They will be more involved in family eating behaviors and food choices, and pay more attention to children’s health, so women may have a higher awareness of free sugar in the population than men. Besides, the cognitive level of parents tends to increase with the increase of academic qualifications. In the HEIA study, the consumption of sugary fruit juice beverages of children decreased significantly after intervention on the nutritional knowledge of sugary fruit juice beverages of parents with a low educational background, indicating that knowledge intervention for parents helps to control children’s free sugar intake [47]. We also found that female children are protective factors in parents’ free sugar knowledge level. The current social cultural and environment makes being female pay more attention to their body shape and appearance, and parents also pay more attention to the child’s body shape, especially the attention of female parents to the body shape of their daughters [48,49]. We believe that due to the social environment and the subjective attitudes of the parents towards the girl’s body shape, it is possible to promote parents of the girl to pay more attention to the knowledge about sugar intake.
A couple of countries have taken some strategies to control residents’ sugar intake, for example, the United Kingdom, the United States, Mexico and other countries implemented sugar taxes [50,51,52], and Canada and other countries set “traffic light” warning labels on food packaging [53]. Some regions also prohibited schools from selling high-calorie food to students to improve the eating environment [54]. These kinds of measures controlled the sugar consumption of residents to some extent. In addition, the establishment of free sugar content restriction standards for prepackaged foods, and encouraging food processing companies to reduce the use of free sugar in processed foods, support enterprises to develop and produce low-sugar and sugar-free foods, and these measures may help the public reduce free sugar intake. Parents have an important influence on controlling the sugar intake of adolescents. Therefore, we can improve the behavior of parents by formulating corresponding social norms. It is also possible to expand the nutritional knowledge channels of parents through self-media and WeChat platforms. At present, many schools in our country have established WeChat groups for parents, and parents can be guided through this platform. Parents’ high participation in this study indicated parents were very concerned about their children’s health issues. Therefore, it is a feasible method to carry out nutrition classes for parents through schools. This study also provided a reference direction for future investigations. Learn more about the influence of social status, economic status, gender and other factors on parents’ KAP of free sugar, and provide reference materials for the formulation of sugar control measures in the future. However, there is a limitation. The sample representativeness was limited because we only collected data on adolescent parents in Changsha, Hunan. In addition, it is recommended to continue to combine relevant research in other regions with the results of this study.

5. Conclusions

Our results showed that adolescent parents in Changsha, China generally have a good attitude but moderate knowledge and practice regarding free sugar. Parents have a low awareness of the concept of free sugar, and have a poor awareness of the content of free sugar in 100% juice. We also found that only a third of parents avoided buying or drinking sugary drinks in front of their children. Parents’ gender, education level and children’s gender are the factors that affect parents’ perception of free sugar. These findings can provide useful information for health authorities to control free sugar intake in the future.

Author Contributions

L.Y. and Q.L. contributed to the conception and design of the study, drafted and revised the protocol. Q.T., Q.Y., M.S. and H.L. participated in investigations and data collection. Q.T. was responsible for the data analysis and wrote the first draft and final article versions of this paper, which was reviewed by Q.L. All authors read the final manuscript and approved this submission. All authors have read and agreed to the published version of the manuscript.

Funding

This research received no external funding.

Acknowledgments

We thank the teachers and students from Xiangya School of Public Health, Central South University, in Changsha, China, for their help in the investigation process. We are also very grateful to the education department and the schools for their help in our work.

Conflicts of Interest

The authors declare no conflict of interest.

References

  1. Mela, D.J.; Woolner, E.M. Perspective: Total, Added, or Free? What Kind of Sugars Should We Be Talking About? Adv. Nutr. 2018, 9, 63–69. [Google Scholar] [CrossRef]
  2. World Health Organization. WHO Guidelines Approved by the Guidelines Review Committee. In Guideline: Sugars Intake for Adults and Children; World Health Organization Copyright (c) World Health Organization: Geneva, Switzerland, 2015. [Google Scholar]
  3. Ferretti, F.; Mariani, M. Simple vs. Complex Carbohydrate Dietary Patterns and the Global Overweight and Obesity Pandemic. Int. J. Environ. Res. Public Health 2017, 14, 1174. [Google Scholar] [CrossRef] [PubMed] [Green Version]
  4. Kosova, E.C.; Auinger, P.; Bremer, A.A. The relationships between sugar-sweetened beverage intake and cardiometabolic markers in young children. J. Acad. Nutr. Diet. 2013, 113, 219–227. [Google Scholar] [CrossRef] [Green Version]
  5. Hoare, E.; Varsamis, P.; Owen, N.; Dunstan, D.W.; Jennings, G.L. Sugar- and Intense-Sweetened Drinks in Australia: A Systematic Review on Cardiometabolic Risk. Nutrients 2017, 9, 1075. [Google Scholar] [CrossRef] [Green Version]
  6. Johnson, R.J.; Sanchez-Lozada, L.G.; Andrews, P.; Lanaspa, M.A. Perspective: A Historical and Scientific Perspective of Sugar and Its Relation with Obesity and Diabetes. Adv. Nutr. 2017, 8, 412–422. [Google Scholar] [CrossRef]
  7. Fisberg, M.; Kovalskys, I.; Gomez, G.; Rigotti, A.; Sanabria, L.Y.C.; Garcia, M.C.Y.; Torres, R.G.P.; Herrera-Cuenca, M.; Zimberg, I.Z.; Koletzko, B.; et al. Total and Added Sugar Intake: Assessment in Eight Latin American Countries. Nutrients 2018, 10, 389. [Google Scholar] [CrossRef] [Green Version]
  8. Kibblewhite, R.; Nettleton, A.; McLean, R. Erratum: Estimating Free and Added Sugar Intakes in New Zealand; Nutrients 2017, 9, 1292. Nutrients 2018, 10, 638. [Google Scholar] [CrossRef] [Green Version]
  9. Ruiz, E.; Rodriguez, P.; Valero, T.; Avila, J.M.; Aranceta-Bartrina, J.; Gil, A.; Gonzalez-Gross, M.; Ortega, R.M.; Serra-Majem, L.; Varela-Moreiras, G. Dietary Intake of Individual (Free and Intrinsic) Sugars and Food Sources in the Spanish Population: Findings from the ANIBES Study. Nutrients 2017, 9, 275. [Google Scholar] [CrossRef] [PubMed] [Green Version]
  10. Braz, M.; Assumpcao, D. Added sugar intake by adolescents: A population-based study. Cienc. Saude Colet. 2018, 24, 3237–3246. [Google Scholar] [CrossRef] [PubMed]
  11. Mesana, M.I.; Hilbig, A.; Androutsos, O.; Cuenca-Garcia, M.; Dallongeville, J.; Huybrechts, I.; De Henauw, S.; Widhalm, K.; Kafatos, A.; Nova, E.; et al. Dietary sources of sugars in adolescents’ diet: The HELENA study. Eur. J. Nutr. 2018, 57, 629–641. [Google Scholar] [CrossRef] [PubMed]
  12. Miller, C.; Braunack-Mayer, A. “When we were young, it really was a treat; now sugar is just the norm every day”-A qualitative study of parents’ and young adults’ perceptions and consumption of sugary drinks. Health Promot. J. Aust. 2019. [Google Scholar] [CrossRef] [PubMed]
  13. Su, L. Chinese Residents’ Consumption, Changes of Sugary Foods, and the Relationship with Overweight and Obesity from 2002 to 2012; Chinese Center for Disease Control and Prevention: Beijing, China, 2016. [Google Scholar]
  14. Jiguo, Z.; Huijun, W.; Zhu, W.; Bing, Z. Study on sugar intake of children and adolescents in 15 provinces of China in 2015. In Proceedings of the Nutrition Research and Clinical Practice—The 14th China Nutrition Science Congress and the 11th Asia Pacific Confrence on Clinical Nutrition, Nanjing, China, 19–22 September 2019. [Google Scholar]
  15. Azais-Braesco, V.; Sluik, D.; Maillot, M.; Kok, F.; Moreno, L.A. A review of total & added sugar intakes and dietary sources in Europe. Nutr. J. 2017, 16, 6. [Google Scholar] [CrossRef] [PubMed] [Green Version]
  16. Fulgoni, V.L., 3rd; Gaine, P.C.; Scott, M.O.; Ricciuto, L.; DiFrancesco, L. Association of Added Sugars Intake with Micronutrient Adequacy in US Children and Adolescents: NHANES 2009–2014. Curr. Dev. Nutr. 2019, 3, nzz126. [Google Scholar] [CrossRef] [PubMed]
  17. Ferrari, G.L.M.; Kovalskys, I.; Fisberg, M.; Gomez, G.; Rigotti, A.; Sanabria, L.Y.C.; Garcia, M.C.Y.; Torres, R.G.P.; Herrera-Cuenca, M.; Zimberg, I.Z.; et al. Anthropometry, dietary intake, physical activity and sitting time patterns in adolescents aged 15–17 years: An international comparison in eight Latin American countries. BMC Pediatr. 2020, 20, 24. [Google Scholar] [CrossRef] [Green Version]
  18. Wanselius, J.; Axelsson, C.; Moraeus, L.; Berg, C.; Mattisson, I.; Larsson, C. Procedure to Estimate Added and Free Sugars in Food Items from the Swedish Food Composition Database Used in the National Dietary Survey Riksmaten Adolescents 2016–17. Nutrients 2019, 11, 1342. [Google Scholar] [CrossRef] [Green Version]
  19. DiNicolantonio, J.J.; Lucan, S.C.; O’Keefe, J.H. The Evidence for Saturated Fat and for Sugar Related to Coronary Heart Disease. Prog. Cardiovasc. Dis. 2016, 58, 464–472. [Google Scholar] [CrossRef] [Green Version]
  20. Rippe, J.M.; Sievenpiper, J.L.; Le, K.A.; White, J.S.; Clemens, R.; Angelopoulos, T.J. What is the appropriate upper limit for added sugars consumption? Nutr. Rev. 2017, 75, 18–36. [Google Scholar] [CrossRef]
  21. Vos, M.B.; Kaar, J.L.; Welsh, J.A.; Van Horn, L.V.; Feig, D.I.; Anderson, C.A.M.; Patel, M.J.; Cruz Munos, J.; Krebs, N.F.; Xanthakos, S.A.; et al. Added Sugars and Cardiovascular Disease Risk in Children: A Scientific Statement From the American Heart Association. Circulation 2017, 135, e1017–e1034. [Google Scholar] [CrossRef] [Green Version]
  22. McGuire, S.; Ervin, R.B.; Kit, B.K.; Carroll, M.D.; Ogden, C.L. Consumption of added sugar among U.S. children and adolescents, 2005–2008. NCHS data brief no 87. Hyattsville, MD: National Center for Health Statistics. Adv. Nutr. 2012, 3, 534. [Google Scholar] [CrossRef] [Green Version]
  23. Watts, A.W.; Masse, L.C.; Barr, S.I.; Lovato, C.Y.; Hanning, R.M. Parent-child associations in selected food group and nutrient intakes among overweight and obese adolescents. J. Acad. Nutr. Diet. 2014, 114, 1580–1586. [Google Scholar] [CrossRef]
  24. Ha, D.H.; Do, L.G.; Spencer, A.J.; Thomson, W.M. Factors Influencing Early Feeding of Foods and Drinks Containing Free Sugars-A Birth Cohort Study. Int. J. Environ. Res. Public Health 2017, 14, 1270. [Google Scholar] [CrossRef] [PubMed] [Green Version]
  25. Bjelland, M.; Lien, N.; Grydeland, M.; Bergh, I.H.; Anderssen, S.A.; Ommundsen, Y.; Klepp, K.I.; Andersen, L.F. Intakes and perceived home availability of sugar-sweetened beverages, fruit and vegetables as reported by mothers, fathers and adolescents in the HEIA (HEalth In Adolescents) study. Public Health Nutr. 2011, 14, 2156–2165. [Google Scholar] [CrossRef] [PubMed]
  26. Gui, Z.H.; Zhu, Y.N.; Cai, L.; Sun, F.H. Sugar-Sweetened Beverage Consumption and Risks of Obesity and Hypertension in Chinese Children and Adolescents: A National Cross-Sectional Analysis. Nutrients 2017, 9, 1302. [Google Scholar] [CrossRef] [PubMed] [Green Version]
  27. Tierney, M.; Gallagher, A.M.; Giotis, E.S.; Pentieva, K. An Online Survey on Consumer Knowledge and Understanding of Added Sugars. Nutrients 2017, 9. [Google Scholar] [CrossRef] [PubMed] [Green Version]
  28. Wang, F.; Diangelo, C.L.; Marsden, S.L.; Pasut, L.; Kitts, D.; Bellissimo, N. Knowledge of Sugars Consumption and the WHO Sugars Guideline among Canadian Dietitians and Other Health Professionals. Can. J. Diet. Pract. Res. 2020, 1–4. [Google Scholar] [CrossRef]
  29. Dallacker, M.; Hertwig, R.; Mata, J. Parents’ considerable underestimation of sugar and their child’s risk of overweight. Int. J. Obes. 2018, 42, 1097–1100. [Google Scholar] [CrossRef] [Green Version]
  30. Rampersaud, G.C.; Kim, H.; Gao, Z.; House, L.A. Knowledge, perceptions, and behaviors of adults concerning nonalcoholic beverages suggest some lack of comprehension related to sugars. Nutr. Res. 2014, 34, 134–142. [Google Scholar] [CrossRef]
  31. Bellisle, F.; Hebel, P.; Fourniret, A.; Sauvage, E. Consumption of 100% Pure Fruit Juice and Dietary Quality in French Adults: Analysis of a Nationally Representative Survey in the Context of the WHO Recommended Limitation of Free Sugars. Nutrients 2018, 10, 459. [Google Scholar] [CrossRef] [Green Version]
  32. Faith, M.S.; Dennison, B.A.; Edmunds, L.S.; Stratton, H.H. Fruit juice intake predicts increased adiposity gain in children from low-income families: Weight status-by-environment interaction. Pediatrics 2006, 118, 2066–2075. [Google Scholar] [CrossRef]
  33. Boles, M.; Adams, A.; Gredler, A.; Manhas, S. Ability of a mass media campaign to influence knowledge, attitudes, and behaviors about sugary drinks and obesity. Prev. Med. 2014, 67 (Suppl. 1), S40–S45. [Google Scholar] [CrossRef] [Green Version]
  34. Palmedo, P.C.; Gordon, L.M. How to be SSB-free: Assessing the attitudes and readiness for a sugar sweetened beverage-free healthcare center in the Bronx, NY. PLoS ONE 2019, 14, e0215127. [Google Scholar] [CrossRef] [PubMed] [Green Version]
  35. Evans, E.W.; Hayes, C.; Palmer, C.A.; Bermudez, O.I.; Cohen, S.A.; Must, A. Dietary intake and severe early childhood caries in low-income, young children. J. Acad. Nutr. Diet. 2013, 113, 1057–1061. [Google Scholar] [CrossRef] [Green Version]
  36. Emmett, P.M.; Jones, L.R. Diet, growth, and obesity development throughout childhood in the Avon Longitudinal Study of Parents and Children. Nutr. Rev. 2015, 73 (Suppl. 3), 175–206. [Google Scholar] [CrossRef] [PubMed] [Green Version]
  37. Fisk, C.M.; Crozier, S.R.; Inskip, H.M.; Godfrey, K.M.; Cooper, C.; Robinson, S.M. Influences on the quality of young children’s diets: The importance of maternal food choices. Br. J. Nutr. 2011, 105, 287–296. [Google Scholar] [CrossRef] [Green Version]
  38. Mackey, C.; Plegue, M.A.; Deames, M.; Kittle, M.; Sonneville, K.R.; Chang, T. Family physicians’ knowledge, attitudes, and behaviors regarding the weight effects of added sugar. SAGE Open Med. 2018, 6, 2050312118801245. [Google Scholar] [CrossRef] [PubMed] [Green Version]
  39. Eck, K.M.; Dinesen, A.; Garcia, E.; Delaney, C.L. “Your Body Feels Better When You Drink Water”: Parent and School-Age Children’s Sugar-Sweetened Beverage Cognitions. Nutrients 2018, 10, 1232. [Google Scholar] [CrossRef] [Green Version]
  40. Harington, K.; Smeele, R.; Van Loon, F.; Yuan, J.; Haszard, J.J.; Drewer, A.; Venn, B.J. Desire for Sweet Taste Unchanged After Eating: Evidence of a Dessert Mentality? J. Am. Coll. Nutr. 2016, 35, 581–586. [Google Scholar] [CrossRef]
  41. Ares, G.; Besio, M.; Gimenez, A.; Deliza, R. Relationship between involvement and functional milk desserts intention to purchase. Influence on attitude towards packaging characteristics. Appetite 2010, 55, 298–304. [Google Scholar] [CrossRef]
  42. Vereecken, C.A.; Keukelier, E.; Maes, L. Influence of mother’s educational level on food parenting practices and food habits of young children. Appetite 2004, 43, 93–103. [Google Scholar] [CrossRef]
  43. Wijtzes, A.I.; Jansen, W.; Jansen, P.W.; Jaddoe, V.W.; Hofman, A.; Raat, H. Maternal educational level and preschool children’s consumption of high-calorie snacks and sugar-containing beverages: Mediation by the family food environment. Prev. Med. 2013, 57, 607–612. [Google Scholar] [CrossRef]
  44. Ahmadi, N.; Black, J.L.; Velazquez, C.E.; Chapman, G.E.; Veenstra, G. Associations between socio-economic status and school-day dietary intake in a sample of grade 5–8 students in Vancouver, Canada. Public Health Nutr. 2015, 18, 764–773. [Google Scholar] [CrossRef] [PubMed] [Green Version]
  45. Zhang, Y.; Ji, M.; Zou, J.; Yuan, T.; Deng, J.; Yang, L.; Li, M.; Qin, H.; Chen, J.; Lin, Q. Effect of a Conditional Cash Transfer Program on Nutritional Knowledge and Food Practices among Caregivers of 3–5-Year-Old Left-Behind Children in the Rural Hunan Province. Int. J. Environ. Res. Public Health 2018, 15, 525. [Google Scholar] [CrossRef] [Green Version]
  46. Konig, L.M.; Ziesemer, K.; Renner, B. Quantifying Actual and Perceived Inaccuracy When Estimating the Sugar, Energy Content and Portion Size of Foods. Nutrients 2019, 11, 2425. [Google Scholar] [CrossRef] [PubMed] [Green Version]
  47. Bjelland, M.; Hausken, S.E.; Bergh, I.H.; Grydeland, M.; Klepp, K.I.; Andersen, L.F.; Totland, T.H.; Lien, N. Changes in adolescents’ and parents’ intakes of sugar-sweetened beverages, fruit and vegetables after 20 months: Results from the HEIA study—A comprehensive, multi-component school-based randomized trial. Food Nutr. Res. 2015, 59, 25932. [Google Scholar] [CrossRef] [Green Version]
  48. Di Giacomo, D.; De Liso, G.; Ranieri, J. Self body-management and thinness in youth: Survey study on Italian girls. Health Qual. Life Outcomes 2018, 16, 120. [Google Scholar] [CrossRef] [PubMed]
  49. Handford, C.M.; Rapee, R.M.; Fardouly, J. The influence of maternal modeling on body image concerns and eating disturbances in preadolescent girls. Behav. Res. Ther. 2018, 100, 17–23. [Google Scholar] [CrossRef] [PubMed]
  50. Scarborough, P.; Adhikari, V.; Harrington, R.A.; Elhussein, A.; Briggs, A.; Rayner, M. Impact of the announcement and implementation of the UK Soft Drinks Industry Levy on sugar content, price, product size and number of available soft drinks in the UK, 2015–19: A controlled interrupted time series analysis. PLoS Med. 2020, 17, e1003025. [Google Scholar] [CrossRef]
  51. Lee, M.M.; Falbe, J.; Schillinger, D.; Basu, S.; McCulloch, C.E.; Madsen, K.A. Sugar-Sweetened Beverage Consumption 3 Years After the Berkeley, California, Sugar-Sweetened Beverage Tax. Am. J. Public Health 2019, 109, 637–639. [Google Scholar] [CrossRef]
  52. Colchero, M.A.; Rivera-Dommarco, J.; Popkin, B.M.; Ng, S.W. In Mexico, Evidence Of Sustained Consumer Response Two Years After Implementing A Sugar-Sweetened Beverage Tax. Health Aff. 2017, 36, 564–571. [Google Scholar] [CrossRef]
  53. Acton, R.B.; Jones, A.C.; Kirkpatrick, S.I.; Roberto, C.A.; Hammond, D. Taxes and front-of-package labels improve the healthiness of beverage and snack purchases: A randomized experimental marketplace. Int. J. Behav. Nutr. Phys. Act. 2019, 16, 46. [Google Scholar] [CrossRef]
  54. Von Philipsborn, P.; Stratil, J.M.; Burns, J.; Busert, L.K.; Pfadenhauer, L.M.; Polus, S.; Holzapfel, C.; Hauner, H.; Rehfuess, E. Environmental interventions to reduce the consumption of sugar-sweetened beverages and their effects on health. Cochrane Database Syst. Rev. 2019, 6, Cd012292. [Google Scholar] [CrossRef] [PubMed]
Figure 1. Relationship between knowledge score and practice score, based on Spearman’s correlation coefficient.
Ijerph 17 04003 g001
Table 1. Demographic characteristics of participants (parents and adolescent, n = 1136).
CharacteristicsFrequencyPercentageMeanSD
Parents
Gender
Male33629.6
Female80070.4
Age 41.765.27
Ethnicity
Han nationality109596.4
Minority413.6
Education level
Primary school262.3
Junior high school28024.6
High school/vocational school48442.6
University and above34630.5
Monthly household income per capita
≤1000 yuan232.0
1001–3000 yuan20317.9
3001–5000 yuan31027.3
5001–7000 yuan23120.3
≥7001 yuan36932.5
BMI
Wasting675.9
Normal76867.6
Overweight25622.5
Obese454.0
Adolescent
Gender
Male59752.6
Female53947.4
Age 13.570.69
Only child65357.5
BMI
Wasting454.0
Normal78669.2
Overweight16914.6
Obese13612.0
Total1136100
Table 2. Knowledge, attitude and practice scores and classifications among parents.
ItemsMean (P25, P75)>P75 (n %)
Knowledge7.04 (6, 8)241 (21.2%)
Attitude5.17 (5, 6)580 (51.1%)
Practice5.39 (4, 6)218 (19.2%)
Table 3. Parents’ perception of free sugar.
QuestionsCorrect Responses
FrequencyPercentage
Know the definition of free sugar.847.4
Know the recommended daily sugar intake in The Chinese Dietary Guidelines.38634.0
Know recommended ratio of free sugar to total daily energy. (≤10%)34630.5
Knowledge of free sugar content in food.
Biscuits, cakes89278.5
Vegetable, fruit96785.1
Sugar-sweetened beverages94483.1
100% fruit juice31227.5
Honey69260.9
Do you think that excessive intake of sugary drinks will affect the growth and development of adolescents? (YES)102490.1
What diseases do you think excessive sugar intake may be related to?
Dental caries85675.4
Overweight or obese102189.9
Chronic diseases in adulthood47441.7
Table 4. Parents’ attitude towards free sugar (n, %).
ItemsAgreeNeutralDisagree
Eating too much sugary food is not good.717 (63.1)373 (32.8)46 (4.0)
Drinking too much sugar-sweetened beverages is addictive.910 (80.1)40 (3.5)186 (16.4)
Teenagers should reduce the consumption of sugary foods.1028 (90.5)57 (5.0)51 (4.5)
Drinks and desserts should limit the amount of sugar added.1061 (93.4)39 (3.4)36 (3.2)
Limiting sugary foods is good for your child’s health.1068 (94.0)39 (3.4)29 (2.6)
Parents should consciously control children’s intake of sugary foods.1094 (96.3)36 (3.2)6 (0.6)
Table 5. Buying, storing, and boot behaviors of adolescent parents.
QuestionsGood behavior
FrequencyPercentage
You had bought three or more drinks for your child in the past month.675.9
You had stored drinks at home in the past month.41736.7
You had bought three or more desserts for your child in the past month.978.5
You had stored desserts at home in the past month.68860.6
You did not use drinks as a reward when your child is doing well.107294.4
You did not use dessert as a reward when your child is doing well.102590.2
You were conscious of avoiding buying sugar-sweetened beverages in front of your child.39434.7
You were conscious to avoid drinking sugar-sweetened beverages in front of your child.42237.1
Table 6. Related factors affecting parents’ knowledge to free sugar.
FactorsbWaldχ2pOR (95%CI)
Parents gender0.56310.3830.001 ∗∗∗1.756 (1.247, 2.473)
Education level of parents0.35013.4620.000 ∗∗∗1.419 (1.177, 1.710)
Students gender(girl)0.2903.8640.049 1.336 (1.001, 1.783)
Notes: Logistic regression was applied in analysis; * p < 0.05, *** p < 0.001.

