Association between Different Modes of Travelling and Adiposity in Chilean Population: Findings from the Chilean National Health Survey 2016–2017

 , ,
, ,  , ,
, ,  ,
,  and
and
Abstract
1. Introduction
2. Materials and Methods
2.1. Study Design
2.2. Anthropometric Measurements
2.3. Physical Activity and Types of Travelling
2.4. Socio-Demographic and Lifestyle
2.5. Statistical Analyses
3. Results
4. Discussion
4.1. Main Findings of This Study
4.2. What is Already Known in This Topic?
4.3. What This Study Adds
4.4. Limitations of This Study
5. Conclusions
Author Contributions
Funding
Acknowledgments
Conflicts of Interest
Data Statement
Appendix A
References
- Celis-Morales, C.A.; Gray, S.; Petermann, F.; Iliodromiti, S.; Welsh, P.; Lyall, D.M.; Anderson, J.; Pellicori, P.; Mackay, D.F.; Pell, J.P.; et al. Walking Pace Is Associated with Lower Risk of All-Cause and Cause-Specific Mortality. Med. Sci. Sports Exerc. 2019, 51, 472–480. [Google Scholar] [CrossRef] [PubMed]
- Celis-Morales, C.A.; Lyall, D.M.; Steell, L.; Gray, S.R.; Iliodromiti, S.; Anderson, J.; Mackay, D.F.; Welsh, P.; Yates, T.; Pell, J.P.; et al. Associations of discretionary screen time with mortality, cardiovascular disease and cancer are attenuated by strength, fitness and physical activity: Findings from the UK Biobank study. BMC Med. 2018, 16, 77. [Google Scholar] [CrossRef] [PubMed]
- Celis-Morales, C.A.; Lyall, D.M.; Welsh, P.; Anderson, J.; Steell, L.; Guo, Y.; Maldonado, R.; Mackay, D.F.; Pell, J.P.; Sattar, N.; et al. Association between active commuting and incident cardiovascular disease, cancer, and mortality: Prospective cohort study. BMJ 2017, 357, j1456. [Google Scholar] [CrossRef] [PubMed]
- Yates, T.; Zaccardi, F.; Dhalwani, N.N.; Davies, M.J.; Bakrania, K.; Celis-Morales, C.A.; Gill, J.M.R.; Franks, P.W.; Khunti, K. Association of walking pace and handgrip strength with all-cause, cardiovascular, and cancer mortality: A UK Biobank observational study. Eur. Heart J. 2017, 1, ehx449. [Google Scholar] [CrossRef]
- WHO. The Global Action Plan on Physical Activity 2018–2030; World Health Organization: Geneva, Switzerland, 2018. [Google Scholar]
- Lee, I.M.; Shiroma, E.J.; Lobelo, F.; Puska, P.; Blair, S.N.; Katzmarzyk, P.T.; Lancet Phys Activity Series, W. Effect of physical inactivity on major non-communicable diseases worldwide: An analysis of burden of disease and life expectancy. Lancet 2012, 380, 219–229. [Google Scholar] [CrossRef]
- Ding, D.; Lawson, K.D.; Kolbe-Alexander, T.L.; Finkelstein, E.A.; Katzmarzyk, P.T.; van Mechelen, W.; Pratt, M. The economic burden of physical inactivity: A global analysis of major non-communicable diseases. Lancet 2016, 388, 1311–1324. [Google Scholar] [CrossRef]
- Guthold, R.; Stevens, G.A.; Riley, L.M.; Bull, F.C. Worldwide trends in insufficient physical activity from 2001 to 2016: A pooled analysis of 358 population-based surveys with 1·9 million participants. Lancet Glob. Health 2018, 6, e1077–e1086. [Google Scholar] [CrossRef]
- Cook, T.L.; De Bourdeaudhuij, I.; Maes, L.; Haerens, L.; Grammatikaki, E.; Widhalm, K.; Kwak, L.; Plada, M.; Moreno, L.A.; Tountas, Y.; et al. Psychosocial determinants and perceived environmental barriers as mediators of the effectiveness of a web-based tailored intervention promoting physical activity in adolescents: The HELENA Activ-O-Meter. J. Phys. Act. Health 2014, 11, 741–751. [Google Scholar] [CrossRef]
- Reichert, F.F.; Barros, A.J.D.; Domingues, M.R.; Hallal, P.C. The role of perceived personal barriers to engagement in leisure-time physical activity. Am. J. Public Health 2007, 97, 515–519. [Google Scholar] [CrossRef]
- Sallis, J.F.; Bull, F.; Guthold, R.; Heath, G.W.; Inoue, S.; Kelly, P.; Oyeyemi, A.L.; Perez, L.G.; Richards, J.; Hallal, P.C. Progress in physical activity over the Olympic quadrennium. Lancet 2016, 388, 1325–1336. [Google Scholar] [CrossRef]
- Hallal, P.C.; Bauman, A.E.; Heath, G.W.; Kohl, H.W.; Lee, I.M.; Pratt, M. Physical activity: More of the same is not enough. Lancet 2012, 380, 190–191. [Google Scholar] [CrossRef]
- Sahlqvist, S.; Song, Y.; Ogilvie, D. Is active travel associated with greater physical activity? The contribution of commuting and non-commuting active travel to total physical activity in adults. Prev. Med. 2012, 55, 206–221. [Google Scholar] [CrossRef] [PubMed]
- Wener, R.E.; Evans, G.W. A morning stroll: Levels of physical activity in car and mass transit commuting. Environ. Behav. 2007, 39, 62–74. [Google Scholar] [CrossRef]
- Blond, M.B.; Rosenkilde, M.; Gram, A.S.; Tindborg, M.; Christensen, A.N.; Quist, J.S.; Stallknecht, B.M. How does 6 months of active bike commuting or leisure-time exercise affect insulin sensitivity, cardiorespiratory fitness and intra-abdominal fat? A randomised controlled trial in individuals with overweight and obesity. Br. J. Sports Med. 2019. [Google Scholar] [CrossRef]
- Henriques-Neto, D.; Peralta, M.; Garradas, S.; Pelegrini, A.; Pinto, A.A.; Sanchez-Miguel, P.A.; Marques, A. Active Commuting and Physical Fitness: A Systematic Review. Int. J. Environ. Res. Public Health 2020, 17, 2721. [Google Scholar] [CrossRef]
- Flint, E.; Cummins, S.; Sacker, A. Associations between active commuting, body fat, and body mass index: Population based, cross sectional study in the United Kingdom. BMJ 2014, 349, g4887. [Google Scholar] [CrossRef]
- Flint, E.; Webb, E.; Cummins, S. Change in commute mode and body-mass index: Prospective, longitudinal evidence from UK Biobank. Lancet Public Health 2016, 1, e46–e55. [Google Scholar] [CrossRef]
- Oja, P.; Titze, S.; Bauman, A.; de Geus, B.; Krenn, P.; Reger-Nash, B.; Kohlberger, T. Health benefits of cycling: A systematic review. Scand. J. Med. Sci. Sports 2011, 21, 496–509. [Google Scholar] [CrossRef]
- Wang, Y.; Tuomilehto, J.; Jousilahti, P.; Antikainen, R.; Mahonen, M.; Katzmarzyk, P.T.; Hu, G. Occupational, Commuting, and Leisure-Time Physical Activity in Relation to Heart Failure Among Finnish Men and Women. J. Am. Coll. Cardiol. 2010, 56, 1140–1148. [Google Scholar] [CrossRef]
- Hu, G.; Jousilahti, P.; Borodulin, K.; Barengo, N.C.; Lakka, T.A.; Nissinen, A.; Tuomilehto, J. Occupational, commuting and leisure-time physical activity in relation to coronary heart disease among middle-aged Finnish men and women. Atherosclerosis 2007, 194, 490–497. [Google Scholar] [CrossRef]
- Hu, G.; Qiao, Q.; Silventoinen, K.; Eriksson, J.G.; Jousilahti, P.; Lindstrom, J.; Valle, T.T.; Nissinen, A.; Tuomilehto, J. Occupational, commuting, and leisure-time physical activity in relation to risk for Type 2 diabetes in middle-aged Finnish men and women. Diabetologia 2003, 46, 322–329. [Google Scholar] [CrossRef]
- Hu, G.; Pekkarinen, H.; Hanninen, O.; Yu, Z.J.; Guo, Z.Y.; Tian, H.G. Commuting, leisure-time physical activity, and cardiovascular risk factors in China. Med. Sci. Sports Exerc. 2002, 34, 234–238. [Google Scholar] [CrossRef] [PubMed]
- Concha-Cisternas, Y.; Petermann-Rocha, F.; Garrido-Mendez, A.; Diaz-Martinez, X.; Maria Leiva, A.; Salas-Bravo, C.; Adela Martinez-Sanguinetti, M.; Iturra-Gonzalez, J.A.; Matus, C.; Vasquez-Gomez, J.A.; et al. Patterns of physical activity in Chilean adults across the lifespan. Nutr. Hosp. 2019, 36, 149–158. [Google Scholar] [PubMed]
- Alvim de Matos, S.M.; Gondim Pitanga, F.J.; Almeida, M.d.C.C.; Queiroz, C.O.; dos Santos, C.A.; de Almeida, R.T.; Martins da Silva, I.T.; Griep, R.H.; Alves Ferreira Amorim, L.D.; Patrao, A.L.; et al. What Factors Explain Bicycling and Walking for Commuting by ELSA-Brasil Participants? Am. J. Health Promot. 2018, 32, 646–656. [Google Scholar] [CrossRef] [PubMed]
- Steell, L.; Garrido-Mendez, A.; Petermann, F.; Diaz-Martinez, X.; Martinez, M.A.; Leiva, A.M.; Salas-Bravo, C.; Alvarez, C.; Ramirez-Campillo, R.; Cristi-Montero, C.; et al. Active commuting is associated with a lower risk of obesity, diabetes and metabolic syndrome in Chilean adults. J. Public Health 2017, 8, 1–9. [Google Scholar] [CrossRef] [PubMed]
- Garrido-Méndez, A.; Concha-Cisternas, Y.; Petermann-Rocha, F.; Díaz-Martínez, X.; Leiva, A.M.; Troncoso, C.; Martinez, M.A.; Salas-Bravo, C.; Álvarez, C.; Ramírez-Campillo, R.; et al. Influencia de la edad sobre el cumplimiento de las recomendaciones de actividad física: Resultados de la Encuesta Nacional de Salud en Chile 2009–2010. Revista Chilena de Nutrición 2019, 46, 121–128. [Google Scholar] [CrossRef]
- Garrido-Méndez, A.; Díaz, X.; Martínez, M.A.; Leiva, A.M.; Álvarez, C.; Ramírez Campillo, R.; Cristi-Montero, C.; Rodríguez, F.; Salas-Bravo, C.; Durán, E.; et al. Mayores niveles de transporte activo se asocian a un menor nivel de adiposidad y menor riesgo de obesidad: Resultados de la Encuesta Nacional de Salud 2009–2010. Revista Médica de Chile 2017, 145, 837–844. [Google Scholar] [CrossRef]
- Vio, F.; Albala, C.; Kain, J. Nutrition transition in Chile revisited: Mid-term evaluation of obesity goals for the period 2000–2010. Public Health Nutr. 2008, 11, 405–412. [Google Scholar] [CrossRef]
- Albala, C.; Vio, F.; Kain, J.; Uauy, R. Nutrition transition in Chile: Determinants and consequences. Public Health Nutr. 2002, 5, 123–128. [Google Scholar] [CrossRef]
- Albala, C.; Yáñez, F.V.D. Epidemiological transition in Latin America. A comparison of four countries. Revista Medica De Chile 1997, 125, 719–727. [Google Scholar]
- OMS/OPS. Panorama de la Seguridad Alimentaria y Nutricional en América Latina y el Caribe; 1; Organización de las Naciones Unidas para la Alimentación y la Agricultura, Organización Panamericana de la Salud: Santiago, Chile, 2017; pp. 1–174. [Google Scholar]
- Miranda, J.; Herrera, V.M.; Chirinos, J.A.; Gomez, L.F.; Perel, P.; Pichardo, R.; Gonzalez, A.; Sanchez, J.R.; Ferreccio, C.; Aguilera, X.; et al. Major Cardiovascular Risk Factors in Latin America: A Comparison with the United States. The Latin American Consortium of Studies in Obesity (LASO). PLoS ONE 2013, 8. [Google Scholar] [CrossRef] [PubMed]
- Díaz-Martinez, X.; Garrido-Mendez, A.; Martínez, M.; Leiva, A.; Álvarez, C.; Ramírez-Campillo, R.; Cristi-Montero, C.; Rodríguez, F.; Salas-Bravo, C.; Durán, E.; et al. Factores asociados a inactividad física en Chile: Resultados de la Encuesta Nacional de Salud 2009–2010. Revista Medica de Chile 2017, 145, 1259–1267. [Google Scholar] [CrossRef] [PubMed][Green Version]
- Petermann, F.; Durán, E.; Labraña, A.M.; Martínez, M.A.; Leiva, A.M.; Garrido-Méndez, A.; Poblete-Valderrama, F.; Díaz-Martínez, X.; Salas, C.; Celis-Morales, C. Factores asociados al desarrollo de obesidad en Chile: Resultados de la Encuesta Nacional de Salud 2009–2010. Revista médica de Chile 2017, 145, 716–722. [Google Scholar] [CrossRef] [PubMed]
- Celis-Morales, C.; Rodríguez-Rodríguez, F.; Martínez-Sanguinetti, M.; Leiva, A.M.; Troncoso, C.; Villagrán, M.; Salas-Bravo, C.; Díaz-Martínez, X.; Cigarroa, I.; Concha-Cisternas, Y.; et al. Prevalencia de inactividad física en Latinoamérica ¿logrará chile y el cono sur reducir en un 10% los niveles de inactividad física para el año 2025? Revista Médica Clínica Las Condes 2019, 30, 236–239. [Google Scholar] [CrossRef]
- Garcia-Hermoso, A.; Saavedra, J.M.; Olloquequi, J.; Ramirez-Velez, R. Associations between the duration of active commuting to school and academic achievement in rural Chilean adolescents. Environ. Health Prev. Med. 2017, 22, 31. [Google Scholar] [CrossRef] [PubMed]
- Rodríguez-Rodríguez, F.; Cristi-Montero, C.; Celis-Morales, C.; Escobar-Gomez, D.; Chillon, P. Impact of Distance on Mode of Active Commuting in Chilean Children and Adolescents. Int J. Environ. Res. Public Health 2017, 14, 1334. [Google Scholar] [CrossRef]
- MINSAL. Encuesta Nacional de Salud 2016–2017-Ministerio de Salud; MINSAL: Santiago, Chile, 2017. [Google Scholar]
- WHO. Global Physical Activity Questionnaire: GPAQ Version 2.0; World Health Organization: Geneva, Switzerland, 2009. [Google Scholar]
- Saunders, J.B.; Aasland, O.G.; Babor, T.F.; De La Fuente, J.R.; Grant, M. Development of the Alcohol Use Disorders Identification Test (AUDIT): WHO Collaborative Project on Early Detection of Persons with Harmful Alcohol Consumption-II. Addiction 1993, 88, 791–804. [Google Scholar] [CrossRef]
- Sagaris, L. Living City: Community mobilization to build active transport policies and programs in Santiago, Chile. Field. Actions Sci. Rep. 2009, 2, 41–48. [Google Scholar] [CrossRef]
- Flint, E.; Cummins, S. Active commuting and obesity in mid-life: Cross-sectional, observational evidence from UK Biobank. Lancet Diabetes Endocrinol. 2016, 4, 420–435. [Google Scholar] [CrossRef]
- Passi-Solar, Á.; Margozzini, P.; Cortinez-O’Ryan, A.; Muñoz, J.C.; Mindell, J.S. Nutritional and metabolic benefits associated with active and public transport: Results from the Chilean National Health Survey, ENS 2016–2017. J. Transp. Health 2020, 17, 100819. [Google Scholar] [CrossRef]
- García-Hermoso, A.; Quintero, A.P.; Hernández, E.; Correa-Bautista, J.E.; Izquierdo, M.; Tordecilla-Sanders, A.; Prieto-Benavides, D.; Sandoval-Cuellar, C.; González-Ruíz, K.; Villa-González, E.; et al. Active commuting to and from university, obesity and metabolic syndrome among Colombian university students. BMC Public Health 2018, 18, 523. [Google Scholar] [CrossRef] [PubMed]
- Audrey, S.; Procter, S.; Cooper, A.R. The contribution of walking to work to adult physical activity levels: A cross sectional study. Int. J. Behav. Nutr. Phys. Act. 2014, 11. [Google Scholar] [CrossRef] [PubMed]


| Cars | Public Transport | Cycling | Walking | |
|---|---|---|---|---|
| % | 26.7 (24.7; 28.8) | 52.4 (50.0; 54.8) | 6.3 (5.2; 7.6) | 14.6 (13.3; 16.2) |
| Sociodemographics | ||||
| Age (years) | 44.4 (43.1; 45.7) | 42.4 (41.2; 43.5) | 41.7 (38.8; 44.6) | 43.8 (41.4; 46.1) |
| Age categories, % | ||||
| Younger (<37 years) | 41.1 (36.7; 45.7) | 46.8 (43.4; 50.2) | 46.9 (37.0; 57.1) | 44.2 (38.8; 49.7) |
| Middle age (37–56 years) | 39.8 (35.5; 44.3) | 31.8 (28.7; 35.2) | 38.3 (29.5; 47.9) | 31.2 (26.4; 36.6) |
| Older adults (>56 years) | 19.1 (16.1; 22.6) | 21.4 (19.1; 23.8) | 14.7 (9.9; 21.4) | 24.6 (20.4; 29.3) |
| Sex, % | ||||
| Women | 33.6 (29.8; 37.5) | 61.3 (57.8; 64.6) | 24.1 (16.7; 33.5) | 58.4(52.7; 63.8) |
| Men | 66.4 (62.4; 70.2) | 38.7 (35.4; 42.2) | 75.9 (66.4; 83.3) | 41.6 (36.1; 47.3) |
| Education | ||||
| Primary | 12.4(9.8; 15.5) | 16.2 (14.2; 18.4) | 16.7 (11.0; 24.5) | 24.1 (19.8; 29.0) |
| Secondary | 52.1 (47.5; 56.6) | 56.3; (52.9; 59.7) | 59.7 (49.4; 69.3) | 59.4 (53.8; 64.8) |
| University/technical degree | 35.5 (31.2; 40.1) | 27.5 (24.4; 30.8) | 23.6 (15.2; 34.7) | 16.5 (12.4; 21.6) |
| Place of residency, % | ||||
| Urban | 87.1 (84.5; 89.3) | 91.2 (89.8; 92.4) | 87.9 (82.1; 90.1) | 84.6 (80.8; 87.7) |
| Rural | 12.8 (10.6; 15.4) | 8.7 (7.5; 10.2) | 12.0 (7.9; 17.8) | 15.3 (12.2; 19.1) |
| Anthropometrics | ||||
| Height (m) | 1.66 (1.65; 1.67) | 1.61 (1.60; 1.62) | 1.66 (1.64; 1.68) | 1.61 (1.60; 1.62) |
| Weight (kg) | 80.9 (79.7; 82.2) | 73.6 (72.5; 74.7) | 75.6 (72.9; 78.2) | 72.4 (70.9; 73.8) |
| BMI (kg/m2) | 29.4 (28.9; 29.8) | 28.4 (28.0; 28.8) | 27.5 (26.4; 28.5) | 27.8 (27.3; 28.3) |
| Nutritional status, % | ||||
| Underweight | 0.1 (0.0; 0.3) | 1.5 (0.9; 2.6) | 3.8 (1.2; 11.1) | 1.4 (0.6; 3.1) |
| Normal weight | 17.6 (14.5; 21.2) | 27.1 (24.2; 30.3) | 25.0 (17.0; 35.1) | 27.4 (22.9; 32.5) |
| Overweight | 43.1 (38.7; 47.7) | 37.4 (34.1; 40.8) | 42.7 (33.2; 52.8) | 41.4 (36.1; 47.1) |
| Obese | 39.2 (34.9; 43.6) | 33.9 (30.8; 37.2) | 28.5 (20.7; 37.8) | 29.7 (25.1; 34.8) |
| WC (cm) | 96.6 (95.8; 97.8) | 92.1 (91.1; 93.1) | 91.8 (89.3; 94.3) | 91.4 (90.2; 92.7) |
| Central obesity, % | ||||
| Normal | 55.6 (51.1; 59.9) | 55.0 (51.6; 58.3) | 70.9 (61.7; 78.7) | 54.7 (49.2; 60.0) |
| Obese | 44.4 (40.1; 48.9) | 45.0 (41.7; 48.4) | 29.1 (21.3; 38.3) | 45.3 (40.0; 50.8) |
| Lifestyle | ||||
| Physical inactivity, % | 28.6 (24.8; 32.7) | 28.4 (25.6; 31.4) | 7.7(3.8; 14.8) | 14.7(11.4; 18.8) |
| Transport PA (min.day−1) | 64.3 (526; 76.1) | 67.4 (57.7; 77.0) | 78.8 (63.1; 94.4) | 84.0 (72.6; 95.4) |
| Moderate PA (min.day−1) | 236.2 (196.8; 275.7) | 226.4 (206.0; 246.9) | 240.7 (187.1; 294.4) | 206.7 (177.8; 235.7) |
| Vigorous PA (min.day−1) | 216.0 (183.3; 248.8) | 213.1 (186.6; 239.6) | 255.1 (189.0; 301.2) | 182.9 (150.0; 215.8) |
| Total PA (MET-min.day−1) | 1274.7 (1088; 1461) | 1097.4 (994; 1200) | 1588.1 (1278; 1898) | 1132.4 (996; 1268) |
| Sitting (min.day−1) | 209.7 (193.4; 226.0) | 215.5 (203.4; 227.7) | 161.6 (131.0; 192.3) | 169.5 (150.0; 189.0) |
| Fruit and vegetables, % | ||||
| <5 portions.day−1 | 0.87 (0.84; 0.90) | 0.85 (0.82; 0.87) | 0.81 (0.70; 0.88) | 0.84 (0.79; 0.88) |
| ≥5 portions.day−1 | 0.13 (0.10; 0.16) | 0.15 (0.13; 0.18) | 0.19 (0.12; 0.30) | 0.16 (0.12; 0.21) |
| Alcohol intake, % | ||||
| Low intake | 0.94 (0.92; 0.96) | 0.95 (0.92; 0.96) | 0.92 (0.84; 0.96) | 0.95 (0.92; 0.97) |
| High intake | 0.05 (0.03; 0.08) | 0.05 (0.03; 0.08) | 0.08 (0.04; 0.16) | 0.05 (0.03; 0.08) |
| Smoking, % | ||||
| Former | 0.31 (0.27; 0.36) | 0.24 (0.21; 0.26) | 0.26 (0.18; 0.36) | 0.23 (0.18; 0.28) |
| Current | 0.28 (0.24; 0.32) | 0.23 (0.20; 0.26) | 0.26 (0.18; 0.37) | 0.22 (0.17; 0.27) |
| Occasional smoker | 0.08 (0.06; 0.11) | 0.08 (0.06; 0.10) | 0.09 (0.05; 0.17) | 0.09 (0.06; 0.13) |
| No smoker | 0.33 (0.29; 0.37) | 0.45 (0.42; 0.48) | 0.38 (0.29; 0.48) | 0.46 (0.41; 0.52) |
| Cars | Public Transport | p | Cycling | p | Walking | p | |
|---|---|---|---|---|---|---|---|
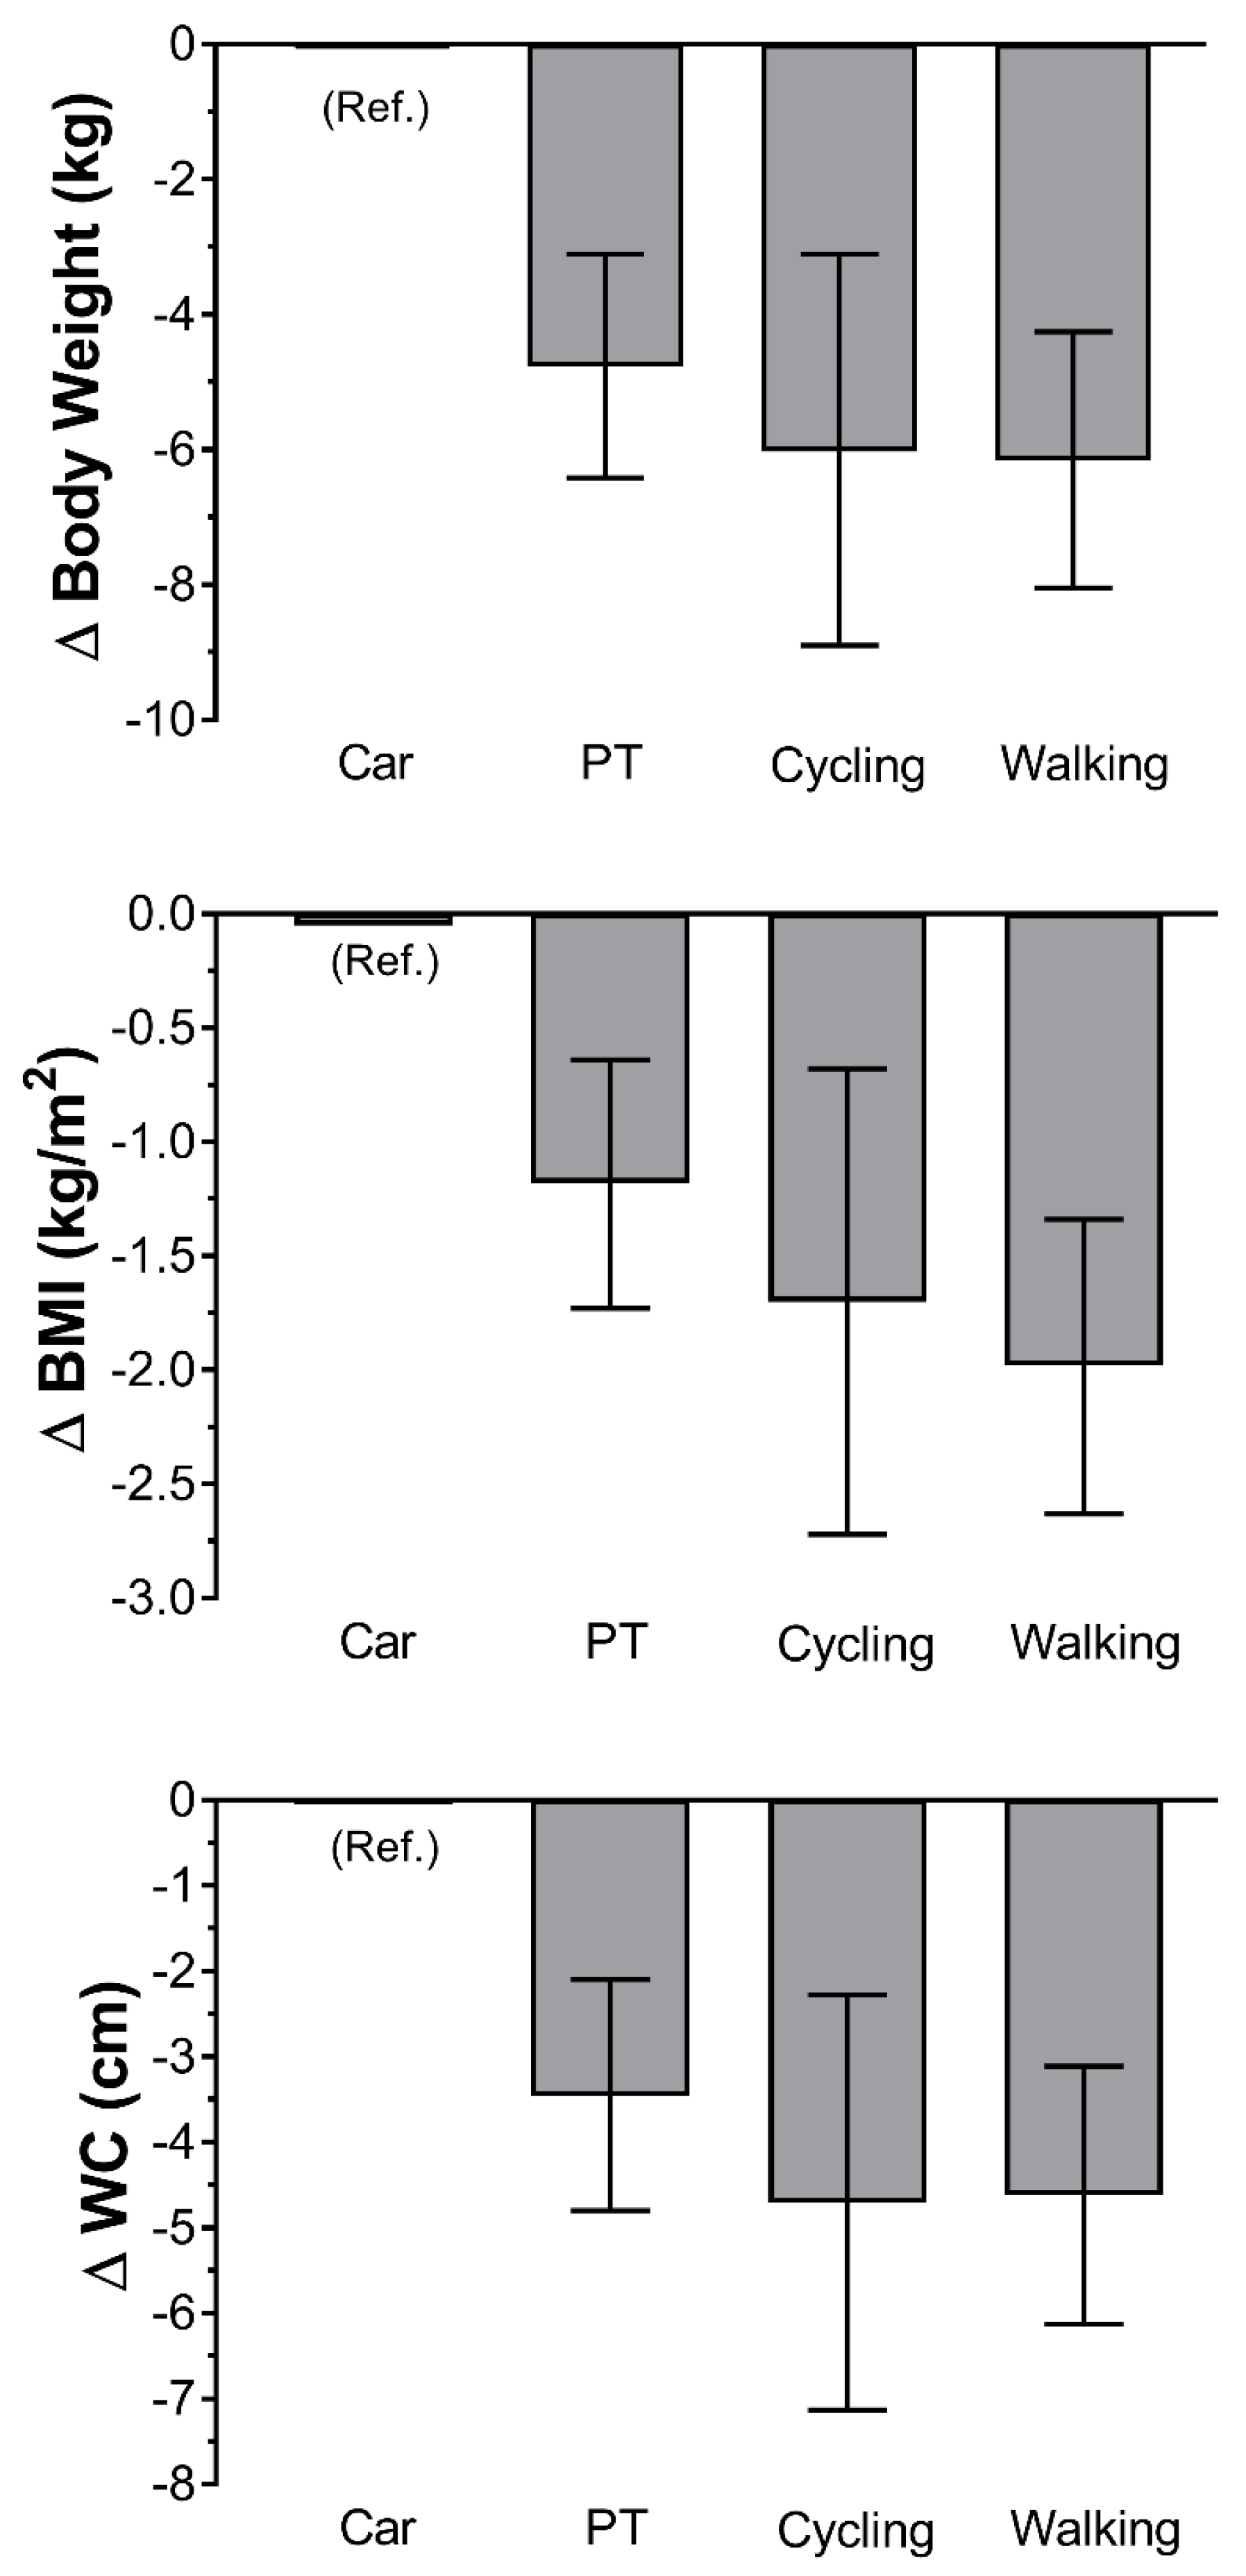
| Weight (kg) | β (95% CI) | β (95% CI) | β (95% CI) | ||||
| Model 1 | 1.00 (Ref.) | −7.33 (−9.00; −5.66) | <0.001 | −5.40 (−8.35; −2.44) | <0.001 | −8.60 (−10.5; −6.70) | <0.001 |
| Model 2 | 1.00 (Ref.) | −4.88 (−6.53; −3.23) | <0.001 | −6.06 (−8.96; −3.16) | <0.001 | −6,29 (−8.18; −4.39) | <0.001 |
| Model 3 | 1.00 (Ref.) | −4.78 (−6.43; −3.12) | <0.001 | −6.02 (−8.88; −3.16) | <0.001 | −6.20 (−8.09; −4.30) | <0.001 |
| Model 4 | 1.00 (Ref.) | −4.77 (−6.42; −3.11) | <0.001 | −6.03 (−8.90; −3.11) | <0.001 | −6.16 (−8.05; −4.26) | <0.001 |
| BMI (kg/m2) | |||||||
| Model 1 | 1.00 (Ref.) | −0.91 (−1.45; −0.36) | <0.001 | −1.88 (−2.98; −0.77) | <0.001 | −1.56 (−2.21; −0.90) | <0.001 |
| Model 2 | 1.00 (Ref.) | −1.20 (−1.75; −0.66) | <0.001 | −1.70 (−2.73; −0.67) | <0.001 | −2.02 (−2.66; −1.38) | <0.001 |
| Model 3 | 1.00 (Ref.) | −1.19 (−1.73; −0.65) | <0.001 | −1.69 (−2.71; −0.67) | <0.001 | −2.00 (−2.64; −1.36) | <0.001 |
| Model 4 | 1.00 (Ref.) | −1.18 (−1.73; −0.64) | <0.001 | −1.70 (−2.72; −0.68) | <0.001 | −1.98 (−2.63; −1.34) | <0.001 |
| WC (cm) | |||||||
| Model 1 | 1.00 (Ref.) | −4.71 (−6.12; −3.29) | <0.001 | −4.99 (−7.66; −2.32) | <0.001 | −5.35 (−6.95; −3.76) | <0.001 |
| Model 2 | 1.00 (Ref.) | −3.52 (−4.87; −2.17) | <0.001 | −4.73 (−7.18; −2.28) | <0.001 | −4.71 (−6.22; −3.20) | <0.001 |
| Model 3 | 1.00 (Ref.) | −3.47 (−4.81; −2.12) | <0.001 | −4.69 (−7.11; −2.27) | <0.001 | −4.66 (−6.17; −3.15) | <0.001 |
| Model 4 | 1.00 (Ref.) | −3.46 (−4.80; −2.10) | <0.001 | −4.71 (−7.13; −2.28) | <0.001 | −4.62 (−6.13; −3.11) | <0.001 |
| Car | Public Transport | p | Cycling | p | Walking | p | |
|---|---|---|---|---|---|---|---|
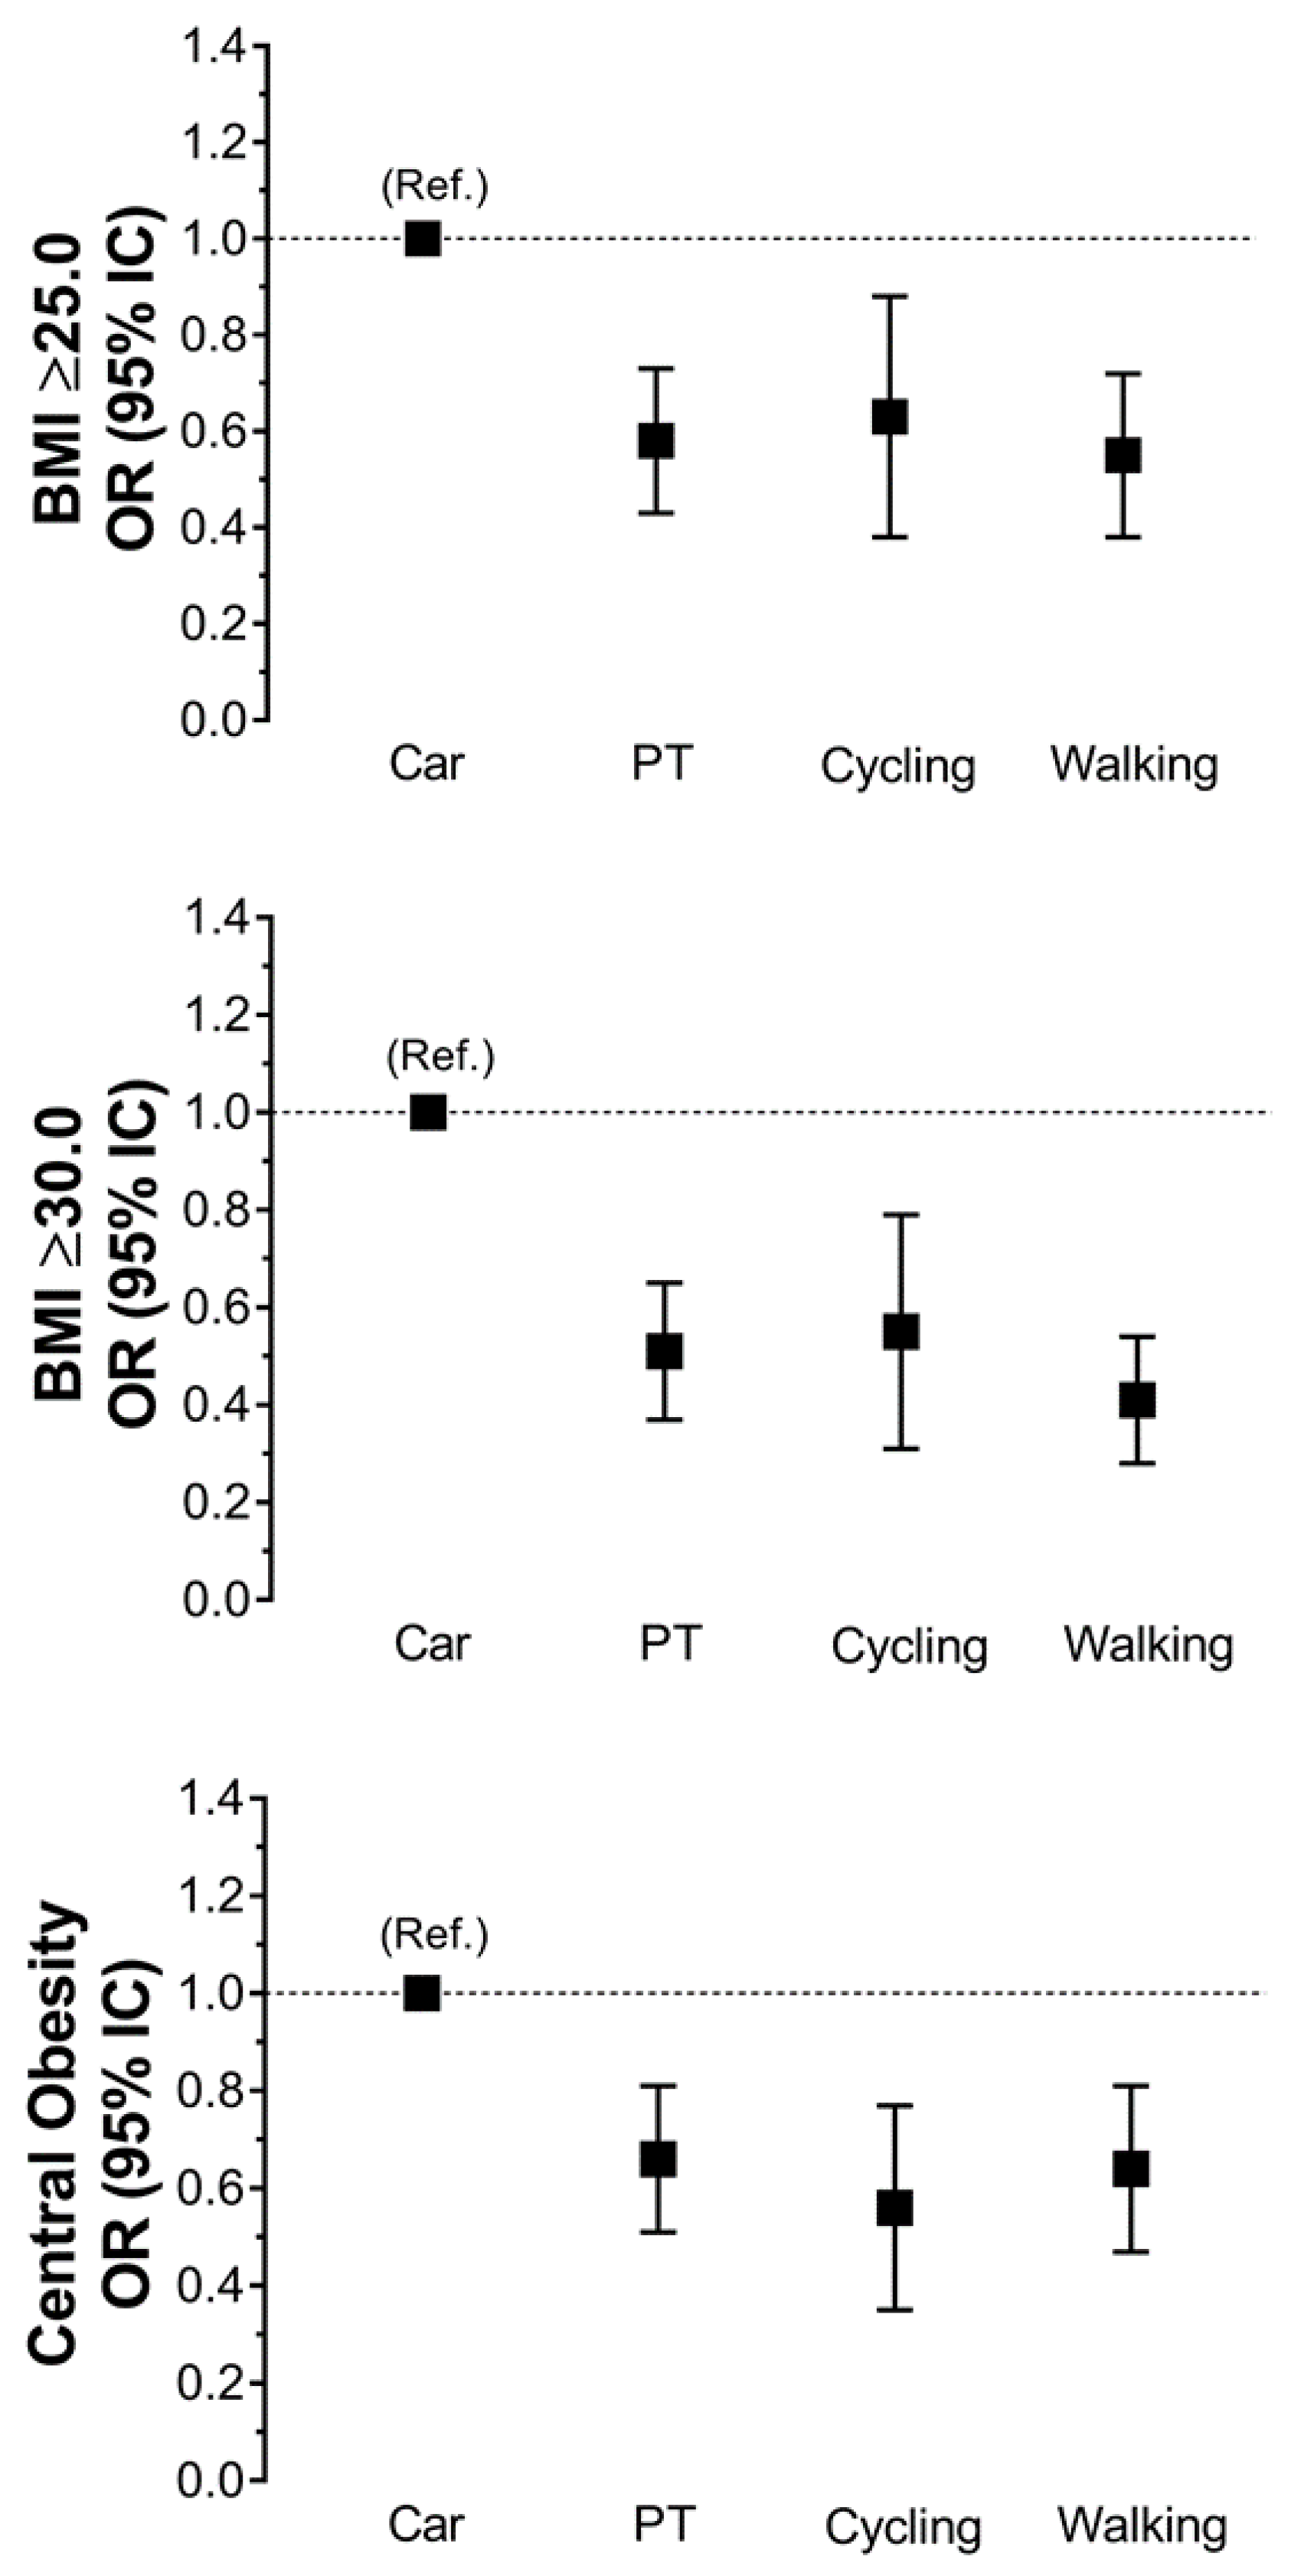
| Overweight | OR (95% CI) | OR (95% CI) | OR (95% CI) | ||||
| Model 1 | 1.00 (Ref.) | 0.56 (0.43; 0.74) | <0.001 | 0.61 (0.36; 0.86) | <0.001 | 0.56 (0.40; 0.77) | <0.001 |
| Model 2 | 1.00 (Ref.) | 0.57 (0.42; 0.76) | <0.001 | 0.62 (0.37; 0.87) | <0.001 | 0.54 (0.38; 0.75) | <0.001 |
| Model 3 | 1.00 (Ref.) | 0.58 (0.43; 0.78) | <0.001 | 0.63 (0.37; 0.87) | <0.001 | 0.55 (0.39; 0.77) | <0.001 |
| Model 4 | 1.00 (Ref.) | 0.58 (0.43; 0.78) | <0.001 | 0.63 (0.38; 0.89) | <0.001 | 0.55 (0.38; 0.77) | <0.001 |
| Obesity | |||||||
| Model 1 | 1.00 (Ref.) | 0.56 (0.41; 0.76) | <0.001 | 0.51 (0.28; 0.93) | 0.029 | 0.49 (0.33; 0.71) | <0.001 |
| Model 2 | 1.00 (Ref.) | 0.51 (0.37; 0.71) | <0.001 | 0.53 (0.30; 0.61) | 0.031 | 0.41 (0.27; 0.61) | <0.001 |
| Model 3 | 1.00 (Ref.) | 0.51 (0.37; 0.72) | <0.001 | 0.55 (0.31; 0.98) | 0.039 | 0.41 (0.28; 0.61) | <0.001 |
| Model 4 | 1.00 (Ref.) | 0.51 (0.37; 0.72) | <0.001 | 0.55 (0.31; 0.99) | 0.048 | 0.41 (0.28; 0.61) | <0.001 |
| Central obesity | |||||||
| Model 1 | 1.00 (Ref.) | 1.02 (0.82; 1.30) | 0.829 | 0.51 (0.33; 0.81) | 0.004 | 1.04 (0.78; 1.38) | 0.801 |
| Model 2 | 1.00 (Ref.) | 0.66 (0.51; 0.86) | 0.002 | 0.56 (0.35; 0.89) | 0.014 | 0.64 (0.46; 0.88) | 0.006 |
| Model 3 | 1.00 (Ref.) | 0.66 (0.51; 0.86) | 0.002 | 0.56 (0.35; 0.89) | 0.014 | 0.64 (0.47; 0.89) | 0.007 |
| Model 4 | 1.00 (Ref.) | 0.66 (0.51; 0.86) | 0.002 | 0.56 (0.35; 0.89) | 0.014 | 0.64 (0.47; 0.89) | 0.007 |
© 2020 by the authors. Licensee MDPI, Basel, Switzerland. This article is an open access article distributed under the terms and conditions of the Creative Commons Attribution (CC BY) license (http://creativecommons.org/licenses/by/4.0/).
Share and Cite
Medina, I.; Petermann-Rocha, F.; Waddell, H.; Díaz-Martínez, X.; Matus-Castillo, C.; Cigarroa, I.; Concha-Cisternas, Y.; Salas-Bravo, C.; Martínez-Sanguinetti, M.A.; Celis-Morales, C.; et al. Association between Different Modes of Travelling and Adiposity in Chilean Population: Findings from the Chilean National Health Survey 2016–2017. Int. J. Environ. Res. Public Health 2020, 17, 3731. https://doi.org/10.3390/ijerph17103731
Medina I, Petermann-Rocha F, Waddell H, Díaz-Martínez X, Matus-Castillo C, Cigarroa I, Concha-Cisternas Y, Salas-Bravo C, Martínez-Sanguinetti MA, Celis-Morales C, et al. Association between Different Modes of Travelling and Adiposity in Chilean Population: Findings from the Chilean National Health Survey 2016–2017. International Journal of Environmental Research and Public Health. 2020; 17(10):3731. https://doi.org/10.3390/ijerph17103731
Chicago/Turabian StyleMedina, Ignacio, Fanny Petermann-Rocha, Heather Waddell, Ximena Díaz-Martínez, Carlos Matus-Castillo, Igor Cigarroa, Yeny Concha-Cisternas, Carlos Salas-Bravo, Maria A Martínez-Sanguinetti, Carlos Celis-Morales, and et al. 2020. "Association between Different Modes of Travelling and Adiposity in Chilean Population: Findings from the Chilean National Health Survey 2016–2017" International Journal of Environmental Research and Public Health 17, no. 10: 3731. https://doi.org/10.3390/ijerph17103731
APA StyleMedina, I., Petermann-Rocha, F., Waddell, H., Díaz-Martínez, X., Matus-Castillo, C., Cigarroa, I., Concha-Cisternas, Y., Salas-Bravo, C., Martínez-Sanguinetti, M. A., Celis-Morales, C., & Team, E.-R. (2020). Association between Different Modes of Travelling and Adiposity in Chilean Population: Findings from the Chilean National Health Survey 2016–2017. International Journal of Environmental Research and Public Health, 17(10), 3731. https://doi.org/10.3390/ijerph17103731