Vision Development Differences between Slow and Fast Motor Development in Typical Developing Toddlers: A Cross-Sectional Study

 ,
,  ,
,  ,
,  and
and
Abstract
1. Introduction
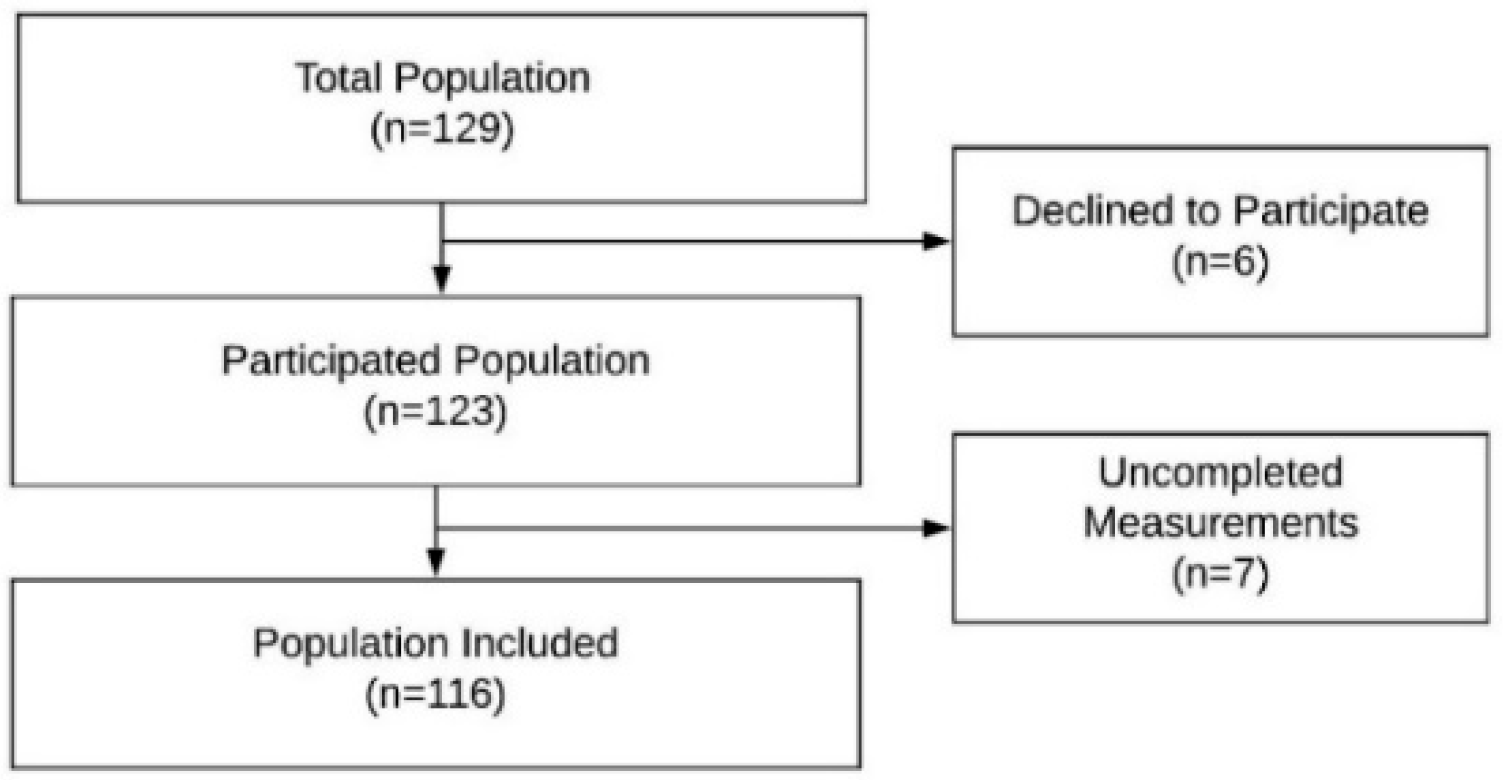
2. Materials and Methods
2.1. Design
2.2. Subjects
2.3. Measurements and Materials
2.4. Developmental Motor Assessment
2.5. Visual Development Assessment
2.5.1. Visual Acuity and Refraction
2.5.2. Ocular Alignment
2.5.3. Motor Fusion, Suppression, and Stereopsis
2.6. Statistical Analysis
3. Results
4. Discussion
4.1. Visual Acuity Differences between Slow and Fast Gross Motor Development
4.2. Ocular Alignment Differences between Slow and Fast Gross Motor Development
4.3. Stereopsis Differences between Slow and Fast Gross Motor Development
4.4. Future Research and Limitations
5. Conclusions
Author Contributions
Funding
Conflicts of Interest
References
- Niechwiej-Szwedo, E.; Colpa, L.; Wong, A.M.F. Visuomotor Behaviour in Amblyopia: Deficits and Compensatory Adaptations. Neural Plast. 2019, 2019, 6817839. [Google Scholar] [CrossRef] [PubMed]
- Hayhoe, M.M. Vision and Action. Annu. Rev. Vis. Sci. 2017, 3, 389–413. [Google Scholar] [CrossRef] [PubMed]
- Goodale, M.A. Transforming vision into action. Vis. Res. 2011, 51, 1567–1587. [Google Scholar] [CrossRef] [PubMed]
- Logan, D.; Kiemel, T.; Dominici, N.; Cappellini, G.; Ivanenko, Y.; Lacquaniti, F.; Jeka, J.J. The many roles of vision during walking. Exp. Brain Res. 2010, 206, 337–350. [Google Scholar] [CrossRef]
- Chapman, G.J.; Scally, A.; Buckley, J.G. Importance of binocular vision in foot placement accuracy when stepping onto a floor-based target during gait initiation. Exp. Brain Res. 2012, 216, 71–80. [Google Scholar] [CrossRef]
- Kyvelidou, A.; Stergiou, N. Visual and somatosensory contributions to infant sitting postural control. Somatosens. Mot. Res. 2018, 35, 240–246. [Google Scholar] [CrossRef]
- von Hofsten, C.; Fazel-Zandy, S. Development of visually guided hand orientation in reaching. J. Exp. Child Psychol. 1984, 38, 208–219. [Google Scholar] [CrossRef]
- Anderson, D.I.; He, M.; Gutierrez, P.; Uchiyama, I.; Campos, J.J. Do balance demands induce shifts in visual proprioception in crawling infants? Front. Psychol. 2019, 10. [Google Scholar] [CrossRef]
- Veldman, S.L.C.; Santos, R.; Jones, R.A.; Sousa-Sá, E.; Okely, A.D. Associations between gross motor skills and cognitive development in toddlers. Early Hum. Dev. 2019, 132, 39–44. [Google Scholar] [CrossRef]
- Folio, M.; Fewell, R. Peabody Developmental Motor Scales–Second Edition (PDMS-2): Examiner’s Mmanual; Pro-Ed: Austin, TX, USA, 2000. [Google Scholar]
- Hadders-Algra, M. Variation and Variability: Key Words in Human Motor Development. Phys. Ther. 2010, 90, 1823–1837. [Google Scholar] [CrossRef]
- Prechtl, H.F.R.; Cioni, G.; Einspieler, C.; Bos, A.F.; Ferrari, F. Role of vision on early motor development: Lessons from the blind. Dev. Med. Child Neurol. 2001, 43, 198–201. [Google Scholar] [CrossRef] [PubMed]
- Fagard, J.; Rat-Fischer, L.; Esseily, R.; Somogyi, E.; O’Regan, J.K. What does it take for an infant to learn how to use a tool by observation? Front. Psychol. 2016, 7. [Google Scholar] [CrossRef] [PubMed]
- Grant, S.; Suttle, C.; Melmoth, D.R.; Conway, M.L.; Sloper, J.J. Age- and stereovision-dependent eye-hand coordination deficits in children with amblyopia and abnormal binocularity. Investig. Opthalmology Vis. Sci. 2014, 55, 5687–57015. [Google Scholar] [CrossRef] [PubMed]
- Webber, A.L.; Wood, J.M.; Gole, G.A.; Brown, B. The effect of amblyopia on fine motor skills in children. Investig. Opthalmol. Vis. Sci. 2008, 49, 594–603. [Google Scholar] [CrossRef]
- Kelly, K.R.; Jost, R.M.; De La Cruz, A.; Birch, E.E. Amblyopic children read more slowly than controls under natural, binocular reading conditions. J. AAPOS 2015, 19, 515–520. [Google Scholar] [CrossRef]
- Kelly, K.R.; Jost, R.M.; De La Cruz, A.; Dao, L.; Beauchamp, C.L.; Stager, D.; Birch, E.E. Slow reading in children with anisometropic amblyopia is associated with fixation instability and increased saccades. J. AAPOS 2017, 21, 447–451.e1. [Google Scholar] [CrossRef]
- O’Connor, A.R.; Birch, E.E.; Anderson, S.; Draper, H. FSOS Research Group The functional significance of stereopsis. Investig. Opthalmology Vis. Sci. 2010, 51, 2019–2023. [Google Scholar] [CrossRef]
- Hemptinne, C.; Aerts, F.; Pellissier, T.; Ruiz, C.R.; Cardoso, V.A.; Vanderveken, C.; Yüksel, D. Motor skills in children with strabismus. J. Am. Assoc. Pediatr. Ophthalmol. Strabismus 2020. [Google Scholar] [CrossRef]
- Kulp, M.T.; Schmidt, P.P. A pilot study. Depth perception and near stereoacuity: Is it related to academic performance in young children? Binocul. Vis. Strabismus Q. 2002, 17, 129–134. [Google Scholar]
- Alramis, F.; Roy, E.; Christian, L.; Niechwiej-Szwedo, E. Contribution of binocular vision to the performance of complex manipulation tasks in 5-13 years old visually-normal children. Hum. Mov. Sci. 2016, 46, 52–62. [Google Scholar] [CrossRef]
- Elisa, F.; Josée, L.; Oreste, F.-G.; Claudia, A.; Antonella, L.; Sabrina, S.; Giovanni, L. Gross motor development and reach on sound as critical tools for the development of the blind child. Brain Dev. 2002, 24, 269–275. [Google Scholar] [CrossRef]
- Souza, T.A.; Souza, V.E.; Lopes, M.C.B.; Kitadai, S.P.S. Description of the neuropsychomotor and visual development of visually impaired children. Arq. Bras. Oftalmol. 2010, 73, 526–530. [Google Scholar] [CrossRef] [PubMed]
- Celano, M.; Hartmann, E.E.; Dubois, L.G.; Drews-Botsch, C. Motor skills of children with unilateral visual impairment in the Infant Aphakia Treatment Study. Dev. Med. Child Neurol. 2016, 58, 154–159. [Google Scholar] [CrossRef] [PubMed]
- Chakraborty, A.; Anstice, N.S.; Jacobs, R.J.; Paudel, N.; LaGasse, L.L.; Lester, B.M.; McKinlay, C.J.D.; Harding, J.E.; Wouldes, T.A.; Thompson, B. Global motion perception is related to motor function in 4.5-year-old children born at risk of abnormal development. Vis. Res. 2017, 135, 16–25. [Google Scholar] [CrossRef] [PubMed]
- Thompson, B.; McKinlay, C.J.D.; Chakraborty, A.; Anstice, N.S.; Jacobs, R.J.; Paudel, N.; Yu, T.Y.; Ansell, J.M.; Wouldes, T.A.; Harding, J.E. Global motion perception is associated with motor function in 2-year-old children. Neurosci. Lett. 2017, 658, 177–181. [Google Scholar] [CrossRef]
- Griffiths, A.; Toovey, R.; Morgan, P.E.; Spittle, A.J. Psychometric properties of gross motor assessment tools for children: A systematic review. BMJ Open 2018, 8, 21734. [Google Scholar] [CrossRef]
- Hua, J.; Gu, G.; Meng, W.; Wu, Z. Age band 1 of the Movement Assessment Battery for Children-Second Edition: Exploring its usefulness in mainland China. Res. Dev. Disabil. 2013, 34, 801–808. [Google Scholar] [CrossRef]
- Wuang, Y.-P.; Su, C.-Y.; Huang, M.-H. Psychometric comparisons of three measures for assessing motor functions in preschoolers with intellectual disabilities. J. Intellect. Disabil. Res. 2012, 56, 567–578. [Google Scholar] [CrossRef]
- Bowman, R.; Foster, A. Testing the red reflex. Community Eye Health 2018, 31, 23. [Google Scholar]
- Sathar, A.; Abbas, S.; Nujum, Z.T.; Benson, J.L.; Sreedevi, G.P.; Saraswathyamma, S.K. Visual outcome of preterm infants screened in a tertiary care hospital. Middle East Afr. J. Ophthalmol. 2019, 26, 158–162. [Google Scholar] [CrossRef]
- Schmidt, P.P. Allen figure and broken wheel visual acuity measurement in preschool children. J. Am. Optom. Assoc. 1992, 63, 124–130. [Google Scholar] [PubMed]
- Mohindra, I. A non cycloplegic refraction technique for infants and young children. J. Am. Optom. Assoc. 1977, 48, 518–523. [Google Scholar] [PubMed]
- Rutstein, R.P.; Author Martin Cogen, P.S.; Cotter, S.A.; Kent Daum, O.M.; Mozlin, R.L.; Julie Ryan, O.M.; Heath, D.A.; Diane Adamczyk, C.T.; John Amos, O.F.; Brian Mathie, M.E.; et al. Optometric clinical practice guideline care of the patient with strabismus: Esotropia and Exotropia; American Optometric Association: St. Louis, MO, USA, 2010. [Google Scholar]
- Basmak, H.; Sahin, A.; Yildirim, N.; Papakostas, T.D.; Kanellopoulos, A.J. Measurement of angle kappa with synoptophore and Orbscan II in a normal population. J. Refract. Surg. 2007, 23, 456–460. [Google Scholar] [CrossRef] [PubMed]
- Yu, T.Y.; Jacobs, R.J.; Anstice, N.S.; Paudel, N.; Harding, J.E.; Thompson, B. Global motion perception in 2-year-old children: A method for psychophysical assessment and relationships with clinical measures of visual function. Investig. Opthalmology Vis. Sci. 2013, 54, 8408–8419. [Google Scholar] [CrossRef] [PubMed]
- Ostadimoghaddam, H.; Hashemi, H.; Nabovati, P.; Yekta, A.; Khabazkhoob, M. The distribution of near point of convergence and its association with age, gender and refractive error: A population-based study. Clin. Exp. Optom. 2017, 100, 255–259. [Google Scholar] [CrossRef] [PubMed]
- Chen, A.H.; O’Leary, D.J.; Howell, E.R. Near visual function in young children. Part I: Near point of convergence. Part II: Amplitude of accommodation. Part III: Near heterophoria. Ophthalmic Physiol. Opt. 2000, 20, 185–198. [Google Scholar] [CrossRef] [PubMed]
- Niechwiej-Szwedo, E.; Goltz, H.C.; Chandrakumar, M.; Hirji, Z.A.; Wong, A.M.F. Effects of anisometropic amblyopia on visuomotor behavior, I: Saccadic eye movements. Investig. Opthalmology Vis. Sci. 2010, 51, 6348–6354. [Google Scholar] [CrossRef]
- Budai, A.; Czigler, A.; Mikó-Baráth, E.; Nemes, V.A.; Horváth, G.; Pusztai, Á.; Piñero, D.P.; Jandó, G. Validation of dynamic random dot stereotests in pediatric vision screening. Graefe’s Arch. Clin. Exp. Ophthalmol. 2019, 257, 413–423. [Google Scholar] [CrossRef]
- Connolly, B.H.; McClune, N.O.; Gatlin, R. Concurrent validity of the bayley-III and the peabody developmental motor scale-2. Pediatr. Phys. Ther. 2012, 24, 345–352. [Google Scholar] [CrossRef]
- Gill, K.; Osiovich, A.; Synnes, A.; Agnew, J.; Grunau, R.E.; Miller, S.P.; Zwicker, J.G. Concurrent Validity of the Bayley-III and the Peabody Developmental Motor Scales-2 at 18 Months. Phys. Occup. Ther. Pediatr. 2019, 39, 514–524. [Google Scholar] [CrossRef]
- Hussaindeen, J.R.; Rakshit, A.; Singh, N.K.; George, R.; Swaminathan, M.; Kapur, S.; Scheiman, M.; Ramani, K.K. Prevalence of non-strabismic anomalies of binocular vision in Tamil Nadu: Report 2 of BAND study. Clin. Exp. Optom. 2017, 100, 642–648. [Google Scholar] [CrossRef] [PubMed]
- Jang, J.U.; Park, I.J. Prevalence of general binocular dysfunctions among rural schoolchildren in South Korea. Taiwan J. Ophthalmol. 2015, 5, 177–181. [Google Scholar] [CrossRef] [PubMed]
- Cacho-Martínez, P.; García-Muñoz, Á.; Ruiz-Cantero, M.T. Do we really know the prevalence of accomodative and nonstrabismic binocular dysfunctions? J. Optom. 2010, 3, 185–197. [Google Scholar] [CrossRef]
- Cacho-Martínez, P.; Cantó-Cerdán, M.; Carbonell-Bonete, S.; García-Muñoz, Á. Characterization of Visual Symptomatology Associated with Refractive, Accommodative, and Binocular Anomalies. J. Ophthalmol. 2015, 2015, 895803. [Google Scholar] [CrossRef] [PubMed]
- Cacho-Martínez, P.; García-Muñoz, Á.; Ruiz-Cantero, M.T. Is there any evidence for the validity of diagnostic criteria used for accommodative and nonstrabismic binocular dysfunctions? J. Optom. 2014, 7, 2–21. [Google Scholar] [CrossRef]
- DeSantis, D. Amblyopia. Pediatric Clin. N. Am. 2014, 61, 505–518. [Google Scholar] [CrossRef]
- Kiorpes, L. Understanding the development of amblyopia using macaque monkey models. Proc. Natl. Acad. Sci. USA 2019, 116, 26217–26223. [Google Scholar] [CrossRef]
- Guo, X.; Fu, M.; Lü, J.; Chen, Q.; Zeng, Y.; Ding, X.; Morgan, I.G.; He, M. Normative distribution of visual acuity in 3- to 6-year-old Chinese preschoolers: The Shenzhen kindergarten eye study. Investig. Opthalmology Vis. Sci. 2015, 56, 1985–1992. [Google Scholar] [CrossRef]
- Birch, E.E.; Castañeda, Y.S.; Cheng-Patel, C.S.; Morale, S.E.; Kelly, K.R.; Beauchamp, C.L.; Webber, A. Self-perception of School-aged Children with Amblyopia and Its Association with Reading Speed and Motor Skills. JAMA Ophthalmol. 2019, 137, 167. [Google Scholar] [CrossRef]
- Birch, E.E.; Castañeda, Y.S.; Cheng-Patel, C.S.; Morale, S.E.; Kelly, K.R.; Beauchamp, C.L.; Webber, A. Self-perception in Children Aged 3 to 7 Years with Amblyopia and Its Association with Deficits in Vision and Fine Motor Skills. JAMA Ophthalmol. 2019, 137, 499–506. [Google Scholar] [CrossRef]
- Atkinson, J.; Nardini, M.; Anker, S.; Braddick, O.; Hughes, C.; Rae, S. Refractive errors in infancy predict reduced performance on the movement assessment battery for children at 3 1/2 and 5 1/2 years. Dev. Med. Child Neurol. 2005, 47, 243–251. [Google Scholar] [CrossRef] [PubMed]
- Babinsky, E.; Sreenivasan, V.; Rowan Candy, T. Near heterophoria in early childhood. Investig. Opthalmology Vis. Sci. 2015, 56, 1406–1415. [Google Scholar] [CrossRef] [PubMed]
- Troyer, M.E.; Sreenivasan, V.; Peper, T.J.; Candy, T.R. The heterophoria of 3–5 year old children as a function of viewing distance and target type. Ophthalmic Physiol. Opt. 2017, 37, 7–15. [Google Scholar] [CrossRef] [PubMed][Green Version]
- Lam, S.R.; LaRoche, G.R.; De Becker, I.; Macpherson, H. The range and variability of ophthalmological parameters in normal children aged 4 1/2 to 5 1/2 years. J. Pediatric Ophthalmol. Strabismus 1996, 33, 251–256. [Google Scholar]
- Sreenivasan, V.; Babinsky, E.E.; Wu, Y.; Candy, T.R. Objective measurement of fusional vergence ranges and heterophoria in infants and preschool children. Investig. Opthalmol. Vis. Sci. 2016, 57, 2678–2688. [Google Scholar] [CrossRef]
- Jeon, H.; Jung, J.H.; Yoon, J.A.; Choi, H. Strabismus Is Correlated with Gross Motor Function in Children with Spastic Cerebral Palsy. Curr. Eye Res. 2019. [Google Scholar] [CrossRef]
- Jampolsky, A. Differential Diagnostic Characteristics of Intermittent Exotropia and True Exophoria. Am. Orthopt. J. 1954, 4, 48–55. [Google Scholar] [CrossRef]
- Barbosa, V.M.; Campbell, S.K.; Smith, E.; Berbaum, M. Comparison of Test of Infant Motor Performance (TIMP) item responses among children with cerebral palsy, developmental delay, and typical development. Am. J. Occup. Ther. 2005. [Google Scholar] [CrossRef]
- Barbosa, V.M.; Campbell, S.K.; Berbaum, M. Discriminating infants from different developmental outcome groups using the Test of Infant Motor Performance (TIMP) item responses. Pediatr. Phys. Ther. 2007. [Google Scholar] [CrossRef]
- Read, J.C.A. Stereo vision and strabismus. Eye 2014, 29, 214–224. [Google Scholar] [CrossRef]
- Levi, D.M.; Knill, D.C.; Bavelier, D. Stereopsis and amblyopia: A mini-review. Vis. Res. 2015, 114, 17–30. [Google Scholar] [CrossRef] [PubMed]
- Murdoch, J.R.; McGhee, C.N.G.; Glover, V. The relationship between stereopsis and fine manual dexterity: Pilot study of a new instrument. Eye 1991, 5, 642–643. [Google Scholar] [CrossRef] [PubMed][Green Version]
- Caputo, R.; Tinelli, F.; Bancale, A.; Campa, L.; Frosini, R.; Guzzetta, A.; Mercuri, E.; Cioni, G. Motor coordination in children with congenital strabismus: Effects of late surgery. Eur. J. Paediatr. Neurol. 2007, 11, 285–291. [Google Scholar] [CrossRef] [PubMed]
- Iwasaki, T.; Nagata, T.; Tawara, A. Potential preventive effects of a new visual intervention for accommodative insufficiency and asthenopia due to sustained near task. Ophthalmologica 2012, 228, 181–187. [Google Scholar] [CrossRef]
- Ma, M.M.-L.; Scheiman, M.; Su, C.; Chen, X. Effect of Vision Therapy on Accommodation in Myopic Chinese Children. J. Ophthalmol. 2016, 2016, 1202469. [Google Scholar] [CrossRef]


| Motor Development Parameter (n = 116) | Value | Visual Development Parameter (n = 116) | Value | ||
|---|---|---|---|---|---|
| Right Eye | Left Eye | Both Eye | |||
| Age (Months) | 29.57 ± 3.45 (24.16 to 36.90) | Visual Acuity (Cardiff Test—LogMAR) | 0.18 ± 0.10 (0.10 to 0.70) | 0.18 ± 0.10 (0.10 to 0.70) | 0.17 ± 0.10 (0.10 to 0.70) |
| Dominant Hand (Right/Left) | 113 (97.4%)/3 (2.6) | Visual Acuity (Broken Wheels—LogMAR) | 0.36 ± 0.04 (0.20 to 0.40) | 0.37 ± 0.49 (0.20 to 0.40) | 0.37 ± 0.49 (0.30 to 0.40) |
| Dominant Foot (Right/Left) | 109 (94%)/7 (6%) | Retinoscopy Refraction (Diopters D) Spherical Equivalent Refraction | +1.30 ± 0.85 (−1.00 to +3.00) | +1.39 ± 0.87 (−2.00 to +3.00) | - |
| Static Percentile | 72.04 ± 19.90 (9.00 to 99.00) | Kappa Angle (Negative/0/Positive) | 5 (4.3%) 35 (30.2%) 76 (65.5) | 5 (5.2%) 34 (29.3) 76 (65.5) | - |
| Locomotion Percentile | 15.87 ± 11.08 (2.00 to 50.00) | Hirshberg Reflex (n = 115 y 114) (Temporal/Centered/Nasal) | 4 (3.4%) 37 (31.9%) 74 (63.8%) | 5 (4.3%) 38 (32.8%) 71 (61.2%) | - |
| Handling Percentile | 43.43 ± 21.20 (5.00 to 95.00) | Krismky Test (Normal/Deviated) | 106 (91.4%)/10 (8.6%) | ||
| Grasp Percentile | 73.53 ± 24.16 (5.00 to 99.00) | Near Point of Convergence (centimeter, cm) | 2.01 ± 3.62 (0.00 to 20.00) | ||
| Coordination Percentile | 37.79 ± 18.76 (2.00 to 84.00) | Base-Out 6∆ Prism Test (prism diopters, ∆) (Negative/Positive) | 43 (37.1%)/73 (62.9%) | ||
| Thick Motor Percentile (TMP) | 42.40 ± 21.00 (8.00 to 95.00) | Base-In 6∆ Prism Test (prism, diopters, ∆ (Negative/Positive) | 86 (74.1%)/30 (25.9%) | ||
| Fine Motor Percentile (FMP) | 56.68 ± 24.33 (12.00 to 99.00) | Stereopsis Lang Test (Second arc) (200”, 400” y 600”) | 297.29 ± 139.77 (200.00 to 600.00) | ||
| Overall Motor Percentile (OMP) | 49.71 ± 22.32 (4.00 to 96.00) | Bruckner Test (Normal/Deviated) | 107 (92.2%)/9 (7.8%) | ||
| Thick Motor Quotient (TMQ) | 96.81 ± 9.15 (79.00 to 124.00) | Fixation Test (Passed/Not passed) | 90 (77.6%)/26 (22.4%) | ||
| Fine Motor Quotient (FMQ) | 104.52 ± 14.90 (14.00 to 151.00) | Accuracy and Head (Tracking Movements) | Smooth 34 (29.3%)/Loss 45 (38.8%)/Jumps 27 (23.3%)/Continuous Loss 10 (8.6%) Motionless 17 (14.7%)/Slight 49 (42.2%)/Medium 32 (27.6%)/Strong 18 (15.5%) | ||
| Overall Motor Quotient (OMQ) | 98.66 ± 14.55 (0.00 to 126.00) | Reflection and Head (Saccades Movements) | Negative 67 (57.8%)/Positive 49 (42.2%) Motionless 15 (12.9%)/Slight 54 (46.6%)/Medium 30 (25.9%)/Strong 17 (14.7%) | ||
| Visual Development Parameter | Gross Motor Quotient < 100 (n = 80) | Gross Motor Quotient > 100 (n = 36) | p Value * |
|---|---|---|---|
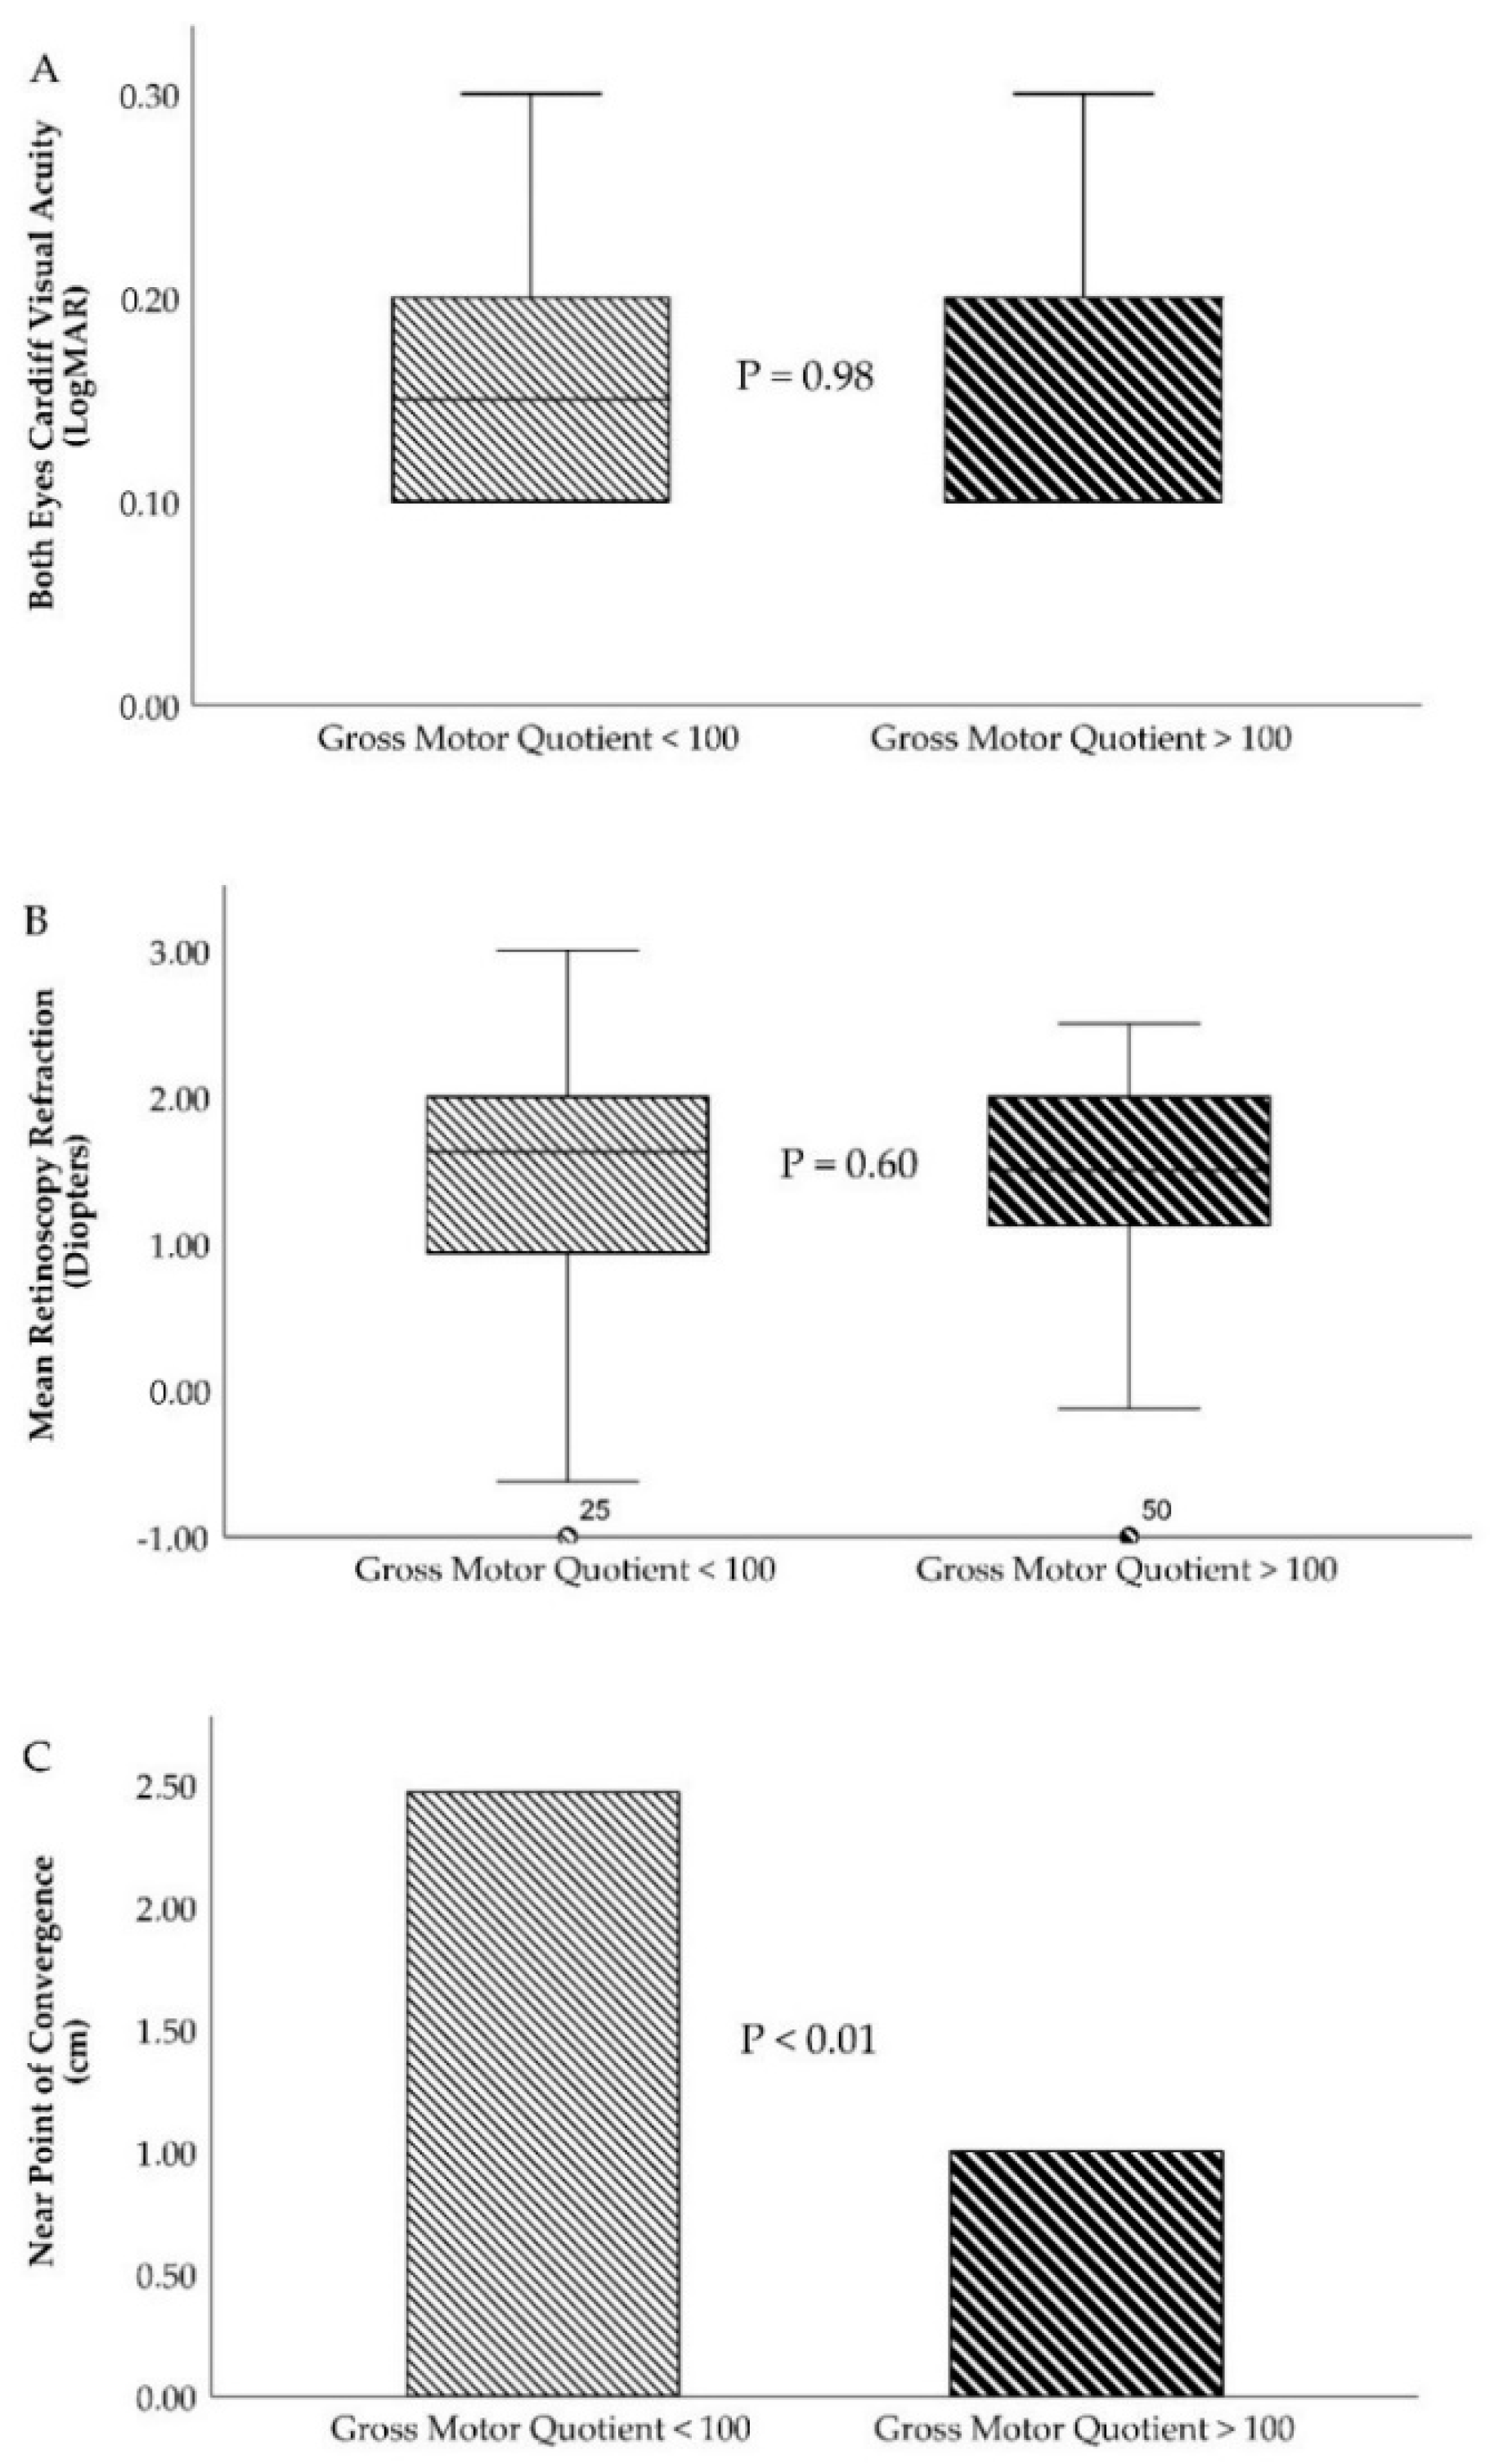
| Cardiff VA (RE)/(LE) | 0.18 ± 0.10/0.18 ± 0.10 | 0.18 ± 0.10/0.18 ± 0.09 | 0.98/0.98 |
| Broken Wheels VA (RE)/(LE) | 0.36 ± 0.05/0.36 ± 0.04 | 0.37 ± 0.04/0.37 ± 0.04 | 0.26/0.34 |
| Retinoscopy Rx (RE)/(LE) | +1.27 ± 0.91/+1.35 ± 0.92 | +1.35 ± 0.73/+1.49 ± 0.74 | 0.66/0.43 |
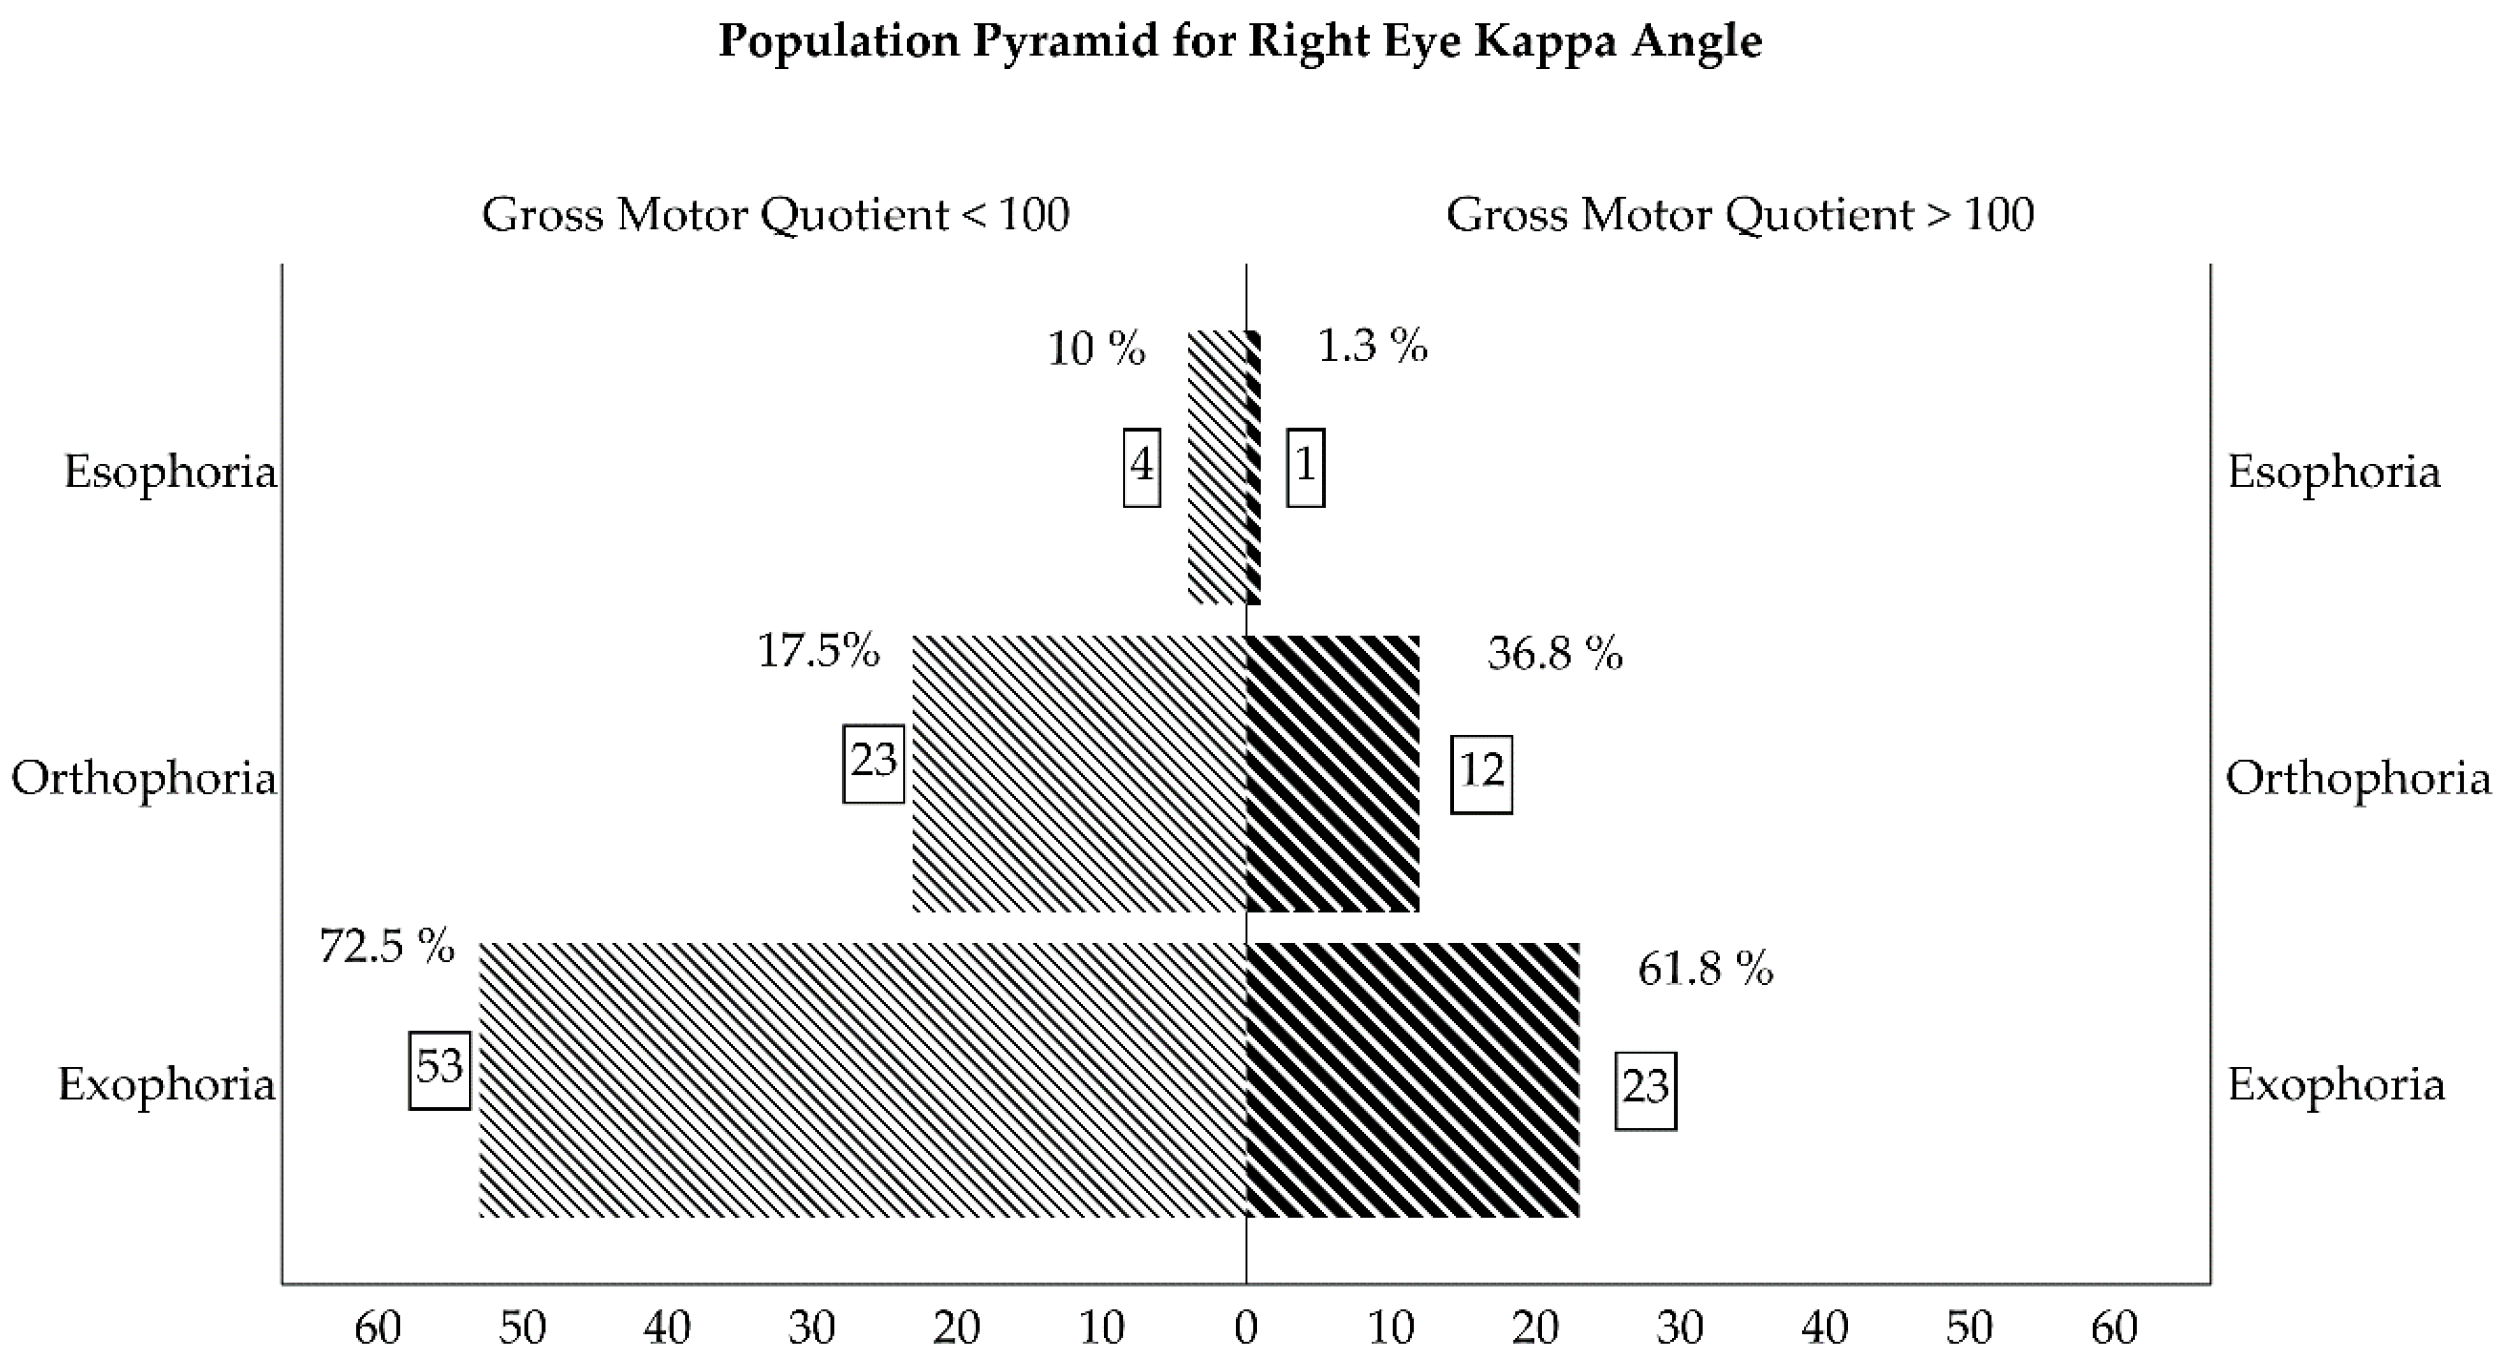
| Kappa Angle (RE) (Negative/0/Positive) | 4 (10%) 7 (17.5%) 29 (72.5%) | 1 (1.3%) 28 (36.8%) 47 (61.8%) | 0.01 |
| Kappa Angle (LE) (Negative/0/Positive) | 4 (10%) 8 (20%) 28 (70%) | 2 (2.26%) 26 (34.3%) 48 (63.2%) | 0.09 |
| Hirschberg Reflex (RE) (Temporal/Centered/Nasal) | 3 (7.7%) 7 (17.95) 29 (74.4%) | 1 (1.3%) 30 (39.5%) 45 (59.2%) | 0.02 |
| Hirschberg Reflex (LE) (Temporal/Centered/Nasal) | 3 (7.9%) 8 (21.1%) 27 (71.1%) | 2 (2.6%) 30 (39.5%) 44 (57.9%) | 0.08 |
| Krismky Test (Normal/Deviated) | 70 (87.5%) 10 (12.5%) | 36 (100%) 0 (0%) | 0.02 |
| NPC (centimeter, cm) | 2.46 ± 4.07 | 1.00 ± 2.02 | 0.01 |
| Base-Out 6∆ Prism Test (prism diopters, ∆) (Negative/Positive) | 27 (33.8%) 53 (66.3%) | 16 (44.4%) 20 (55.6%) | 0.27 |
| Base-In 6∆ Prism Test (prism, diopters, ∆ (Negative/Positive) | 60 (75%) 20 (25%) | 26 (72.2%) 10 (27.8%) | 0.75 |
| Stereopsis Lang Test (Second arc) (Negative, 550”, 600” and 1200”) | 303.89 ± 143.67 | 282.35 ± 131.35 | 0.45 |
| Bruckner Test (Normal/Deviated) | 71 (88.8%) 9 (11.3%) | 36 (100%) 0 (0%) | 0.03 |
| Fixation Test (Passed/Not passed) | 64 (80%) 16 (20%) | 26 (72.2%) 10 (27.8%) | 0.35 |
| Accuracy (Tracking Movements) (Smooth/Loss/Jumps/Continuous Loss) | 22(27.5%)/33(41.3%) 20(25%)/5(6.3%) | 12(33.3%)/12 (33.3%) 7(19.4%)/5(13.9%) | 0.44 |
| Head (Tracking Movements) (Motionless/Slight/Medium/Strong) | 12(15%)/32(40%) 24(30%)/12 (15%) | 5(13.9%)/17(47.2%) 8(22.2%)/6(16.7%) | 0.82 |
| Reflection (Saccades Movements) (Negative/Positive) | 46 (57.5%) 34 (42.5%) | 21 (58.3%) 15 (41.0%) | 0.31 |
| Head (Saccades Movements) (Motionless/Slight/Medium/Strong) | 12(15%)/33(41.3%) 24(30%)/11(13.85) | 3(8.3%)/21(58.3%) 6(16.7%)/6(16.7) | 0.23 |
© 2020 by the authors. Licensee MDPI, Basel, Switzerland. This article is an open access article distributed under the terms and conditions of the Creative Commons Attribution (CC BY) license (http://creativecommons.org/licenses/by/4.0/).
Share and Cite
Pinero-Pinto, E.; Pérez-Cabezas, V.; De-Hita-Cantalejo, C.; Ruiz-Molinero, C.; Gutiérrez-Sánchez, E.; Jiménez-Rejano, J.-J.; Sánchez-González, J.-M.; Sánchez-González, M.C. Vision Development Differences between Slow and Fast Motor Development in Typical Developing Toddlers: A Cross-Sectional Study. Int. J. Environ. Res. Public Health 2020, 17, 3597. https://doi.org/10.3390/ijerph17103597
Pinero-Pinto E, Pérez-Cabezas V, De-Hita-Cantalejo C, Ruiz-Molinero C, Gutiérrez-Sánchez E, Jiménez-Rejano J-J, Sánchez-González J-M, Sánchez-González MC. Vision Development Differences between Slow and Fast Motor Development in Typical Developing Toddlers: A Cross-Sectional Study. International Journal of Environmental Research and Public Health. 2020; 17(10):3597. https://doi.org/10.3390/ijerph17103597
Chicago/Turabian StylePinero-Pinto, Elena, Verónica Pérez-Cabezas, Concepción De-Hita-Cantalejo, Carmen Ruiz-Molinero, Estanislao Gutiérrez-Sánchez, José-Jesús Jiménez-Rejano, José-María Sánchez-González, and María Carmen Sánchez-González. 2020. "Vision Development Differences between Slow and Fast Motor Development in Typical Developing Toddlers: A Cross-Sectional Study" International Journal of Environmental Research and Public Health 17, no. 10: 3597. https://doi.org/10.3390/ijerph17103597
APA StylePinero-Pinto, E., Pérez-Cabezas, V., De-Hita-Cantalejo, C., Ruiz-Molinero, C., Gutiérrez-Sánchez, E., Jiménez-Rejano, J.-J., Sánchez-González, J.-M., & Sánchez-González, M. C. (2020). Vision Development Differences between Slow and Fast Motor Development in Typical Developing Toddlers: A Cross-Sectional Study. International Journal of Environmental Research and Public Health, 17(10), 3597. https://doi.org/10.3390/ijerph17103597