Youth Engaged Participatory Air Monitoring: A ‘Day in the Life’ in Urban Environmental Justice Communities


Abstract
1. Introduction
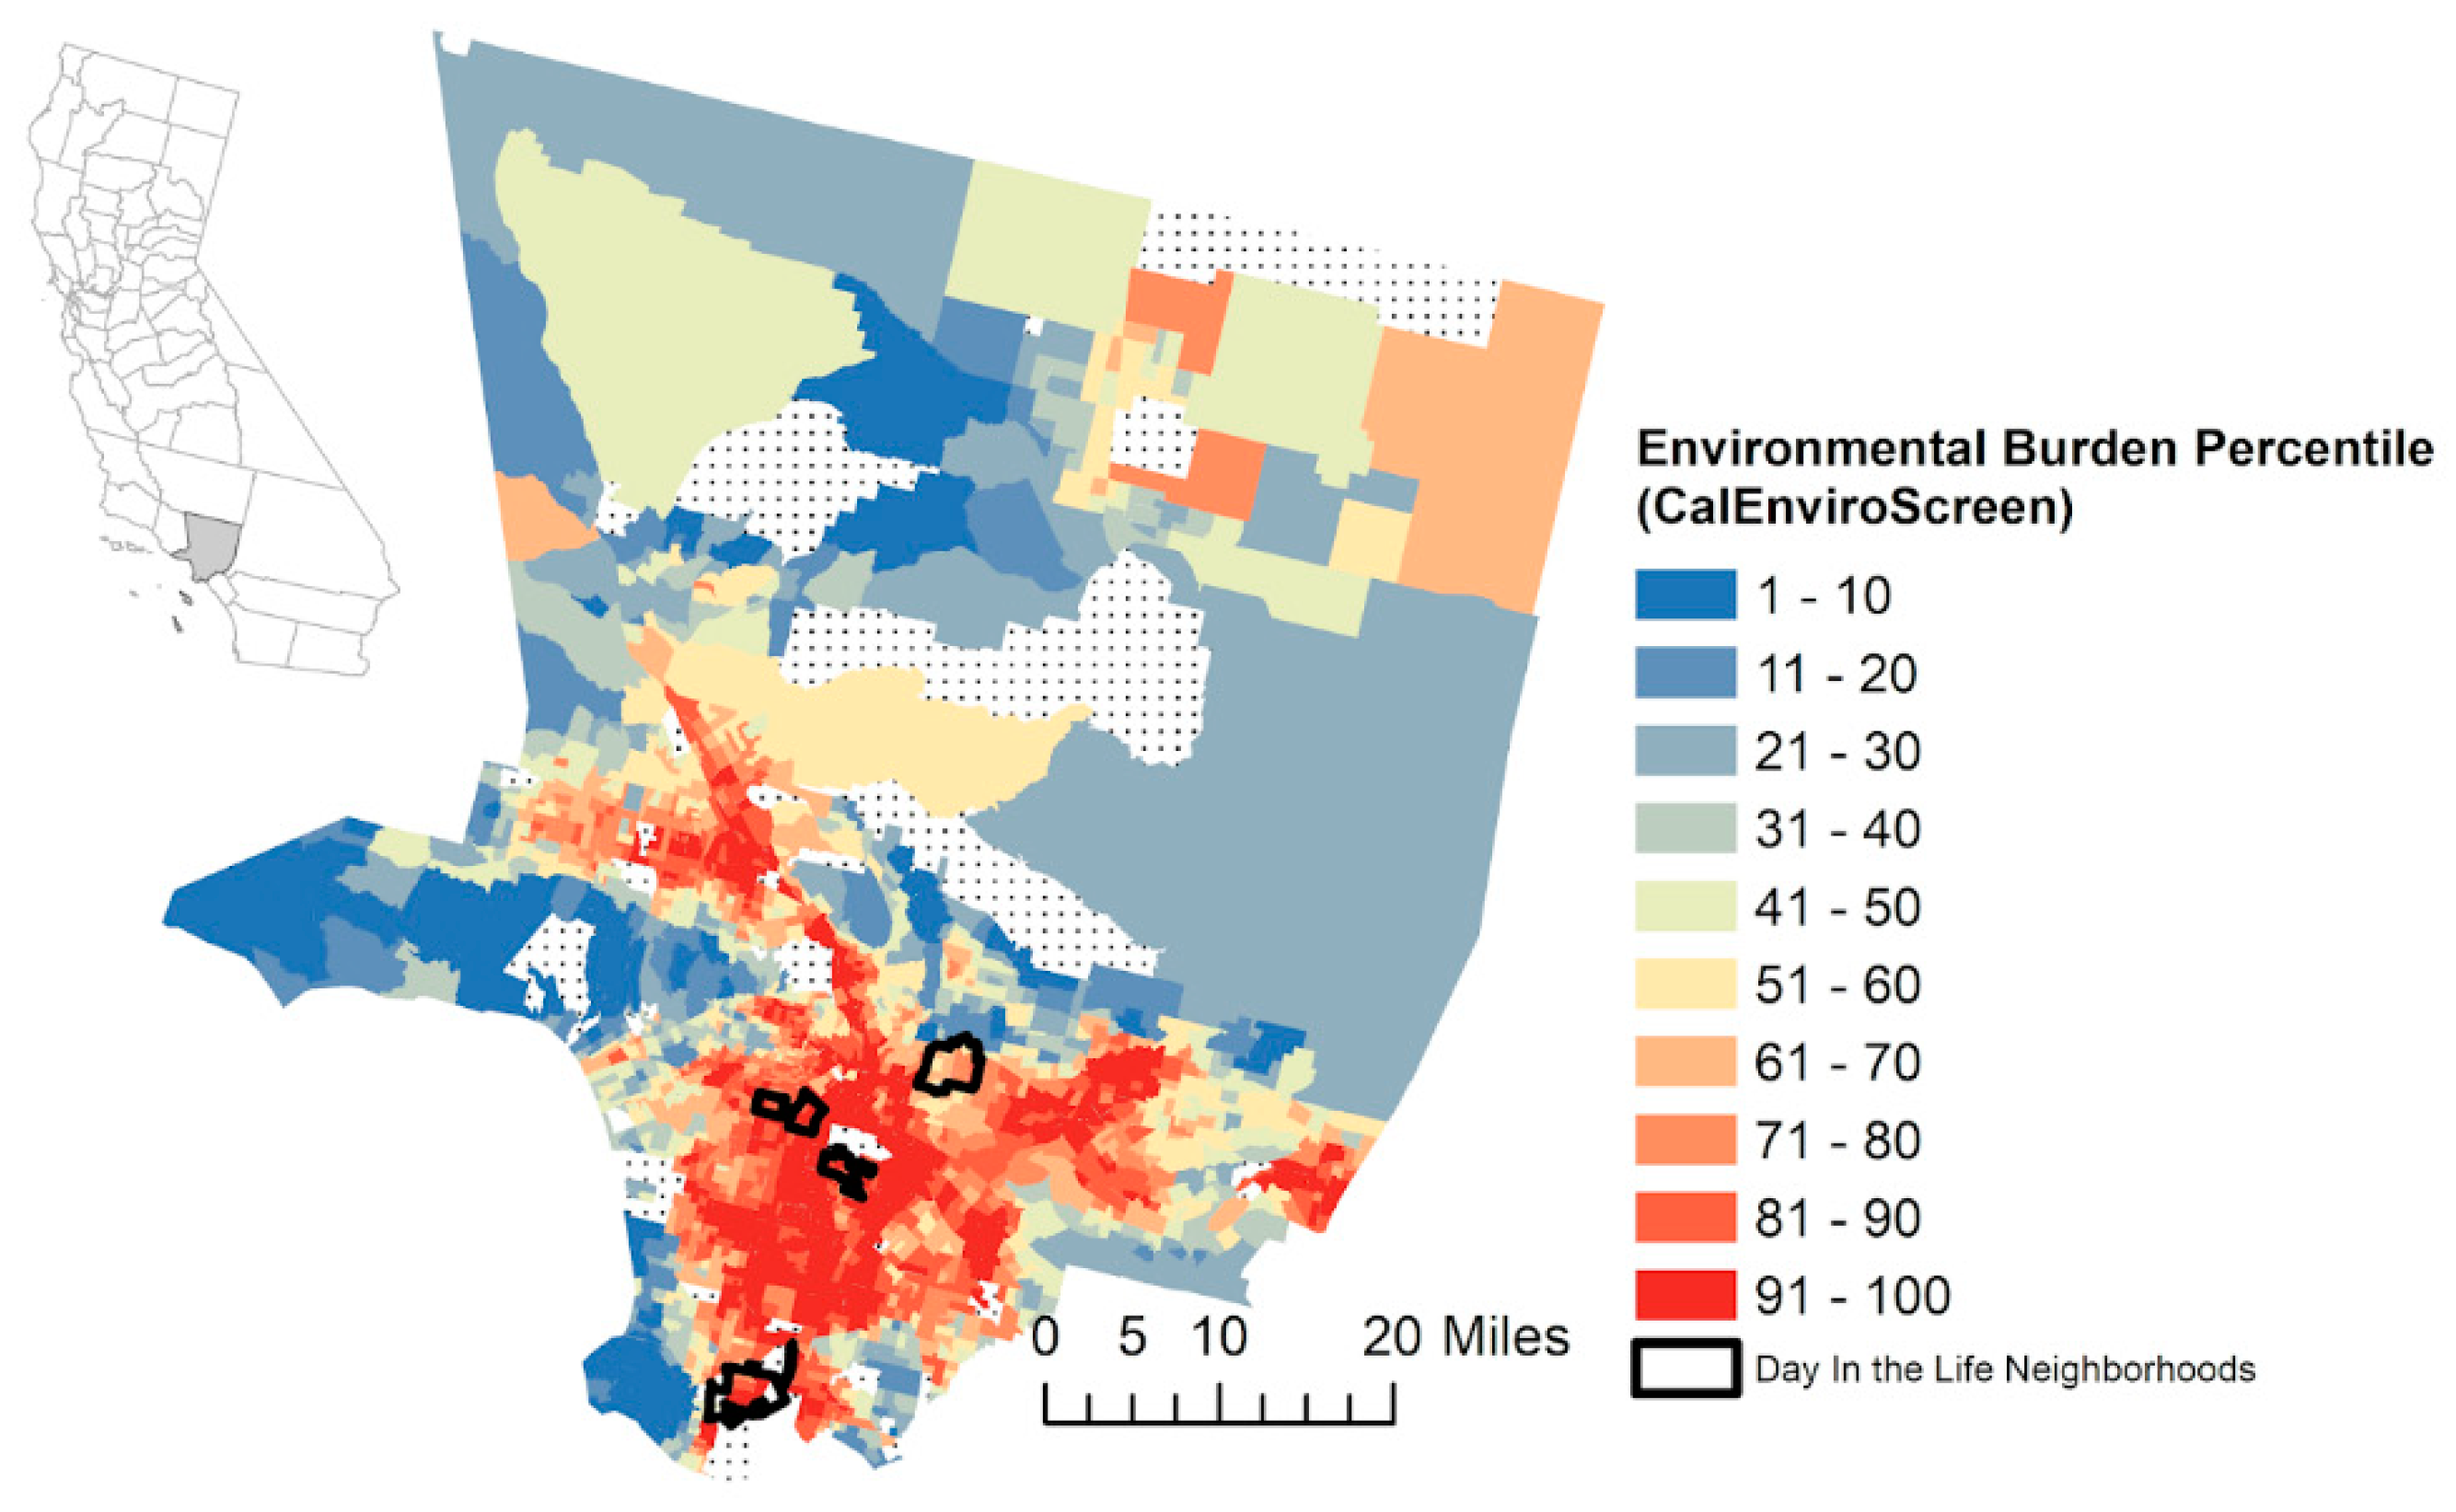
2. Materials and Methods
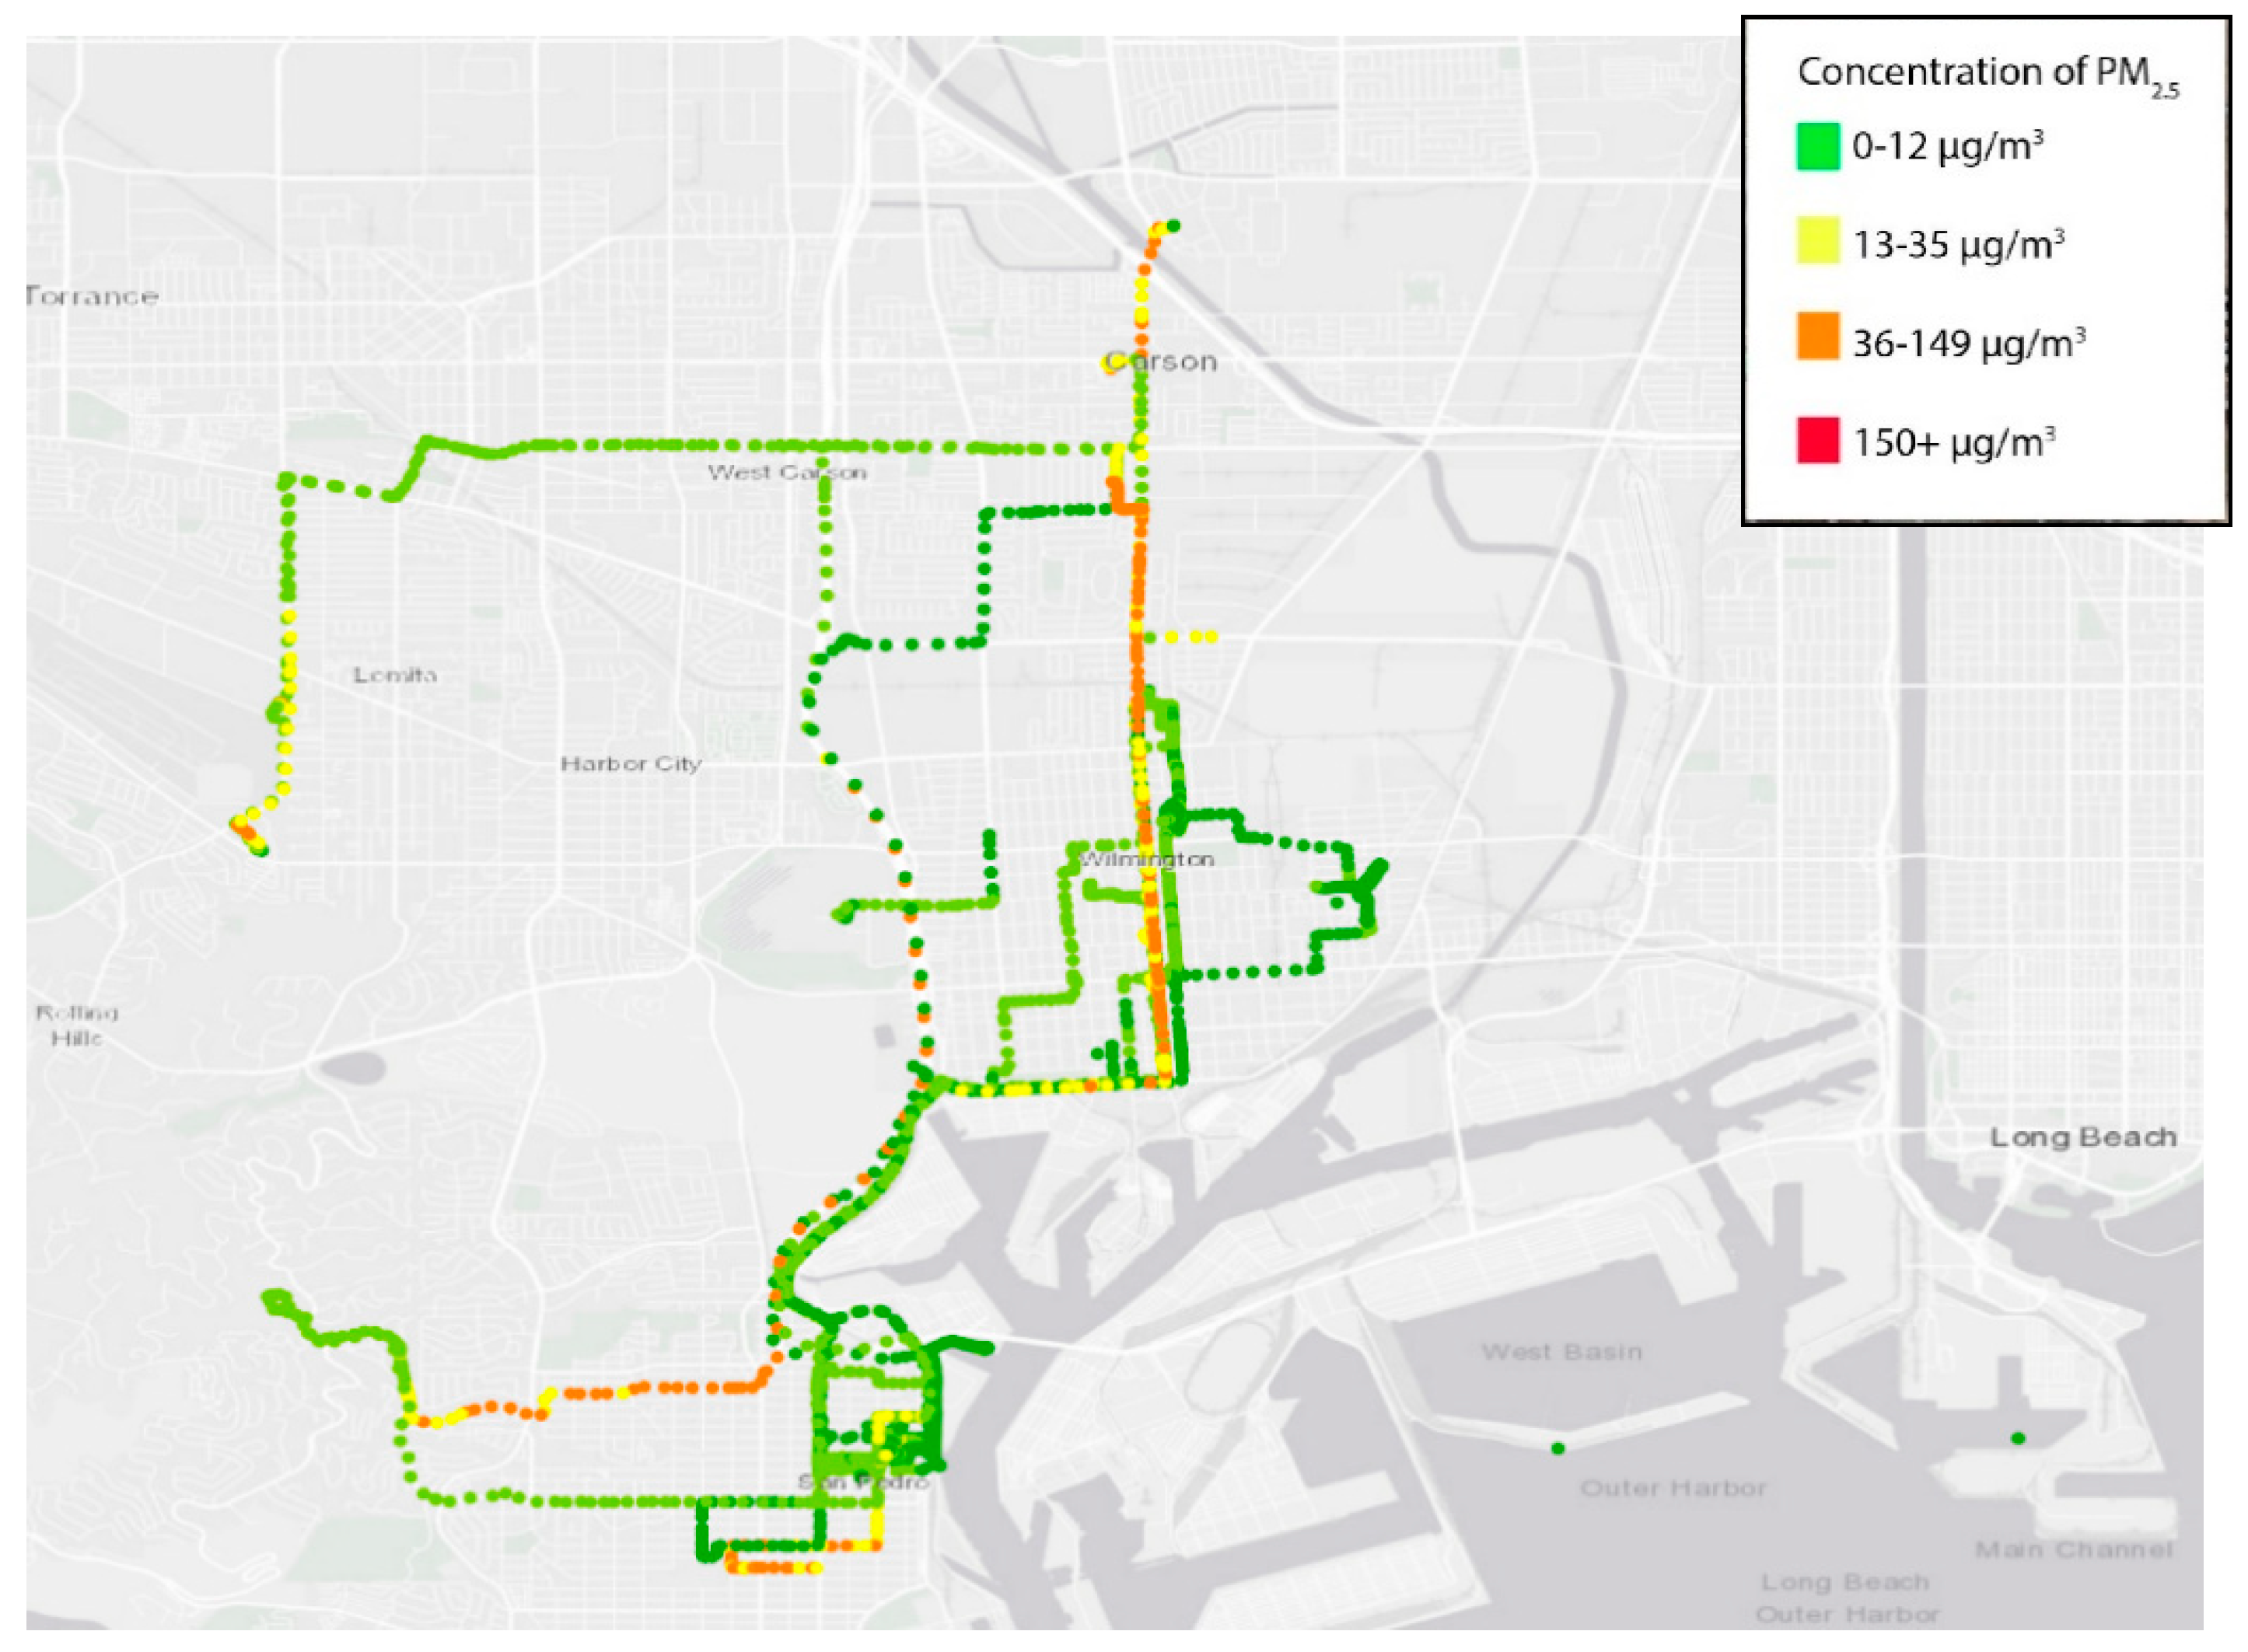
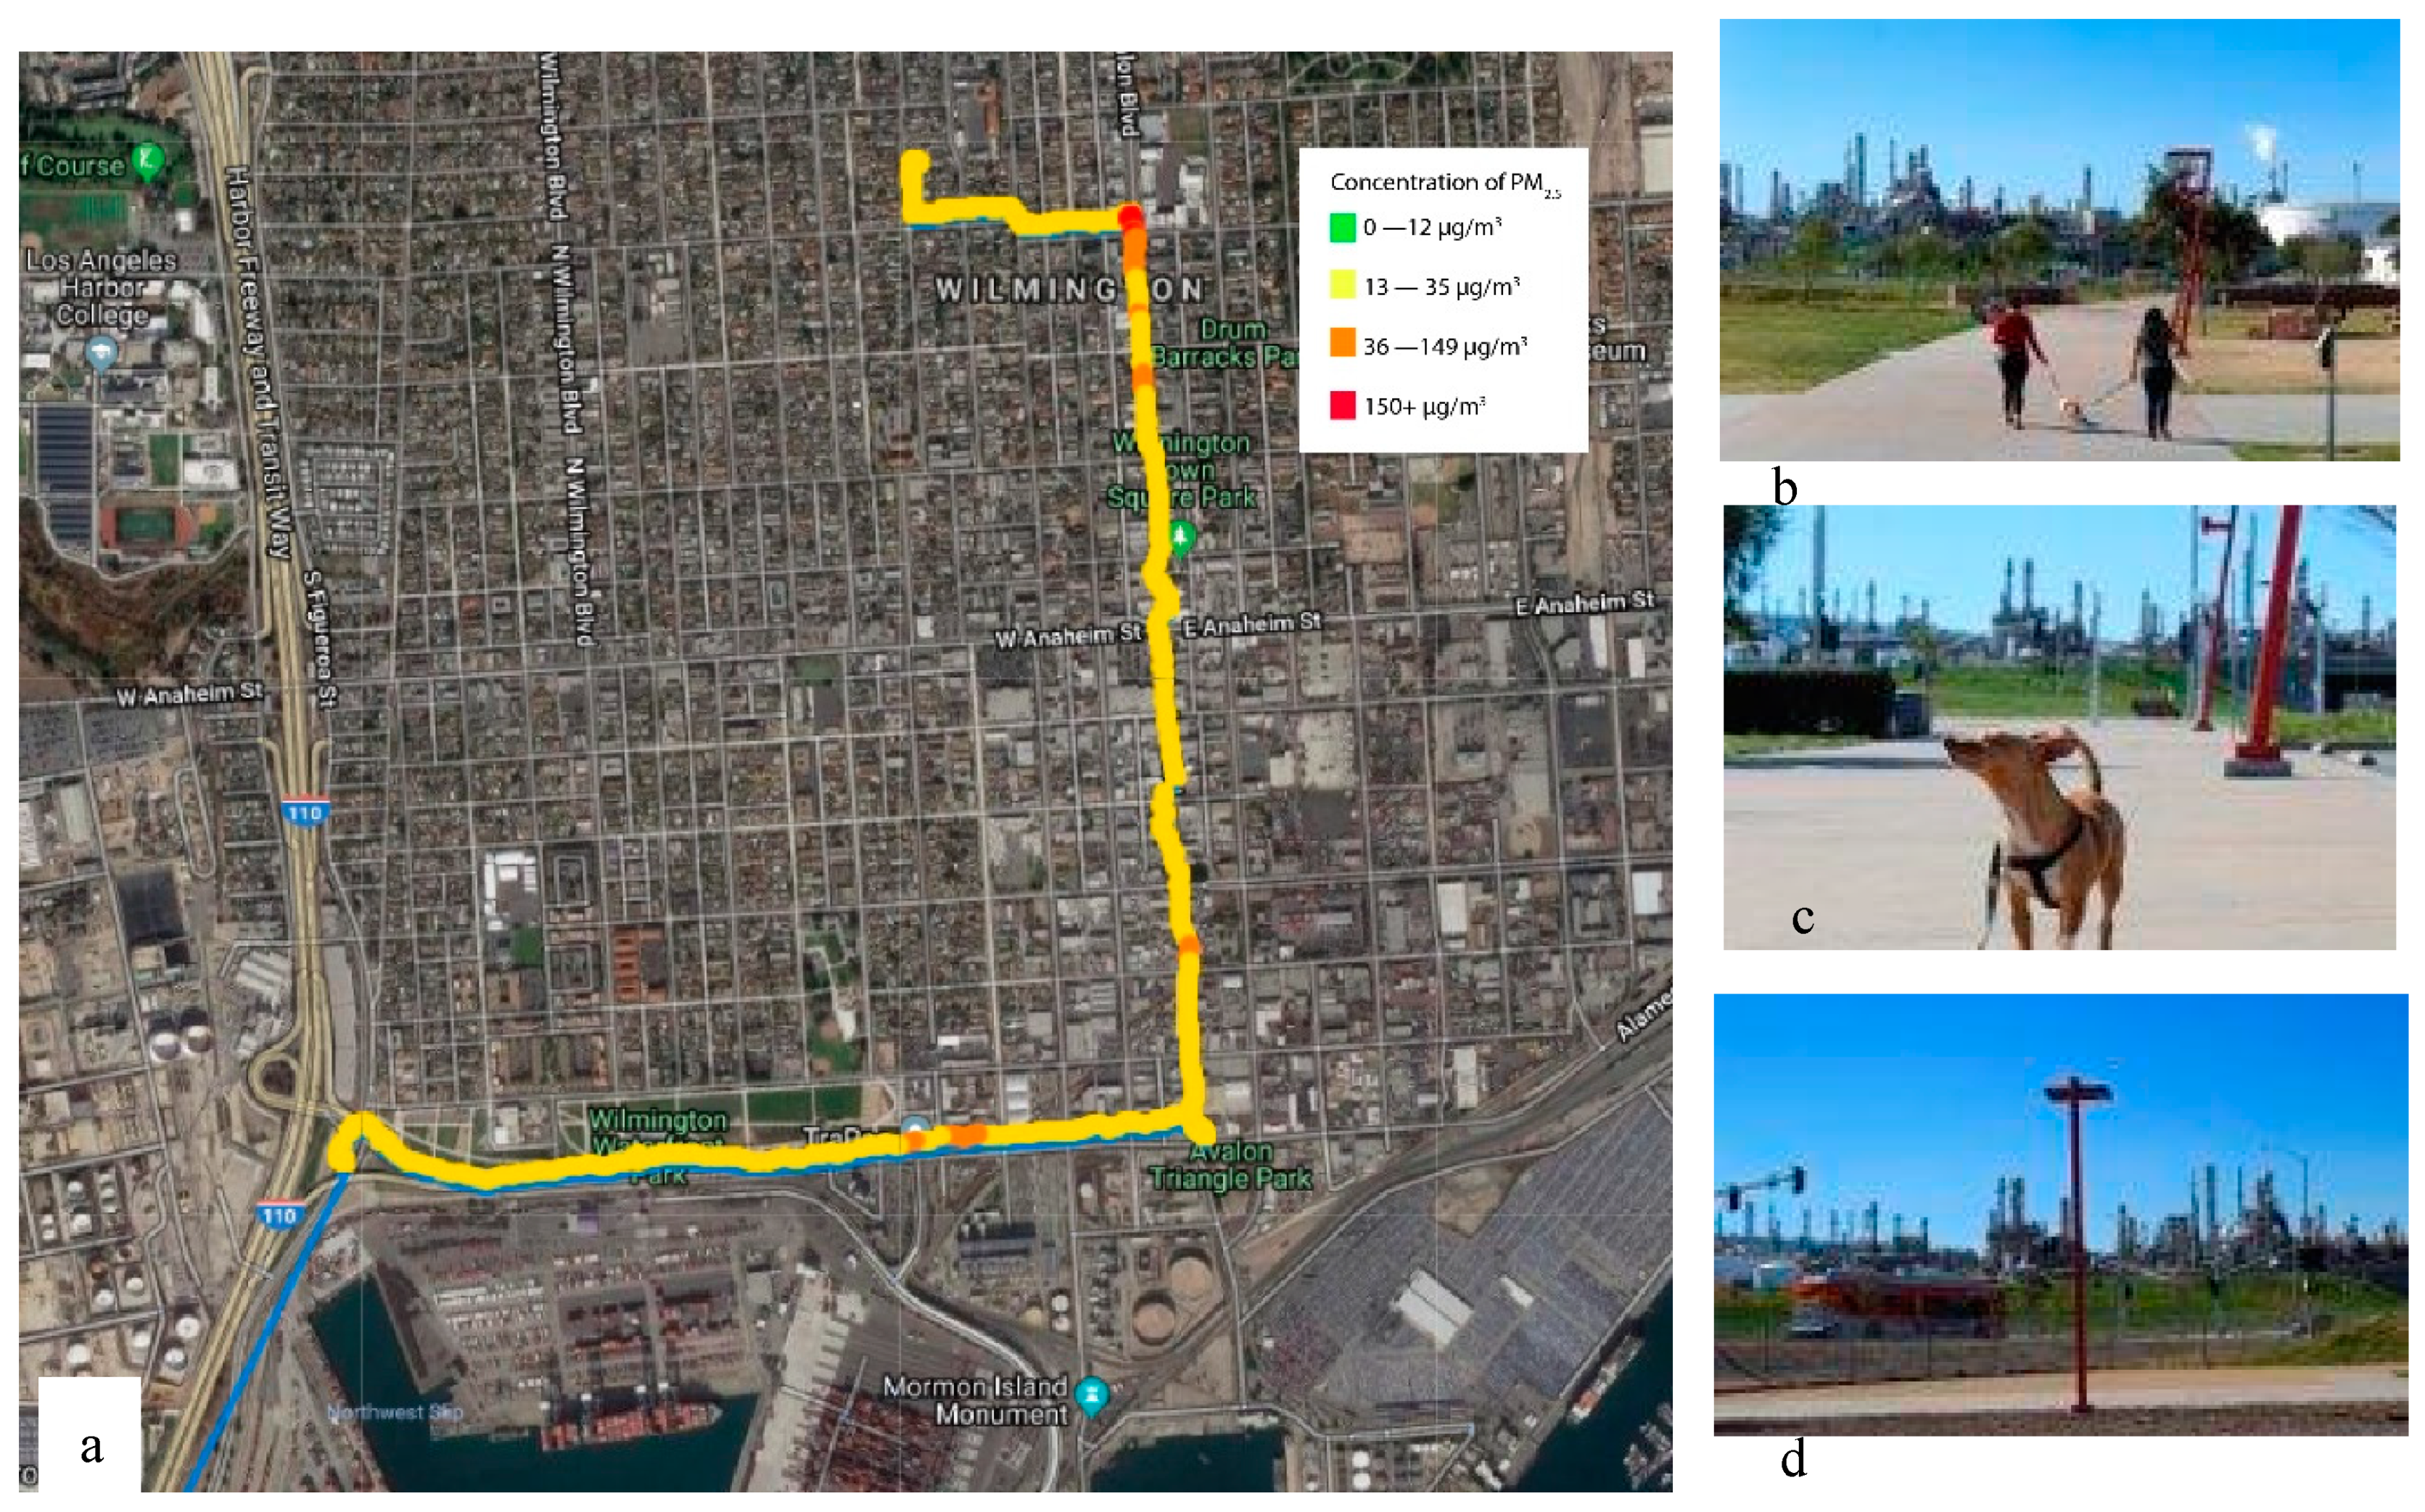
3. Results
3.1. Participants
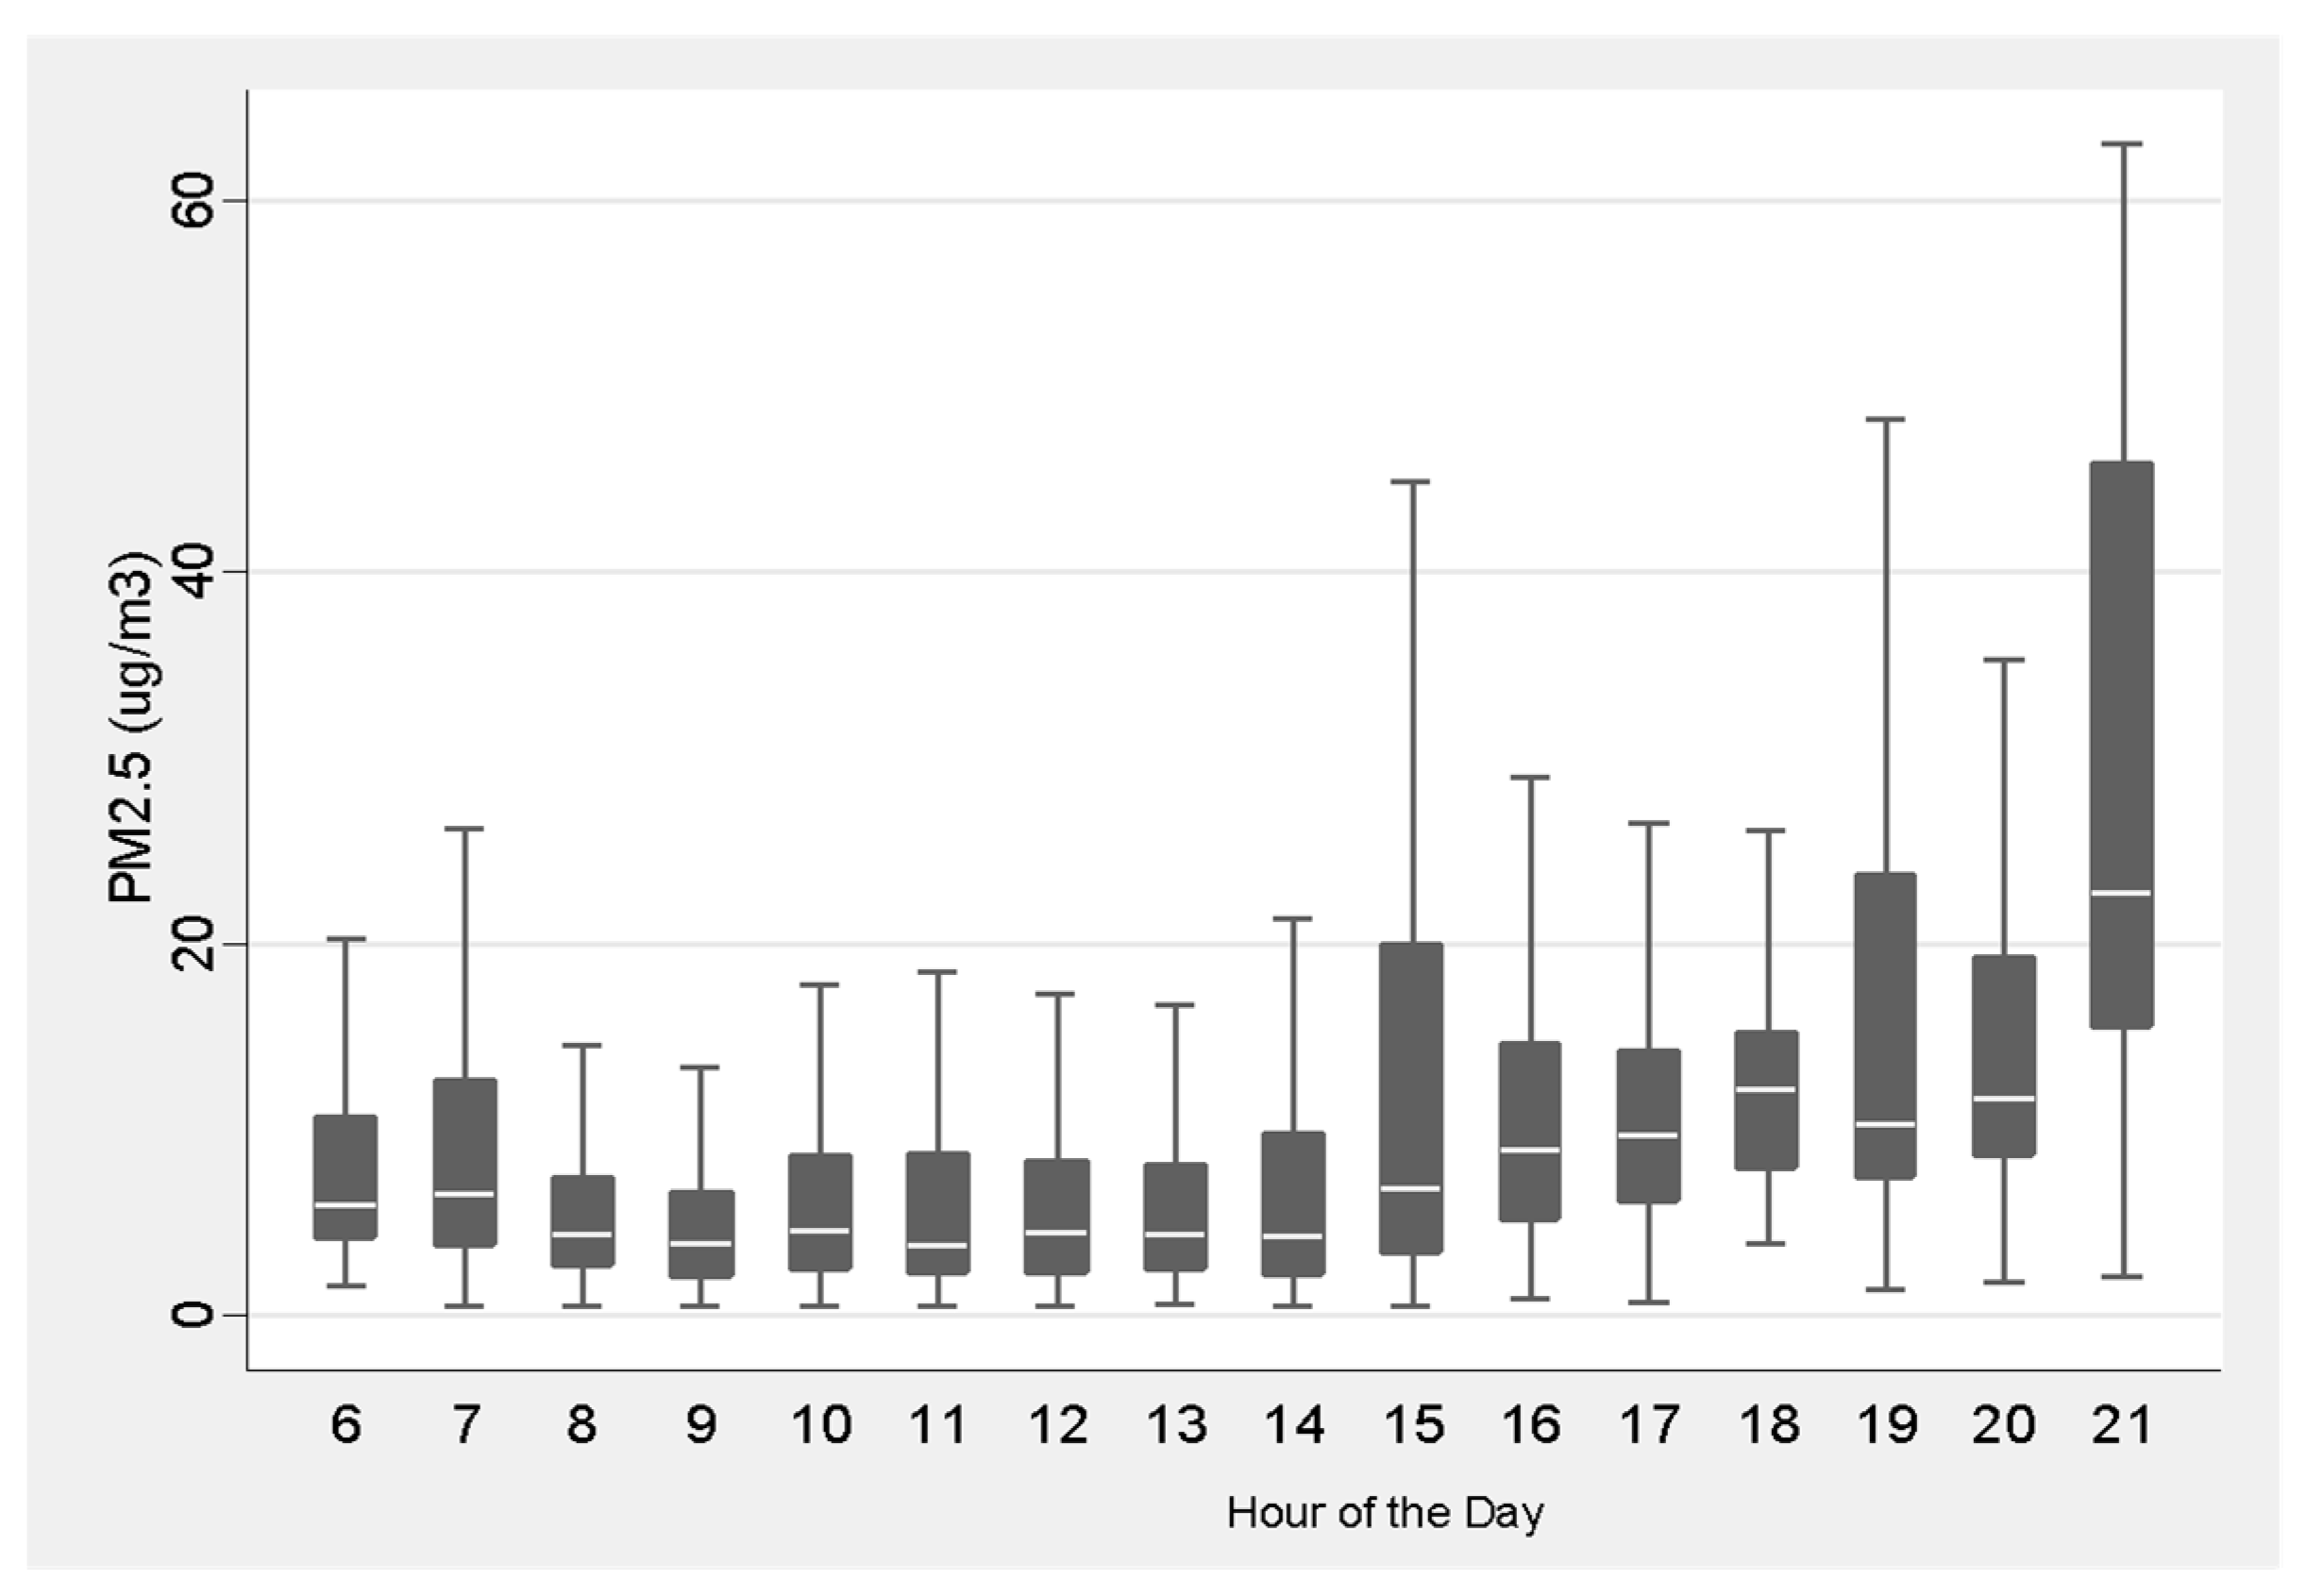
3.2. Air Monitoring Results
4. Discussion
5. Conclusions
Author Contributions
Funding
Acknowledgments
Conflicts of Interest
References
- Landrigan, P.J.; Fuller, R.; Acosta, N.J.; Adeyi, O.; Arnold, R.; Baldé, A.B.; Bertollini, R.; Bose-O’Reilly, S.; Boufford, J.I.; Breysse, P.N. The Lancet Commission on pollution and health. Lancet 2018, 391, 462–512. [Google Scholar] [CrossRef]
- Delfino, R.J.; Gong, H., Jr.; Linn, W.S.; Pellizzari, E.D.; Hu, Y. Asthma symptoms in Hispanic children and daily ambient exposures to toxic and criteria air pollutants. Environ. Health Perspect. 2003, 111, 647–656. [Google Scholar] [CrossRef] [PubMed]
- Gauderman, W.J.; Urman, R.; Avol, E.; Berhane, K.; McConnell, R.; Rappaport, E.; Chang, R.; Lurmann, F.; Gilliland, F. Association of improved air quality with lung development in children. N. Engl. J. Med. 2015, 372, 905–913. [Google Scholar] [CrossRef] [PubMed]
- Gauderman, W.J.; Vora, H.; McConnell, R.; Berhane, K.; Gilliland, F.; Thomas, D.; Lurmann, F.; Avol, E.; Kunzli, N.; Jerrett, M.; et al. Effect of exposure to traffic on lung development from 10 to 18 years of age: A cohort study. Lancet 2007, 369, 571–577. [Google Scholar] [CrossRef]
- Howe, C.G.; Eckel, S.P.; Habre, R.; Girguis, M.S.; Gao, L.; Lurmann, F.W.; Gilliland, F.D.; Breton, C.V. Association of Prenatal Exposure to Ambient and Traffic-Related Air Pollution With Newborn Thyroid Function: Findings From the Children’s Health Study. JAMA Netw. Open 2018, 1, e182172. [Google Scholar] [CrossRef] [PubMed]
- Wu, J.; Ren, C.; Delfino, R.J.; Chung, J.; Wilhelm, M.; Ritz, B. Association between Local Traffic-Generated Air Pollution and Preeclampsia and Preterm Delivery in the South Coast Air Basin of California. Environ. Health Perspect. 2009, 117, 1773–1779. [Google Scholar] [CrossRef]
- McConnell, R.; Berhane, K.; Yao, L.; Jerrett, M.; Lurmann, F.; Gilliland, F.; Künzli, N.; Gauderman, J.; Avol, E.; Thomas, D.; et al. Traffic, Susceptibility, and Childhood Asthma. Environ. Health Perspect. 2006, 114, 766–772. [Google Scholar] [CrossRef]
- Gan, W.Q.; Koehoorn, M.; Davies, H.W.; Demers, P.A.; Tamburic, L.; Brauer, M. Long-Term Exposure to Traffic-Related Air Pollution and the Risk of Coronary Heart Disease Hospitalization and Mortality. Environ. Health Perspect. 2010, 119, 501–507. [Google Scholar] [CrossRef]
- Hasheminassab, S.; Daher, N.; Saffari, A.; Wang, D.; Ostro, B.; Sioutas, C. Spatial and temporal variability of sources of ambient fine particulate matter (PM 2.5) in California. Atmos. Chem. Phys. 2014, 14, 12085–12097. [Google Scholar] [CrossRef]
- Lurmann, F.; Avol, E.; Gilliland, F. Emissions reduction policies and recent trends in Southern California’s ambient air quality. J. Air Waste Manag. Assoc. 2015, 65, 324–335. [Google Scholar] [CrossRef]
- Trasande, L.; Thurston, G.D. The role of air pollution in asthma and other pediatric morbidities. J. Allergy Clin. Immunol. 2005, 115, 689–699. [Google Scholar] [CrossRef] [PubMed]
- Garcia, E.; Berhane, K.T.; Islam, T.; McConnell, R.; Urman, R.; Chen, Z.; Gilliland, F.D. Association of changes in air quality with incident asthma in children in California, 1993–2014. JAMA 2019, 321, 1906–1915. [Google Scholar] [CrossRef] [PubMed]
- Bateson, T.F.; Schwartz, J. Children’s response to air pollutants. J. Toxicol. Environ. Heal. A 2007, 71, 238–243. [Google Scholar] [CrossRef] [PubMed]
- Perera, F.P. Multiple threats to child health from fossil fuel combustion: Impacts of air pollution and climate change. Environ. Health Perspect. 2016, 125, 141–148. [Google Scholar] [CrossRef] [PubMed]
- Mikati, I.; Benson, A.F.; Luben, T.J.; Sacks, J.D.; Richmond-Bryant, J. Disparities in distribution of particulate matter emission sources by race and poverty status. Am. J. Public Health 2018, 108, 480–485. [Google Scholar] [CrossRef] [PubMed]
- Brulle, R.J.; Pellow, D.N. Environmental justice: Human health and environmental inequalities. Public Health 2006, 27, 103–124. [Google Scholar] [CrossRef]
- Wing, S.; Horton, R.A.; Muhammad, N.; Grant, G.R.; Tajik, M.; Thu, K. Integrating epidemiology, education, and organizing for environmental justice: Community health effects of industrial hog operations. Am. J. Public Health 2008, 98, 1390–1397. [Google Scholar] [CrossRef]
- Scammell, M.K.; Senier, L.; Darrah-Okike, J.; Brown, P.; Santos, S. Tangible evidence, trust and power: Public perceptions of community environmental health studies. Soc. Sci. Med. 2009, 68, 143–153. [Google Scholar] [CrossRef]
- Johnston, J.E.; Kramer, A.J.; MacDonald Gibson, J. Community Perspectives on the Risk of Indoor Air Pollution Arising from Contaminated Groundwater. New Solut. A J. Environ. Occup. Health Policy 2015, 25, 59–77. [Google Scholar] [CrossRef]
- Bullard, R.D. Dumping in Dixie: Race, Class, and Environmental Quality; Westview Press: Boulder, CO, USA, 2000; Volume 3. [Google Scholar]
- Fals-Borda, O.; Rahman, M.A. Action and Knowledge: Breaking the Monopoly with Participatory Action-Research; Apex Press: New York, NY, USA, 1991. [Google Scholar]
- Corburn, J. Street Science: Community Knowledge and Environmental Health Justice; MIT Press: Cambridge, MA, USA, 2005. [Google Scholar]
- English, P.B.; Richardson, M.J.; Garzon-Galvis, C. From Crowdsourcing to Extreme Citizen Science: Participatory Research for Environmental Health. Annu. Rev. Public Health 2018, 39, 335–350. [Google Scholar] [CrossRef]
- Shepard, P.M. Advancing environmental justice through community-based participatory research. Environ. Health Perspect. 2002, 110, 139. [Google Scholar] [CrossRef]
- Conrad, C.C.; Hilchey, K.G. A review of citizen science and community-based environmental monitoring: Issues and opportunities. Environ. Monit. Assess. 2011, 176, 273–291. [Google Scholar] [CrossRef] [PubMed]
- Snyder, E.G.; Watkins, T.H.; Solomon, P.A.; Thoma, E.D.; Williams, R.W.; Hagler, G.S.W.; Shelow, D.; Hindin, D.A.; Kilaru, V.J.; Preuss, P.W. The Changing Paradigm of Air Pollution Monitoring. Environ. Sci. Technol. 2013, 47, 11369–11377. [Google Scholar] [CrossRef] [PubMed]
- Jerrett, M.; Arain, A.; Kanaroglou, P.; Beckerman, B.; Potoglou, D.; Sahsuvaroglu, T.; Morrison, J.; Giovis, C. A review and evaluation of intraurban air pollution exposure models. J. Expo. Sci. Environ. Epidemiol. 2005, 15, 185. [Google Scholar] [CrossRef]
- Clements, A.L.; Griswold, W.G.; Johnston, J.E.; Herting, M.M.; Thorson, J.; Collier-Oxandale, A.; Hannigan, M. Low-Cost Air Quality Monitoring Tools: From Research to Practice (A Workshop Summary). Sensors 2017, 17, 2478. [Google Scholar]
- Zusman, M.; Schumacher, C.S.; Gassett, A.J.; Spalt, E.W.; Austin, E.; Larson, T.V.; Carvlin, G.; Seto, E.; Kaufman, J.D.; Sheppard, L. Calibration of low-cost particulate matter sensors: Model development for a multi-city epidemiological study. Environ. Int. 2020, 134, 105329. [Google Scholar] [CrossRef]
- De Nazelle, A.; Seto, E.; Donaire-Gonzalez, D.; Mendez, M.; Matamala, J.; Nieuwenhuijsen, M.J.; Jerrett, M. Improving estimates of air pollution exposure through ubiquitous sensing technologies. Environ. Pollut. 2013, 176, 92–99. [Google Scholar] [CrossRef]
- Lim, C.C.; Kim, H.; Vilcassim, M.J.R.; Thurston, G.D.; Gordon, T.; Chen, L.-C.; Lee, K.; Heimbinder, M.; Kim, S.-Y. Mapping urban air quality using mobile sampling with low-cost sensors and machine learning in Seoul, South Korea. Environ. Int. 2019, 131, 105022. [Google Scholar] [CrossRef]
- Apparicio, P.; Carrier, M.; Gelb, J.; Séguin, A.-M.; Kingham, S. Cyclists’ exposure to air pollution and road traffic noise in central city neighbourhoods of Montreal. J. Transp. Geogr. 2016, 57, 63–69. [Google Scholar]
- Steinle, S.; Reis, S.; Sabel, C.E.; Semple, S.; Twigg, M.M.; Braban, C.F.; Leeson, S.R.; Heal, M.R.; Harrison, D.; Lin, C. Personal exposure monitoring of PM2. 5 in indoor and outdoor microenvironments. Sci. Total Environ. 2015, 508, 383–394. [Google Scholar]
- Sloan, C.D.; Philipp, T.J.; Bradshaw, R.K.; Chronister, S.; Barber, W.B.; Johnston, J.D. Applications of GPS-tracked personal and fixed-location PM2.5 continuous exposure monitoring. J. Air Waste Manag. Assoc. 2016, 66, 53–65. [Google Scholar] [CrossRef] [PubMed]
- Hubbell, B.J.; Kaufman, A.; Rivers, L.; Schulte, K.; Hagler, G.; Clougherty, J.; Cascio, W.; Costa, D. Understanding social and behavioral drivers and impacts of air quality sensor use. Sci. Total Environ. 2018, 621, 886–894. [Google Scholar] [CrossRef] [PubMed]
- Morello-Frosch, R.; Pastor, M., Jr.; Porras, C.; Sadd, J. Environmental justice and regional inequality in southern California: Implications for future research. Environ. Health Perspect. 2002, 110, 149–154. [Google Scholar] [CrossRef] [PubMed]
- Gunier, R.B.; Hertz, A.; Von Behren, J.; Reynolds, P. Traffic density in California: Socioeconomic and ethnic differences among potentially exposed children. J. Expo. Sci. Environ. Epidemiol. 2003, 13, 240. [Google Scholar] [CrossRef]
- McConnell, R.; Berhane, K.; Gilliland, F.; London, S.J.; Islam, T.; Gauderman, W.J.; Avol, E.; Margolis, H.G.; Peters, J.M. Asthma in exercising children exposed to ozone: A cohort study. Lancet 2002, 359, 386–391. [Google Scholar] [CrossRef]
- Gauderman, W.J.; Avol, E.; Gilliland, F.; Vora, H.; Thomas, D.; Berhane, K.; McConnell, R.; Kuenzli, N.; Lurmann, F.; Rappaport, E.; et al. The Effect of Air Pollution on Lung Development from 10 to 18 Years of Age. N. Engl. J. Med. 2004, 351, 1567–1576. [Google Scholar] [CrossRef]
- Jerrett, M.; McConnell, R.; Wolch, J.; Chang, R.; Lam, C.; Dunton, G.; Gilliland, F.; Lurmann, F.; Islam, T.; Berhane, K. Traffic-related air pollution and obesity formation in children: A longitudinal, multilevel analysis. Environ. Health 2014, 13, 49. [Google Scholar] [CrossRef]
- Brandt, S.J.; Perez, L.; Kunzli, N.; Lurmann, F.; McConnell, R. Costs of childhood asthma due to traffic-related pollution in two California communities. Eur. Respir. J. 2012, 40, 363–370. [Google Scholar] [CrossRef]
- Chen, Z.; Herting, M.M.; Chatzi, L.; Belcher, B.R.; Alderete, T.L.; McConnell, R.; Gilliland, F.D. Regional and traffic-related air pollutants are associated with higher consumption of fast food and trans fat among adolescents. Am. J. Clin. Nutr. 2018, 109, 99–108. [Google Scholar]
- Chakraborty, J.; Zandbergen, P.A. Children at risk: Measuring racial/ethnic disparities in potential exposure to air pollution at school and home. J. Epidemiol. Community Health 2007, 61, 1074. [Google Scholar] [CrossRef]
- Green, R.S.; Smorodinsky, S.; Kim, J.J.; McLaughlin, R.; Ostro, B. Proximity of California public schools to busy roads. Environ. Health Perspect. 2004, 112, 61–66. [Google Scholar] [CrossRef] [PubMed]
- Gaffron, P.; Niemeier, D. School locations and traffic emissions—Environmental (in) justice findings using a new screening method. Int. J. Environ. Res. Public Health 2015, 12, 2009–2025. [Google Scholar] [CrossRef] [PubMed]
- Mirabelli, M.C.; Wing, S.; Marshall, S.W.; Wilcosky, T.C. Race, poverty, and potential exposure of middle-school students to air emissions from confined swine feeding operations. Environ. Health Perspect. 2005, 114, 591–596. [Google Scholar] [CrossRef] [PubMed]
- Pastor, J.M.; Sadd, J.L.; Morello-Frosch, R. Who’s Minding the Kids? Pollucion, Public Schools, and Environmental Justice in Los Angeles. Soc. Sci. Q. 2002, 83, 263–280. [Google Scholar] [CrossRef]
- California Office of Environmental Health Hazard Assessment. California Communities Environmental Health Screening Tool; Version 3.0 (CalEnviroScreen 3.0); California Office of Environmental Health Hazard Assessment: Sacramento, CA, USA, 2018.
- Heimbinder, M.; Yap, R.; Lim, C.C. AirBeam Device Description. Available online: http://www.takingspace.org/aircasting/airbeam/ (accessed on 7 October 2019).
- Mazaheri, M.; Clifford, S.; Yeganeh, B.; Viana, M.; Rizza, V.; Flament, R.; Buonanno, G.; Morawska, L. Investigations into factors affecting personal exposure to particles in urban microenvironments using low-cost sensors. Environ. Int. 2018, 120, 496–504. [Google Scholar] [CrossRef]
- Vilcassim, M.R.; Thurston, G.D.; Chen, L.-C.; Lim, C.C.; Gordon, T. Exposure to Greater Air Pollution when Traveling Abroad is Associated with Decreased Lung Function. Am. J. Respir. Crit. Care Med. 2019, 199, 1570. [Google Scholar] [CrossRef]
- Mukherjee, A.; Stanton, L.G.; Graham, A.R.; Roberts, P.T. Assessing the Utility of Low-Cost Particulate Matter Sensors over a 12-Week Period in the Cuyama Valley of California. Sensors 2017, 17, 1805. [Google Scholar] [CrossRef]
- Jiao, W.; Hagler, G.; Williams, R.; Sharpe, R.; Brown, R.; Garver, D.; Judge, R.; Caudill, M.; Rickard, J.; Davis, M. Community Air Sensor Network (CAIRSENSE) project: Evaluation of low-cost sensor performance in a suburban environment in the southeastern United States. Atmos. Meas. Tech. 2016, 9, 5281–5292. [Google Scholar] [CrossRef]
- Sousan, S.; Koehler, K.; Hallett, L.; Peters, T.M. Evaluation of consumer monitors to measure particulate matter. J. Aerosol Sci. 2017, 107, 123–133. [Google Scholar] [CrossRef]
- Gutschow, W. Participatory Community Air Monitoring: Using AirBeams and Viewing Data on AirCasting.org. Available online: https://envhealthcenters.usc.edu/wp-content/uploads/2018/08/AirCasting_AirBeams_HowTo_USCEHC.pdf (accessed on 7 October 2019).
- Heimbinder, M.; Yap, R.; Lim, C.C. AirCasting.org Map. Available online: http://aircasting.org/fixed_map (accessed on 7 October 2019).
- Gutschow, W. A Day in the Life: A Community Science Air Monitoring Program. Available online: http://arcg.is/CXfen (accessed on 7 October 2019).
- Minkler, M.; Vásquez, V.B.; Tajik, M.; Petersen, D. Promoting environmental justice through community-based participatory research: The role of community and partnership capacity. Health Educ. Behav. Off. Publ. Soc. Public Health Educ. 2008, 35, 119–137. [Google Scholar] [CrossRef]
- Rickenbacker, H.; Brown, F.; Bilec, M. Creating environmental consciousness in underserved communities: Implementation and outcomes of community-based environmental justice and air pollution research. Sustain. Cities Soc. 2019, 47, 101473. [Google Scholar] [CrossRef]
- Wolff, M.; Maurana, C.A. Building effective community—Academic partnerships to improve health: A qualitative study of perspectives from communities. Acad. Med. 2001, 76, 166–172. [Google Scholar] [CrossRef] [PubMed]
- Finn, S.; O’Fallon, L. The Emergence of Environmental Health Literacy—From Its Roots to Its Future Potential. Environ. Health Perspect. 2017, 125, 495–501. [Google Scholar] [CrossRef]
- Madrigal, D.S.; Salvatore, A.; Casillas, G.; Casillas, C.; Vera, I.; Eskenazi, B.; Minkler, M. Health in my community: Conducting and evaluating PhotoVoice as a tool to promote environmental health and leadership among Latino/a youth. Prog. Community Health Partnersh. Res. Educ. Action 2014, 8, 317–329. [Google Scholar] [CrossRef]
- Peréa, F.C.; Sayles, N.R.; Reich, A.J.; Koomas, A.; McMann, H.; Sprague Martinez, L.S. “Mejorando Nuestras Oportunidades”: Engaging Urban Youth in Environmental Health Assessment and Advocacy to Improve Health and Outdoor Play Spaces. Int. J. Environ. Res. Public Health 2019, 16, 571. [Google Scholar] [CrossRef]
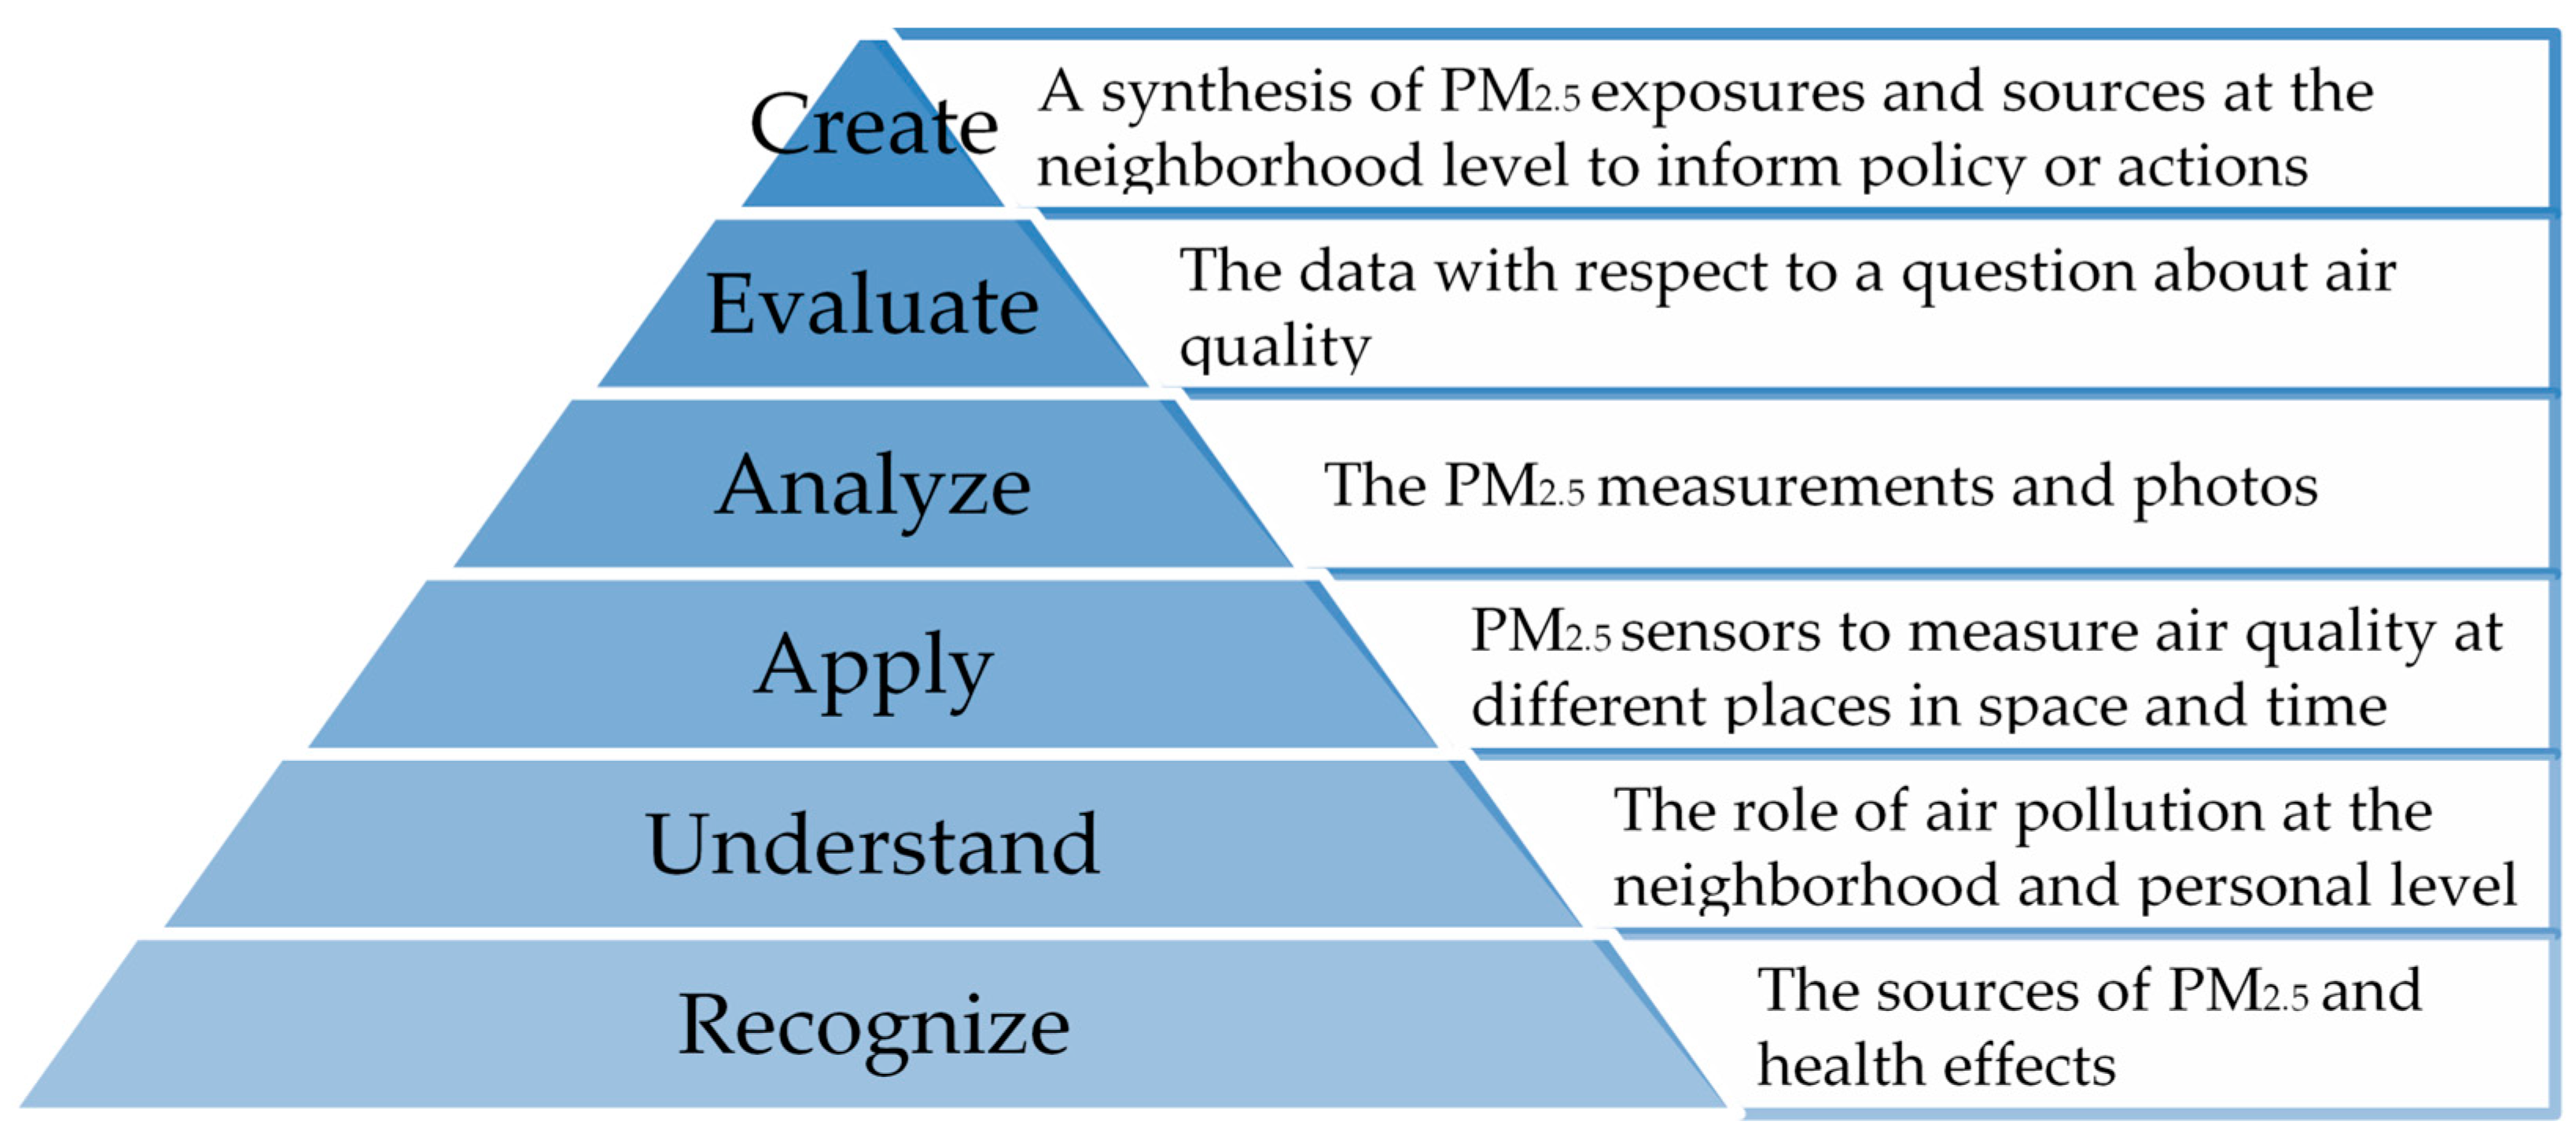
- Bloom, B.S. Taxonomy of educational objectives. Vol. 1: Cognitive domain. N. Y. Mckay 1956, 1, 20–24. [Google Scholar]
- Sadd, J.; Morello-Frosch, R.; Pastor, M.; Matsuoka, M.; Prichard, M.; Carter, V. The truth, the whole truth, and nothing but the ground-truth: Methods to advance environmental justice and researcher–community partnerships. Health Educ. Behav. 2014, 41, 281–290. [Google Scholar] [CrossRef]
- Feinberg, S.; Williams, R.; Hagler, G.S.; Rickard, J.; Brown, R.; Garver, D.; Harshfield, G.; Stauffer, P.; Mattson, E.; Judge, R. Long-term evaluation of air sensor technology under ambient conditions in Denver, Colorado. Atmos. Meas. Tech. 2018, 11, 4605–4615. [Google Scholar] [CrossRef]


| Youth * | Organization | Minutes | Mean PM2.5 (μg/m3) | Standard Deviation (μg/m3) | % of Time PM2.5 Exposure >12 μg/m3 ** | Minimum (μg/m3) | Maximum (μg/m3) |
|---|---|---|---|---|---|---|---|
| A | CBE | 7547 | 8.55 | 13.52 | 11.1 | 0.59 | 96.62 |
| B | SCYLC | 7677 | 8.25 | 7.64 | 17.1 | 0.77 | 92.36 |
| C | CBE | 8111 | 6.02 | 10.21 | 12.8 | 0.54 | 62.05 |
| D | CBE | 5686 | 8.00 | 9.08 | 19.3 | 0.61 | 110.09 |
| E | CBE | 15,002 | 17.97 | 33.43 | 33.2 | 0.55 | 186.85 |
| F | CBE | 7853 | 15.89 | 17.58 | 45.2 | 0.54 | 120.96 |
| G | PYA | 12,382 | 8.99 | 11.10 | 13.6 | 0.77 | 89.14 |
| H | CBE | 8779 | 7.23 | 9.75 | 10.2 | 0.74 | 114.99 |
| I | PYA | 14,748 | 13.10 | 21.83 | 22.9 | 0.98 | 128.82 |
| J | PYA | 6932 | 4.59 | 2.54 | 2.1 | 1.24 | 50.43 |
| All | 94,717 | 10.73 | 18.82 | 20.0 | 0.54 | 186.85 |
© 2019 by the authors. Licensee MDPI, Basel, Switzerland. This article is an open access article distributed under the terms and conditions of the Creative Commons Attribution (CC BY) license (http://creativecommons.org/licenses/by/4.0/).
Share and Cite
Johnston, J.E.; Juarez, Z.; Navarro, S.; Hernandez, A.; Gutschow, W. Youth Engaged Participatory Air Monitoring: A ‘Day in the Life’ in Urban Environmental Justice Communities. Int. J. Environ. Res. Public Health 2020, 17, 93. https://doi.org/10.3390/ijerph17010093
Johnston JE, Juarez Z, Navarro S, Hernandez A, Gutschow W. Youth Engaged Participatory Air Monitoring: A ‘Day in the Life’ in Urban Environmental Justice Communities. International Journal of Environmental Research and Public Health. 2020; 17(1):93. https://doi.org/10.3390/ijerph17010093
Chicago/Turabian StyleJohnston, Jill E., Zully Juarez, Sandy Navarro, Ashley Hernandez, and Wendy Gutschow. 2020. "Youth Engaged Participatory Air Monitoring: A ‘Day in the Life’ in Urban Environmental Justice Communities" International Journal of Environmental Research and Public Health 17, no. 1: 93. https://doi.org/10.3390/ijerph17010093
APA StyleJohnston, J. E., Juarez, Z., Navarro, S., Hernandez, A., & Gutschow, W. (2020). Youth Engaged Participatory Air Monitoring: A ‘Day in the Life’ in Urban Environmental Justice Communities. International Journal of Environmental Research and Public Health, 17(1), 93. https://doi.org/10.3390/ijerph17010093