Evaluate Typhoon Disasters in 21st Century Maritime Silk Road by Super-Efficiency DEA


Abstract
1. Introduction
2. Materials and Methods
3. Results
4. Discussion
5. Conclusions
Author Contributions
Funding
Conflicts of Interest
References
- Yu, L.; Peng, C.; Regmi, A.D.; Murray, V.; Pasuto, A.; Titti, G.; Shafique, M.; Priyadarshana, D.G.T. An international program on Silk Road Disaster Risk Reduction—A Belt and Road initiative (2016–2020). J. Mt. Sci. 2018, 15, 1383–1396. [Google Scholar] [CrossRef]
- Peng, C.; Regmi, A.D.; Qiang, Z.; Yu, L.; Xiaoqing, C.; Deqiang, C. Natural Hazards and Disaster Risk in One Belt One Road Corridors. In Proceedings of the 4th World Landslide Forum, Ljubljana, Slovenia, 29 May–2 June 2017; pp. 1155–1164. [Google Scholar]
- Li, P.; Qian, H.; Howard, K.W.F.; Wu, J. Building a new and sustainable “Silk Road economic belt”. Environ. Earth Sci. 2015, 74, 7267–7270. [Google Scholar] [CrossRef]
- Yin, J.; Yin, Z.; Xu, S. Composite risk assessment of typhoon-induced disaster for China’s coastal area. Nat. Hazards 2013, 69, 1423–1434. [Google Scholar] [CrossRef]
- Heginbottom, A.; Etkin, D. Tri-lateral workshop on natural hazards: Towards a comprehensive assessment of risks due to natural hazards, Canada–U.S.A.–Mexico. Nat. Hazards 1995, 11, 95–96. [Google Scholar] [CrossRef]
- McCallum, I.; Liu, W.; See, L.; Mechler, R.; Keating, A.; Hochrainer-Stigler, S.; Mochizuki, J.; Fritz, S.; Dugar, S.; Arestegui, M.; et al. Technologies to Support Community Flood Disaster Risk Reduction. Int. J. Disaster Risk Sci. 2016, 7, 198–204. [Google Scholar] [CrossRef]
- Amarnath, G.; Matheswaran, K.; Pandey, P.; Alahacoon, N.; Yoshimoto, S. Flood Mapping Tools for Disaster Preparedness and Emergency Response Using Satellite Data and Hydrodynamic Models: A Case Study of Bagmathi Basin, India. Proc. Natl. Acad. Sci. India Sect. A Phys. Sci. 2017, 87, 941–950. [Google Scholar] [CrossRef]
- Zhao, J.; Jin, J.; Xu, J.; Guo, Q.; Hang, Q.; Chen, Y. Risk assessment of flood disaster and forewarning model at different spatial-temporal scales. Theor. Appl. Climatol. 2018, 132, 791–808. [Google Scholar] [CrossRef]
- Kim, J.-M.; Son, K.; Kim, Y.-J. Assessing regional typhoon risk of disaster management by clustering typhoon paths. Environ. Dev. Sustain. 2018, 1–14. [Google Scholar] [CrossRef]
- Deng, Q.; Liu, Y.; Zhang, H.; Deng, X.; Ma, Y. A new crowdsourcing model to assess disaster using microblog data in typhoon Haiyan. Nat. Hazards 2016, 84, 1241–1256. [Google Scholar] [CrossRef]
- Hugelius, K.; Gifford, M.; Örtenwall, P.; Adolfsson, A. Health among disaster survivors and health professionals after the Haiyan Typhoon: A self-selected Internet-based web survey. Int. J. Emerg. Med. 2017, 10, 13. [Google Scholar] [CrossRef] [PubMed]
- Chang, M.-C.; Chen, P.-F.; Lung, F.-W. Anxiety in Predicting Suicide-Related Symptom of Typhoon Disaster Victims: A One-Year Follow-Up Study in Southern Taiwan. Psychiatr. Q. 2012, 83, 481–487. [Google Scholar] [CrossRef]
- Kim, H.; Marcouiller, D.W. Considering disaster vulnerability and resiliency: The case of hurricane effects on tourism-based economies. Ann. Reg. Sci. 2015, 54, 945–971. [Google Scholar] [CrossRef]
- Fara, K. How Natural Are ‘Natural Disasters’? Vulnerability to Drought of Communal Farmers in Southern Namibia. Risk Manag. 2001, 3, 47–63. [Google Scholar] [CrossRef]
- Du, Y.; Ding, Y.; Li, Z.; Cao, G. The role of hazard vulnerability assessments in disaster preparedness and prevention in China. Mil. Med Res. 2015, 2, 27. [Google Scholar] [CrossRef] [PubMed]
- Birkmann, J.; Cutter, S.L.; Rothman, D.S.; Welle, T.; Garschagen, M.; van Ruijven, B.; O’Neill, B.; Preston, B.L.; Kienberger, S.; Cardona, O.D.; et al. Scenarios for vulnerability: Opportunities and constraints in the context of climate change and disaster risk. Clim. Chang. 2015, 133, 53–68. [Google Scholar] [CrossRef]
- Ma, D.; Chen, J.; Zhang, W.; Zheng, L.; Liu, Y. Farmers’ vulnerability to flood risk. J. Geogr. Sci. 2007, 17, 269–284. [Google Scholar] [CrossRef]
- Miranda, M.; Vedenov, D.V. Innovations in Agricultural and Natural Disaster Insurance. Am. J. Agric. Econ. 2001, 83, 650–655. [Google Scholar] [CrossRef]
- Aven, T. On some recent definitions and analysis frameworks for risk, vulnerability, and resilience. Risk Anal. 2011, 31, 515–522. [Google Scholar] [CrossRef] [PubMed]
- Koutsourelakis, P.S. Assessing structural vulnerability against earthquakes using multi-dimensional fragility surfaces: A Bayesian framework. Probabilistic Eng. Mech. 2010, 25, 49–60. [Google Scholar] [CrossRef]
- Lin, B.B.; Morefield, P.E. The Vulnverability Cube: A Multi-Dimensional Framework for Assessing Relative Vulnerability. Environ. Manag. 2011, 48, 631–643. [Google Scholar] [CrossRef] [PubMed]
- Armengol, S.; Sanchez-Vila, X.; Folch, A. An approach to aquifer vulnerability including uncertainty in a spatial random function framework. J. Hydrol. 2014, 517, 889–900. [Google Scholar] [CrossRef]
- Shah, K.U.; Dulal, H.B.; Johnson, C.; Baptiste, A. Understanding livelihood vulnerability to climate change: Applying the livelihood vulnerability index in Trinidad and Tobago. Geoforum 2013, 47, 125–137. [Google Scholar] [CrossRef]
- Reed, M.S.; Podesta, G.; Fazey, I.; Geeson, N.; Hessel, R.; Hubacek, K.; Letson, D.; Nainggolan, D.; Prell, C.; Rickenbach, M.G. Combining analytical frameworks to assess livelihood vulnerability to climate change and analyse adaptation options. Ecol. Econ. 2013, 94, 66–77. [Google Scholar] [CrossRef] [PubMed]
- Panthi, J.; Aryal, S.; Dahal, P.; Bhandari, P.; Krakauer, N.Y.; Pandey, V.P. Livelihood vulnerability approach to assessing climate change impacts on mixed agro-livestock smallholders around the Gandaki River Basin in Nepal. Reg. Environ. Chang. 2016, 16, 1121–1132. [Google Scholar] [CrossRef]
- Bouroncle, C.; Imbach, P.; Rodríguez-Sánchez, B.; Medellín, C.; Martinez-Valle, A.; Läderach, P. Mapping climate change adaptive capacity and vulnerability of smallholder agricultural livelihoods in Central America: Ranking and descriptive approaches to support adaptation strategies. Clim. Chang. 2016, 141, 1–15. [Google Scholar] [CrossRef]
- Williams, S.E.; Shoo, L.P.; Isaac, J.L.; Hoffmann, A.A.; Langham, G. Towards an integrated framework for assessing the vulnerability of species to climate change. PLoS Biol. 2008, 6, 2621–2626. [Google Scholar] [CrossRef] [PubMed]
- Sheng, J.C. Effect of Uncertainties in Estimated Carbon Reduction from Deforestation and Forest Degradation on Required Incentive Payments in Developing Countries. Sustainability 2017, 9. [Google Scholar] [CrossRef]
- Mechler, R.; Bouwer, L.M. Understanding trends and projections of disaster losses and climate change: Is vulnerability the missing link? Clim. Chang. 2015, 133, 1–13. [Google Scholar] [CrossRef]
- De Silva, M.M.; Kawasaki, A. Socioeconomic Vulnerability to Disaster Risk: A Case Study of Flood and Drought Impact in a Rural Sri Lankan Community. Ecol. Econ. 2018, 152, 131–140. [Google Scholar] [CrossRef]
- Ye, J.Y.; Zhang, M.F.; Lin, G.F.; Chen, F.; Shan, Y. The application of entropy weight theory in typhoon disaster vulnerability assessment. In Proceedings of the IEEE International Conference on Spatial Data Mining & Geographical Knowledge Services, Fuzhou, China, 29 June–1 July 2011. [Google Scholar]
- Liu, C.; Liu, Q.; Li, J.; Li, Y.; Wang, A. China’s Belt and Road Initiative in Support of the Resourcing Future Generations Program. Nat. Resour. Res. 2018, 27, 257–274. [Google Scholar] [CrossRef]
- Huang, R.; Nie, T.; Zhu, Y.; Du, S. Forecasting Trade Potential Between China and the Five Central Asian Countries: Under the Background of Belt and Road Initiative. Comput. Econ. 2019. [Google Scholar] [CrossRef]
- Zhang, X.; Zhang, H.; Zhao, C.; Yuan, J. Carbon emission intensity of electricity generation in Belt and Road Initiative countries: A benchmarking analysis. Environ. Sci. Pollut. Res. 2019, 1–12. [Google Scholar] [CrossRef] [PubMed]
- Blanco Pitlo, L.; Karambelkar, A. India’s Perception and Response to China’s “One Belt, One Road” Initiative: Views from Indian Mainstream Media. Asian Politics Policy 2015, 7, 667–671. [Google Scholar] [CrossRef]
- Du, J.; Zhang, Y. Does One Belt One Road initiative promote Chinese overseas direct investment? China Econ. Rev. 2018, 47, S1043951X17300743. [Google Scholar] [CrossRef]
- Yu, Y.; Chang, Y.C. The ‘One Belt One Road’ Initiative and its impact on shipping law in China. Mar. Policy 2018, 87, 291–294. [Google Scholar] [CrossRef]
- Zhang, Y.; Zhang, J.H.; Tian, Q.; Liu, Z.H.; Zhang, H.L. Virtual water trade of agricultural products: A new perspective to explore the Belt and Road. Sci. Total Environ. 2018, 622–623, 988–996. [Google Scholar] [CrossRef]
- Hong, Y. Motivation behind China’s ‘One Belt, One Road’ Initiatives and Establishment of the Asian Infrastructure Investment Bank. J. Contemp. China 2016, 26, 1–16. [Google Scholar]
- Yu, D. Intuitionistic fuzzy theory based typhoon disaster evaluation in Zhejiang Province, China: A comparative perspective. Nat. Hazards 2015, 75, 2559–2576. [Google Scholar] [CrossRef]
- Ye, T.; Wang, Y.; Wu, B.; Shi, P.; Wang, M.; Hu, X. Government Investment in Disaster Risk Reduction Based on a Probabilistic Risk Model: A Case Study of Typhoon Disasters in Shenzhen, China. Int. J. Disaster Risk Sci. 2016, 7, 123–137. [Google Scholar] [CrossRef]
- Pelling, M. Visions of Risk: A Review of International Indicators of Disaster Risk and Its Management; King’s Sollege, University of London: London, UK, 2004. [Google Scholar]
- Dilley, M. Natural Disaster Hotspots: A Global Risk Analysis. Uwe Deichmann 2005, 20, 1–145. [Google Scholar]
- Charnes, A.; Cooper, W.W.; Rhodes, E. Measuring the efficiency of decision making units. Eur. J. Oper. Res. 1978, 2, 429–444. [Google Scholar] [CrossRef]
- Xue, M.; Harker, P.T. Note: Ranking DMUs with Infeasible Super-Efficiency DEA Models. Manag. Sci. 2002, 48, 705–710. [Google Scholar] [CrossRef]
- Li, M.; Lv, J.; Xin, C.; Nan, J. Provincial evaluation of vulnerability to geological disaster in China and its influencing factors: A three-stage DEA-based analysis. Nat. Hazards 2015, 79, 1649–1662. [Google Scholar] [CrossRef]
- Lee, J.Y. Application of the three-stage DEA in measuring efficiency—An empirical evidence. Appl. Econ. Lett. 2008, 15, 49–52. [Google Scholar] [CrossRef]


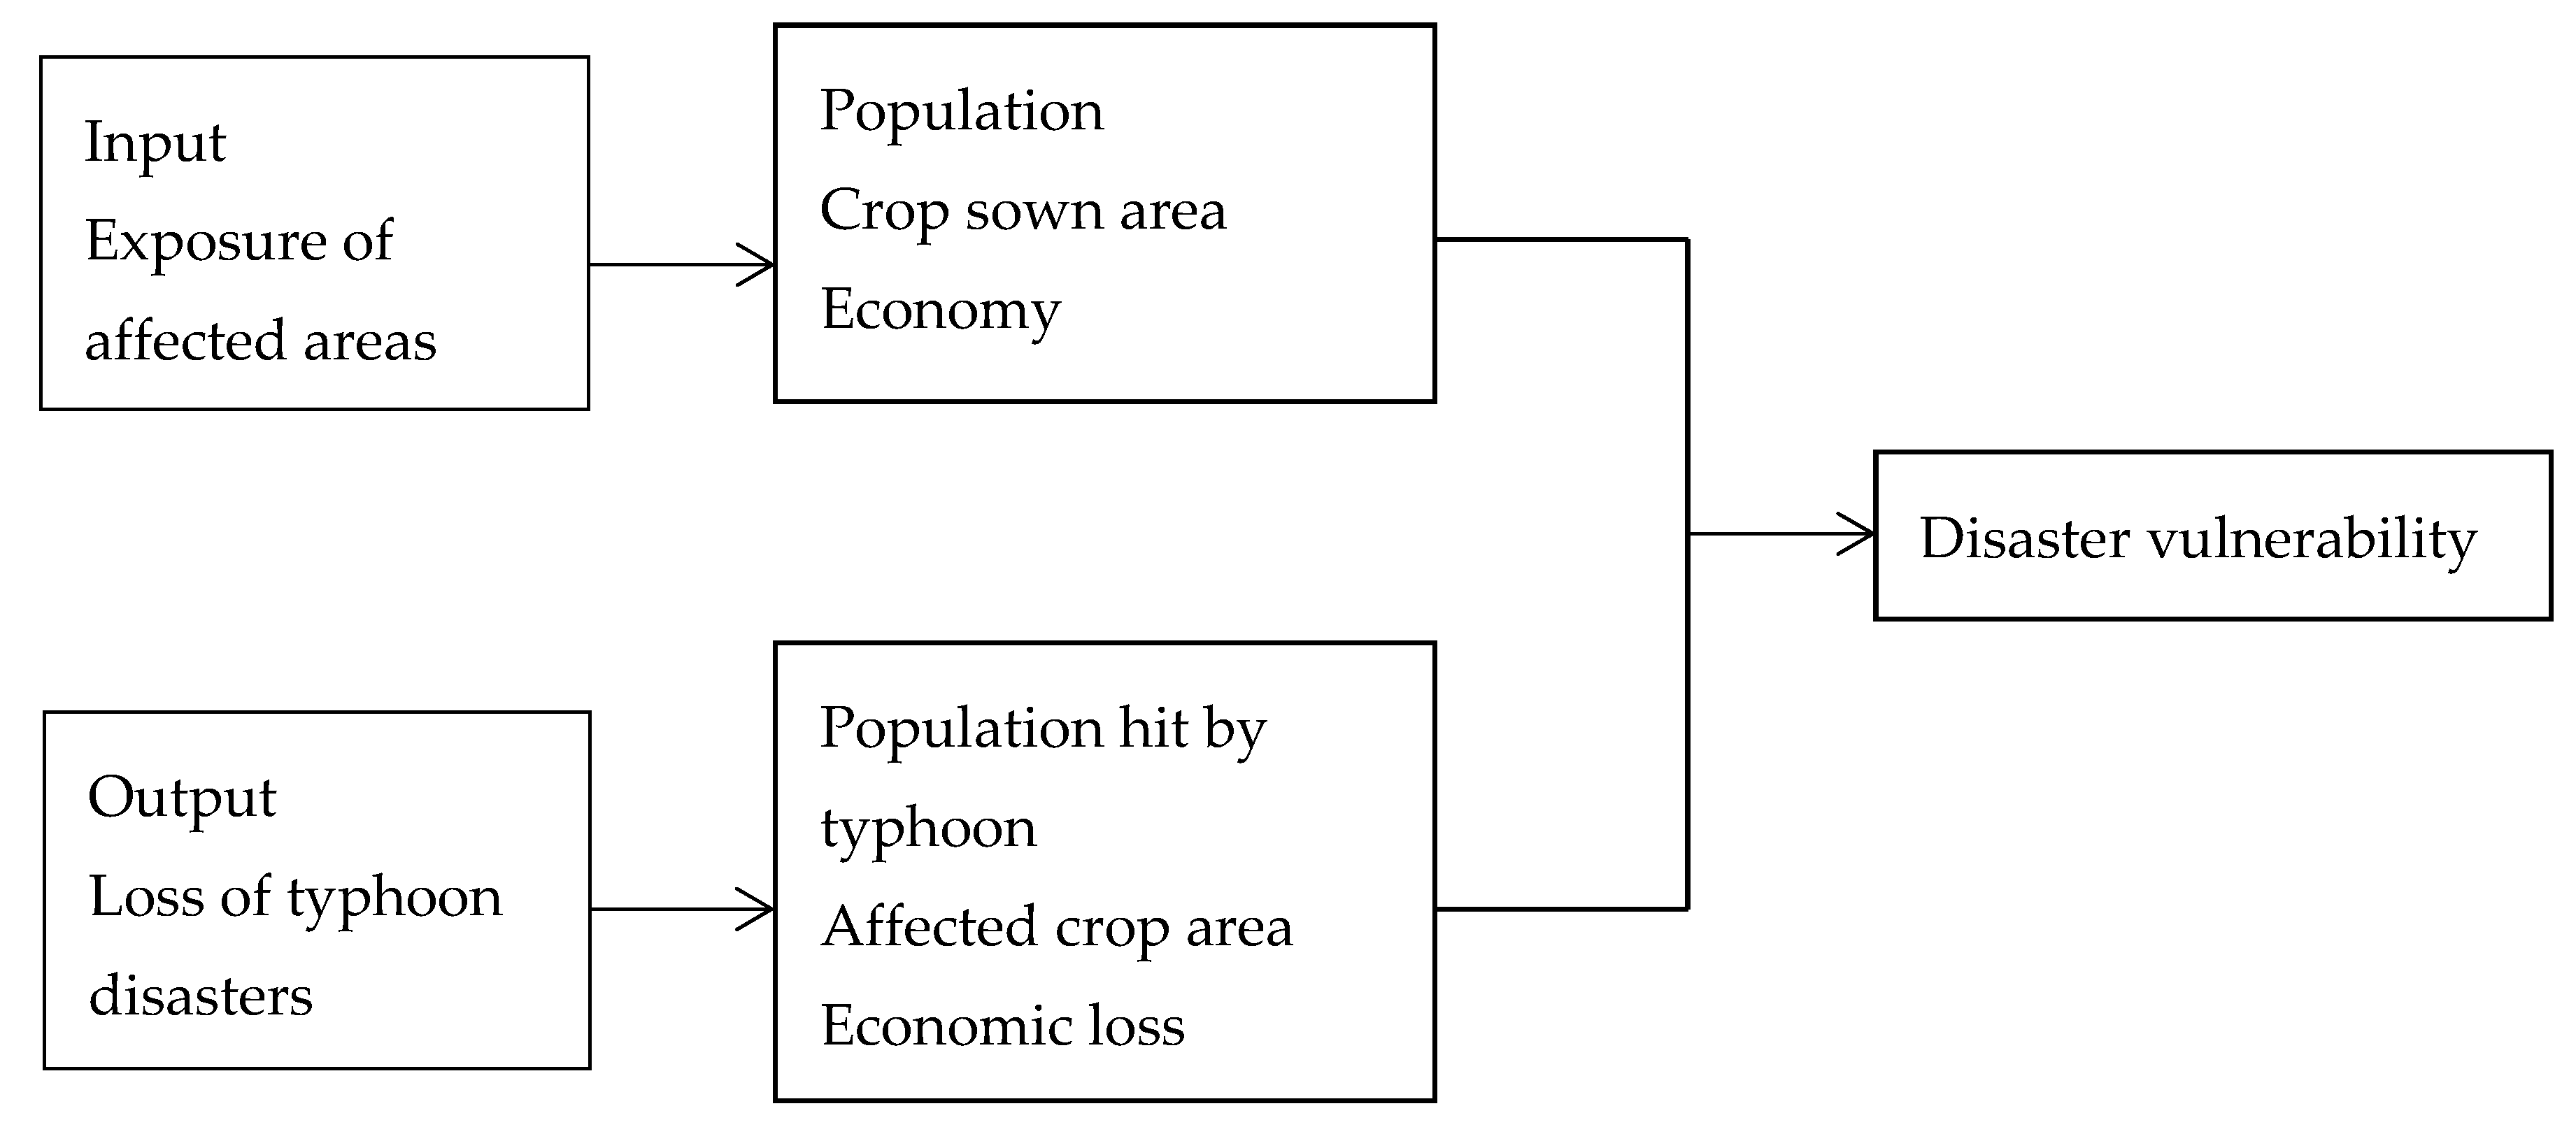
| Factor | Variable of Input | Variable of Output |
|---|---|---|
| Population | Population density | Affected population |
| Agriculture | Crop sown area | Affected crop area |
| Economy | Per capita GDP | Economic loss |
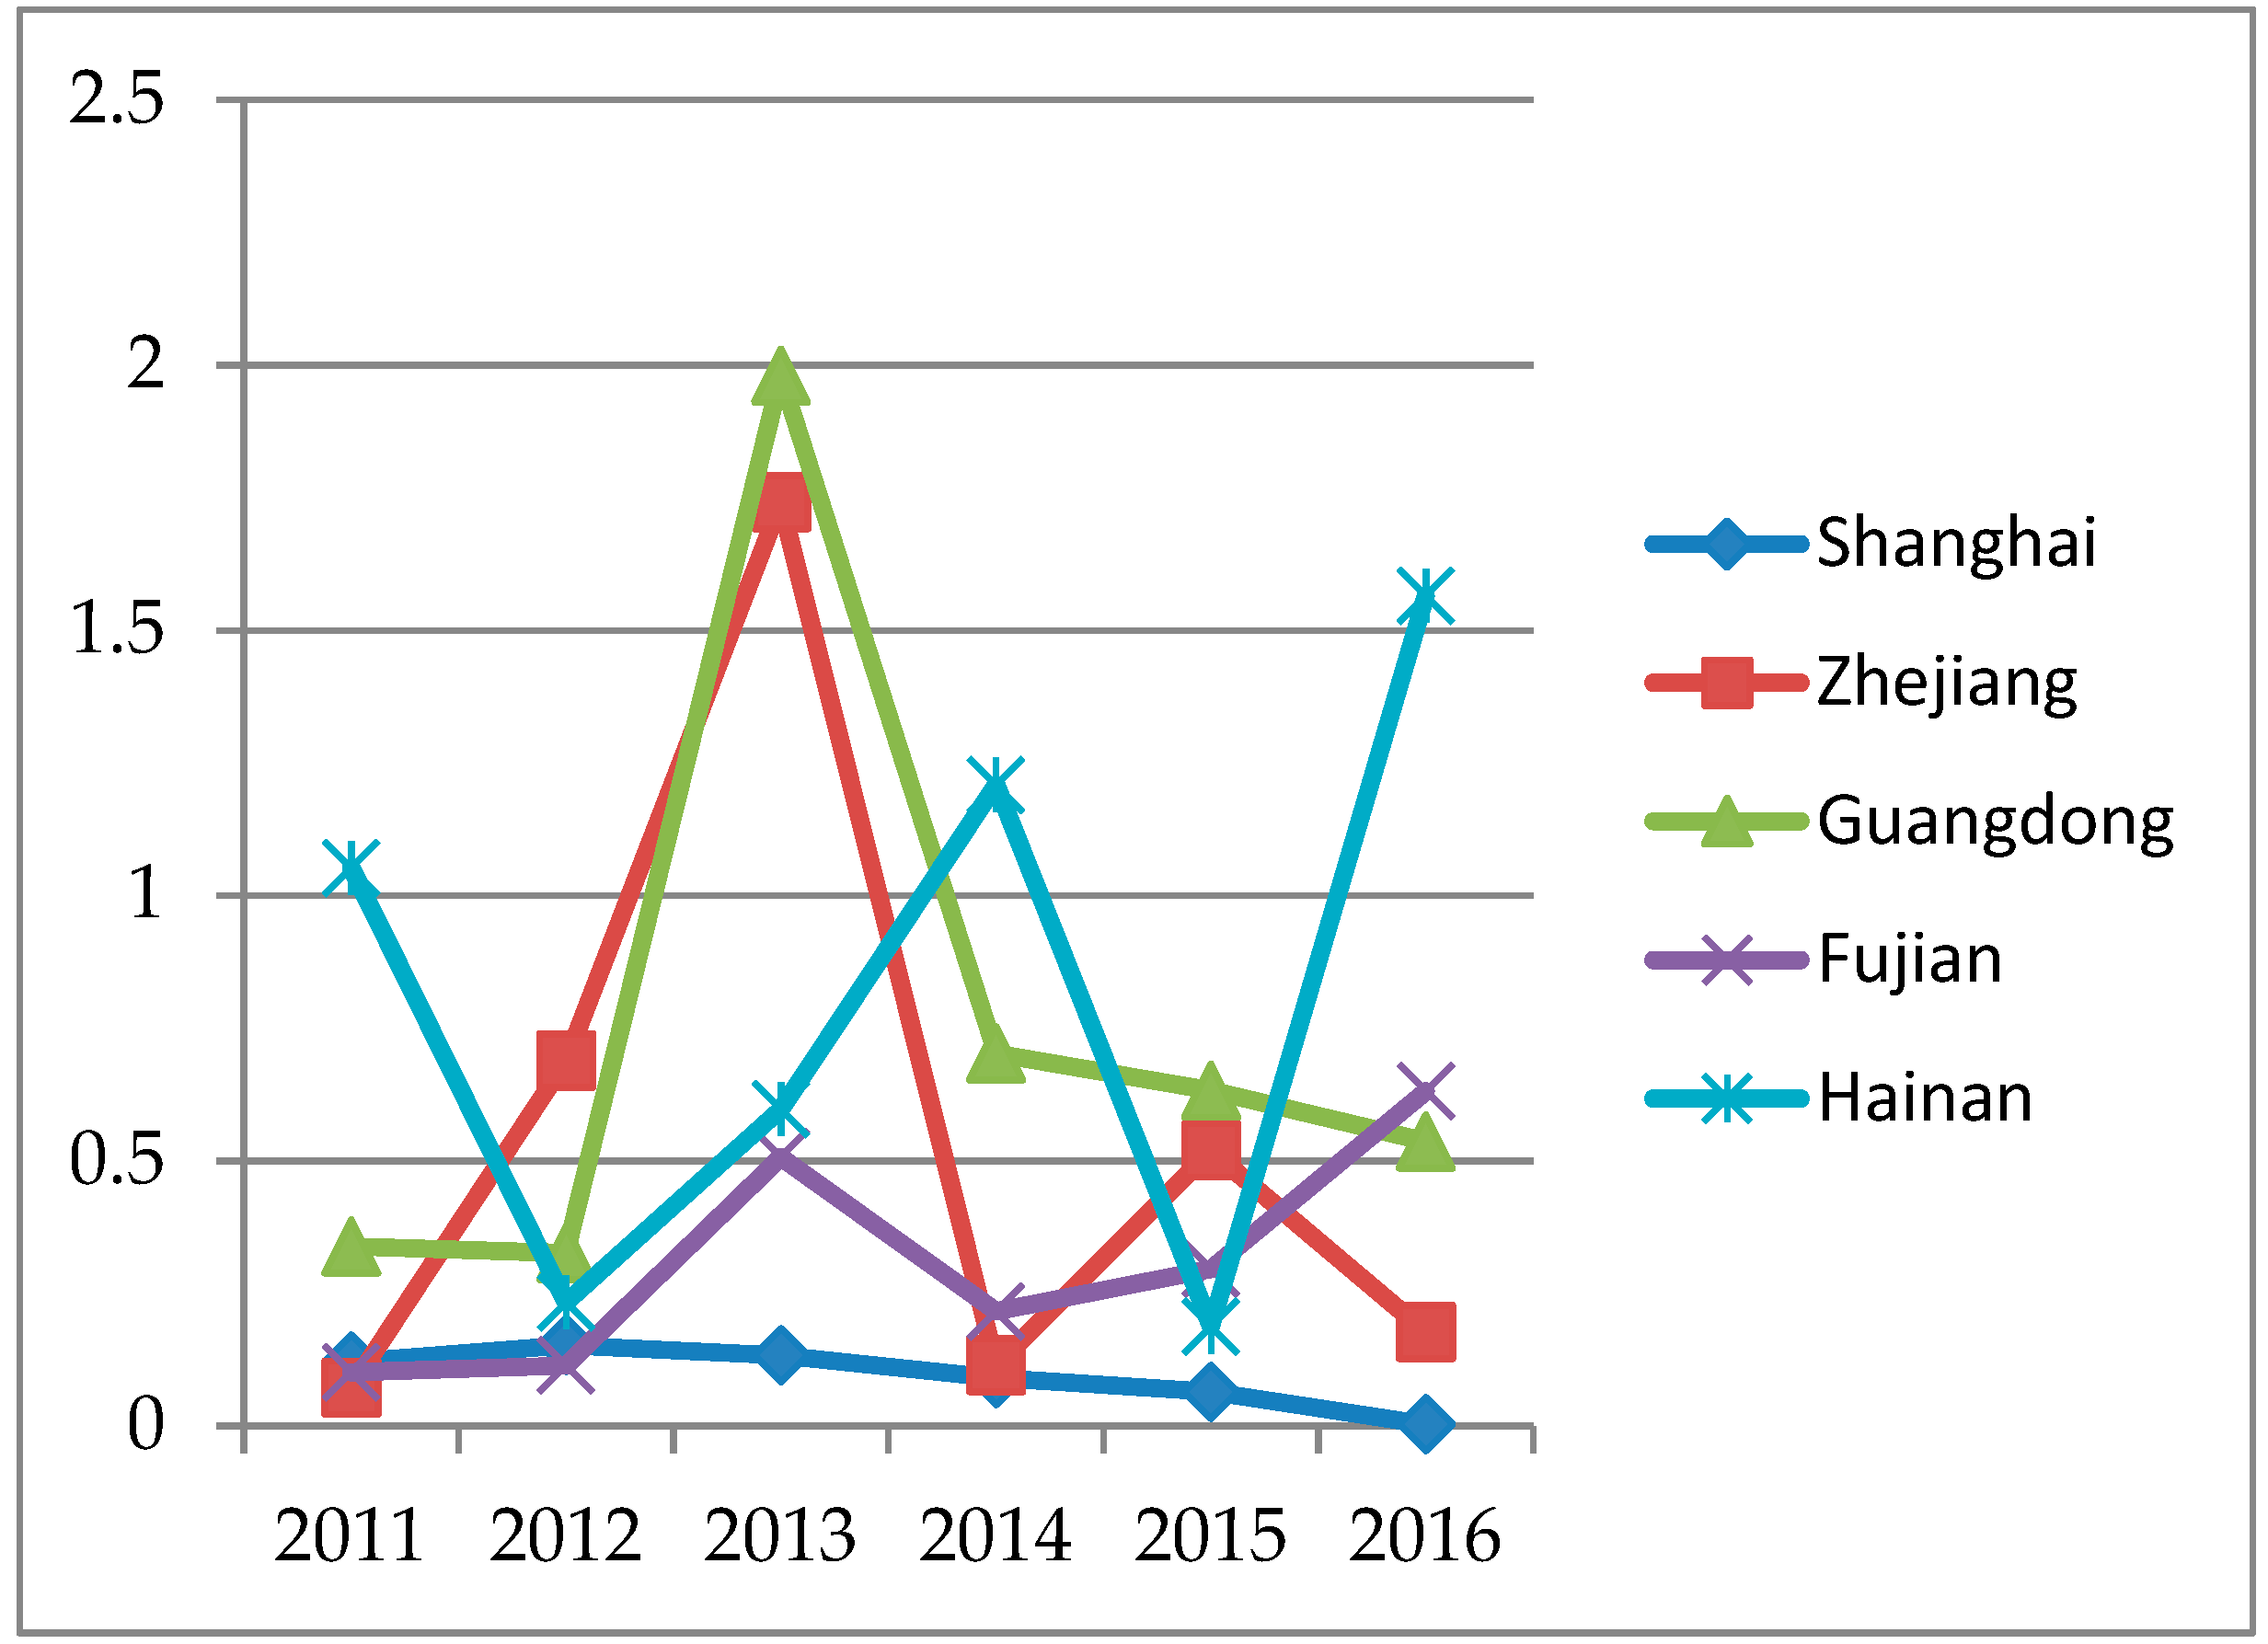
| Area | Vulnerability | |||||
|---|---|---|---|---|---|---|
| 2011 | 2012 | 2013 | 2014 | 2015 | 2016 | |
| Shanghai | 0.121 | 0.152 | 0.133 | 0.09 | 0.064 | 0.003 |
| Zhejiang | 0.072 | 0.688 | 1.741 | 0.114 | 0.519 | 0.177 |
| Guangdong | 0.338 | 0.326 | 1.98 | 0.702 | 0.632 | 0.536 |
| Fujian | 0.101 | 0.114 | 0.507 | 0.216 | 0.296 | 0.631 |
| Hainan | 1.052 | 0.233 | 0.597 | 1.209 | 0.187 | 1.565 |
| Exposure | Loss | ||||||
|---|---|---|---|---|---|---|---|
| Time | Area | Population Density/People Per Square Kilometer | Per Capita GDP/Ten Thousand Yuan Per Person | Crop Sown Area/Hectare * 1000 | Affected Population/Ten Thousand | Economic Loss/Billion Yuan | Affected Crop Area/Hectare * 1000 |
| 2011 | Shanghai | 3701.89 | 8.32 | 400.60 | 34.60 | 2.50 | 7.00 |
| Zhejiang | 517.82 | 5.92 | 2462.70 | 97.80 | 23.10 | 15.00 | |
| Guangdong | 584.59 | 5.07 | 4572.00 | 261.20 | 36.60 | 287.00 | |
| Fujian | 300.00 | 4.72 | 2285.80 | 105.20 | 10.60 | 50.40 | |
| Hainan | 247.74 | 2.88 | 838.30 | 553.53 | 68.92 | 223.50 | |
| 2012 | Shanghai | 3753.94 | 8.64 | 387.90 | 42.00 | 5.20 | 14.70 |
| Zhejiang | 519.15 | 6.34 | 2324.20 | 891.20 | 275.50 | 378.00 | |
| Guangdong | 589.54 | 5.39 | 4629.60 | 310.00 | 44.30 | 295.20 | |
| Fujian | 302.26 | 5.26 | 2263.10 | 93.43 | 15.60 | 59.41 | |
| Hainan | 250.56 | 3.22 | 854.60 | 131.05 | 13.09 | 62.90 | |
| 2013 | Shanghai | 3809.15 | 9.22 | 377.30 | 12.10 | 3.70 | 28.00 |
| Zhejiang | 521.14 | 6.87 | 2311.90 | 1234.70 | 609.00 | 613.00 | |
| Guangdong | 592.32 | 5.87 | 4698.10 | 2147.70 | 421.80 | 984.00 | |
| Fujian | 304.35 | 5.79 | 2292.20 | 313.20 | 103.60 | 258.15 | |
| Hainan | 252.83 | 3.55 | 848.20 | 352.90 | 30.40 | 156.00 | |
| 2014 | Shanghai | 3826.50 | 9.92 | 357.00 | 13.65 | 3.00 | 18.00 |
| Zhejiang | 522.09 | 7.29 | 2274.00 | 158.50 | 10.80 | 57.00 | |
| Guangdong | 596.77 | 6.32 | 4744.90 | 554.50 | 255.30 | 700.00 | |
| Fujian | 306.94 | 6.32 | 2305.20 | 70.90 | 16.50 | 117.71 | |
| Hainan | 255.08 | 3.88 | 859.60 | 612.33 | 177.40 | 306.35 | |
| 2015 | Shanghai | 3809.15 | 10.62 | 340.20 | 15.20 | 2.30 | 8.00 |
| Zhejiang | 525.02 | 7.74 | 2290.50 | 667.60 | 219.50 | 368.00 | |
| Guangdong | 603.73 | 6.71 | 4784.70 | 613.50 | 288.00 | 617.00 | |
| Fujian | 309.60 | 6.77 | 2331.30 | 268.50 | 88.60 | 120.83 | |
| Hainan | 257.34 | 4.06 | 845.30 | 112.60 | 12.40 | 36.00 | |
| 2016 | Shanghai | 3817.03 | 11.64 | 294.70 | 0.46 | 0.24 | 0.31 |
| Zhejiang | 529.86 | 8.45 | 2274.40 | 231.23 | 92.07 | 98.07 | |
| Guangdong | 612.08 | 7.23 | 4830.80 | 295.67 | 343.90 | 60.68 | |
| Fujian | 312.42 | 7.36 | 2327.30 | 310.94 | 179.13 | 286.09 | |
| Hainan | 259.04 | 4.42 | 823.30 | 457.90 | 76.70 | 459.30 | |
| Shanghai | Zhejiang | Guangdong | Fujian | Hainan | |
|---|---|---|---|---|---|
| 2011 | 3 | 5 | 2 | 4 | 1 |
| 2012 | 4 | 1 | 2 | 5 | 3 |
| 2013 | 5 | 2 | 1 | 4 | 3 |
| 2014 | 5 | 4 | 2 | 3 | 1 |
| 2015 | 5 | 2 | 1 | 3 | 4 |
| 2016 | 5 | 4 | 3 | 2 | 1 |
© 2019 by the authors. Licensee MDPI, Basel, Switzerland. This article is an open access article distributed under the terms and conditions of the Creative Commons Attribution (CC BY) license (http://creativecommons.org/licenses/by/4.0/).
Share and Cite
Yu, X.; Chen, H.; Li, C. Evaluate Typhoon Disasters in 21st Century Maritime Silk Road by Super-Efficiency DEA. Int. J. Environ. Res. Public Health 2019, 16, 1614. https://doi.org/10.3390/ijerph16091614
Yu X, Chen H, Li C. Evaluate Typhoon Disasters in 21st Century Maritime Silk Road by Super-Efficiency DEA. International Journal of Environmental Research and Public Health. 2019; 16(9):1614. https://doi.org/10.3390/ijerph16091614
Chicago/Turabian StyleYu, Xiaobing, Hong Chen, and Chenliang Li. 2019. "Evaluate Typhoon Disasters in 21st Century Maritime Silk Road by Super-Efficiency DEA" International Journal of Environmental Research and Public Health 16, no. 9: 1614. https://doi.org/10.3390/ijerph16091614
APA StyleYu, X., Chen, H., & Li, C. (2019). Evaluate Typhoon Disasters in 21st Century Maritime Silk Road by Super-Efficiency DEA. International Journal of Environmental Research and Public Health, 16(9), 1614. https://doi.org/10.3390/ijerph16091614