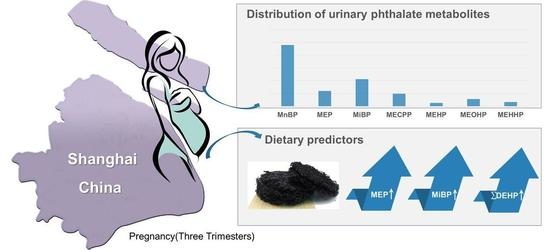
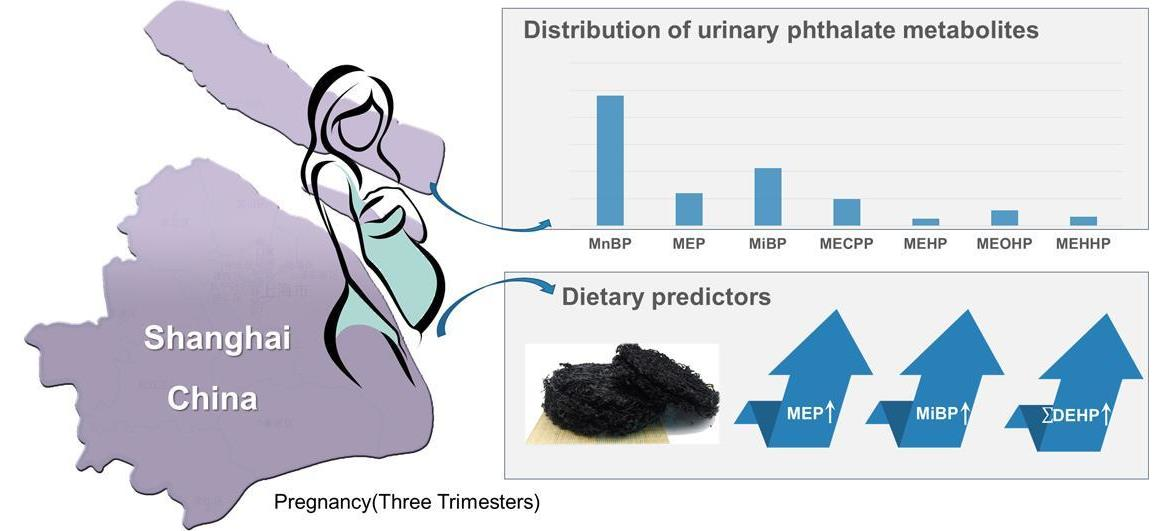
Distribution and Dietary Predictors of Urinary Phthalate Metabolites among Pregnant Women in Shanghai, China

 ,
,
Abstract
1. Introduction
2. Methods and Materials
2.1. Study Population
2.2. Socio-Demographic Characteristics
2.3. Dietary Questionnaires
2.4. Urine Collection and Analysis
2.5. Statistical Analysis
3. Results
4. Discussion
5. Conclusions
Author Contributions
Funding
Acknowledgments
Conflicts of Interest
References
- Katsikantami, I.; Sifakis, S.; Tzatzarakis, M.N.; Vakonaki, E.; Kalantzi, O.I.; Tsatsakis, A.M. A global assessment of phthalates burden and related links to health effects. Environ. Int. 2016, 97, 212–236. [Google Scholar] [CrossRef] [PubMed]
- Braun, J.M. Early-life exposure to EDCs: Role in childhood obesity and neurodevelopment. Nat. Rev. Endocrinol. 2017, 13, 161–173. [Google Scholar] [CrossRef] [PubMed]
- Zheng, X.; Zhang, B.T.; Teng, Y. Distribution of phthalate acid esters in lakes of Beijing and its relationship with anthropogenic activities. Sci. Total Environ. 2014, 476–477, 107–113. [Google Scholar] [CrossRef]
- Zhu, Q.Q.; Jia, J.B.; Zhang, K.G.; Zhang, H.; Liao, C.Y.; Jiang, G.B. Phthalate esters in indoor dust from several regions, China and their implications for human exposure. Sci. Total Environ. 2019, 652, 1187–1194. [Google Scholar] [CrossRef]
- Sun, J.Q.; Huang, J.; Zhang, A.P.; Liu, W.P.; Cheng, W.W. Occurrence of phthalate esters in sediments in Qiantang River, China and inference with urbanization and river flow regime. J. Hazard. Mater. 2013, 248–249, 142–149. [Google Scholar] [CrossRef] [PubMed]
- Wittassek, M.; Koch, H.M.; Angerer, J.; Bruning, T. Assessing exposure to phthalates the human biomonitoring approach. Mol. Nutr. Food Res. 2011, 55, 7–31. [Google Scholar] [CrossRef]
- Hu, X.L.; Gu, Y.Y.; Huang, W.P.; Yin, D.Q. Phthalate monoesters as markers of phthalate contamination in wildmarine organisms. Environ. Pollut. 2016, 218, 410–418. [Google Scholar] [CrossRef]
- Mariana, M.; Feiteiro, J.; Verde, I.; Cairrao, E. The effects of phthalates in the cardiovascular and reproductive systems: A review. Environ. Int. 2016, 94, 758–776. [Google Scholar] [CrossRef]
- Chang, J.W.; Lee, C.C.; Pan, W.H.; Chou, W.C.; Huang, H.B.; Chiang, H.C. Estimated daily intake and cumulative risk assessment of phthalates in the general Taiwanese after the 2011 dehp food scandal. Sci. Rep. 2017, 7, 1–11. [Google Scholar] [CrossRef]
- Trasande, L.; Attina, T.M. Association of exposure to di-2-ethylhexylphthalate replacements with increased blood pressure in children and adolescents. Hypertension 2015, 66, 301–308. [Google Scholar] [CrossRef]
- Huang, H.B.; Pan, W.H.; Chang, J.W.; Chiang, H.C.; Guo, Y.L.; Jouni, J.K. Does exposure to phthalates influence thyroid function and growth hormone homeostasis? The Taiwan Environmental Survey for Toxicants (TEST) 2013. Environ. Res. 2017, 153, 63–72. [Google Scholar] [CrossRef]
- Kay, V.R.; Chambers, C.; Foster, W.G. Reproductive and developmental effects of phthalate diesters in females. Crit. Rev. Toxicol. 2013, 43, 200–219. [Google Scholar] [CrossRef]
- Kay, V.R.; Bloom, M.S.; Foster, W.G. Reproductive and developmental effects of phthalate diesters in males. Crit. Rev. Toxicol. 2014, 44, 467–498. [Google Scholar] [CrossRef]
- Bertelsen, R.J.; Lødrup Carlsen, K.C.; Calafat, A.M.; Hoppin, J.A.; Håland, G.; Mowinckel, P. Urinary biomarkers for phthalates associated with asthma in Norwegian children. Environ. Health Perspect. 2013, 121, 251–256. [Google Scholar] [CrossRef] [PubMed]
- Shi, W.M.; Lin, Z.J.; Liao, C.X.; Zhang, J.L.; Liu, W.; Wang, X.Y. Urinary phthalate metabolites in relation to childhood asthmatic and allergic symptoms in Shanghai. Environ. Int. 2018, 121, 276–286. [Google Scholar] [CrossRef] [PubMed]
- Huang, P.C.; Kuo, P.L.; Chou, Y.Y.; Lin, SJ.; Lee, C.C. Association between prenatal exposure to phthalates and the health of newborns. Environ. Int. 2009, 35, 14–20. [Google Scholar] [CrossRef]
- Tsai, Y.A.; Tsai, M.S.; Hou, J.W.; Lin, C.L.; Chen, C.Y.; Chang, C.H. Evidence of high di(2-ethylhexyl) phthalate (DEHP) exposure due to tainted food intake in Taiwanese pregnant women and the health effects on birth outcomes. Sci. Total Environ. 2018, 15, 618–627. [Google Scholar] [CrossRef]
- Lien, Y.J.; Ku, H.Y.; Su, P.H.; Chen, S.J.; Chen, H.Y.; Liao, P.C. Prenatal exposure to phthalate esters and behavioral syndromes in children at 8 years of age: Taiwan Maternal and Infant Cohort Study. Environ. Health Perspect. 2015, 123, 95–100. [Google Scholar] [CrossRef] [PubMed]
- Ejaredar, M.; Nyanza, E.C.; Eycke, K.T.; Dewey, D. Phthalate exposure and children development: A systematic review. Environ. Res. 2015, 142, 51–60. [Google Scholar] [CrossRef] [PubMed]
- Koch, H.M.; Lorber, M.; Christensen, K.L.Y.; Pälmke, C.; Koslitz, S.; Brüning, T. Identifying sources of phthalate exposure with human biomonitoring: Results of a 48 h fasting study with urine collection and personal activity patterns. Int. J. Hyg. Environ. Health. 2013, 216, 672–681. [Google Scholar] [CrossRef] [PubMed]
- Shen, Q.; Shi, H.; Zhang, Y.; Cao, Y. Dietary intake and phthalates body burden in boys and girls. Arch. Public Health. 2015, 73, 1–5. [Google Scholar] [CrossRef] [PubMed]
- Serrano, S.E.; Braun, J.; Trasande, L.; Dills, R.; Sathyanarayana, S. Phthalates and diet: A review of the food monitoring and epidemiology data. Environ. Health. 2014, 13, 43–56. [Google Scholar] [CrossRef] [PubMed]
- Colacino, J.A.; Harris, T.R.; Schecter, A. Dietary intake is associated with phthalate body burden in a nationally representative sample. Environ. Health Perspect. 2010, 118, 998–1003. [Google Scholar] [CrossRef] [PubMed]
- Sakhi, A.K.; Lillegaard, I.T.L.; Voorspoels, S.; Carlsen, M.H.; Løken, E.B.; Brantsæter, A.L. Concentrations of phthalates and bisphenol A in Norwegian foods and beverages and estimated dietary exposure in adults. Environ. Int. 2014, 73, 259–269. [Google Scholar] [CrossRef]
- Ji, Y.Q.; Wang, F.M.; Zhang, L.B.; Shan, C.Y.; Bai, Z.P.; Sun, Z.R. A comprehensive assessment of human exposure to phthalates from environmental media and food in Tianjin, China. J. Hazard. Mater. 2014, 279, 133–140. [Google Scholar] [CrossRef] [PubMed]
- Fierens, T.; Standaert, A.; Cornelis, C.; Sioen, I.; De Henauw, S.; Willems, H. A semiprobabilistic modelling approach for the estimation of dietary exposure to phthalates in the Belgian adult population. Environ. Int. 2014, 73, 117–127. [Google Scholar] [CrossRef] [PubMed]
- Jo, A.; Kim, H.; Chung, H.; Chang, N. Associations between dietary intake and urinary bisphenol A and phthalates levels in Korean women of reproductive age. Int. J. Environ. Res. Public Health 2016, 13, 680. [Google Scholar] [CrossRef]
- Polinski, K.J.; Dabelea, D.; Hamman, R.F.; Adgate, J.L.; Calafat, A.M.; Ye, X.Y. Distribution and predictors of urinary concentrations of phthalate metabolites and phenols among pregnant women in the Healthy Start. Environ. Res. 2018, 162, 308–317. [Google Scholar] [CrossRef]
- Philips, E.M.; Jaddoe, V.W.V.; Asimakopoulos, A.G.; Kannan, K.; Steegers, E.A.P.; Santos, S. Bisphenol and phthalate concentrations and its determinants among pregnant women in a population-based cohort in The Netherlands, 2004–5. Environ. Res. 2018, 161, 562–572. [Google Scholar] [CrossRef]
- Wenzel, A.G.; Brock, J.W.; Cruze, L.; Newman, R.B.; Unal, E.R.; Wolf, B.J. Prevalence and predictors of phthalate exposure in pregnant women in Charleston, SC. Chemosphere 2018, 193, 394–402. [Google Scholar] [CrossRef]
- Li, Y.; Zhai, F.; Yang, X.; Hu, X.; Zhao, W.; Ma, G.S. Comparison of assessment of food intakes by using 3 dietary survey methods. Chin. Prev. Med. 2006, 273–280. [Google Scholar]
- Zhu, X.N.; Wang, G.Q.; Zhou, Z.J.; Lu, D.S.; Wu, C.H.; Fang, H. Detecting 13 phthalate metabolites in human urine by high performance liquid chromatography tandem mass spectrometry. J. Environ. Occup. Med. 2015, 32, 265–270. [Google Scholar]
- MacPherson, S.; Arbuckle, T.E.; Fisher, M. Adjusting urinary chemical biomarkers for hydration status duringpregnancy. J. Expo. Sci. Environ. Epidemiol. 2018, 28, 481–493. [Google Scholar] [CrossRef]
- Adibi, J.J.; Whyatt, R.M.; Williams, P.L.; Calafat, A.M.; Camann, D.; Herrick, R. Characterization of phthalate exposure among pregnant women assessed by repeat air and urine samples. Environ. Health Perspect. 2008, 116, 467–473. [Google Scholar] [CrossRef] [PubMed]
- Cheung, K.L.; Lafayette, R.A. Renal physiology of pregnancy. Adv. Chronic Kidney Dis. 2013, 20, 209–214. [Google Scholar] [CrossRef]
- Johns, L.E.; Ferguson, K.K.; Soldin, O.P.; Cantonwine, D.E.; Rivera-González, L.O.; Del Toro, L.V.A. Urinary phthalate metabolites in relation to maternal serum thyroid and sex hormone levels during pregnancy: A longitudinal analysis. Reprod. Biol. Endocrinol. 2015, 13, 4–15. [Google Scholar] [CrossRef] [PubMed]
- Muñoz, I.; Colacino, J.A.; Lewis, R.C.; Arthur, A.E.; Meeker, J.D.; Ferguson, K.K. Associations between school lunch consumption and urinary phthalate metabolite concentrations in US children and adolescents: Results from NHANES 2003–2014. Environ. Int. 2018, 121, 287–295. [Google Scholar] [CrossRef]
- Guo, Y.; Wu, Q.; Kannan, K. Phthalate metabolites in urine from China, and implications for human exposures. Environ. Int. 2011, 37, 893–898. [Google Scholar] [CrossRef]
- Gao, H.; Zhu, Y.D.; Xu, Y.Y.; Zhang, Y.W.; Yao, H.Y.; Sheng, J. Season-dependent concentrations of urinary phthalate metabolites among Chinese pregnant women: Repeated measures analysis. Environ. Int. 2017, 104, 110–117. [Google Scholar] [CrossRef]
- Li, X.Y.; Sun, H.W.; Yao, Y.M.; Zhao, Z.; Qin, X.L.; Duan, Y.S. Distribution of Phthalate Metabolites between Paired Maternal-Fetal Samples. Environ. Sci. Technol. 2018, 3, 1–32. [Google Scholar] [CrossRef]
- CDC. Fourth National Report on Human Exposure to Environmental Chemicals: Updated Tables, January 2017; U.S. Centers for Disease Control and Prevention: Atlanta, GA, USA, 2017. [Google Scholar]
- Hsieh, C.J.; Chang, Y.H.; Hu, A.; Chen, M.L.; Sun, C.W.; Situmorang, R.F. Personal care products use and phthalate exposure levels among pregnant women. Sci. Total Environ. 2019, 648, 135–143. [Google Scholar] [CrossRef]
- Jiang, M.M.; Li, Y.Y.; Zhang, B.; Zhou, A.F.; Zhu, Y.S.; Li, J.F. Urinary concentrations of phthalate metabolites associated with changes in clinical hemostatic and hematologic parameters in pregnant women. Environ. Int. 2018, 120, 34–42. [Google Scholar] [CrossRef] [PubMed]
- Arbuckle, T.E.; David, K.; Marrow, L.; Fisher, M.; Legrand, M.; LeBlanc, A. Phthalate and bisphenol A exposure among pregnant women in Canada-results from the MIREC study. Environ. Int. 2014, 68, 55–65. [Google Scholar] [CrossRef] [PubMed]
- Exley, K.; Aerts, D.; Biot, P.; Casteleyn, L.; Kolossa-Gehring, M.; Schwedler, G. Pilot study testing a European human biomonitoring framework for biomarkers of chemical exposure in children and their mothers: Experiences in the UK. Enciron. Sci. Pollut. Res. 2015, 22, 15821–15834. [Google Scholar] [CrossRef] [PubMed]
- Ye, X.; Pierik, F.H.; Hauser, R.; Duty, S.; Angerer, J.; Park, M.M. Urinary metabolite concentrations of organophosphorous pesticides, bisphenol A, and phthalates among pregnant women in Rotterdam, the Netherlands: The Generation R study. Environ. Res. 2008, 108, 260–267. [Google Scholar] [CrossRef]
- Valvi, D.; Monfort, N.; Ventura, R.; Casas, M.; Casas, L.; Sunyer, J. Variability and predictors of urinary phthalate metabolites in Spanish pregnant women. Int. J. Hyg. Environ. Health 2015, 218, 220–231. [Google Scholar] [CrossRef]
- Jung, K.; Oh, H.; Ryu, J.Y.; Kim, D.H.; Lee, S.; Son, B.C. Relationship between housing characteristics, lifestyle factors and phthalates exposure: The first Korean National Environmental Health Survey (2009–2011). Ann. Occup. Environ. Med. 2015, 27, 33–41. [Google Scholar] [CrossRef]
- Ruiz, D.; Becerra, M.; Jagai, J.S.; Ard, K.; Sargis, R.M. Disparities in environmental exposures to endocrine-disrupting chemicals and diabetes risk in vulnerable populations. Diabetes Care 2017, 41, 193–205. [Google Scholar] [CrossRef]
- Bleakley, H.; Costa, D.; Lleras-Muney, A. Health, Education and Income in the United States, 1820–2000. NberWork. Pap. 2013, 10, 1–56. [Google Scholar]
- He, M.; Yang, C.; Geng, R.J.; Zhao, X.G.; Hong, L.; Piao, X.F. Monitoring of phthalates in foodstuffs using gas purge microsyringe extraction coupled with GC–MS. Anal. Chim. Acta. 2015, 879, 63–68. [Google Scholar] [CrossRef]
- Zhang, H.B.; Zhou, Q.; Xie, Z.Y.; Zhou, Y.; Tu, C.; Fu, C.C. Occurrences of organophosphorus esters and phthalates in the microplastics from the coastal beaches in north China. Sci. Total Environ. 2018, 616, 1505–1512. [Google Scholar] [CrossRef] [PubMed]
- Chen, C.Y. Biosynthesis of di-(2-ethylhexyl) phthalate (DEHP) and di-n-butyl phthalate (DBP) from red alga-Bangiaatropurpurea. Water Res. 2004, 38, 1014–1018. [Google Scholar] [CrossRef]

| Maternal Characteristics | N = 210 | Mean ± SD or Percentage (%) |
|---|---|---|
| Age at delivery (years) | 29.02 ± 3.96 | |
| 20~24 | 23 | 11.0% |
| 25~29 | 108 | 51.4% |
| 30~34 | 54 | 25.7% |
| 35~40 | 25 | 11.9% |
| Gestational age | 20.43 ± 5.06 | |
| First trimester | 70 | 33.3% |
| Second trimester | 70 | 33.3% |
| Third trimester | 70 | 33.3% |
| Location | ||
| Urban | 90 | 42.9% |
| Suburban | 120 | 57.1% |
| Pre-pregnancy BMI | 21.55 ± 3.29 | |
| Underweight (<18.5) | 21 | 10.0% |
| Normal (18.5–24.9) | 154 | 73.3% |
| Overweight/Obese (≥25) | 35 | 16.7% |
| Education level | ||
| High school or less | 73 | 34.8% |
| College | 56 | 26.7% |
| University or higher | 81 | 38.5% |
| Occupation | ||
| Production | 10 | 4.8% |
| Service | 31 | 14.8% |
| Management and technician | 100 | 47.6% |
| Housework | 53 | 25.2% |
| Others | 16 | 7.6% |
| Cigarette smoking | ||
| Current smoker | 0 | 0% |
| Former smoker | 3 | 1.4% |
| Never smoker | 207 | 98.6% |
| Alcohol consumption | ||
| Current drinker | 4 | 1.9% |
| Former drinker | 4 | 1.9% |
| Never drinker | 202 | 96.2% |
| Parent Phthalate | Abbreviation | Metabolites | Abbreviation | LOD (ng/mL) | %>LOD | CrudeGM (95% CI) | SG-adjusted GM (95% CI) |
|---|---|---|---|---|---|---|---|
| Di-n-butyl phthalate | DnBP | Monobutyl phthalate | MnBP | 0.1 | 100.0 | 25.29 (22.09−28.96) | 24.01 (20.54−28.07) |
| Diethyl phthalate | DEP | Monoethyl phthalate | MEP | 0.5 | 95.7 | 6.33 (5.40−7.42) | 6.01 (5.04−7.17) |
| Di-isobutyl phthalate | DiBP | Monoisobutyl phthalate | MiBP | 0.1 | 100.0 | 11.18 (10.08−12.40) | 10.62 (9.38−12.01) |
| Mono2-ethyl-5-carboxypentyl phthalate | MECPP | 0.1 | 97.1 | 5.19 (4.58−5.89) | 4.93 (4.23−5.75) | ||
| Di-(2-ethylhexyl) phthalate | DEHP | Mono(2-ethyl)-hexyl phthalate | MEHP | 0.1 | 100.0 | 1.36 (1.25−1.49) | 1.29 (1.16−1.44) |
| Mono(2-ethyl-5-oxohexyl) phthalate | MEOHP | 0.1 | 97.6 | 3.00 (2.62−3.43) | 2.84 (2.42−3.35) | ||
| Mono(2-ethyl-5-hydroxyhexyl) phthalate | MEHHP | 0.1 | 97.6 | 1.73 (1.55−1.94) | 1.64 (1.43−1.89) | ||
| Dimethyl phthalate | DMP | Mononmethyl phthalate | MMP | 2.0 | 26.4 | ||
| Di-n-octyl phthalate | DnOP | Mono(3-carboxypropyl) phthalate | MCPP | 0.5 | 12.3 | ||
| Butyl benzyl phthalate | BBzP | Monobenzyl phthalate | MBzP | 0.1 | 45.8 |
| Maternal Characteristics | N = 210 | MnBP a | p | MEP a | p | MiBP a | p | ∑DEHP a | p |
|---|---|---|---|---|---|---|---|---|---|
| Maternal age (years) | 0.328 | 0.130 | 0.021 * | 0.322 | |||||
| 20~24 | 23 | 29.25 | 4.58 | 12.92 | 42.83 | ||||
| 25~29 | 108 | 23.57 | 6.15 | 10.31 | 38.06 | ||||
| 30~34 | 54 | 25.01 | 7.77 | 11.90 | 43.45 | ||||
| 35~40 | 25 | 15.46 | 3.75 | 5.83 | 30.81 | ||||
| Location | 0.011 * | 0.122 | 0.198 | 0.227 | |||||
| Urban | 90 | 19.00 | 5.12 | 9.66 | 37.49 | ||||
| Suburban | 120 | 28.59 | 6.78 | 11.39 | 41.27 | ||||
| Gestational weeks | 0.213 | 0.018 * | 0.537 | 0.298 | |||||
| First trimester | 70 | 19.72 | 8.30 | 11.59 | 40.09 | ||||
| Second trimester | 70 | 27.77 | 6.09 | 10.69 | 43.93 | ||||
| Third trimester | 70 | 24.67 | 4.42 | 9.73 | 35.13 | ||||
| Pre-pregnancy BMI | 0.028 * | 0.061 | 0.009 ** | 0.091 | |||||
| Underweight (<18.5) | 21 | 52.30 | 9.01 | 19.17 | 57.45 | ||||
| Normal (18.5–24.9) | 154 | 23.55 | 5.49 | 9.83 | 36.61 | ||||
| Overweight/Obese (≥25) | 35 | 30.77 | 10.75 | 13.95 | 40.58 | ||||
| Education | <0.01 ** | 0.205 | 0.001 ** | 0.126 | |||||
| High school or less | 73 | 35.33 | 6.44 | 13.06 | 44.83 | ||||
| College | 56 | 24.12 | 7.26 | 12.27 | 40.51 | ||||
| University or more | 81 | 16.83 | 4.95 | 7.95 | 34.84 | ||||
| Occupation | 0.430 | 0.599 | 0.466 | 0.225 | |||||
| Production | 10 | 27.20 | 6.12 | 12.68 | 26.69 | ||||
| Service | 31 | 18.88 | 4.81 | 10.18 | 34.24 | ||||
| Management and technician | 100 | 20.65 | 6.15 | 9.54 | 39.11 | ||||
| Housework | 53 | 29.80 | 7.17 | 12.33 | 46.39 | ||||
| Others | 16 | 45.09 | 4.46 | 12.24 | 43.64 |
| Category | N | MnBP | MEP | MiBP | ∑DEHP b | |||||
|---|---|---|---|---|---|---|---|---|---|---|
| GM a | p | GM a | p | GM a | p | GM a | p | |||
| Food Items | <1 time per day | 113 | 25.95 | 0.291 | 6.35 | 0.513 | 10.90 | 0.656 | 40.54 | 0.662 |
| ≥1 time per day | 97 | 21.92 | 5.59 | 10.30 | 38.56 | |||||
| Bottle water | YES | 98 | 22.44 | 0.430 | 6.53 | 0.393 | 10.40 | 0.757 | 36.70 | 0.210 |
| NO | 112 | 25.47 | 5.64 | 10.81 | 42.33 | |||||
| Tofu | ≤3 times per month | 87 | 23.70 | 0.892 | 6.24 | 0.730 | 10.09 | 0.503 | 39.14 | 0.858 |
| ≥4 times per month | 113 | 24.23 | 5.86 | 11.00 | 39.95 | |||||
| Pickle | <1 time per month | 125 | 23.59 | 0.785 | 5.96 | 0.916 | 11.14 | 0.351 | 37.64 | 0.274 |
| ≥1 time per month | 85 | 24.66 | 6.08 | 9.88 | 42.73 | |||||
| Edible seaweed | YES | 125 | 21.62 | 0.146 | 8.00 | 0.008 ** | 12.45 | 0.035 * | 42.82 | 0.515 |
| NO | 85 | 21.81 | 4.94 | 9.51 | 37.55 | |||||
| Milk | ≤4 times per week | 109 | 28.54 | 0.023 * | 6.70 | 0.210 | 11.99 | 0.043 * | 40.80 | 0.590 |
| ≥5 times per week | 101 | 19.89 | 5.34 | 9.30 | 38.37 | |||||
| Yogurt | ≤1 times per week | 100 | 24.05 | 0.985 | 6.15 | 0.804 | 10.10 | 0.458 | 41.95 | 0.339 |
| ≥2 times per week | 110 | 23.98 | 5.88 | 11.10 | 37.62 | |||||
| Pork | ≤2 times per week | 75 | 28.21 | 0.133 | 7.96 | 0.020 * | 11.40 | 0.403 | 39.83 | 0.944 |
| >2 times per week | 135 | 21.98 | 5.14 | 10.21 | 39.50 | |||||
| Processed meat | ≤3 times per month | 168 | 24.90 | 0.364 | 5.61 | 0.120 | 10.51 | 0.745 | 38.38 | 0.264 |
| ≥4 times per month | 42 | 20.77 | 7.95 | 11.06 | 45.00 | |||||
| Marine fish | <1 time per week | 100 | 25.38 | 0.224 | 6.89 | 0.042* | 11.52 | 0.139 | 42.14 | 0.229 |
| ≥1 times per week | 110 | 24.18 | 5.17 | 9.99 | 36.73 | |||||
| Freshwater fish | <1 time per month | 145 | 26.19 | 0.102 | 6.40 | 0.297 | 11.19 | 0.213 | 42.77 | 0.053 |
| ≥1 times per month | 65 | 19.76 | 5.22 | 9.44 | 33.36 | |||||
| Egg | <1 time per day | 68 | 25.82 | 0.531 | 6.22 | 0.792 | 11.48 | 0.394 | 45.33 | 0.676 |
| ≥1 times per day | 142 | 23.20 | 5.91 | 10.23 | 38.98 | |||||
| Icecream | <1 time per month | 177 | 23.52 | 0.543 | 5.96 | 0.841 | 10.57 | 0.886 | 39.33 | 0.764 |
| ≥1 time per month | 33 | 26.88 | 6.27 | 10.84 | 41.22 | |||||
| Characteristic | MnBP | p | MEP | p | MiBP | p | ∑DEHP a | p |
|---|---|---|---|---|---|---|---|---|
| Adjusted Model | ß (95% CI) | ß(95%CI) | ß (95% CI) | ß (95% CI) | ||||
| Maternal age | 0.014 (−0.091~0.110) | 0.851 | 0.112 (−0.029~0.199) | 0.144 | −0.019 (−0.090~0.069) | 0.801 | 0.069 (−0.038~0.100) | 0.378 |
| Location | 0.106 (−0.042~0.271) | 0.150 | 0.107 (−0.047~0.309) | 0.148 | 0.056 (−0.077~0.171) | 0.457 | 0.139 (−0.008~0.208) | 0.068 |
| Gestational age | 0.128 (−0.014~0.175) | 0.096 | −0.154 (−0.014~1.359) | 0.055 | −0.047 (−0.098~0.052) | 0.543 | −0.135 (−0.118~0.010) | 0.096 |
| Pre-pregnancy BMI | −0.104 (−0.294~0.047) | 0.155 | 0.041 (−0.139~0.249) | 0.575 | −0.067 (−0.197~0.073) | 0.365 | −0.127 (−0.217~−0.017) | 0.094 |
| Education level | −0.223 (−0.227~−0.041) | 0.005 ** | −0.085 (−0.164~0.048) | 0.283 | −0.221 (−0.177~−0.029) | 0.006 ** | −0.093 (−0.104~0.026) | 0.241 |
| Milk consumption | −0.145 (−0.302~−0.006) | 0.060 | −0.047 (−0.229~0.121) | 0.541 | −0.115 (−0.214~0.031) | 0.141 | 0.058 (−0.066~0.146) | 0.482 |
| Pork consumption | −0.071 (−0.232~0.082) | 0.346 | −0.090 (−0.285~0.071) | 0.238 | 0.019 (−0.109~0.140) | 0.804 | 0.055 (−0.069~0.146) | 0.705 |
| Marine fish consumption | 0.006 (−0.150~0.161) | 0.940 | −0.092 (−0.283~0.070) | 0.235 | −0.003 (−0.126~0.121) | 0.970 | −0.012 (−0.115~0.099) | 0.882 |
| Edible seaweed consumption | 0.130 (−0.016~0.286) | 0.076 | 0.209 (0.073~0.416) | 0.005 * | 0.191 (0.035~0.274) | 0.012 * | 0.158 (0.006~0.213) | 0.039 * |
© 2019 by the authors. Licensee MDPI, Basel, Switzerland. This article is an open access article distributed under the terms and conditions of the Creative Commons Attribution (CC BY) license (http://creativecommons.org/licenses/by/4.0/).
Share and Cite
He, X.; Zang, J.; Liao, P.; Zheng, Y.; Lu, Y.; Zhu, Z.; Shi, Y.; Wang, W. Distribution and Dietary Predictors of Urinary Phthalate Metabolites among Pregnant Women in Shanghai, China. Int. J. Environ. Res. Public Health 2019, 16, 1366. https://doi.org/10.3390/ijerph16081366
He X, Zang J, Liao P, Zheng Y, Lu Y, Zhu Z, Shi Y, Wang W. Distribution and Dietary Predictors of Urinary Phthalate Metabolites among Pregnant Women in Shanghai, China. International Journal of Environmental Research and Public Health. 2019; 16(8):1366. https://doi.org/10.3390/ijerph16081366
Chicago/Turabian StyleHe, Xin, Jiajie Zang, Ping Liao, Yang Zheng, Ye Lu, Zhenni Zhu, Yan Shi, and Wenjing Wang. 2019. "Distribution and Dietary Predictors of Urinary Phthalate Metabolites among Pregnant Women in Shanghai, China" International Journal of Environmental Research and Public Health 16, no. 8: 1366. https://doi.org/10.3390/ijerph16081366
APA StyleHe, X., Zang, J., Liao, P., Zheng, Y., Lu, Y., Zhu, Z., Shi, Y., & Wang, W. (2019). Distribution and Dietary Predictors of Urinary Phthalate Metabolites among Pregnant Women in Shanghai, China. International Journal of Environmental Research and Public Health, 16(8), 1366. https://doi.org/10.3390/ijerph16081366