An Ensemble Classifier with Case-Based Reasoning System for Identifying Internet Addiction


Abstract
1. Introduction
2. Related Work
3. Methodology
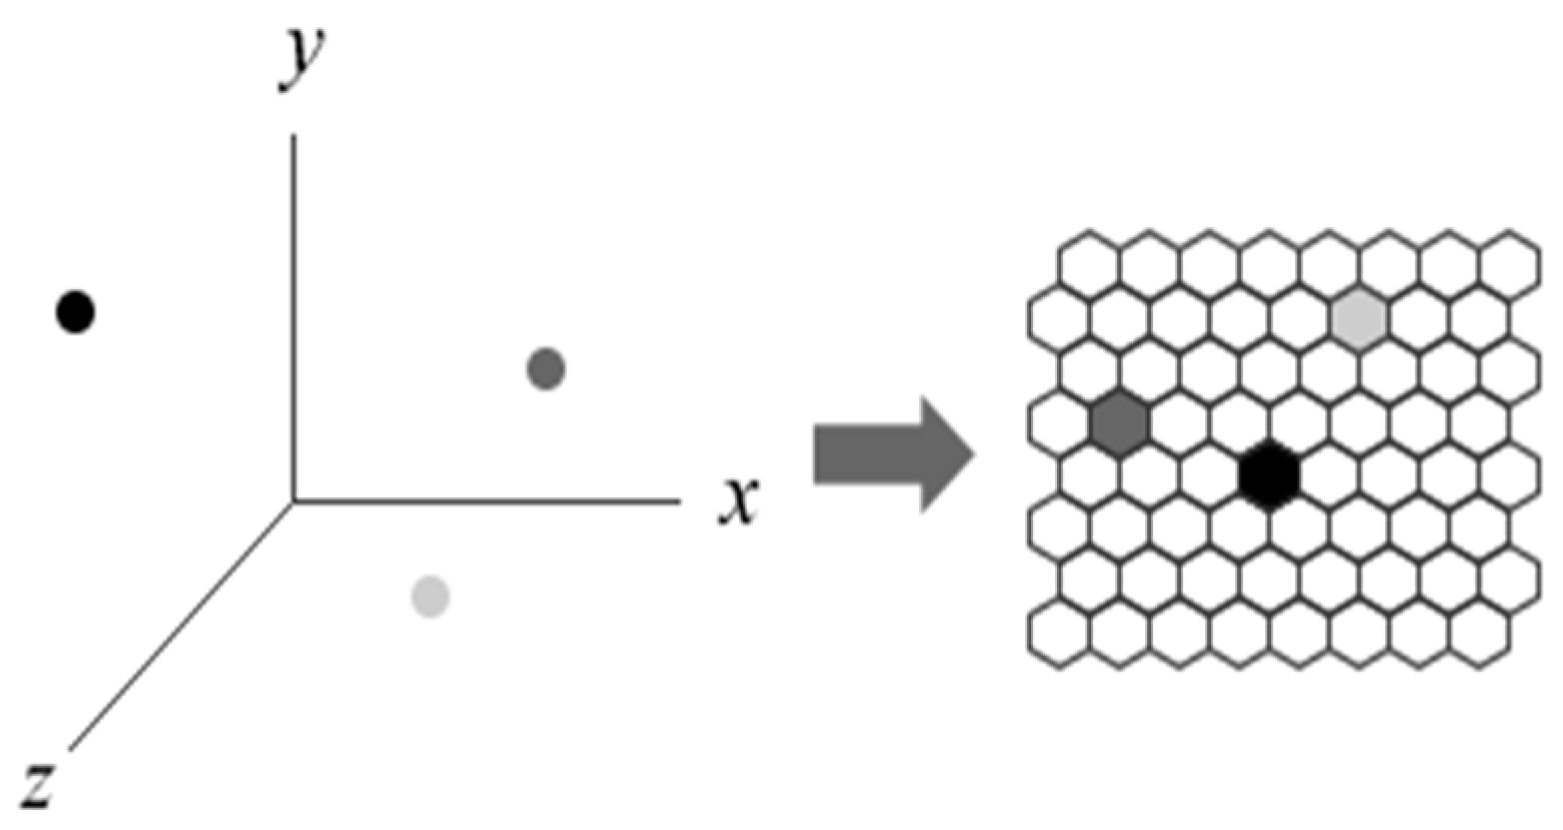
3.1. SOM
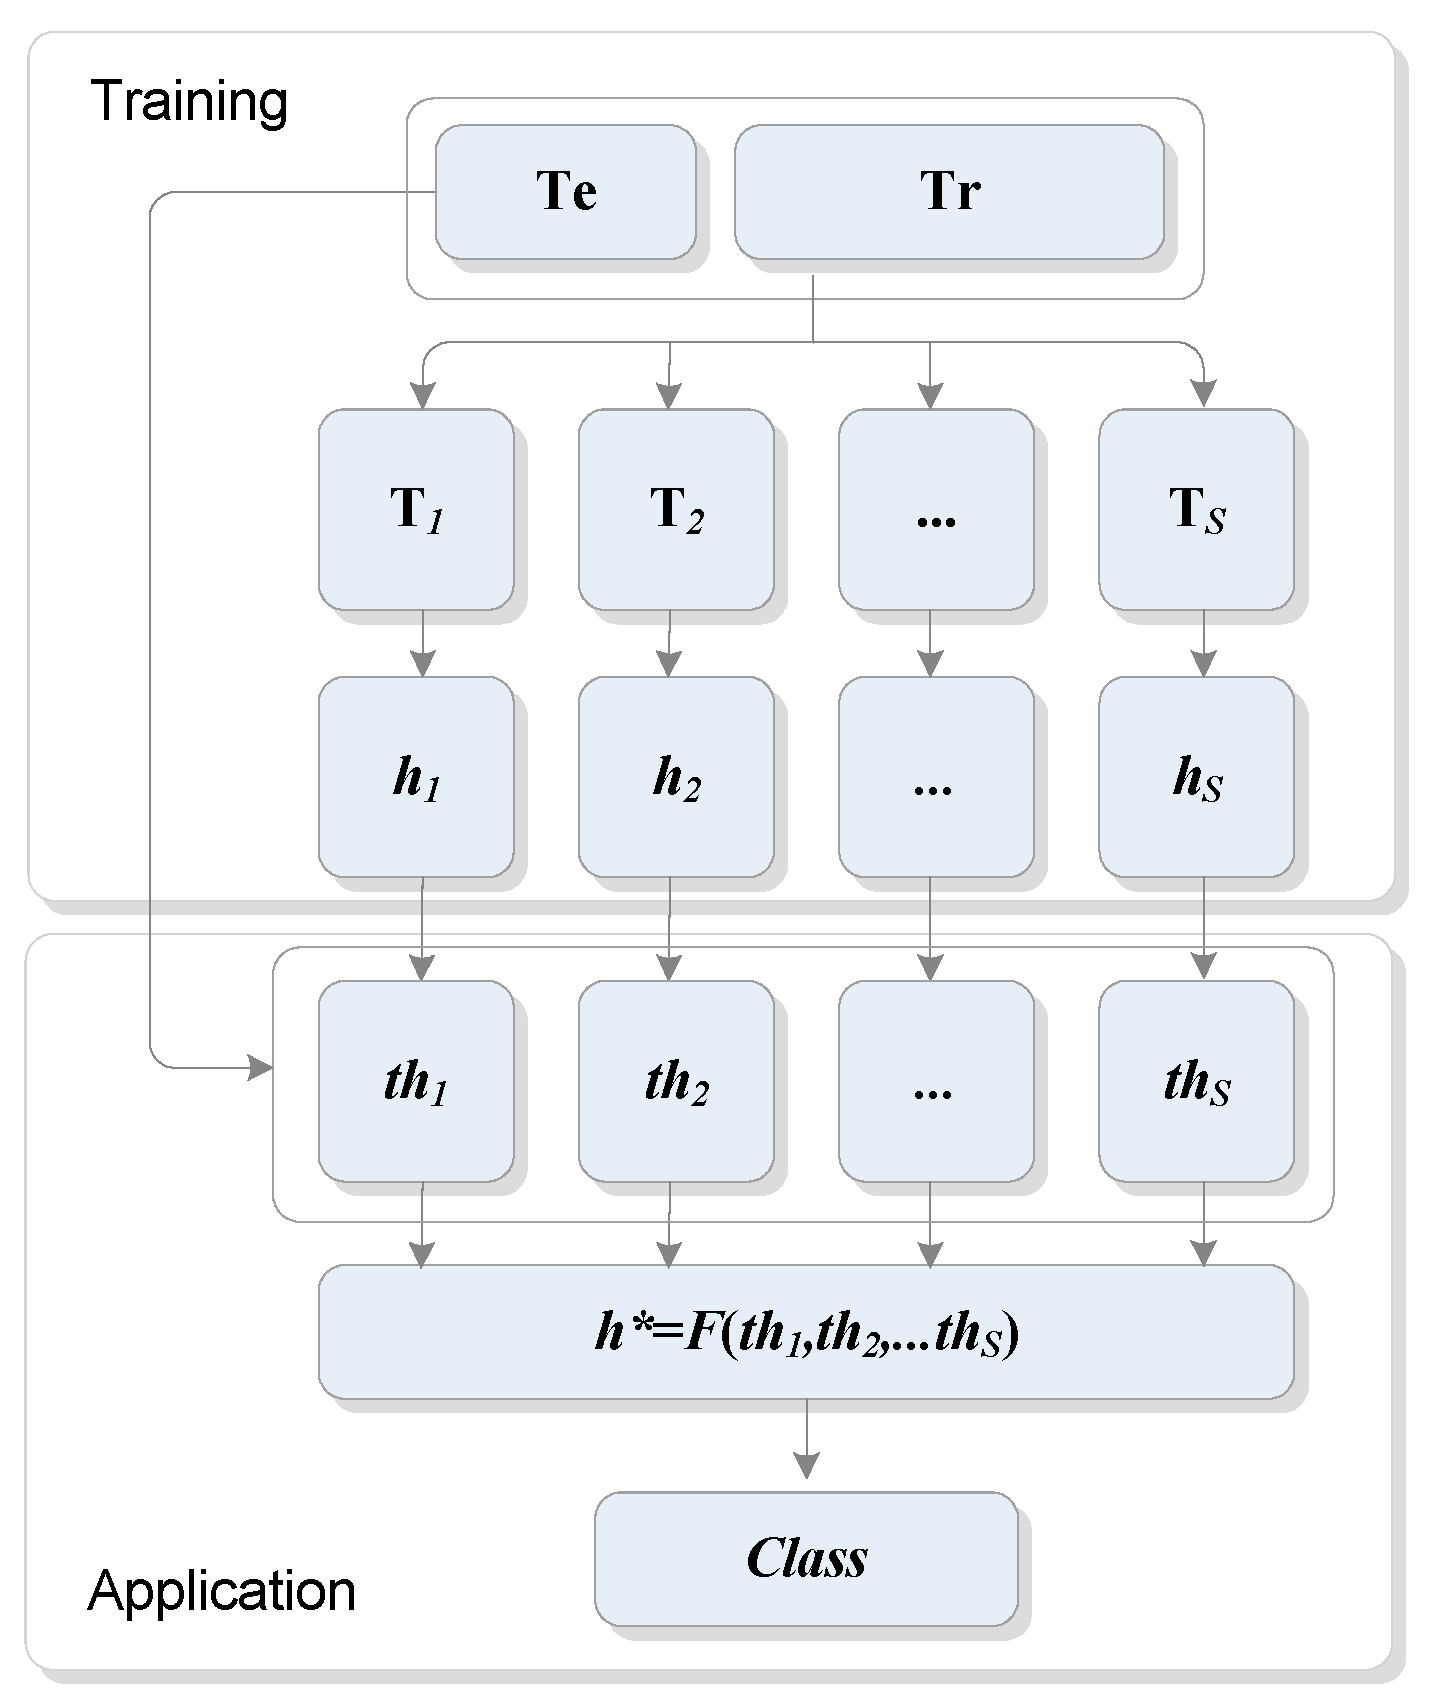
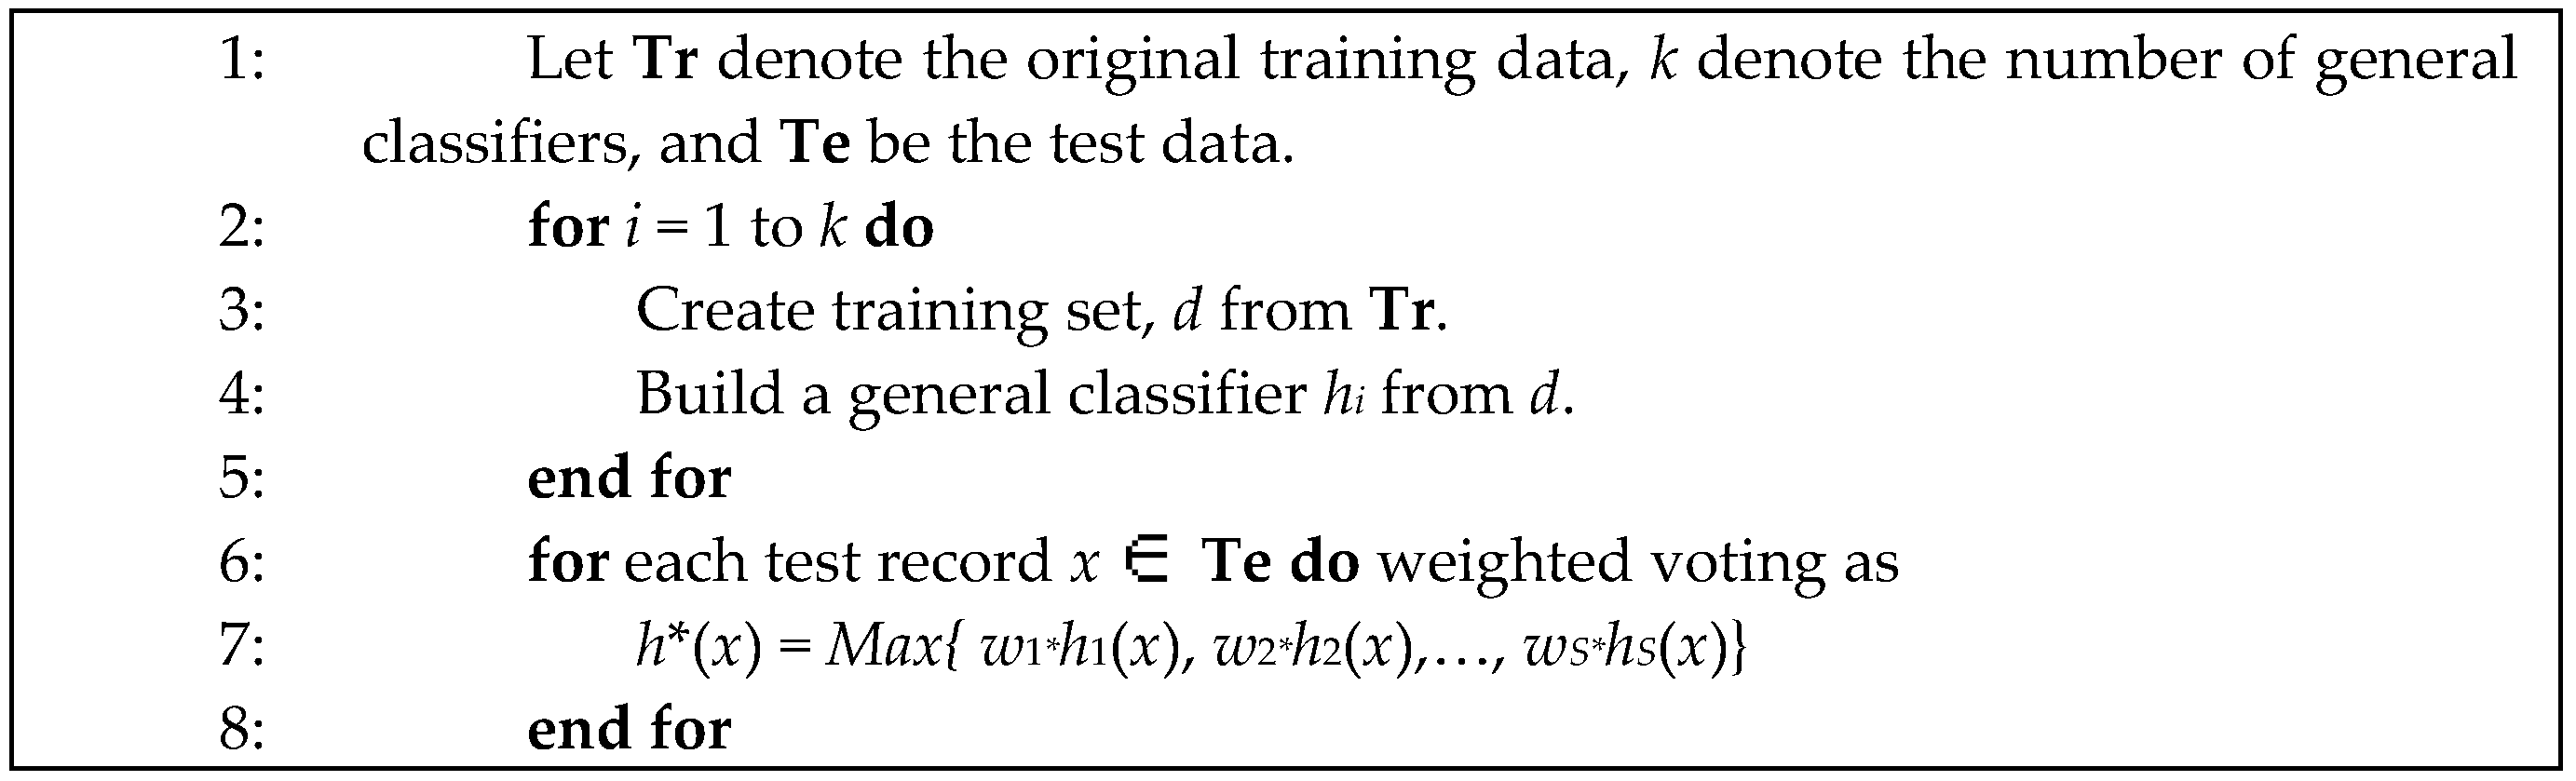
3.2. Ensemble Classifier
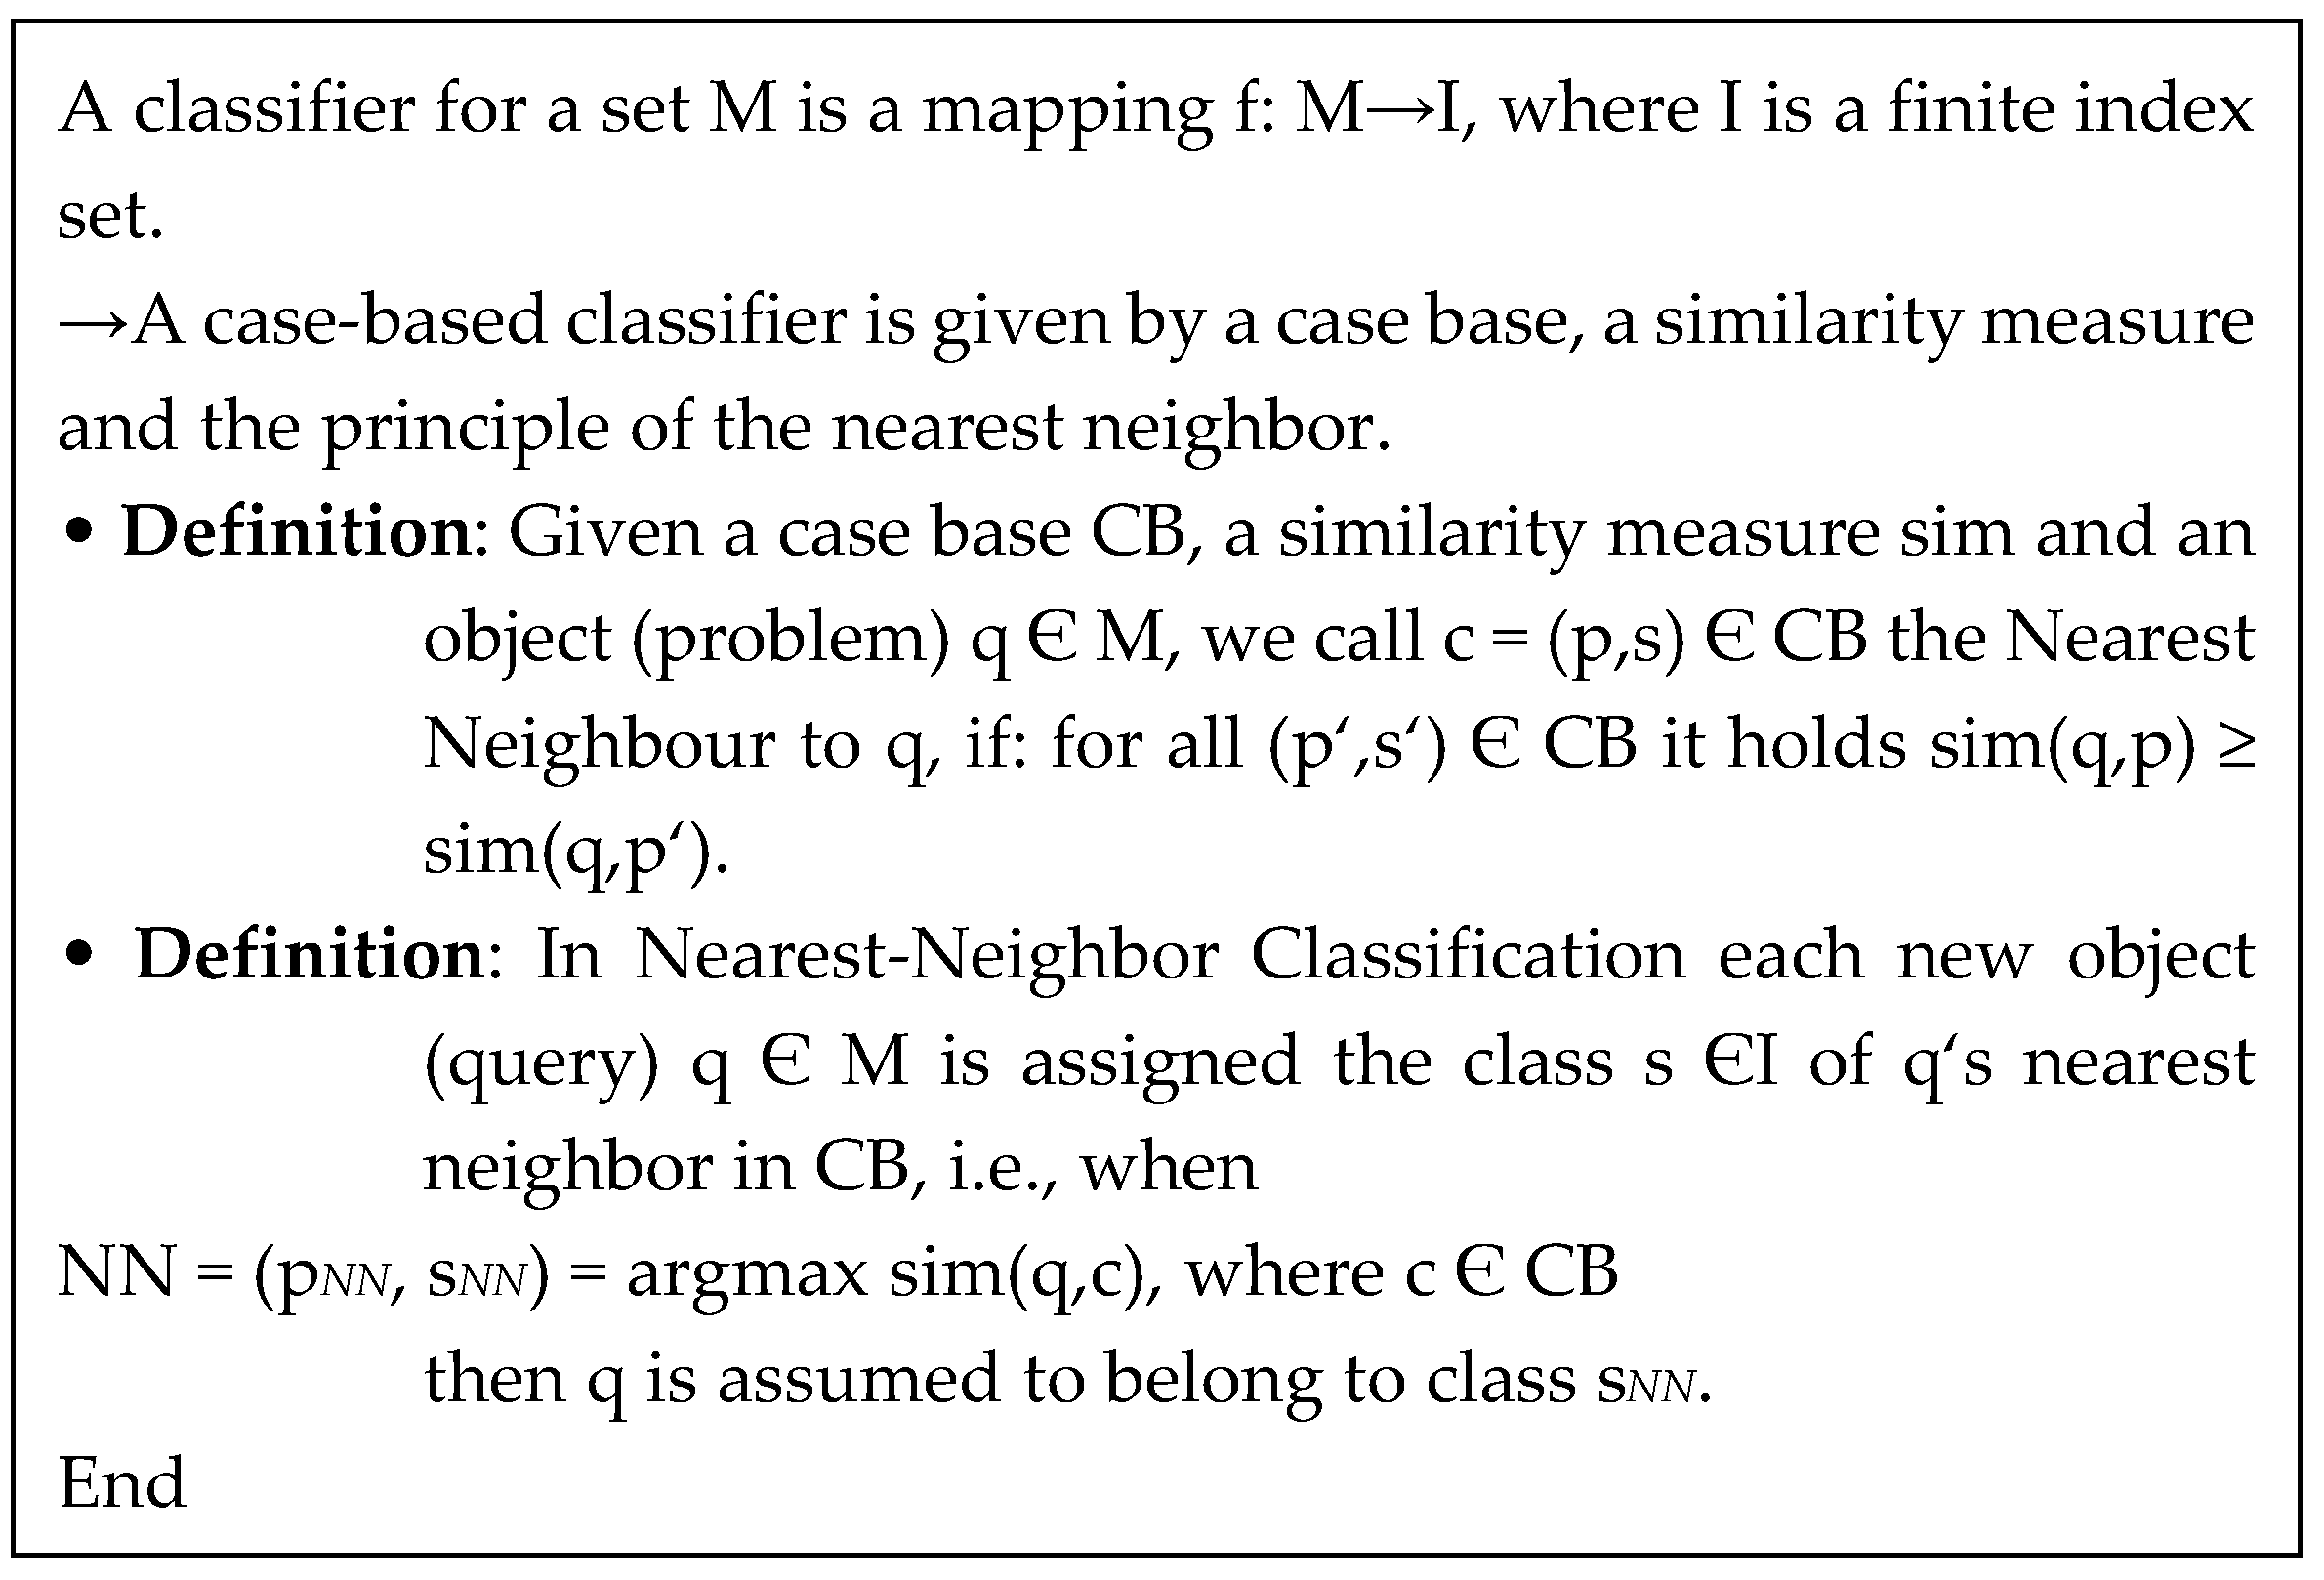
3.3. Case Based Reasoning
- (1)
- Retrieve the most similar case(s) from the case library;
- (2)
- Reuse them, and more properly apply existing solutions, to solve the new problem;
- (3)
- Revise the proposed solution;
- (4)
- Retain the current case in the library for future problem solving.
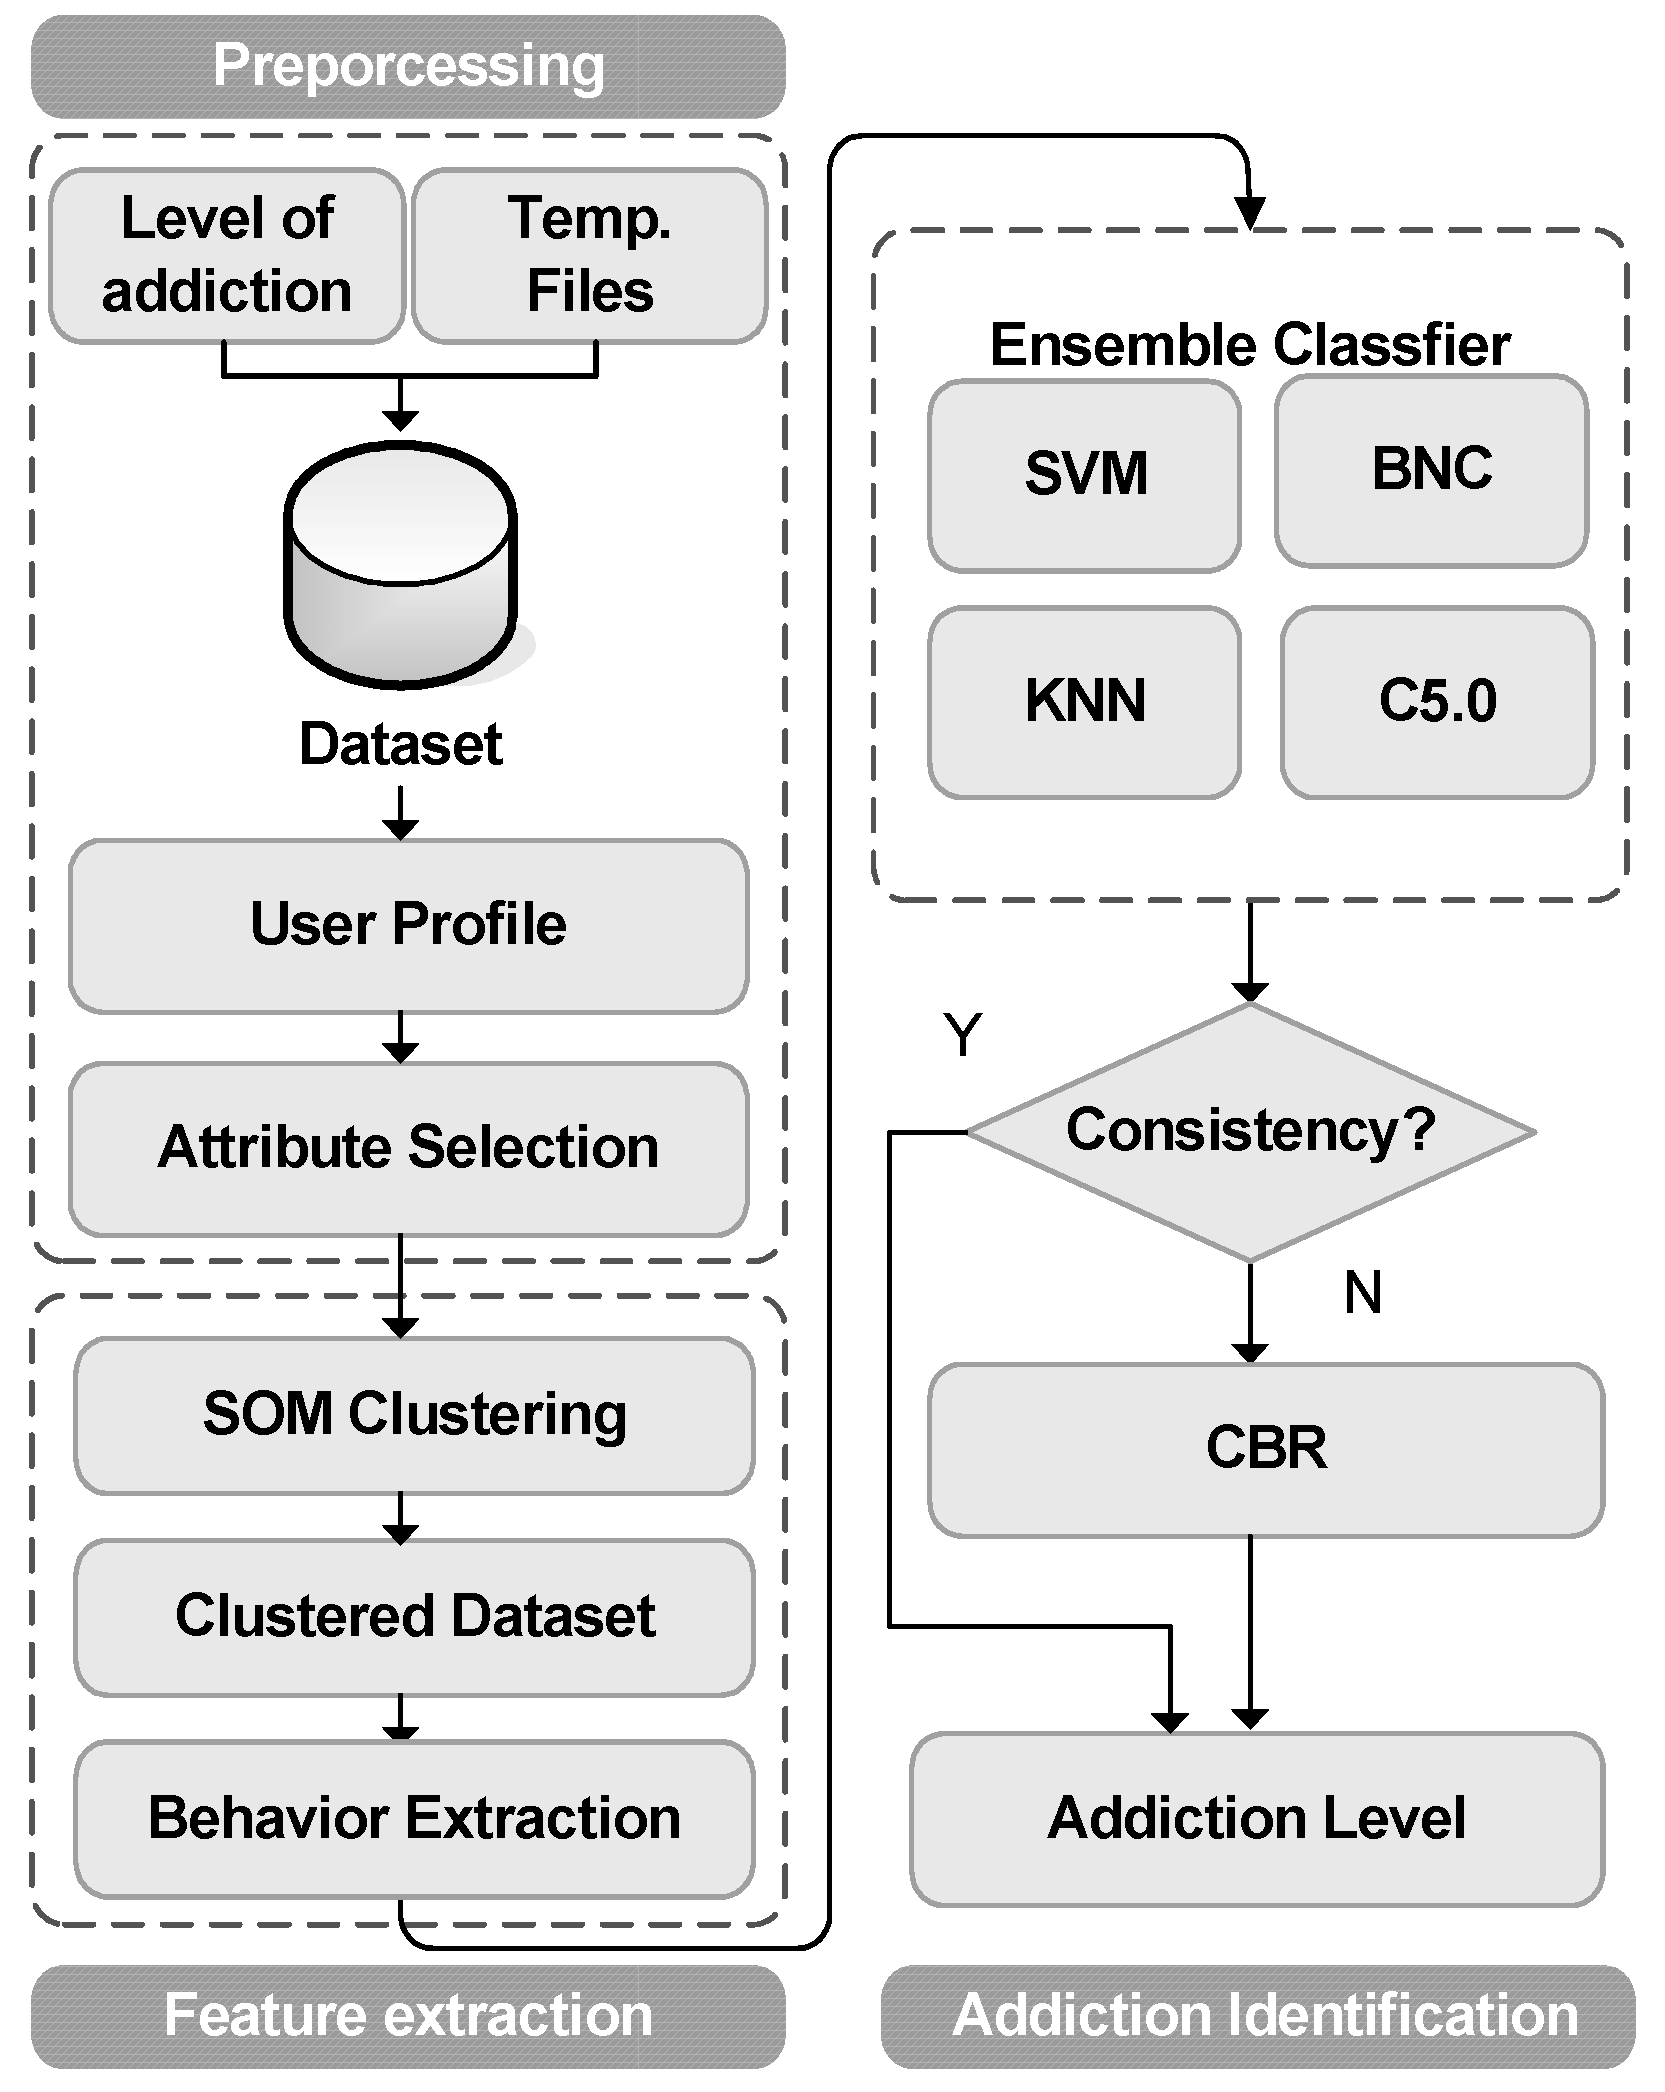
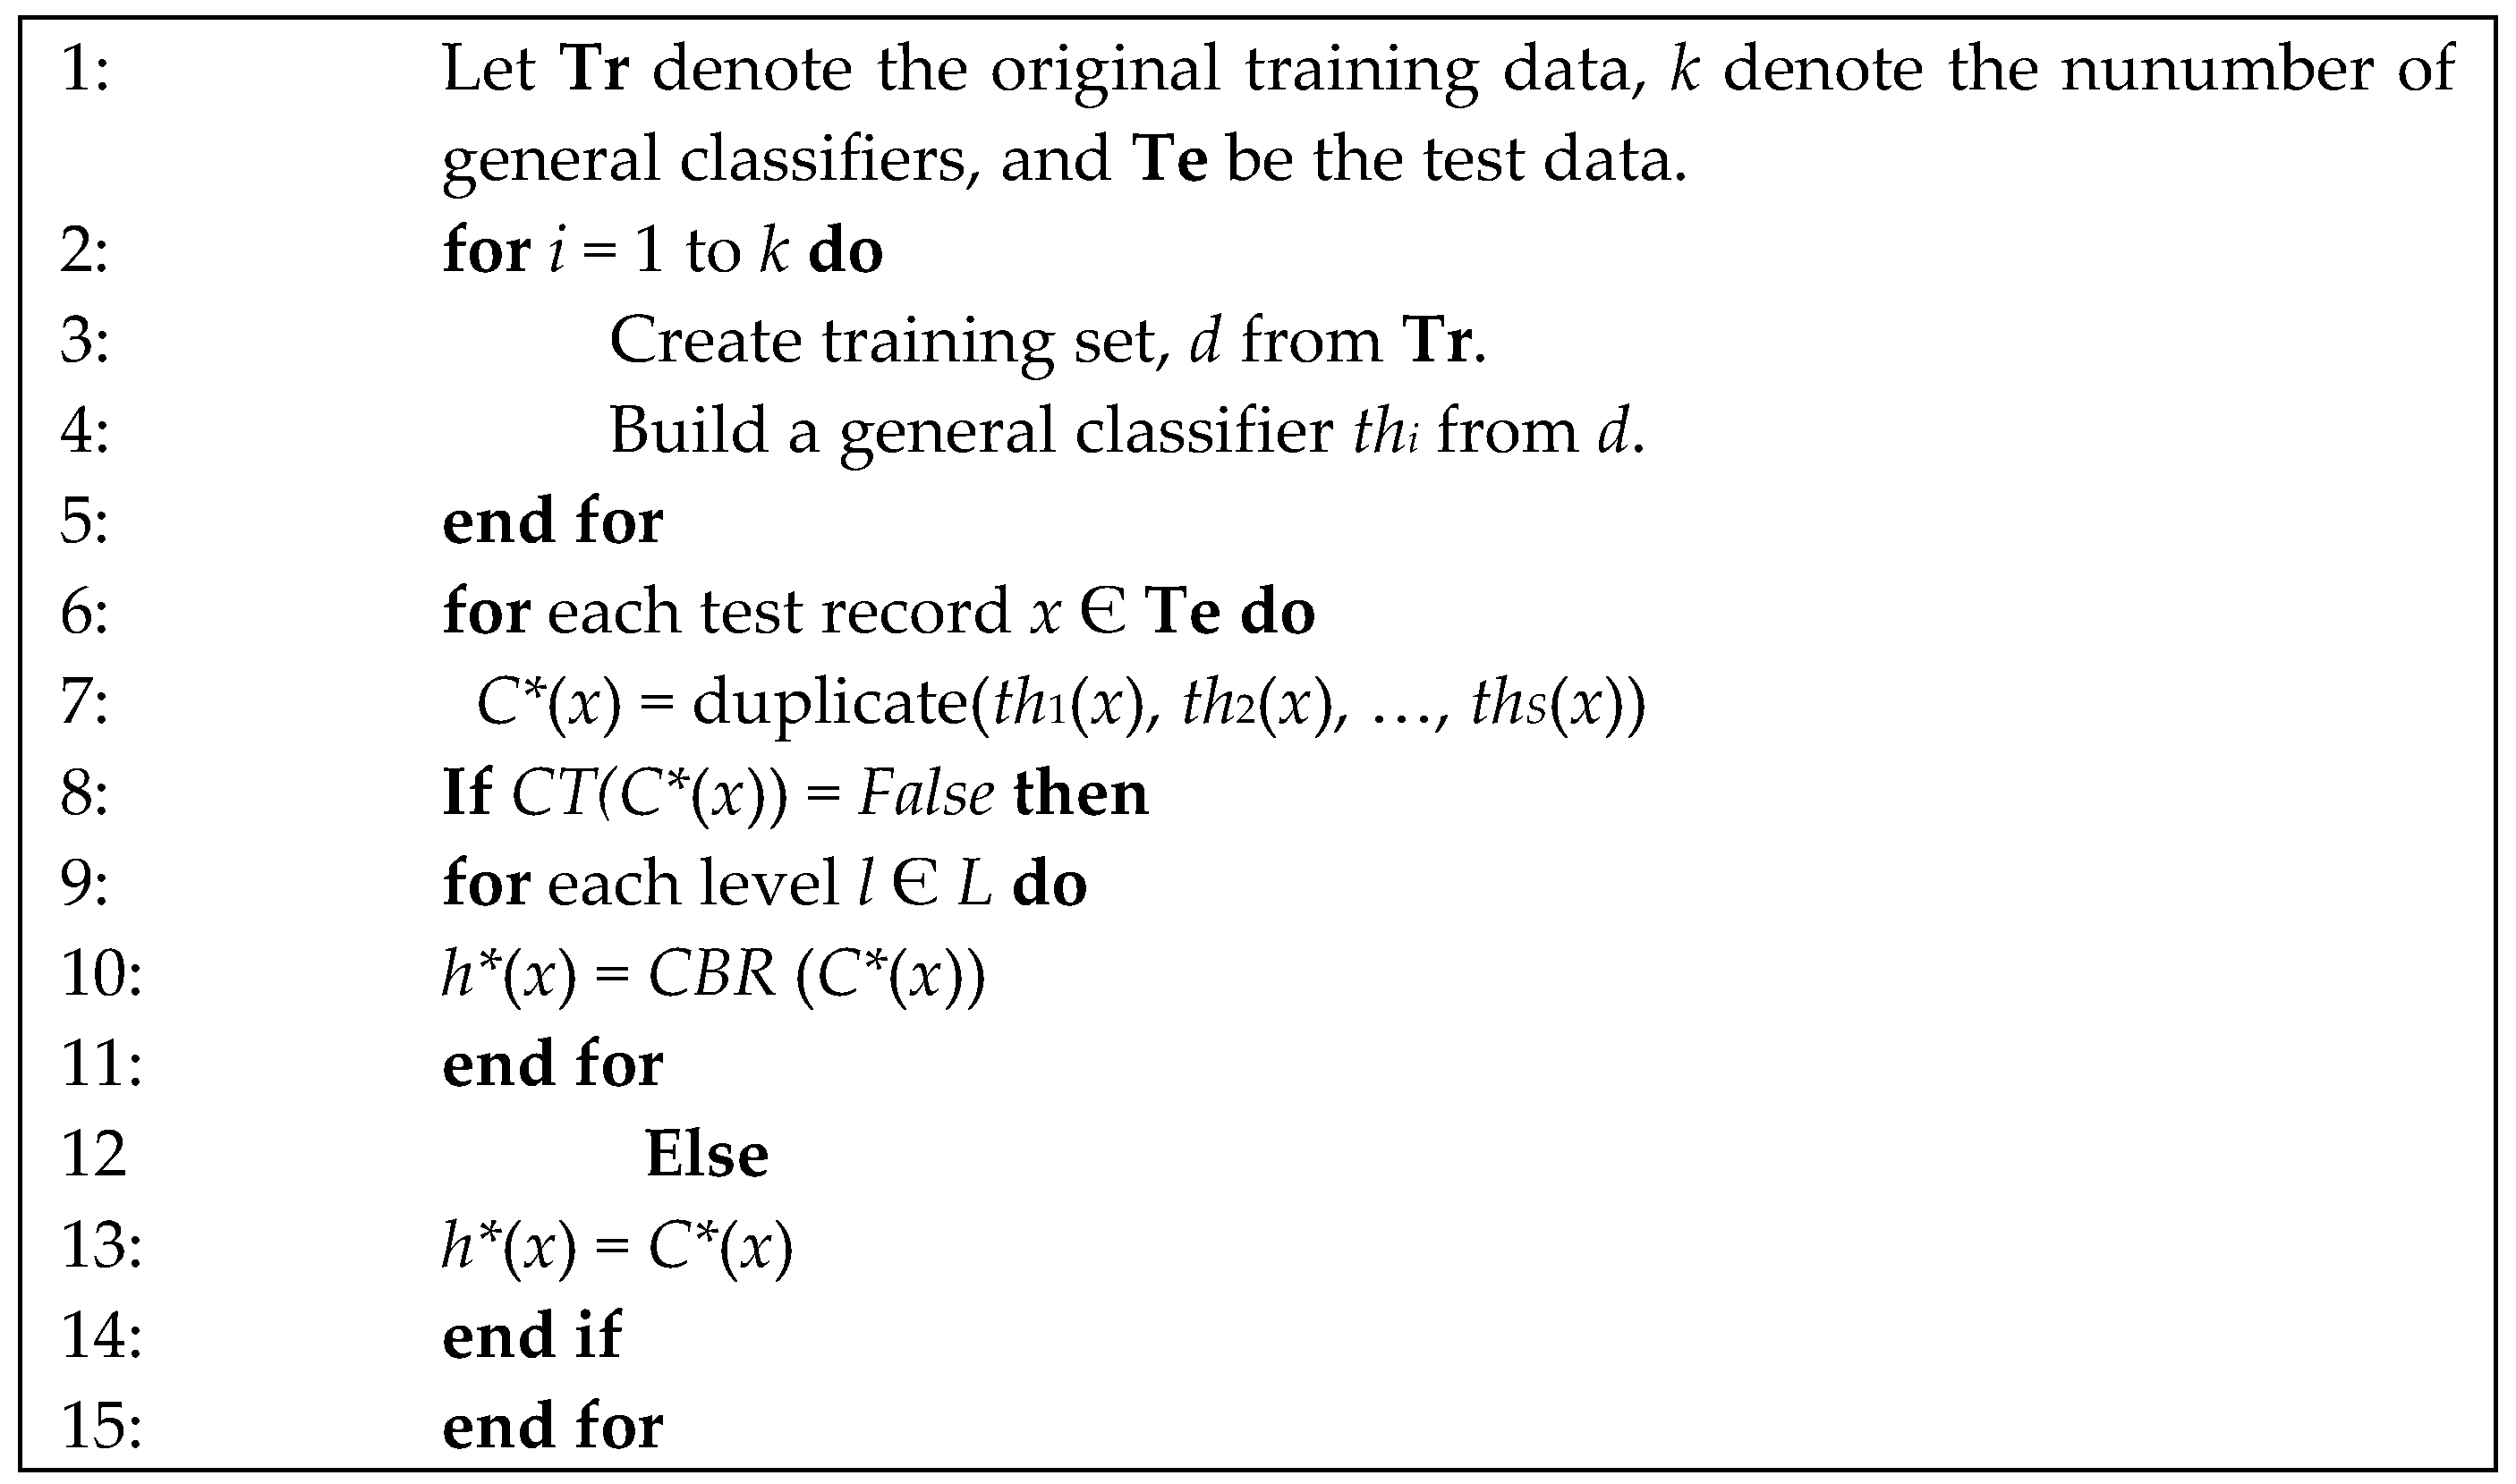
3.4. Addiction Identifying by Ensemble Classifier with CBR
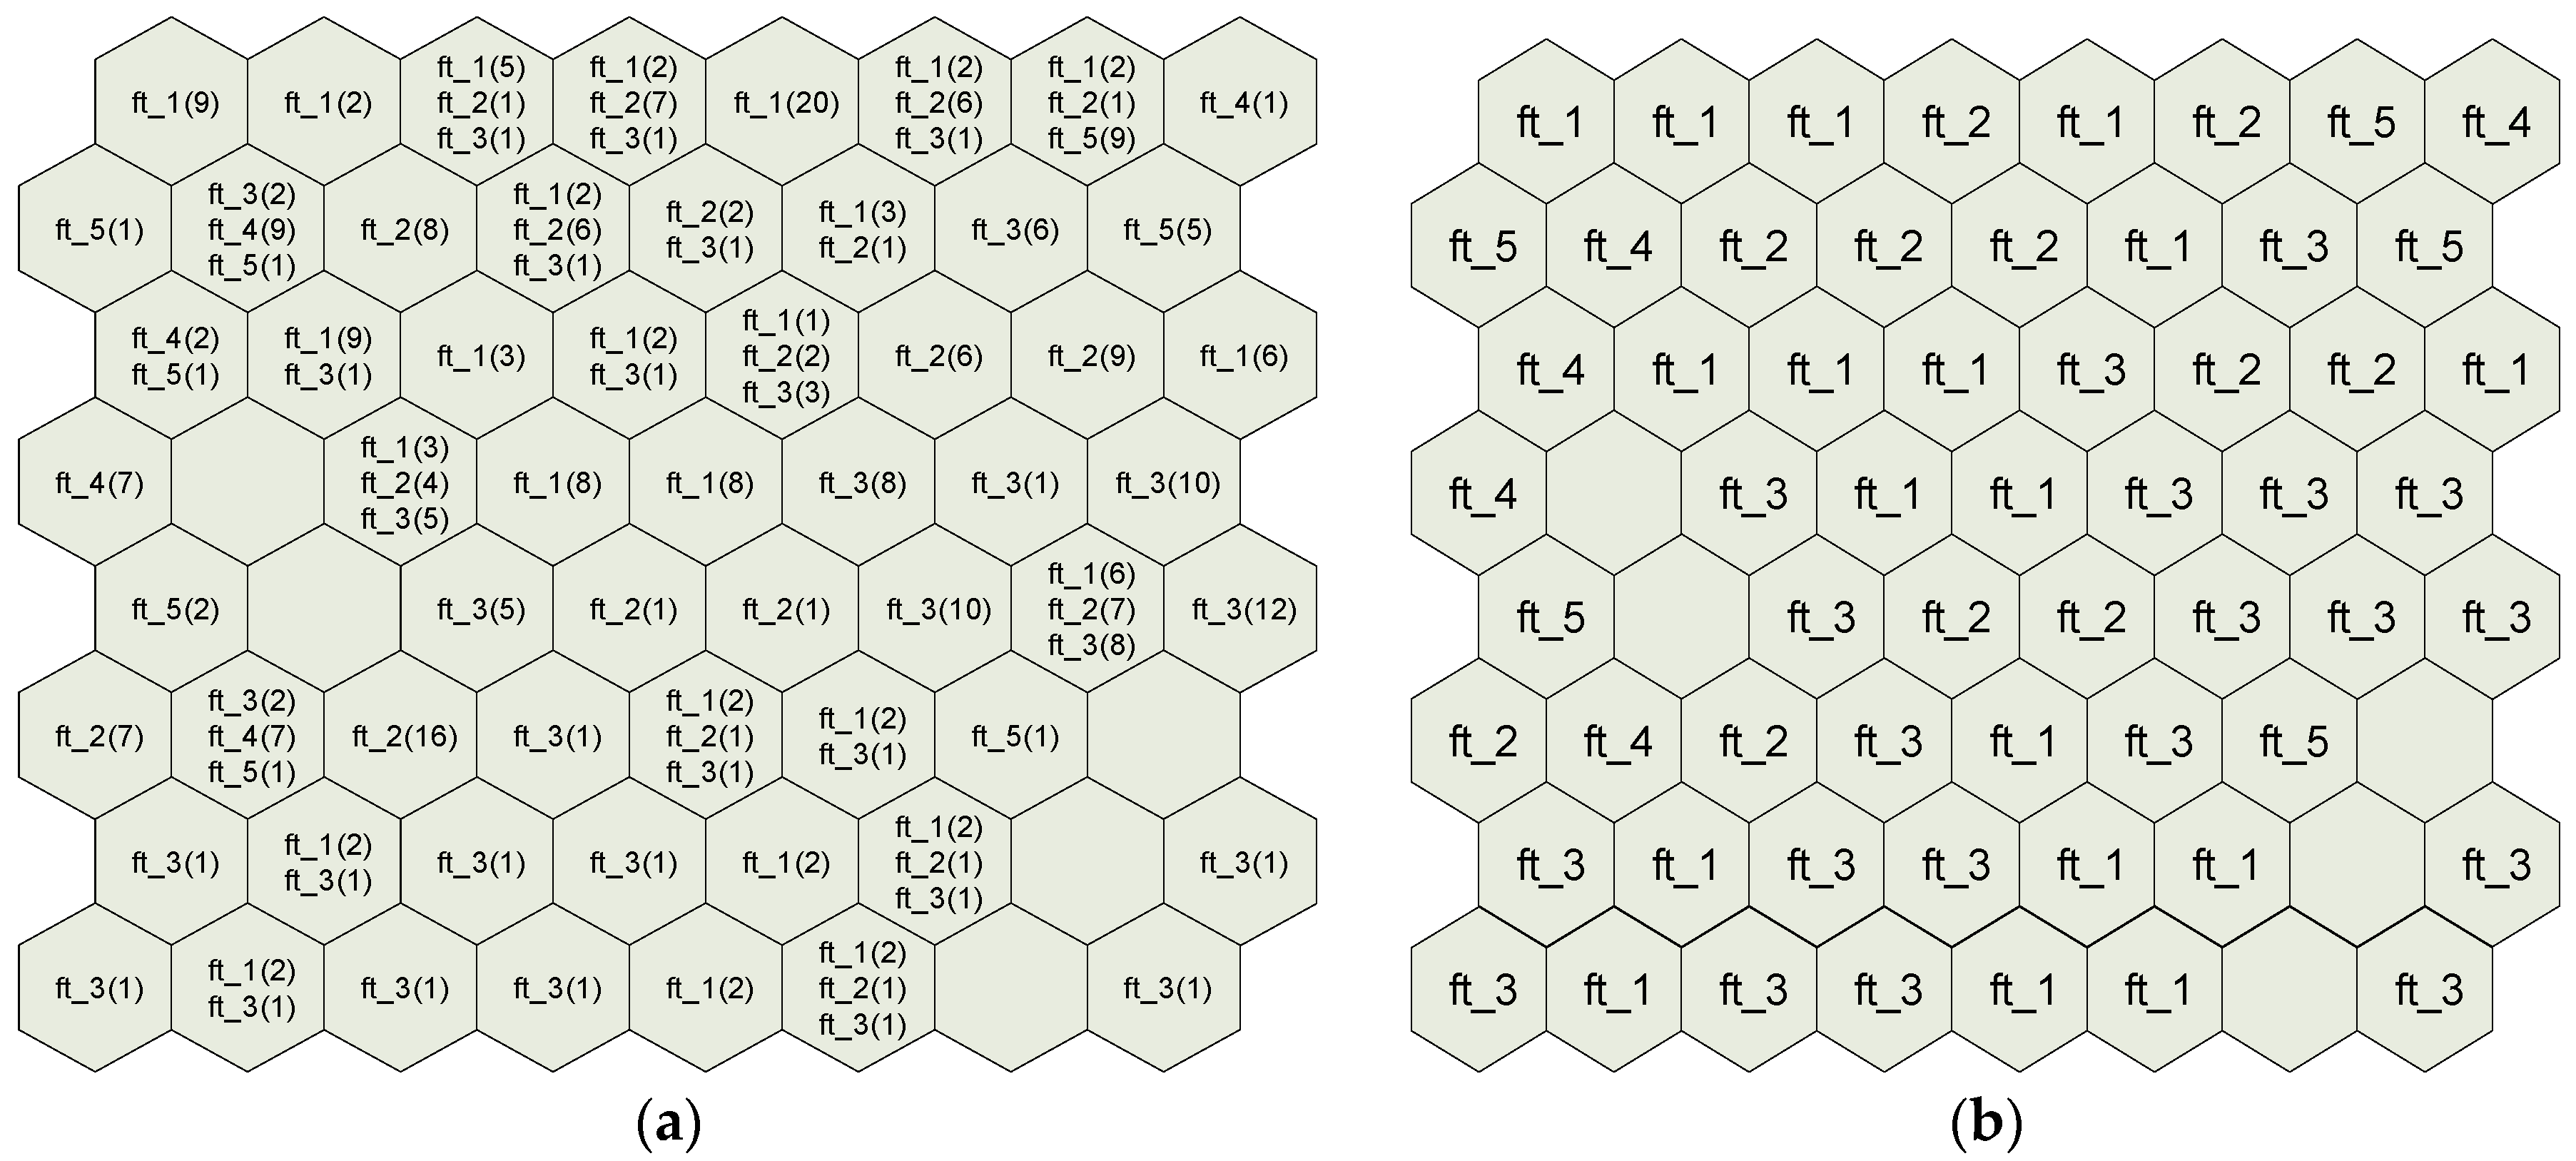
3.5. Feature Extraction of Internet Behaviors
Cell(i,j) = File_type*
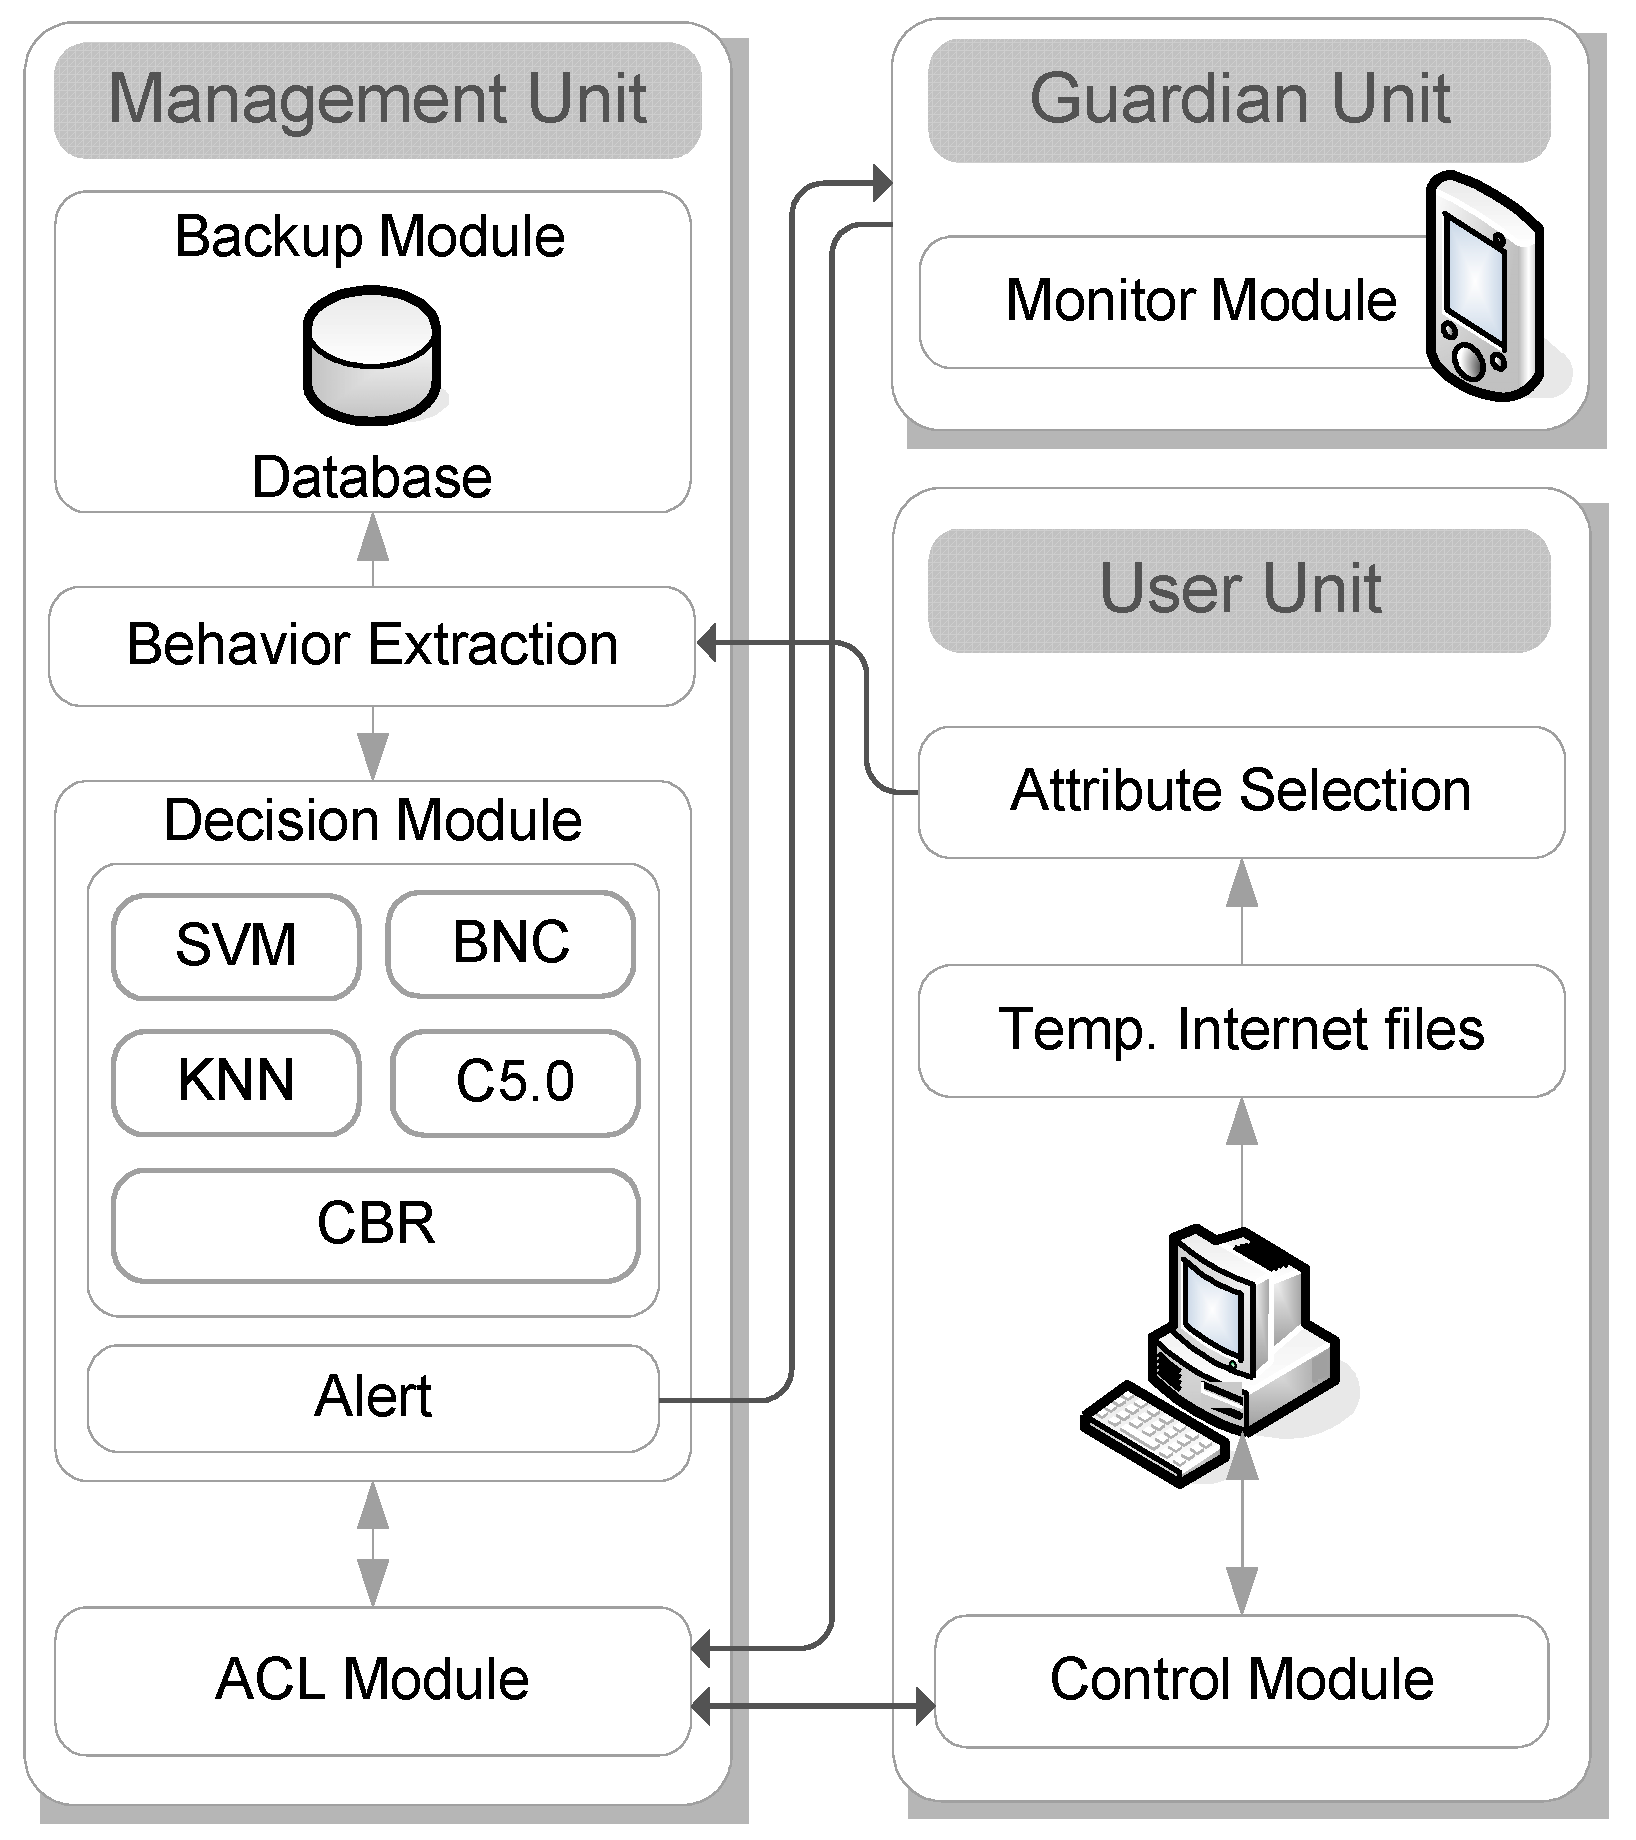
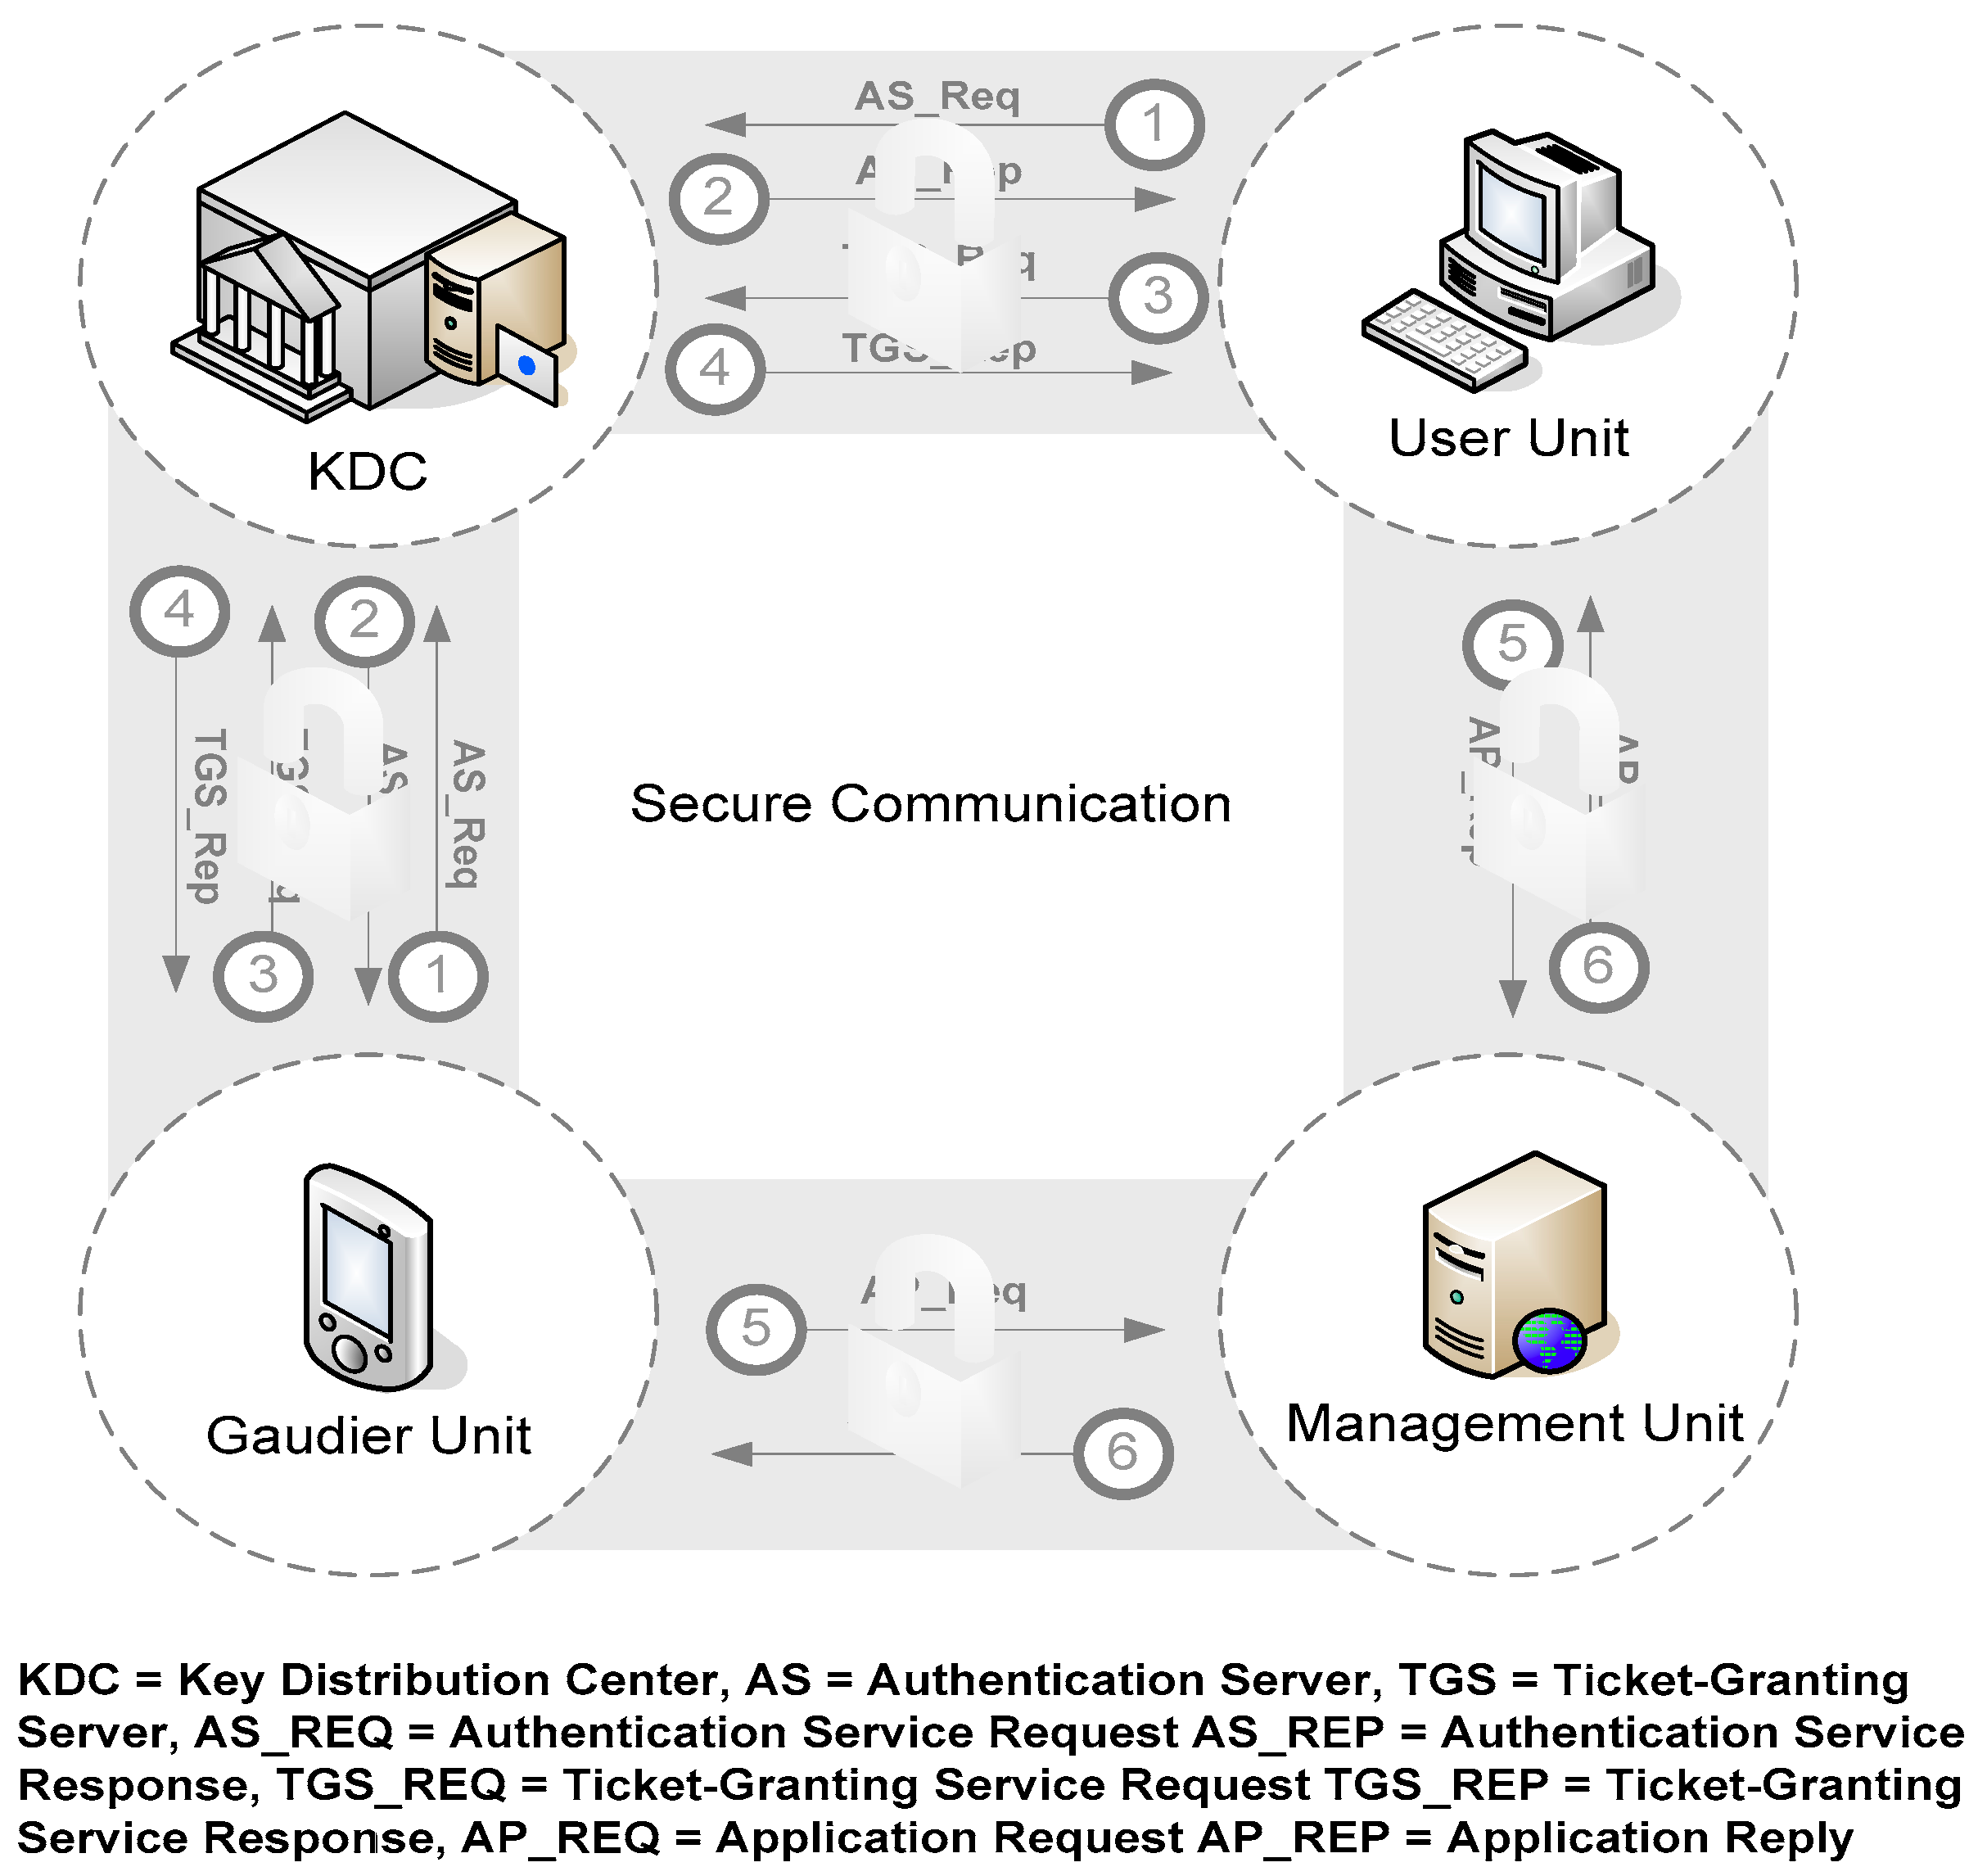
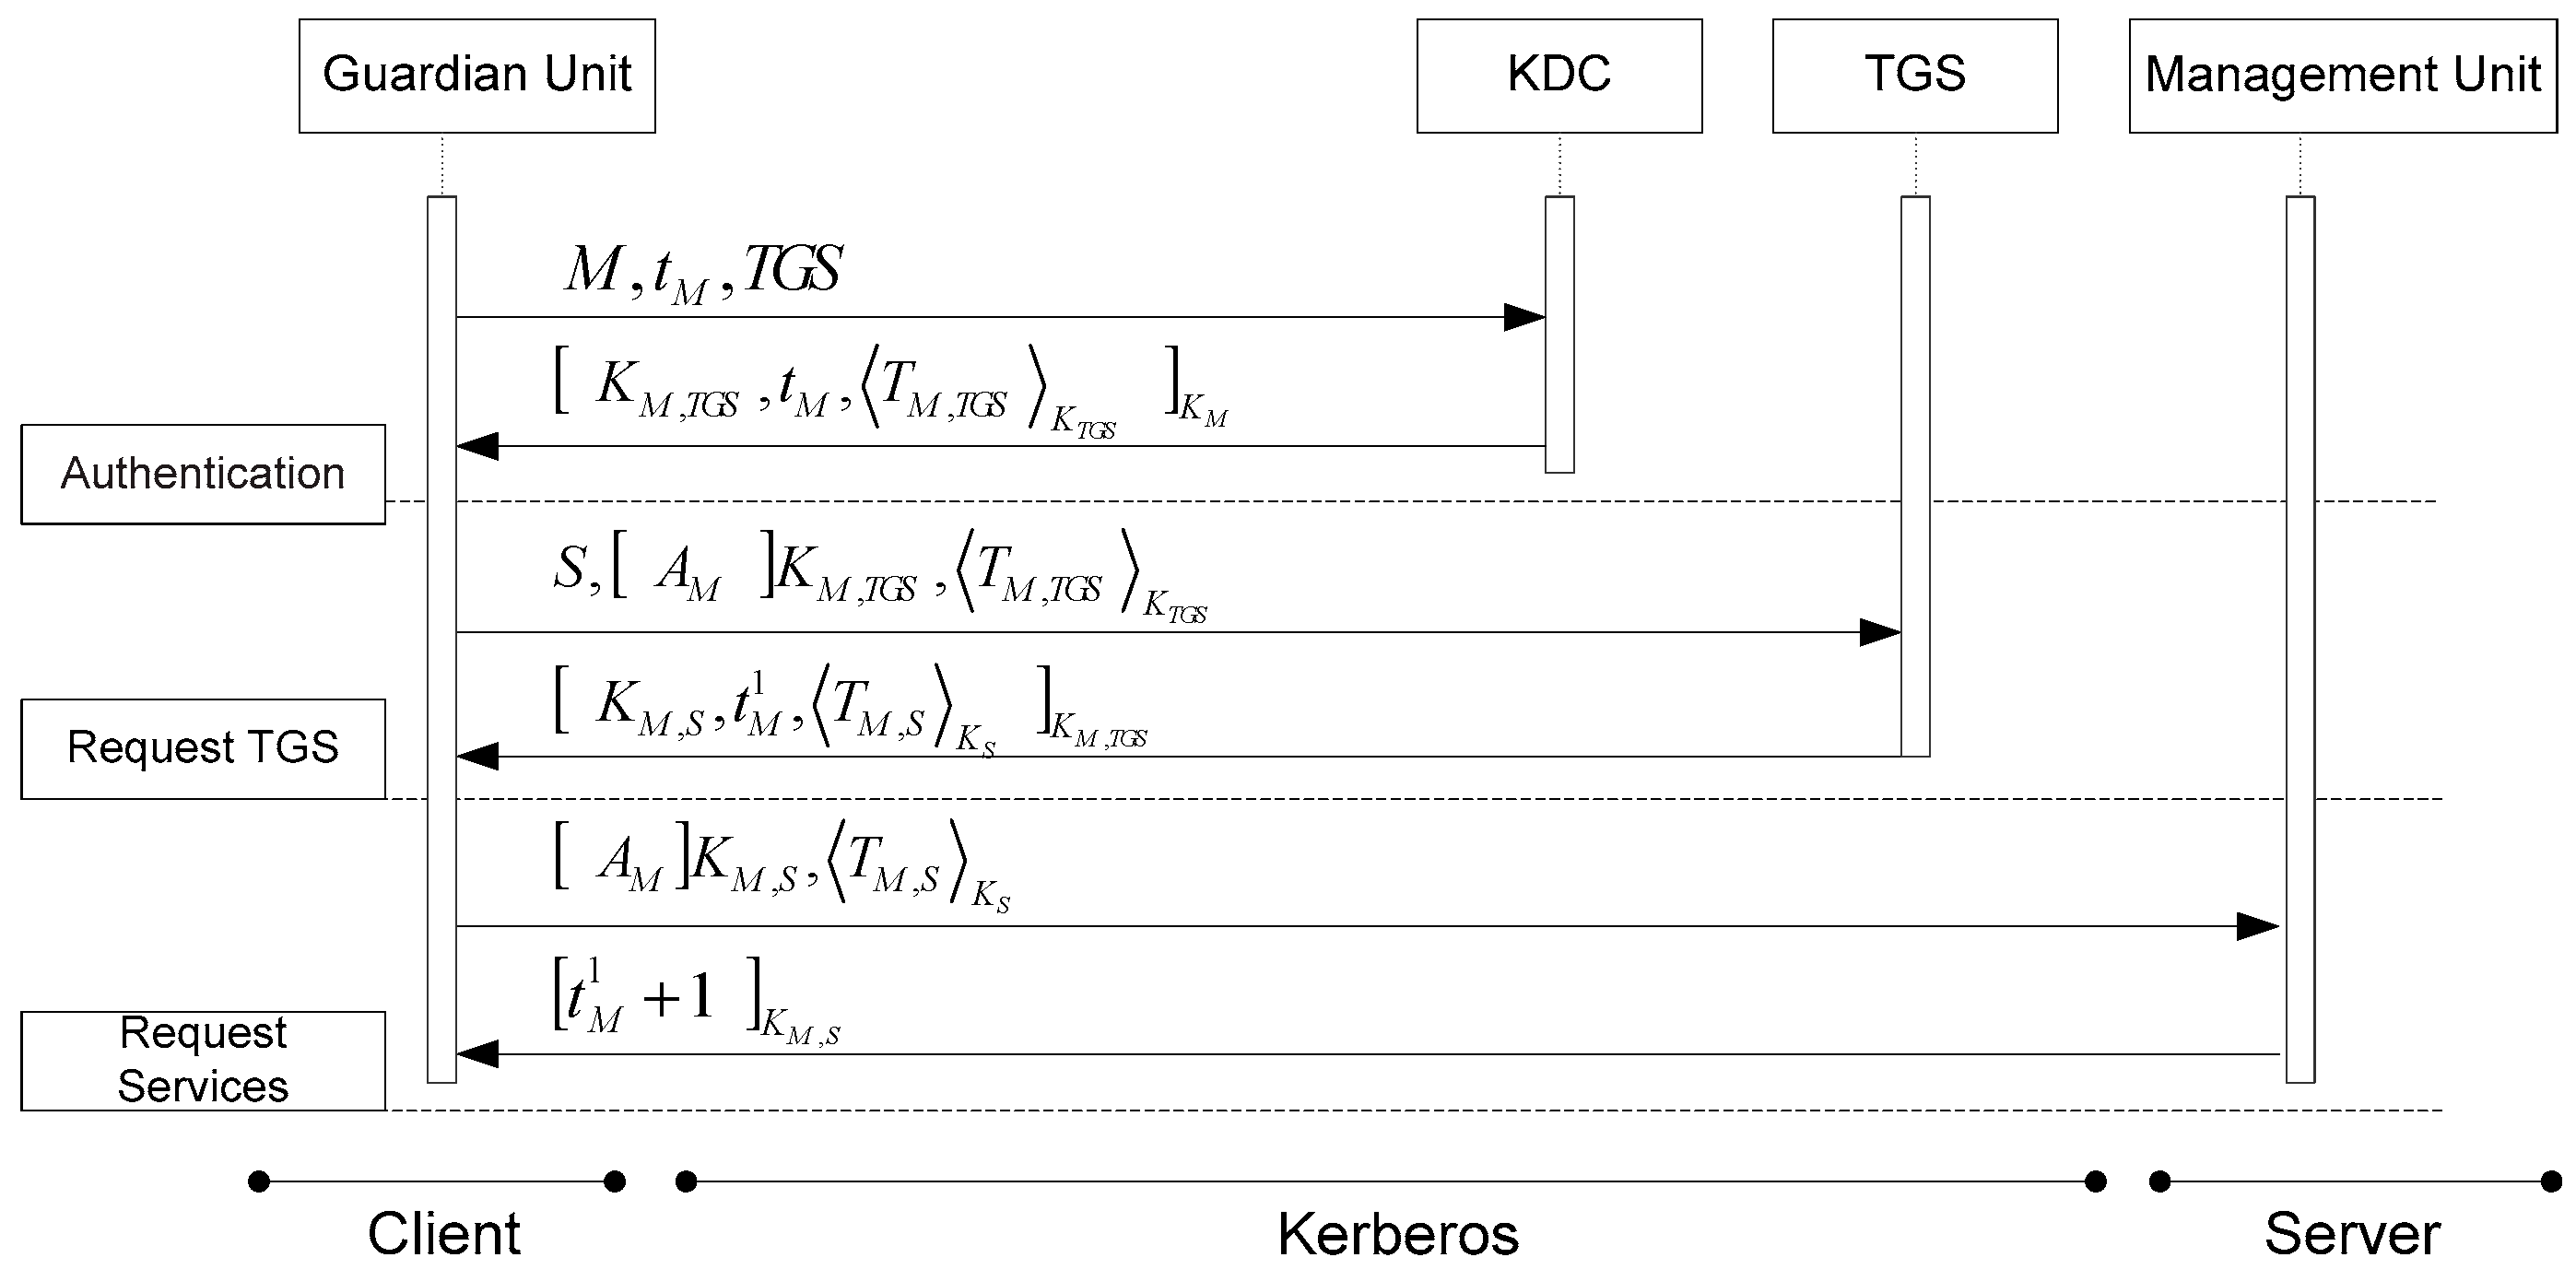
4. EMBAR System Overview
4.1. Management Unit
4.2. Guardian Unit
4.3. User Unit
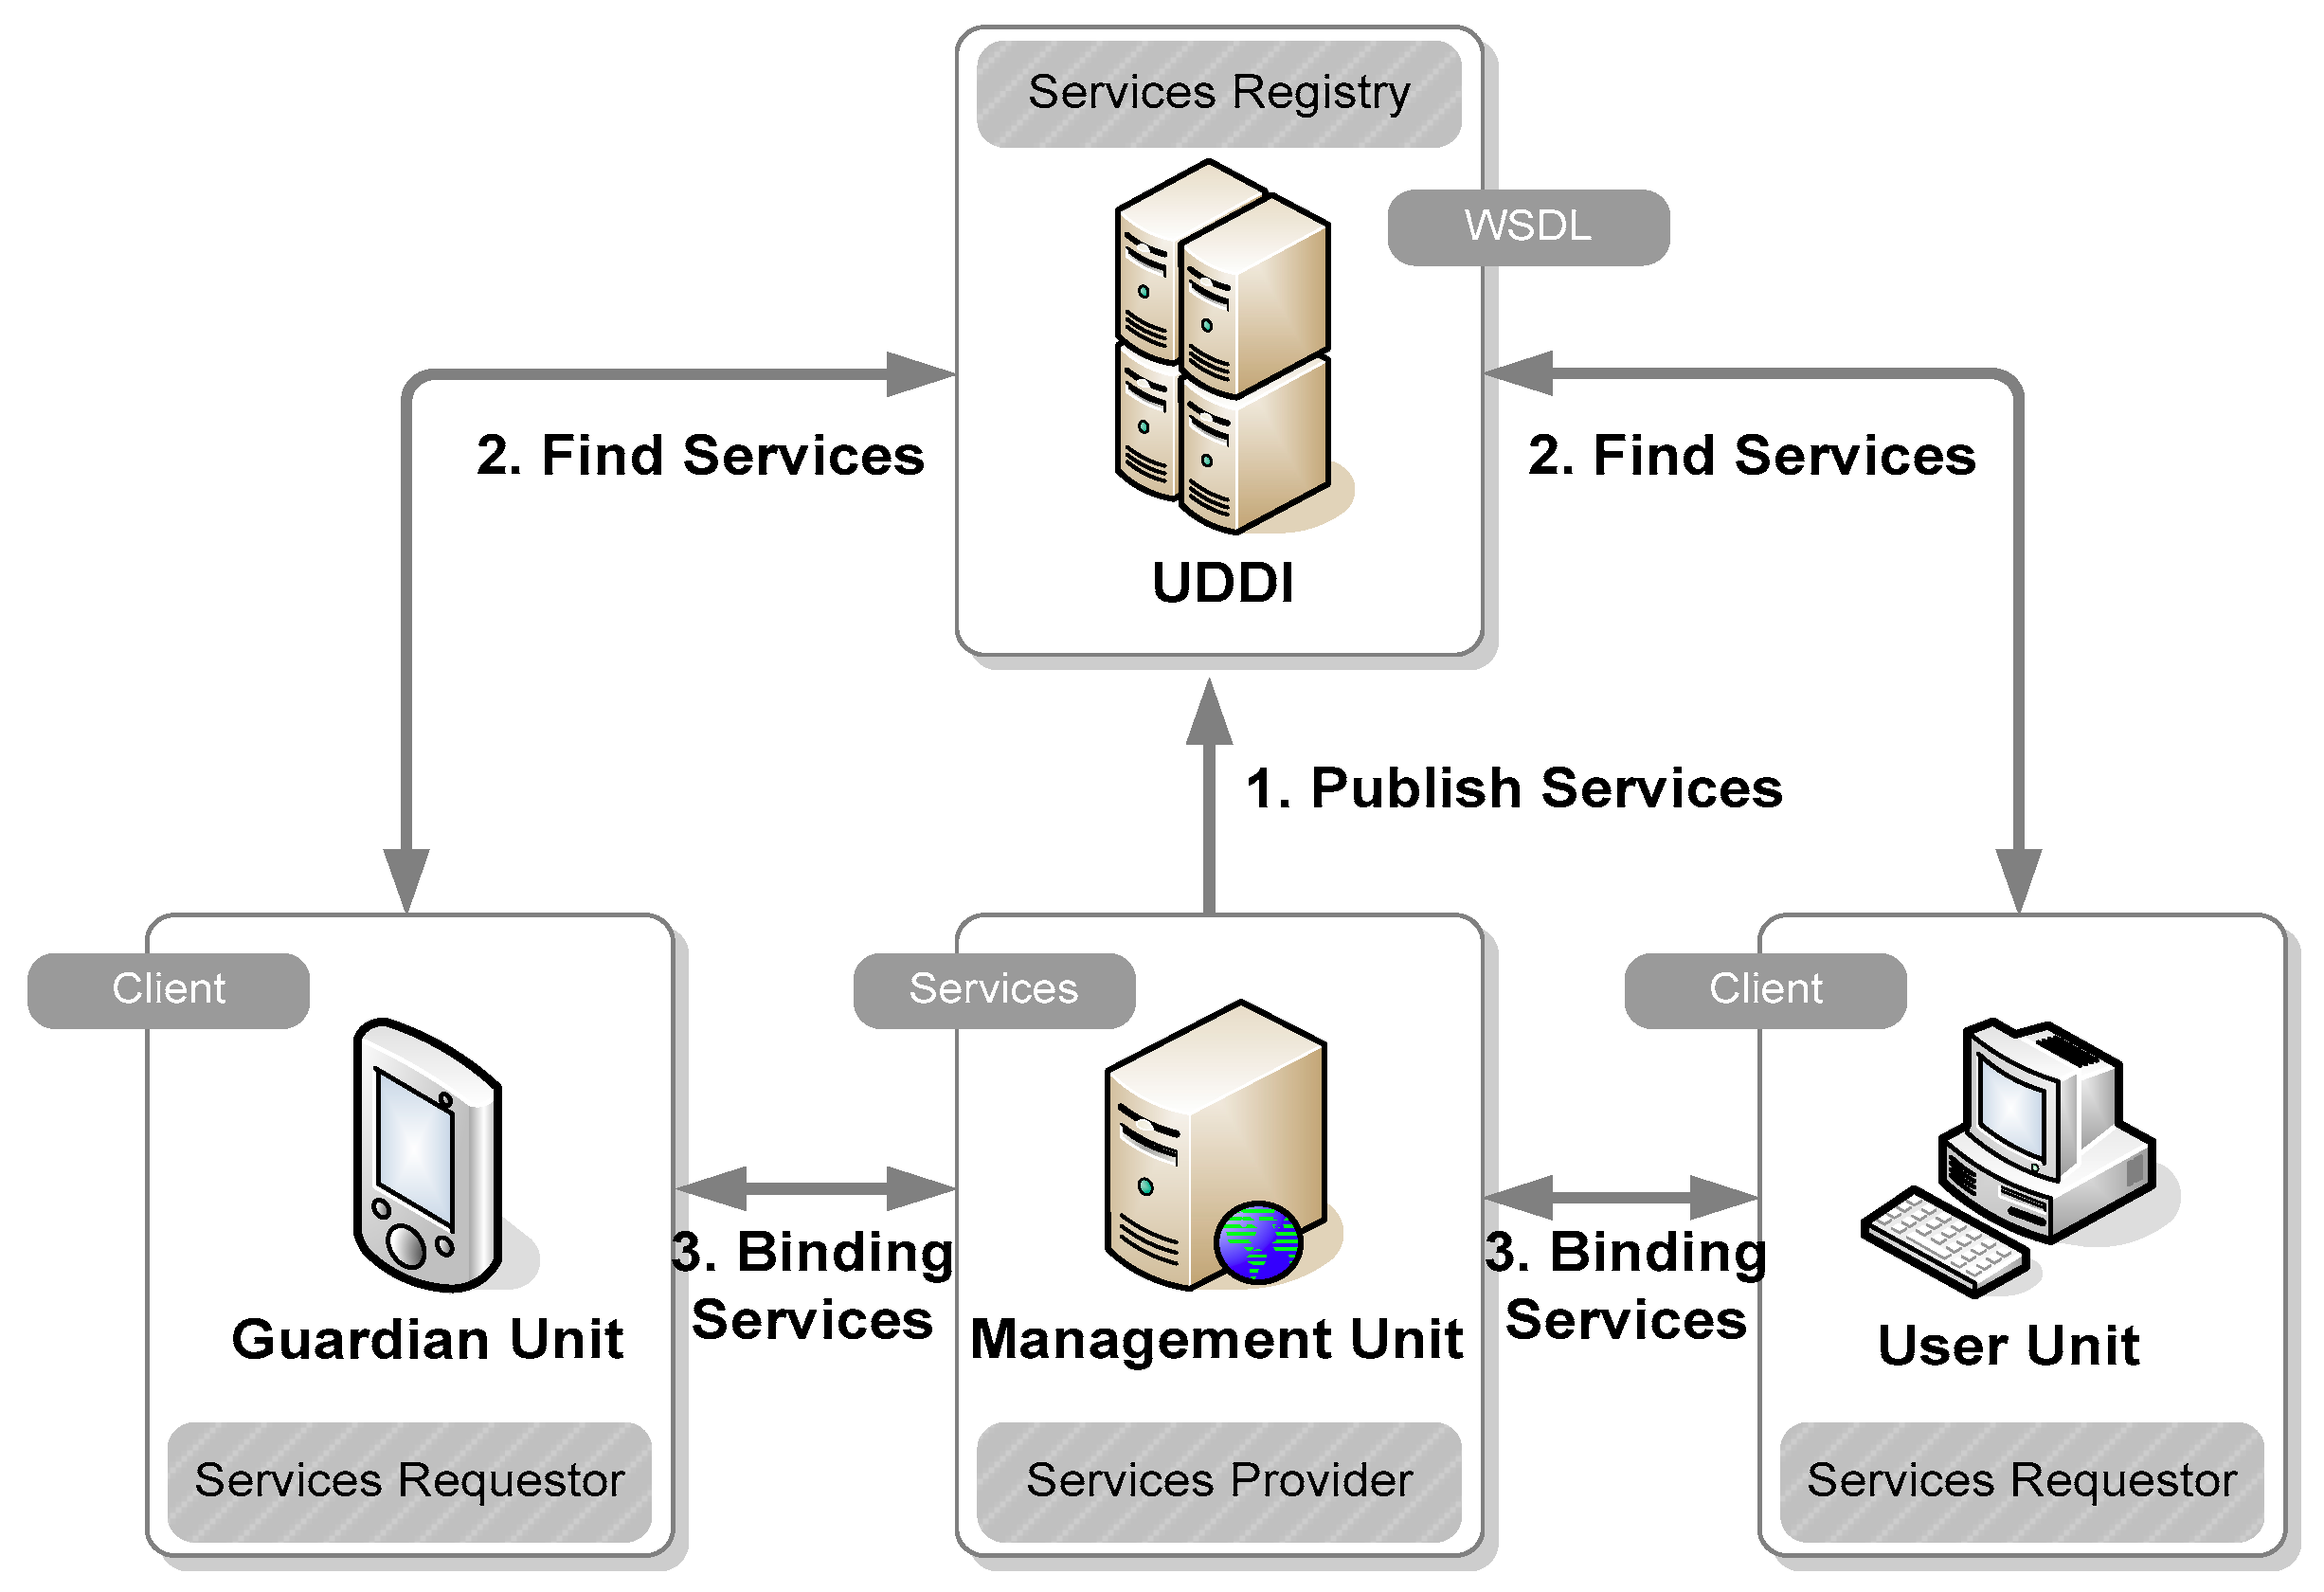
4.4. Web Service Application
5. Results and Discussion
5.1. Procedure
5.2. Performance Criterion
- Specificity:
- (also called the true negative rate) measures the proportion of actual negatives that are correctly identified as such (e.g., the percentage of healthy people who are correctly identified as not having the condition).
- Sensitivity:
- (also called the true positive rate) measures the proportion of actual positives that are correctly identified as such (e.g., the percentage of sick people who are correctly identified as having the condition).
- Accuracy:
- number of correctly classified records/number of total records.
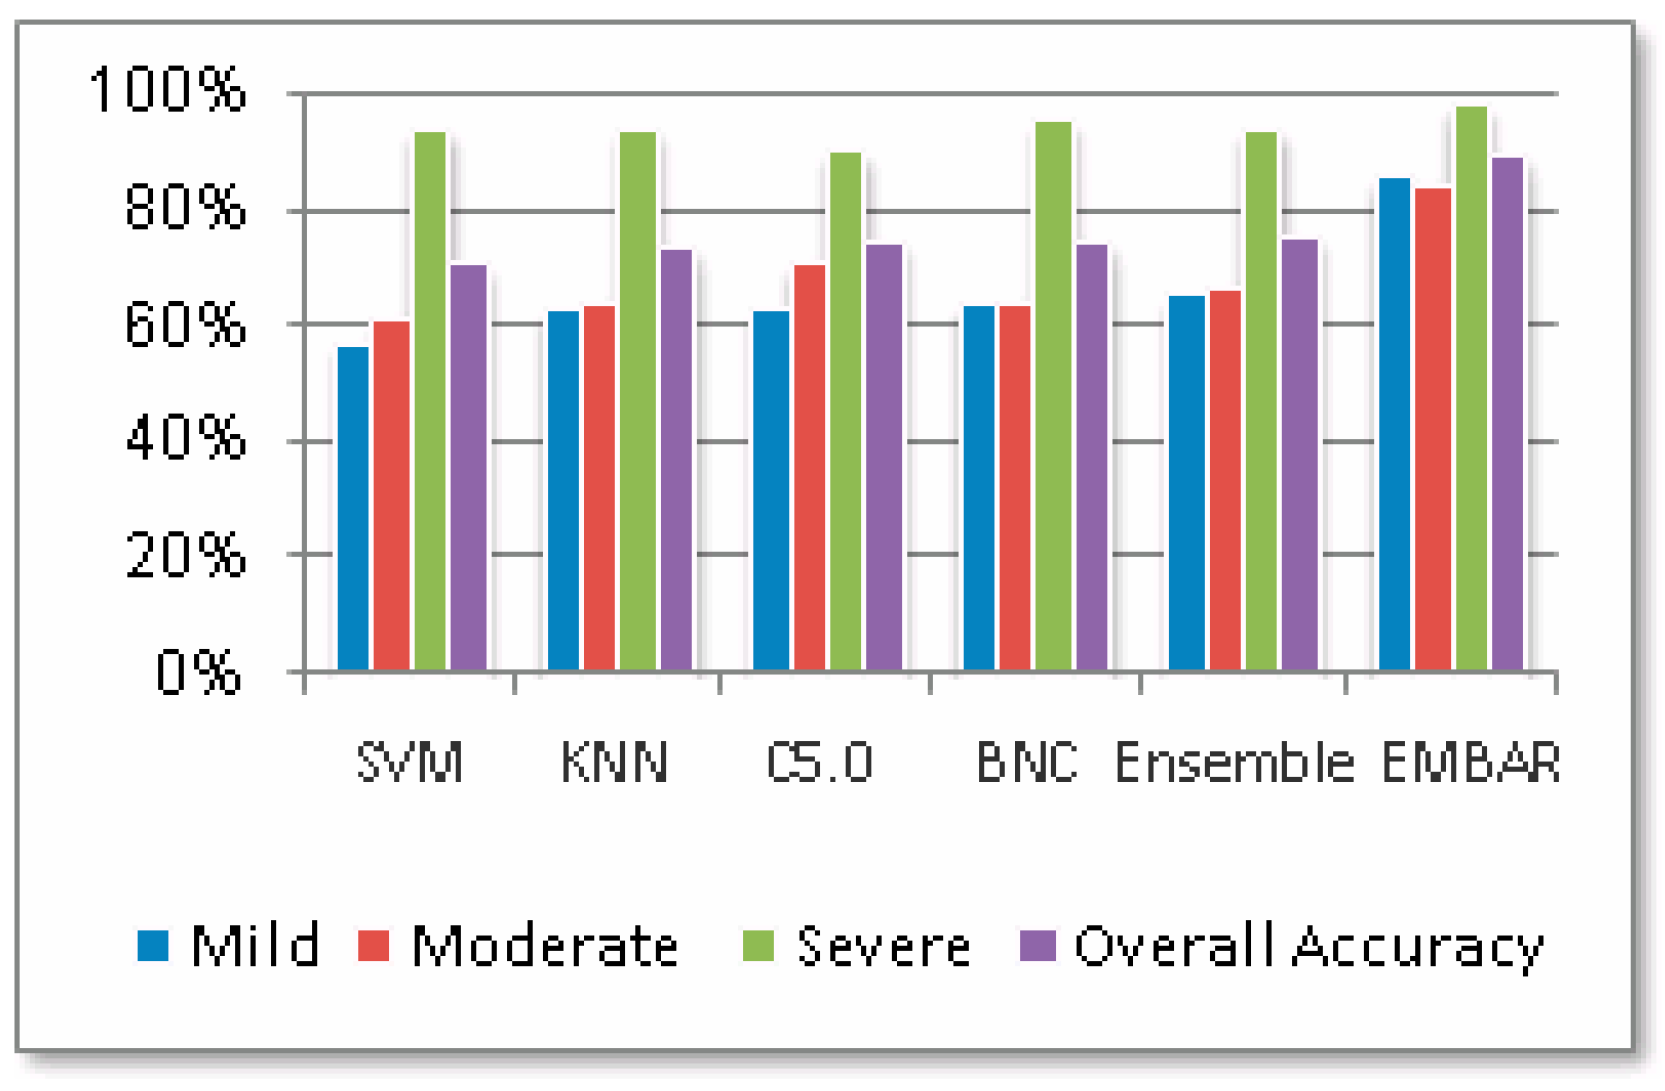
5.3. Performance of Different General Classifiers
5.4. Performance of Ensemble Classifier with CBR
5.5. Discussion
6. Conclusions
Author Contributions
Acknowledgments
Conflicts of Interest
References
- Greenfield, D.N. Psychological characteristics of compulsive Internet use: A preliminary analysis. Cyberpsychol. Behav. 2000, 2, 403–412. [Google Scholar] [CrossRef] [PubMed]
- Chen, J.V.; Chen, C.C.; Yang, H.H. An empirical evaluation of key factors contributing to Internet abuse in the workplace. Ind. Manag. Data Syst. 2008, 108, 87–106. [Google Scholar] [CrossRef]
- Khazaei, F.; Khazaei, O.; Ghanbari-H, B. Positive psychology interventions for internet addiction treatment. Comput. Hum. Behav. 2017, 72, 304–311. [Google Scholar] [CrossRef]
- Mahapatra, A.; Sharma, P. Association of Internet addiction and alexithymia—A scoping review. Addic. Behav. 2018, 81, 175–182. [Google Scholar] [CrossRef] [PubMed]
- Morahan-Martin, J.; Schumacher, P. Incidents and correlates of pathological internet use among college students. Comput. Hum. Behav. 2000, 16, 13–29. [Google Scholar] [CrossRef]
- Griffiths, M.D. Does Internet and computer addiction exist? Some case study evidence. Cyberpsychol. Behav. 2000, 3, 211–218. [Google Scholar] [CrossRef]
- Jennifer, B.G.; Neal, D.G. The Web of Internet Dependency: Search Results for the Mental Health Professional. Int. J. Ment. Health Addict. 2006, 4, 307–318. [Google Scholar]
- Fei, B.K.L.; Eloff, J.H.P.; Olivier, M.S.; Venter, H.S. The use of self-organizing maps for anomalous behavior detection in a digital investigation. Forensic Sci. Int. 2006, 162, 33–37. [Google Scholar] [CrossRef]
- Griffiths, M.D. Internet addiction: Does it really exist. In Psychology and the Internet; Gackenbach, J., Ed.; Academic Press: San Diego, CA, USA, 1998. [Google Scholar]
- Kandell, J.J. Internet addiction on campus: The vulnerability of college students. Cyberpsychol. Behav. 1998, 1, 11–17. [Google Scholar] [CrossRef]
- Goldberg, I. Internet Addiction Disorder. 1996. Available online: http://www.rider.edu/~suler/psycyber/supportgp.html (accessed on 14 December 2014).
- Davis, R.A. A cognitive-behavioral model of pathological Internet use. Comput. Hum. Behav. 2001, 17, 187–195. [Google Scholar] [CrossRef]
- Scherer, K. College life on-line: Healthy and unhealthy internet use. J. Coll. Stud. Dev. 1997, 38, 655–665. [Google Scholar]
- Young, K.S. Internet addiction: The emergence of a new clinical disorder. In Proceedings of the 104th American Psychological Association Annual Convention, Toronto, ON, Canada, 15 August 1996. [Google Scholar]
- Young, K.S. Internet addiction: The emergence of a new clinical disorder. Cyberpsychol. Behav. 1998, 1, 237–244. [Google Scholar] [CrossRef]
- Brenner, V. Parameters of Internet use, abuse, and addiction: The first 90 days of the Internet usage survey. Psychol. Rep. 1997, 80, 879–882. [Google Scholar] [CrossRef] [PubMed]
- Chen, S.H.; Chou, C. Development of Chinese Internet addiction scale in Taiwan. In Proceedings of the 107th American Psychology Annual convention, Boston, MA, USA, 20–24 August 1999. [Google Scholar]
- Chou, C.; Hsiao, M.C. Internet addiction, usage, gratifications, and pleasure experience: The Taiwan college students’ case. Comput. Educ. 2000, 35, 65–80. [Google Scholar] [CrossRef]
- Lin, S.S.J.; Tsai, C.C. Internet Addiction among High Schoolers in Taiwan. In Proceedings of the 107th American Psychology Association (APA) Annual Convention, Boston, MA, USA, 20–24 August 1999. [Google Scholar]
- Widyanto, L.; McMurran, M. The Psychometric Properties of the Internet Addiction Test. Cyberpsychol. Behav. 2004, 7, 443–450. [Google Scholar] [CrossRef]
- Fei, B.; Eloff, J.; Venter, H.; Olivier, M. Exploring Forensic Data with Self-Organizing Maps. In IFIP International Conference on Digital Forensics; Digital Forensics: Orlando, FL, USA, 2005; pp. 113–123. [Google Scholar]
- Khazaal, Y.; Chatton, A.; Horn, A.; Achab, S.; Thorens, G.; Zullino, D.; Billieux, J. French validation of the Compulsive Internet Use Scale (CIUS). Psychiatr. Q. 2012, 83, 397–405. [Google Scholar] [CrossRef]
- Lee, K.; Lee, H.K.; Gyeong, H.; Yu, B.; Song, Y.M.; Kim, D. Reliability and validity of the Korean version of the Internet Addiction Test among college students. J. Korean Med. Sci. 2013, 28, 763–768. [Google Scholar] [CrossRef]
- Barke, A.; Nyenhuis, N.; Kröner-Herwig, B. The German version of the Internet Addiction Test: A validation study. Cyberpsychol. Behav. Soc. Netw. 2012, 15, 534–542. [Google Scholar] [CrossRef]
- Widyanto, L.; Griffiths, M.D.; Brunsden, V. A psychometric comparison of the Internet Addiction Test, the Internet-related Problem Scale, and self-diagnosis. Cyberpsychol. Behav. Soc. Netw. 2011, 14, 141–149. [Google Scholar] [CrossRef]
- Tsitsika, A.; Critselis, E.; Janikian, M.; Kormas, G.; Kafetzis, D.A. Association between Internet gambling and problematic Internet use among adolescents. J. Gambl. Stud. 2011, 27, 389–400. [Google Scholar] [CrossRef]
- Jelenchick, L.; Becker, T.; Moreno, M.A. Assessing the psychometric properties of the Internet Addiction Test (IAT) in US college students. Psychiatr. Res. 2012, 196, 296–301. [Google Scholar] [CrossRef]
- Brand, M.; Laier, C.; Pawlikowski, M.; Schachtle, U.; Scholer, T.; Altstotter-Gleich, C. Watching pornographic pictures on the Internet: Role of sexual arousal ratings and psychological-psychiatric symptoms for using Internet sex sites excessively. Cyberpsychol. Behav. Soc. Netw. 2011, 14, 371–377. [Google Scholar] [CrossRef]
- Guertler, D.; Rumpf, H.J.; Bischof, A.; Kastirke, N.; Petersen, K.U.; John, U.; Meyer, C. Assessment of Problematic Internet Use by the Compulsive Internet Use Scale and the Internet Addiction Test, A Sample of Problematic and Pathological Gamblers. Eur. Addict. Res. 2014, 20, 75–81. [Google Scholar] [CrossRef]
- Mak, K.K.; Lee, K.; Park, C. Applications of Machine Learning in Addiction Studies: A Systematic Review. Psychiatr. Res. 2019. [Google Scholar] [CrossRef]
- Kolodner, J. Case-Based Reasoning; Morgan Kaufmann: San Mateo, CA, USA, 1993. [Google Scholar]
- Vapnik, V. The Nature of Statistical Learning Theory; Springer: Berlin, Germany, 1995. [Google Scholar]
- Cowell, R.G.; Dawid, A.P.; Lauritzen, S.L.; Spiegelhalter, D.J. Probabilistic Networks and Expert Systems; Springer: New York, NY, USA, 1999. [Google Scholar]
- Chi, M.; Bruzzone, L. An ensemble-driven k-NN approach to ill-posed classification problems. Pattern Recognit. Lett. 2006, 27, 301–307. [Google Scholar] [CrossRef]
- Rastogi, R.; Shim, K. PUBLIC: A decision tree classifier that integrates building and pruning. In Proceedings of the 24th International Conference on Very Large Data-bases, New York, NY, USA, 24–27 August 1998; pp. 404–415. [Google Scholar]
- Kohonen, T. Self-Organizing Maps, 2nd ed.; Springer: Berlin, Germany, 1997. [Google Scholar]
- Bauer, E.; Kohavi, R. An empirical comparison of voting classification algorithms: Bagging, boosting, and variants. Mach. Learn. 1999, 36, 105–139. [Google Scholar] [CrossRef]
- Aamodt, A.; Plaza, E. Case-based reasoning: Foundational issues methodological variations and systems approaches. AI Comm. 1994, 7, 39–59. [Google Scholar]
- Pinho, D.; Vivacqua, A.; Palma, S.; Souza, J.M. SYMBAD-Similarity based agents for design. Expert Syst. Appl. 2006, 31, 728–733. [Google Scholar] [CrossRef]
- Choy, K.L.; Lee, W.B. Multi-agent based virtual enterprise supply chain network for order management. J. Ind. Eng. Res. 2001, 2, 126–141. [Google Scholar]
- Nakamur, Y.; Hada, S.; Neyama, R. Towards the Integration of Web services Security on Enterprise Environments. In Proceedings of the 2002 Symposium on Applications and the Internet, Nara City, Nara, Japan, 28 January–1 February 2002; pp. 166–175. [Google Scholar]
- Efrim Boritz, J.; Won, G.N. Security in XML-based financial reporting services on the Internet. J. Account. Public Policy 2005, 24, 11–35. [Google Scholar] [CrossRef]
- Neuman, C.; Ts’o, T. Kerberos: An authentication service for computer networks. IEEE Commun. 1994, 32, 33–38. [Google Scholar] [CrossRef]
- Shi, F. Study on a Stratified Sampling Investigation Method for Resident Travel and the Sampling Rate. Discret. Dyn. Nat. Soc. 2015, 2015. [Google Scholar] [CrossRef]
- Reuss, P.; Dick, M.; Termath, W.; Althoff, K.-D.Z. Case-based reasoning: Potential benefits and limitations for documenting of stories in organizations. Z. Arb. 2007, 71, 252–258. [Google Scholar] [CrossRef]
- Freund, Y.; Schapire, R.E. A Decision-Theoretic Generalization of on-Line Learning and an Application to Boosting. J. Comput. Syst. Sci. 1997, 55, 119–139. [Google Scholar] [CrossRef]
- Richards, G.; Rayward-Smith, V.J.; Sonksen, P.H.; Carey, S.; Weng, C. Data mining for indicators of early mortality in a database of clinical records. Artif. Intell. Med. 2001, 22, 215–231. [Google Scholar] [CrossRef]
- Kruck, S.E.; Teer, F.; Christian, W.A., Jr. GSLAP: A graph-based web analysis tool. Ind. Manag. Data Syst. 2008, 108, 162–172. [Google Scholar] [CrossRef]
- Lopez-Fernandez, O. Generalized Versus Specific Internet Use-Related Addiction Problems: A Mixed Methods Study on Internet, Gaming, and Social Networking Behaviors. Int. J. Environ. Res. Public Health 2018, 15, 2913. [Google Scholar] [CrossRef]
- Kuss, D.J.; Griffiths, M.D. Online Social Networking and Addiction—A Review of the Psychological Literature. Int. J. Environ. Res. Public Health 2011, 8, 3528–3552. [Google Scholar] [CrossRef]
- Chou, W.P.; Yen, C.F.; Liu, T.L. Predicting Effects of Psychological Inflexibility/Experiential Avoidance and Stress Coping Strategies for Internet Addiction, Significant Depression, and Suicidality in College Students: A Prospective Study. Int. J. Environ. Res. Public Health 2018, 15, 788. [Google Scholar] [CrossRef]


| Researchers | Subject |
|---|---|
| Khazaal et al. [22] | French Scale (CIUS) |
| Lee et al. [23] | IAT in Korean |
| Barke et al. [24] | IAT in German |
| Widyanto et al. [25] | Psychometric comparison |
| Tsitsika et al. [26] | Internet gambling |
| Jelenchick et al. [27] | IAT in US |
| Brand et al. [28] | Internet sex sites excessive |
| Guertler et al. [29] | Gamblers |
| Properties | SSL | XML-S | XML-E | Kerberos | EMBAR |
|---|---|---|---|---|---|
| Confidentiality | - | - | Yes | Yes | Yes |
| Authentication | Yes | - | - | Yes | Yes |
| Integrity | Yes | Yes | - | Yes | Yes |
| Non-repudiation | - | Yes | - | - | Yes |
| Authorization | - | - | - | Yes | Yes |
| Mild | Moderate | Severe | |
|---|---|---|---|
| (A) SVM | |||
| Sensitivity | 72.5% | 43.3% | 0% |
| Specificity | 39.3% | 74.4% | 100% |
| Accuracy | 57.5% | 61.6% | 95.8% |
| Average Accuracy: 71.6% | |||
| (B) BNC | |||
| Sensitivity | 52.5% | 76.7% | 66.7% |
| Specificity | 78.7% | 55.8% | 98.5% |
| Accuracy | 64.3% | 64.3% | 97.2% |
| Average Accuracy: 75.3% | |||
| (C) C5.0 | |||
| Sensitivity | 72.5% | 56.7% | 0% |
| Specificity | 51.6% | 81.3% | 95.7% |
| Accuracy | 63.0% | 71.2% | 91.7% |
| Average Accuracy: 75.3% | |||
| (D) KNN | |||
| Sensitivity | 82.5% | 40.0% | 0% |
| Specificity | 39.3% | 81.3% | 100% |
| Accuracy | 63.0% | 64.3% | 95.8% |
| Average Accuracy (%): 74.4% | |||
| Mild | Moderate | Severe | |
|---|---|---|---|
| (A) Ensemble classifier | |||
| Sensitivity | 75.0% | 56.7% | 0% |
| Specificity | 54.5% | 74.4% | 100% |
| Accuracy | 65.7% | 67.1% | 95.8% |
| Average Accuracy (%): 76.2% | |||
| (B) Ensemble classifier with CBR (EMBAR) | |||
| Sensitivity | 87.5% | 83.3% | 66.7% |
| Specificity | 84.8% | 86.0% | 100% |
| Accuracy | 86.3% | 84.9% | 98.6% |
| Average Accuracy (%): 89.9% | |||
© 2019 by the authors. Licensee MDPI, Basel, Switzerland. This article is an open access article distributed under the terms and conditions of the Creative Commons Attribution (CC BY) license (http://creativecommons.org/licenses/by/4.0/).
Share and Cite
Hsieh, W.-H.; Shih, D.-H.; Shih, P.-Y.; Lin, S.-B. An Ensemble Classifier with Case-Based Reasoning System for Identifying Internet Addiction. Int. J. Environ. Res. Public Health 2019, 16, 1233. https://doi.org/10.3390/ijerph16071233
Hsieh W-H, Shih D-H, Shih P-Y, Lin S-B. An Ensemble Classifier with Case-Based Reasoning System for Identifying Internet Addiction. International Journal of Environmental Research and Public Health. 2019; 16(7):1233. https://doi.org/10.3390/ijerph16071233
Chicago/Turabian StyleHsieh, Wen-Huai, Dong-Her Shih, Po-Yuan Shih, and Shih-Bin Lin. 2019. "An Ensemble Classifier with Case-Based Reasoning System for Identifying Internet Addiction" International Journal of Environmental Research and Public Health 16, no. 7: 1233. https://doi.org/10.3390/ijerph16071233
APA StyleHsieh, W.-H., Shih, D.-H., Shih, P.-Y., & Lin, S.-B. (2019). An Ensemble Classifier with Case-Based Reasoning System for Identifying Internet Addiction. International Journal of Environmental Research and Public Health, 16(7), 1233. https://doi.org/10.3390/ijerph16071233