Spatiotemporal Contextual Uncertainties in Green Space Exposure Measures: Exploring a Time Series of the Normalized Difference Vegetation Indices

Abstract
1. Introduction
2. Materials and Methods
2.1. Study Area
2.2. Address Data
2.3. Remote Sensing-Based NDVI Data
2.4. GIS-Based Exposure Assessment
2.5. Statistical Analyses
3. Results
4. Discussion
4.1. Interpretation of the Results
4.2. Study Limitations
5. Conclusions
Funding
Acknowledgments
Conflicts of Interest
Appendix A


References
- Frumkin, H. Environmental Health: From Global to Local; John Wiley & Sons: New York, NY, USA, 2016. [Google Scholar]
- Van den Bosch, M.; Sang, Å. Urban natural environments as nature-based solutions for improved public health—A systematic review of reviews. Environ. Res. 2017, 158, 373–384. [Google Scholar] [CrossRef] [PubMed]
- Helbich, M. Toward dynamic urban environmental exposure assessments in mental health research. Environ. Res. 2018, 161, 129–135. [Google Scholar] [CrossRef] [PubMed]
- Toth, C.; Jóźków, G. Remote sensing platforms and sensors: A survey. ISPRS J. Photogramm. Remote Sens. 2016, 115, 22–36. [Google Scholar] [CrossRef]
- Viana, J.; Santos, J.V.; Neiva, R.M.; Souza, J.; Duarte, L.; Teodoro, A.C.; Freitas, A. Remote Sensing in Human Health: A 10-Year Bibliometric Analysis. Remote Sens. 2017, 9, 1225. [Google Scholar] [CrossRef]
- Brown, M.E.; Pinzón, J.E.; Didan, K.; Morisette, J.T.; Tucker, C.J. Evaluation of the consistency of long-term NDVI time series derived from AVHRR, SPOT-vegetation, SeaWiFS, MODIS, and Landsat ETM+ sensors. IEEE Trans. Geosci. Remote Sens. 2006, 44, 1787–1793. [Google Scholar] [CrossRef]
- Huete, A.; Didan, K.; van Leeuwen, W.; Miura, T.; Glenn, E. MODIS vegetation indices. In Land Remote Sensing and Global Environmental Change; Springer: New York, NY, USA, 2010; pp. 579–602. [Google Scholar]
- Hartig, T.; Mitchell, R.; De Vries, S.; Frumkin, H. Nature and health. Annu. Rev. Public Health 2014, 35, 207–228. [Google Scholar] [CrossRef]
- Persson Åand Pyko, A.; Lind, T.; Bellander, T.; Östenson, C.-G.; Pershagen, G.; Eriksson, C.; Lõhmus, M. Urban residential greenness and adiposity: A cohort study in Stockholm County. Environ. Int. 2018, 121, 832–841. [Google Scholar] [CrossRef]
- Ebisu, K.; Holford, T.R.; Bell, M.L. Association between greenness, urbanicity, and birth weight. Sci. Total Environ. 2016, 542, 750–756. [Google Scholar] [CrossRef]
- Helbich, M.; de Beurs, D.; Kwan, M.-P.; O’Connor, R.C.; Groenewegen, P.P. Natural environments and suicide mortality in the Netherlands: A cross-sectional, ecological study. Lancet Planet. Health 2018, 2, e134–e139. [Google Scholar] [CrossRef]
- Chong, S.; Byun, R.; Mazumdar, S.; Bauman, A.; Jalaludin, B. Effects of Distant Green Space on Physical Activity in Sydney, Australia. J. Phys. Act. Health 2017, 14, 29–35. [Google Scholar] [CrossRef]
- Dadvand, P.; Basagaña, X.; Jerrett, M.; Nieuwenhuijsen, M.J.; Sunyer Deu, J.; Pujol, J.; Macià, D.; Martinez Vilavella, G.; Blanco Hinojo, L.; Mortamais, M.; et al. The association between lifelong greenspace exposure and 3-dimensional brain magnetic resonance imaging in Barcelona schoolchildren. Environ. Health Perspect. 2018, 126, 027012. [Google Scholar] [CrossRef]
- Ji, J.S.; Zhu, A.; Bai, C.; Wu, C.-D.; Yan, L.; Tang, S.; Zeng, Y.; James, P. Residential greenness and mortality in oldest-old women and men in China: A longitudinal cohort study. Lancet Planet. Health 2019, 3, e17–e25. [Google Scholar] [CrossRef]
- Helbich, M.; Klein, N.; Roberts, H.; Hagedoorn, P.; Groenewegen, P.P. More green space is related to less antidepressant prescription rates in the Netherlands: A Bayesian geoadditive quantile regression approach. Environ. Res. 2018, 166, 290–297. [Google Scholar] [CrossRef]
- Pettorelli, N.; Vik, J.O.; Mysterud, A.; Gaillard, J.-M.; Tucker, C.J.; Stenseth, N.C. Using the satellite-derived NDVI to assess ecological responses to environmental change. Trends Ecol. Evol. 2005, 20, 503–510. [Google Scholar] [CrossRef] [PubMed]
- Tucker, C.J. Red and photographic infrared linear combinations for monitoring vegetation. Remote Sens. Environ. 1979, 8, 127–150. [Google Scholar] [CrossRef]
- Balseviciene, B.; Sinkariova, L.; Grazuleviciene, R.; Andrusaityte, S.; Uzdanaviciute, I.; Dedele, A.; Nieuwenhuijsen, M.J. Impact of residential greenness on preschool children’s emotional and behavioral problems. Int. J. Environ. Res. Public Health 2014, 11, 6757–6770. [Google Scholar] [CrossRef] [PubMed]
- Song, H.; Lane, K.J.; Kim, H.; Kim, H.; Byun, G.; Le, M.; Choi, Y.; Park, C.R.; Lee, J.-T. Association between Urban Greenness and Depressive Symptoms: Evaluation of Greenness Using Various Indicators. Int. J. Environ. Res. Public Health 2019, 16, 173. [Google Scholar] [CrossRef]
- Rugel, E.J.; Carpiano, R.M.; Henderson, S.B.; Brauer, M. Exposure to natural space, sense of community belonging, and adverse mental health outcomes across an urban region. Environ. Res. 2019. [Google Scholar] [CrossRef] [PubMed]
- Kwan, M.-P. The Limits of the Neighborhood Effect: Contextual Uncertainties in Geographic, Environmental Health, and Social Science Research. Ann. Am. Assoc. Geogr. 2018, 108, 1482–1490. [Google Scholar] [CrossRef]
- Wenxia, G.; Huanfeng, S.; Liangpei, Z.; Wei, G. Normalization of NDVI from Different Sensor System using MODIS Products as Reference. In IOP Conference Series: Earth and Environmental Science; IOP Publishing: Bristol, UK, 2014; Volume 17, p. 12225. [Google Scholar]
- Gascon, M.; Sánchez-Benavides, G.; Dadvand, P.; Martinez, D.; Gramunt, N.; Gotsens, X.; Cirach, M.; Vert, C.; Molinuevo, J.L.; Crous-Bou, M.; et al. Long-term exposure to residential green and blue spaces and anxiety and depression in adults: A cross-sectional study. Environ. Res. 2018, 162, 231–239. [Google Scholar] [CrossRef]
- Pearce, J.; Shortt, N.; Rind, E.; Mitchell, R. Life course, green space and health: Incorporating place into life course epidemiology. Int. J. Environ. Res. Public Health 2016, 13, 331. [Google Scholar] [CrossRef] [PubMed]
- Frank, L.D.; Fox, E.H.; Ulmer, J.M.; Chapman, J.E.; Kershaw, S.E.; Sallis, J.F.; Conway, T.L.; Cerin, E.; Cain, K.L.; Adams, M.A.; et al. International comparison of observation-specific spatial buffers: Maximizing the ability to estimate physical activity. Int. J. Health Geogr. 2017, 16, 4. [Google Scholar] [CrossRef] [PubMed]
- Reid, C.E.; Kubzansky, L.D.; Li, J.; Shmool, J.L.; Clougherty, J.E. It’s not easy assessing greenness: A comparison of NDVI datasets and neighborhood types and their associations with self-rated health in New York City. Health Place 2018, 54, 92–101. [Google Scholar] [CrossRef] [PubMed]
- Boers, S.; Hagoort, K.; Scheepers, F.; Helbich, M. Does residential green and blue space promote recovery in psychotic disorders? A cross-sectional study in the province of Utrecht, the Netherlands. Int. J. Environ. Res. Public Health 2018, 15, 2195. [Google Scholar] [CrossRef]
- Myneni, R.B.; Hall, F.G.; Sellers, P.J.; Marshak, A.L. The interpretation of spectral vegetation indexes. IEEE Trans. Geosci. Remote Sens. 1995, 33, 481–486. [Google Scholar] [CrossRef]
- Didan, K.; Munoz, A.B.; Solano, R.; Huete, A. MODIS vegetation index user’s guide (MOD13 Series). 2015. Available online: https://vip.arizona.edu/documents/MODIS/MODIS_VI_UsersGuide_June_2015_C6.pdf (accessed on 10 February 2019).
- Zhao, S.; Guo, Y.; Sheng, Q.; Shyr, Y. Advanced heat map and clustering analysis using heatmap3. Biomed. Res. Int. 2014, 2014. [Google Scholar] [CrossRef]
- Kanji, G.K. 100 Statistical Tests; Sage: Thousand Oaks, CA, USA, 2006. [Google Scholar]
- Conover, W.J.; Johnson, M.E.; Johnson, M.M. A comparative study of tests for homogeneity of variances, with applications to the outer continental shelf bidding data. Technometrics 1981, 23, 351–361. [Google Scholar] [CrossRef]
- Holm, S. A simple sequentially rejective multiple test procedure. Scand. J. Stat. 1979, 65–70. [Google Scholar]
- Hope, A.C.A. A simplified Monte Carlo significance test procedure. J. R. Stat. Soc. Ser. B 1968, 582–598. [Google Scholar] [CrossRef]
- R Core Team. R: A Language and Environment for Statistical Computing; R Core Team: Vienna, Austria, 2018. [Google Scholar]
- Dong, R.; Zhang, Y.; Zhao, J. How Green Are the Streets Within the Sixth Ring Road of Beijing? An Analysis Based on Tencent Street View Pictures and the Green View Index. Int. J. Environ. Res. Public Health 2018, 15, 1367. [Google Scholar] [CrossRef]
- Helbich, M.; Yao, Y.; Liu, Y.; Zhang, J.; Liu, P.; Wang, R. Using deep learning to examine street view green and blue spaces and their associations with geriatric depression in Beijing, China. Environ. Int. 2019, 126, 107–117. [Google Scholar] [CrossRef] [PubMed]
- Ekkel, E.D.; de Vries, S. Nearby green space and human health: Evaluating accessibility metrics. Landsc. Urban Plan. 2017, 157, 214–220. [Google Scholar] [CrossRef]
- Rhew, I.C.; Vander Stoep, A.; Kearney, A.; Smith, N.L.; Dunbar, M.D. Validation of the normalized difference vegetation index as a measure of neighborhood greenness. Ann. Epidemiol. 2011, 21, 946–952. [Google Scholar] [CrossRef]
- Groenewegen, P.P.; Zock, J.-P.; Spreeuwenberg, P.; Helbich, M.; Hoek, G.; Ruijsbroek, A.; Strak, M.; Verheij, R.; Volker, B.; Waverijn, G.; et al. Neighbourhood social and physical environment and general practitioner assessed morbidity. Health Place 2018, 49, 68–84. [Google Scholar] [CrossRef] [PubMed]
- Chen, P.-Y.; Fedosejevs, G.; Tiscareno-Lopez, M.; Arnold, J.G. Assessment of MODIS-EVI, MODIS-NDVI and VEGETATION-NDVI composite data using agricultural measurements: An example at corn fields in western Mexico. Environ. Monit. Assess. 2006, 119, 69–82. [Google Scholar] [CrossRef] [PubMed]
- Dadvand, P.; Tischer, C.; Estarlich, M.; Llop, S.; Dalmau-Bueno, A.; López-Vicente, M.; Valentin, A.; de Keijzer, C.; Fernández-Somoano, A.; Lertxundi, N.; et al. Lifelong residential exposure to green space and attention: A population-based prospective study. Environ. Health Perspect. 2017, 125, 097016. [Google Scholar] [CrossRef]
- Sexton, J.O.; Song, X.-P.; Feng, M.; Noojipady, P.; Anand, A.; Huang, C.; Kim, D.-H.; Collins, K.M.; Channan, S.; DiMiceli, C.; et al. Global, 30-m resolution continuous fields of tree cover: Landsat-based rescaling of MODIS vegetation continuous fields with lidar-based estimates of error. Int. J. Digit. Earth 2013, 6, 427–448. [Google Scholar] [CrossRef]
| 1 | © 2019 by the authors. Submitted for possible open access publication under the terms and conditions of the Creative Commons Attribution (CC BY) license (http://creativecommons.org/licenses/by/4.0/). |


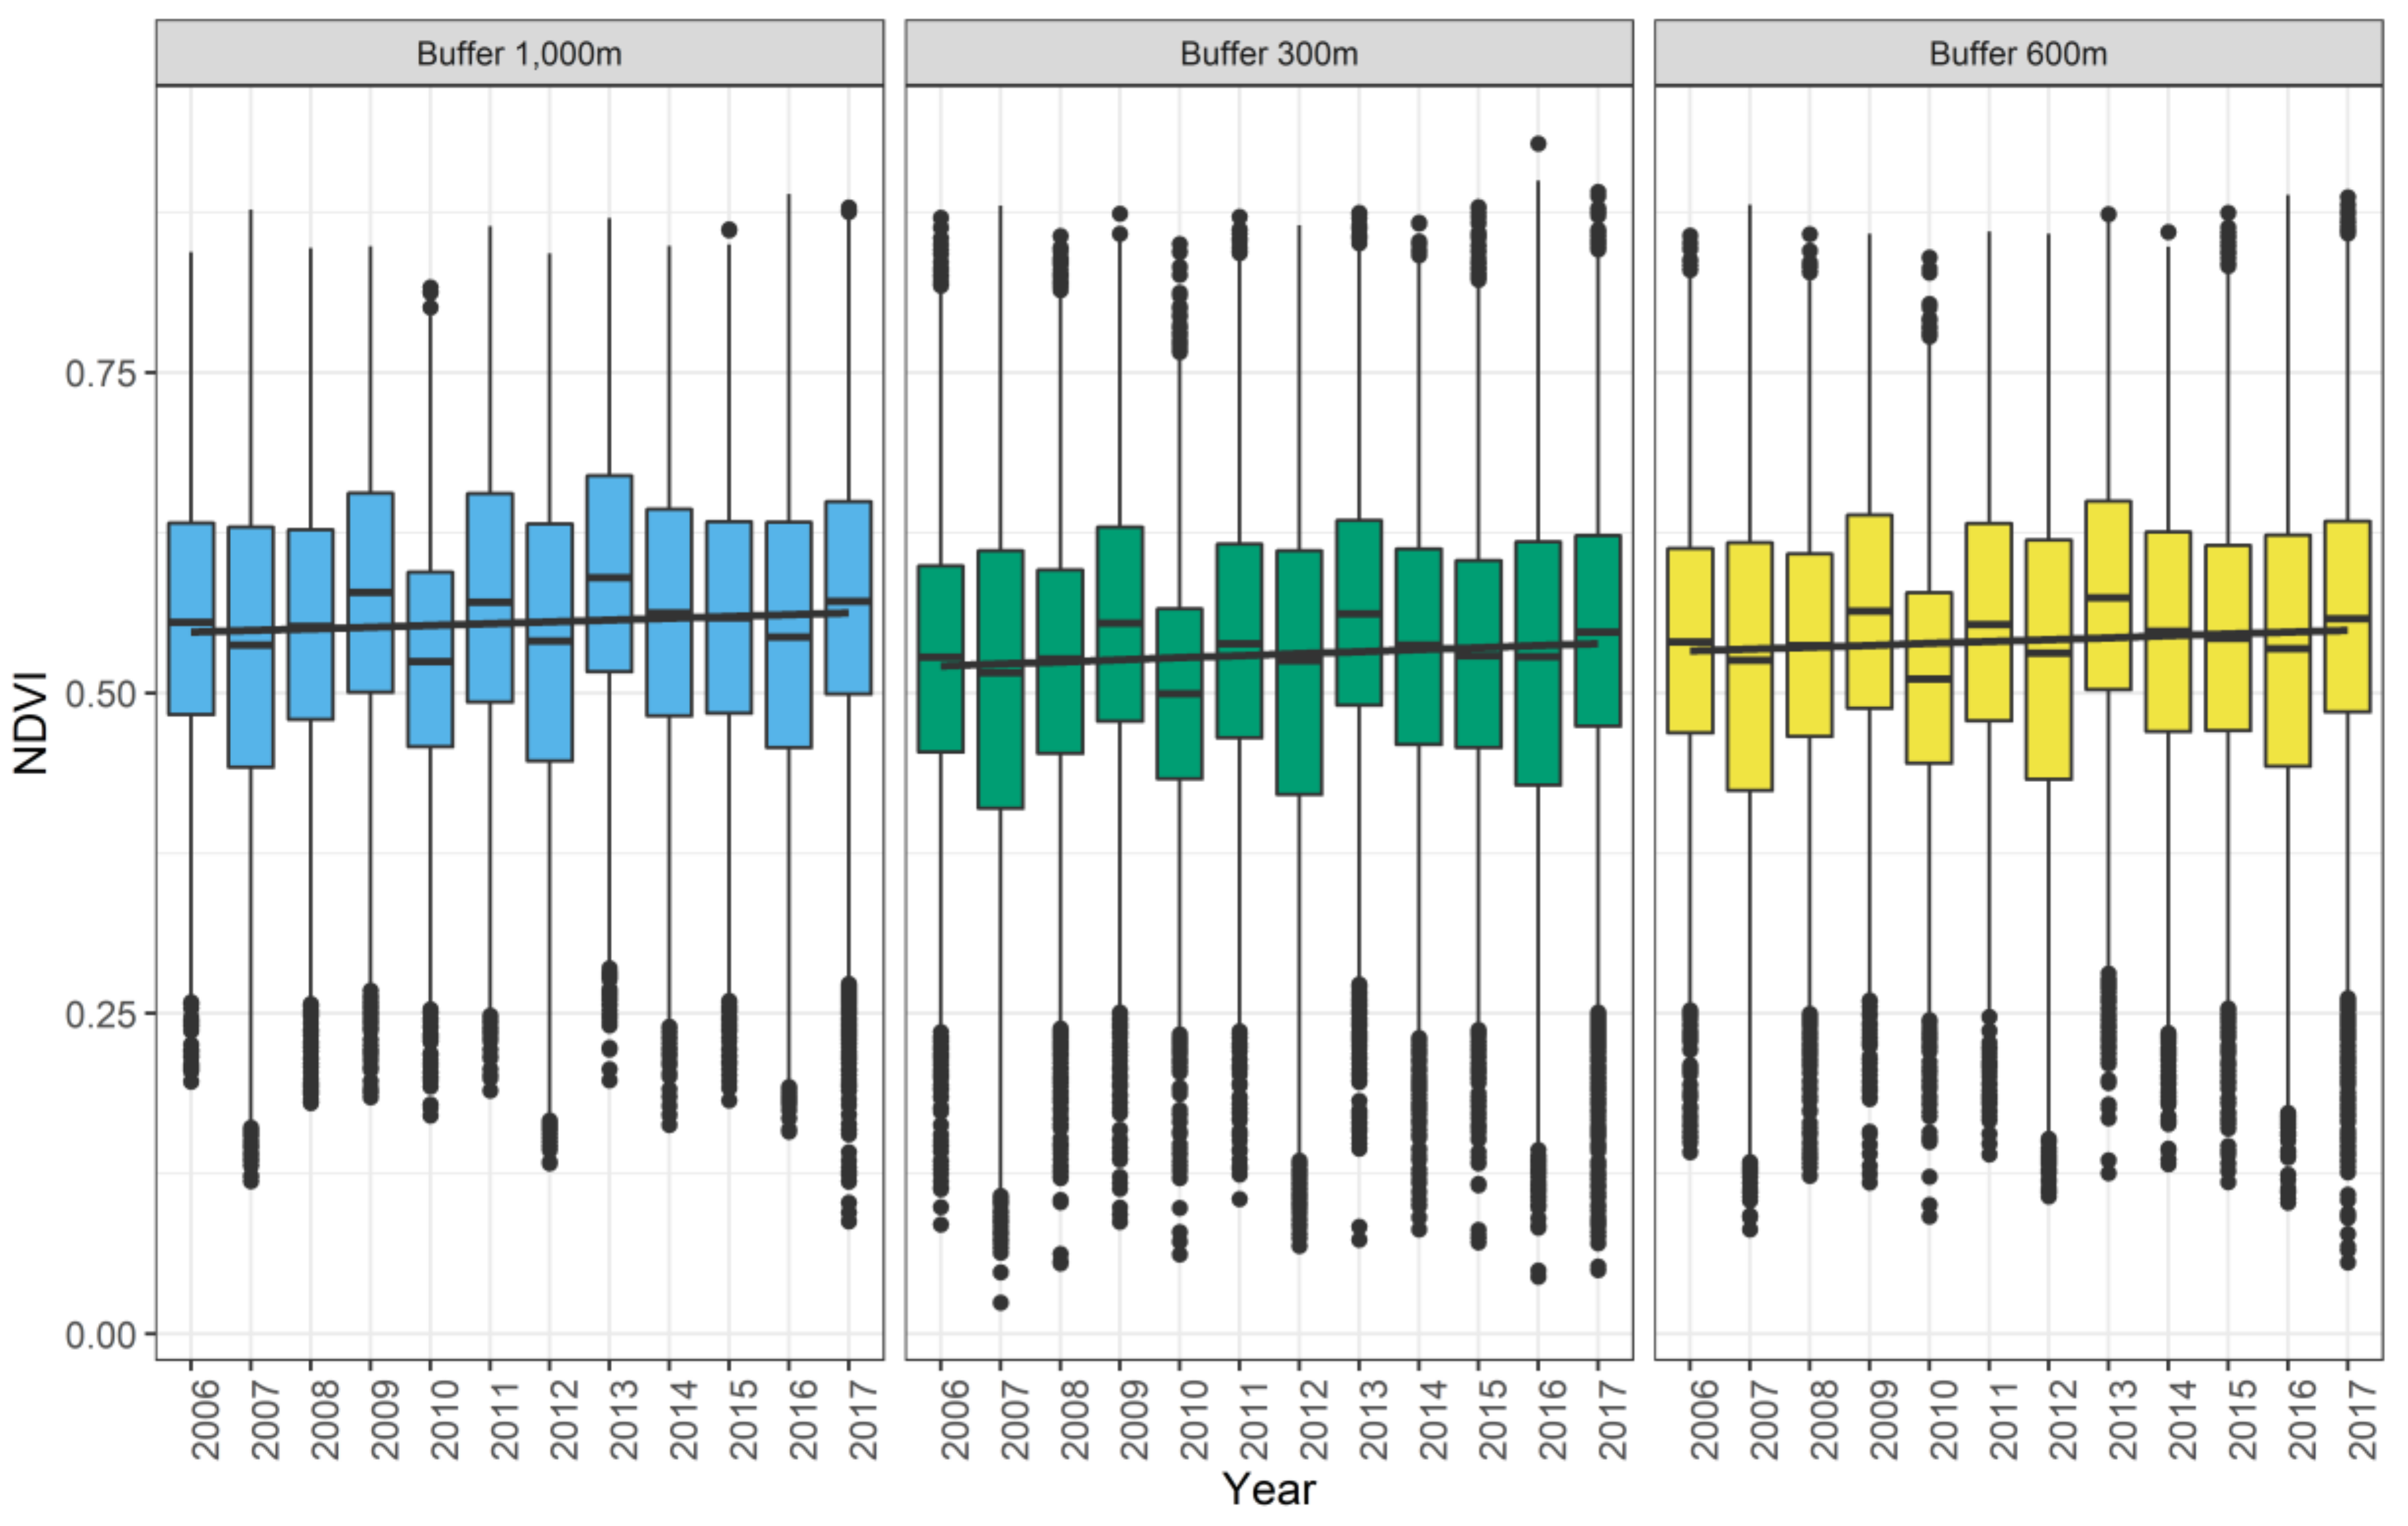
| Buffer (m) | Year | Mean | SD | Median | 25th Percentile | 75th Percentile | Min. | Max | Skewness | Kurtosis |
|---|---|---|---|---|---|---|---|---|---|---|
| 1000 | 2006 | 0.55 | 0.11 | 0.56 | 0.48 | 0.63 | 0.197 | 0.84 | −0.1595 | −0.2427 |
| 2007 | 0.53 | 0.14 | 0.54 | 0.44 | 0.63 | 0.119 | 0.88 | −0.3160 | −0.1868 | |
| 2008 | 0.55 | 0.11 | 0.55 | 0.48 | 0.63 | 0.180 | 0.85 | −0.2441 | −0.0829 | |
| 2009 | 0.57 | 0.11 | 0.58 | 0.50 | 0.66 | 0.185 | 0.85 | −0.2540 | −0.2093 | |
| 2010 | 0.52 | 0.10 | 0.52 | 0.46 | 0.59 | 0.170 | 0.82 | −0.1243 | −0.1466 | |
| 2011 | 0.57 | 0.12 | 0.57 | 0.49 | 0.66 | 0.190 | 0.86 | −0.1028 | −0.3292 | |
| 2012 | 0.53 | 0.13 | 0.54 | 0.45 | 0.63 | 0.133 | 0.84 | −0.3213 | −0.2992 | |
| 2013 | 0.59 | 0.11 | 0.59 | 0.52 | 0.67 | 0.198 | 0.87 | −0.2091 | −0.2376 | |
| 2014 | 0.56 | 0.12 | 0.56 | 0.48 | 0.64 | 0.163 | 0.85 | −0.2075 | −0.2629 | |
| 2015 | 0.56 | 0.11 | 0.56 | 0.48 | 0.63 | 0.182 | 0.86 | −0.1228 | −0.1823 | |
| 2016 | 0.54 | 0.13 | 0.54 | 0.46 | 0.63 | 0.158 | 0.89 | −0.1377 | −0.3493 | |
| 2017 | 0.57 | 0.12 | 0.57 | 0.50 | 0.65 | 0.088 | 0.88 | −0.3084 | 0.1690 | |
| 600 | 2006 | 0.54 | 0.11 | 0.54 | 0.47 | 0.61 | 0.142 | 0.86 | −0.1232 | −0.0792 |
| 2007 | 0.52 | 0.14 | 0.53 | 0.42 | 0.62 | 0.082 | 0.88 | −0.2706 | −0.2122 | |
| 2008 | 0.54 | 0.11 | 0.54 | 0.47 | 0.61 | 0.123 | 0.86 | −0.2067 | 0.1153 | |
| 2009 | 0.56 | 0.11 | 0.56 | 0.49 | 0.64 | 0.118 | 0.86 | −0.2223 | −0.0631 | |
| 2010 | 0.51 | 0.10 | 0.51 | 0.45 | 0.58 | 0.092 | 0.84 | −0.0708 | 0.0195 | |
| 2011 | 0.56 | 0.12 | 0.55 | 0.48 | 0.63 | 0.140 | 0.86 | −0.0320 | −0.1048 | |
| 2012 | 0.52 | 0.13 | 0.53 | 0.43 | 0.62 | 0.107 | 0.86 | −0.3209 | −0.2185 | |
| 2013 | 0.57 | 0.11 | 0.57 | 0.50 | 0.65 | 0.126 | 0.87 | −0.1449 | −0.0414 | |
| 2014 | 0.55 | 0.12 | 0.55 | 0.47 | 0.63 | 0.132 | 0.86 | −0.1682 | −0.0987 | |
| 2015 | 0.54 | 0.11 | 0.54 | 0.47 | 0.62 | 0.119 | 0.87 | −0.0627 | 0.0493 | |
| 2016 | 0.53 | 0.13 | 0.53 | 0.44 | 0.62 | 0.102 | 0.89 | −0.1643 | −0.2389 | |
| 2017 | 0.56 | 0.12 | 0.56 | 0.49 | 0.63 | 0.056 | 0.89 | −0.3125 | 0.4280 | |
| 300 | 2006 | 0.53 | 0.11 | 0.53 | 0.45 | 0.60 | 0.086 | 0.87 | −0.0937 | 0.0042 |
| 2007 | 0.51 | 0.15 | 0.52 | 0.41 | 0.61 | 0.024 | 0.88 | −0.2453 | −0.2379 | |
| 2008 | 0.52 | 0.11 | 0.53 | 0.45 | 0.60 | 0.055 | 0.86 | −0.1837 | 0.2192 | |
| 2009 | 0.55 | 0.12 | 0.55 | 0.48 | 0.63 | 0.087 | 0.87 | −0.2108 | 0.0401 | |
| 2010 | 0.50 | 0.10 | 0.50 | 0.43 | 0.57 | 0.062 | 0.85 | −0.0209 | 0.1092 | |
| 2011 | 0.54 | 0.12 | 0.54 | 0.47 | 0.62 | 0.105 | 0.87 | 0.0241 | 0.0100 | |
| 2012 | 0.51 | 0.14 | 0.53 | 0.42 | 0.61 | 0.069 | 0.86 | −0.3458 | −0.1663 | |
| 2013 | 0.56 | 0.11 | 0.56 | 0.49 | 0.63 | 0.074 | 0.87 | −0.0903 | 0.1060 | |
| 2014 | 0.53 | 0.12 | 0.54 | 0.46 | 0.61 | 0.082 | 0.87 | −0.1569 | 0.0586 | |
| 2015 | 0.53 | 0.11 | 0.53 | 0.46 | 0.60 | 0.072 | 0.88 | −0.0047 | 0.1354 | |
| 2016 | 0.52 | 0.14 | 0.53 | 0.43 | 0.62 | 0.045 | 0.93 | −0.2037 | −0.1898 | |
| 2017 | 0.55 | 0.12 | 0.55 | 0.47 | 0.62 | 0.050 | 0.89 | −0.3184 | 0.5647 |
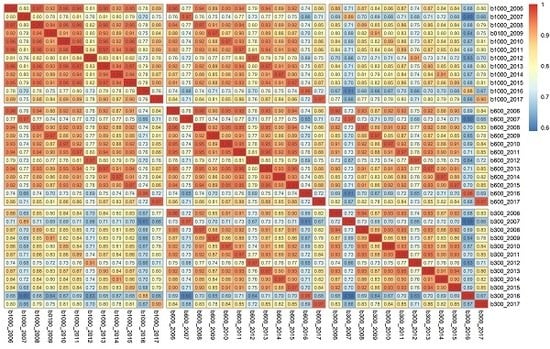
| Buffer (m) | Year | 2006 | 2007 | 2008 | 2009 | 2010 | 2011 | 2012 | 2013 | 2014 | 2015 | 2016 |
|---|---|---|---|---|---|---|---|---|---|---|---|---|
| 1000 | 2007 | 0 | ||||||||||
| 2008 | 0.034 | 0 | ||||||||||
| 2009 | 0 | 0 | 0 | |||||||||
| 2010 | 0 | 0 | 0 | 0 | ||||||||
| 2011 | 0 | 0 | 0 | 0.067 | 0 | |||||||
| 2012 | 0 | 0.331 | 0 | 0 | 0 | 0 | ||||||
| 2013 | 0 | 0 | 0 | 0 | 0 | 0 | 0 | |||||
| 2014 | 0.006 | 0 | 0 | 0 | 0 | 0 | 0 | 0 | ||||
| 2015 | 0.331 | 0 | 0 | 0 | 0 | 0 | 0 | 0 | 0.331 | |||
| 2016 | 0 | 0 | 0 | 0 | 0 | 0 | 0.065 | 0 | 0 | 0 | ||
| 2017 | 0 | 0 | 0 | 0.023 | 0 | 0.708 | 0 | 0 | 0 | 0 | 0 | |
| 600 | 2007 | 0 | ||||||||||
| 2008 | 0.132 | 0 | ||||||||||
| 2009 | 0 | 0 | 0 | |||||||||
| 2010 | 0 | 0 | 0 | 0 | ||||||||
| 2011 | 0 | 0 | 0 | 0 | 0 | |||||||
| 2012 | 0 | 0.132 | 0 | 0 | 0 | 0 | ||||||
| 2013 | 0 | 0 | 0 | 0 | 0 | 0 | 0 | |||||
| 2014 | 0 | 0 | 0 | 0 | 0 | 0 | 0 | 0 | ||||
| 2015 | 0.132 | 0 | 0 | 0 | 0 | 0 | 0 | 0 | 0.064 | |||
| 2016 | 0.001 | 0 | 0.132 | 0 | 0 | 0 | 0.015 | 0 | 0 | 0 | ||
| 2017 | 0 | 0 | 0 | 0.008 | 0 | 0.132 | 0 | 0 | 0 | 0 | 0 | |
| 300 | 2007 | 0 | ||||||||||
| 2008 | 0.437 | 0 | ||||||||||
| 2009 | 0 | 0 | 0 | |||||||||
| 2010 | 0 | 0 | 0 | 0 | ||||||||
| 2011 | 0 | 0 | 0 | 0 | 0 | |||||||
| 2012 | 0 | 0.058 | 0.027 | 0 | 0 | 0 | ||||||
| 2013 | 0 | 0 | 0 | 0 | 0 | 0 | 0 | |||||
| 2014 | 0 | 0 | 0 | 0 | 0 | 0.067 | 0 | 0 | ||||
| 2015 | 0.181 | 0 | 0.006 | 0 | 0 | 0 | 0 | 0 | 0.004 | |||
| 2016 | 0.68 | 0 | 0.68 | 0 | 0 | 0 | 0.009 | 0 | 0 | 0.027 | ||
| 2017 | 0 | 0 | 0 | 0.005 | 0 | 0 | 0 | 0 | 0 | 0 | 0 |
© 2019 by the author. Licensee MDPI, Basel, Switzerland. This article is an open access article distributed under the terms and conditions of the Creative Commons Attribution (CC BY) license (http://creativecommons.org/licenses/by/4.0/).
Share and Cite
Helbich, M. Spatiotemporal Contextual Uncertainties in Green Space Exposure Measures: Exploring a Time Series of the Normalized Difference Vegetation Indices. Int. J. Environ. Res. Public Health 2019, 16, 852. https://doi.org/10.3390/ijerph16050852
Helbich M. Spatiotemporal Contextual Uncertainties in Green Space Exposure Measures: Exploring a Time Series of the Normalized Difference Vegetation Indices. International Journal of Environmental Research and Public Health. 2019; 16(5):852. https://doi.org/10.3390/ijerph16050852
Chicago/Turabian StyleHelbich, Marco. 2019. "Spatiotemporal Contextual Uncertainties in Green Space Exposure Measures: Exploring a Time Series of the Normalized Difference Vegetation Indices" International Journal of Environmental Research and Public Health 16, no. 5: 852. https://doi.org/10.3390/ijerph16050852
APA StyleHelbich, M. (2019). Spatiotemporal Contextual Uncertainties in Green Space Exposure Measures: Exploring a Time Series of the Normalized Difference Vegetation Indices. International Journal of Environmental Research and Public Health, 16(5), 852. https://doi.org/10.3390/ijerph16050852