Loneliness of Older Adults: Social Network and the Living Environment


Abstract
1. Introduction
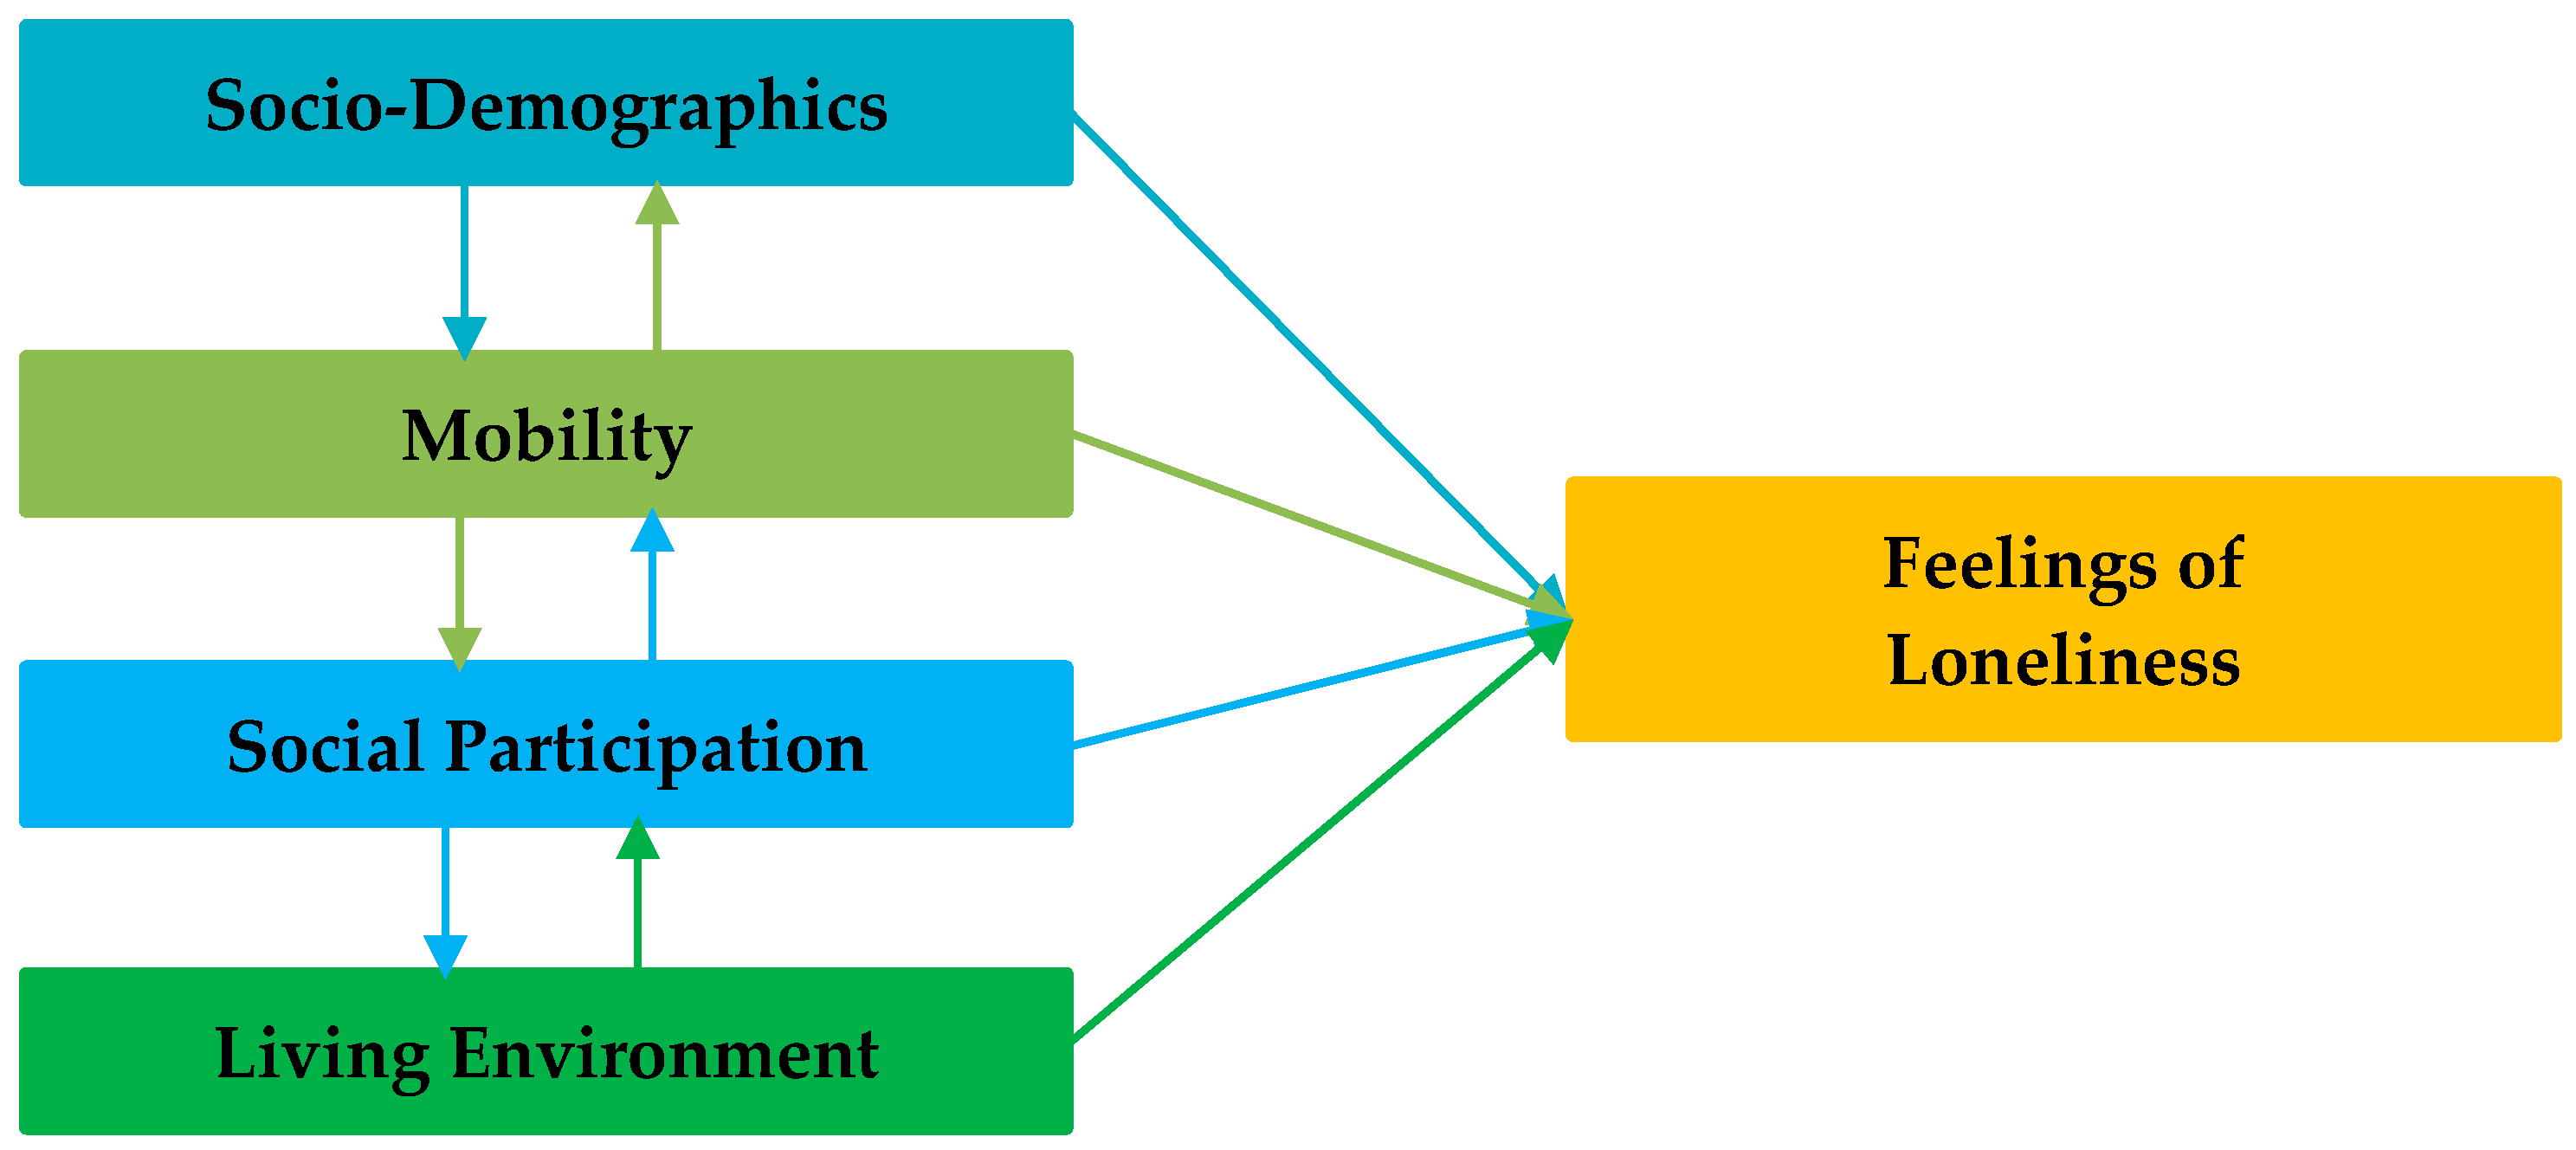
2. Literature Review
3. Materials and Methods
3.1. Data Collection
3.2. Measures
3.2.1. Sociodemographics
3.2.2. Mobility
3.2.3. Social Participation
3.2.4. Living Environment
3.2.5. Loneliness
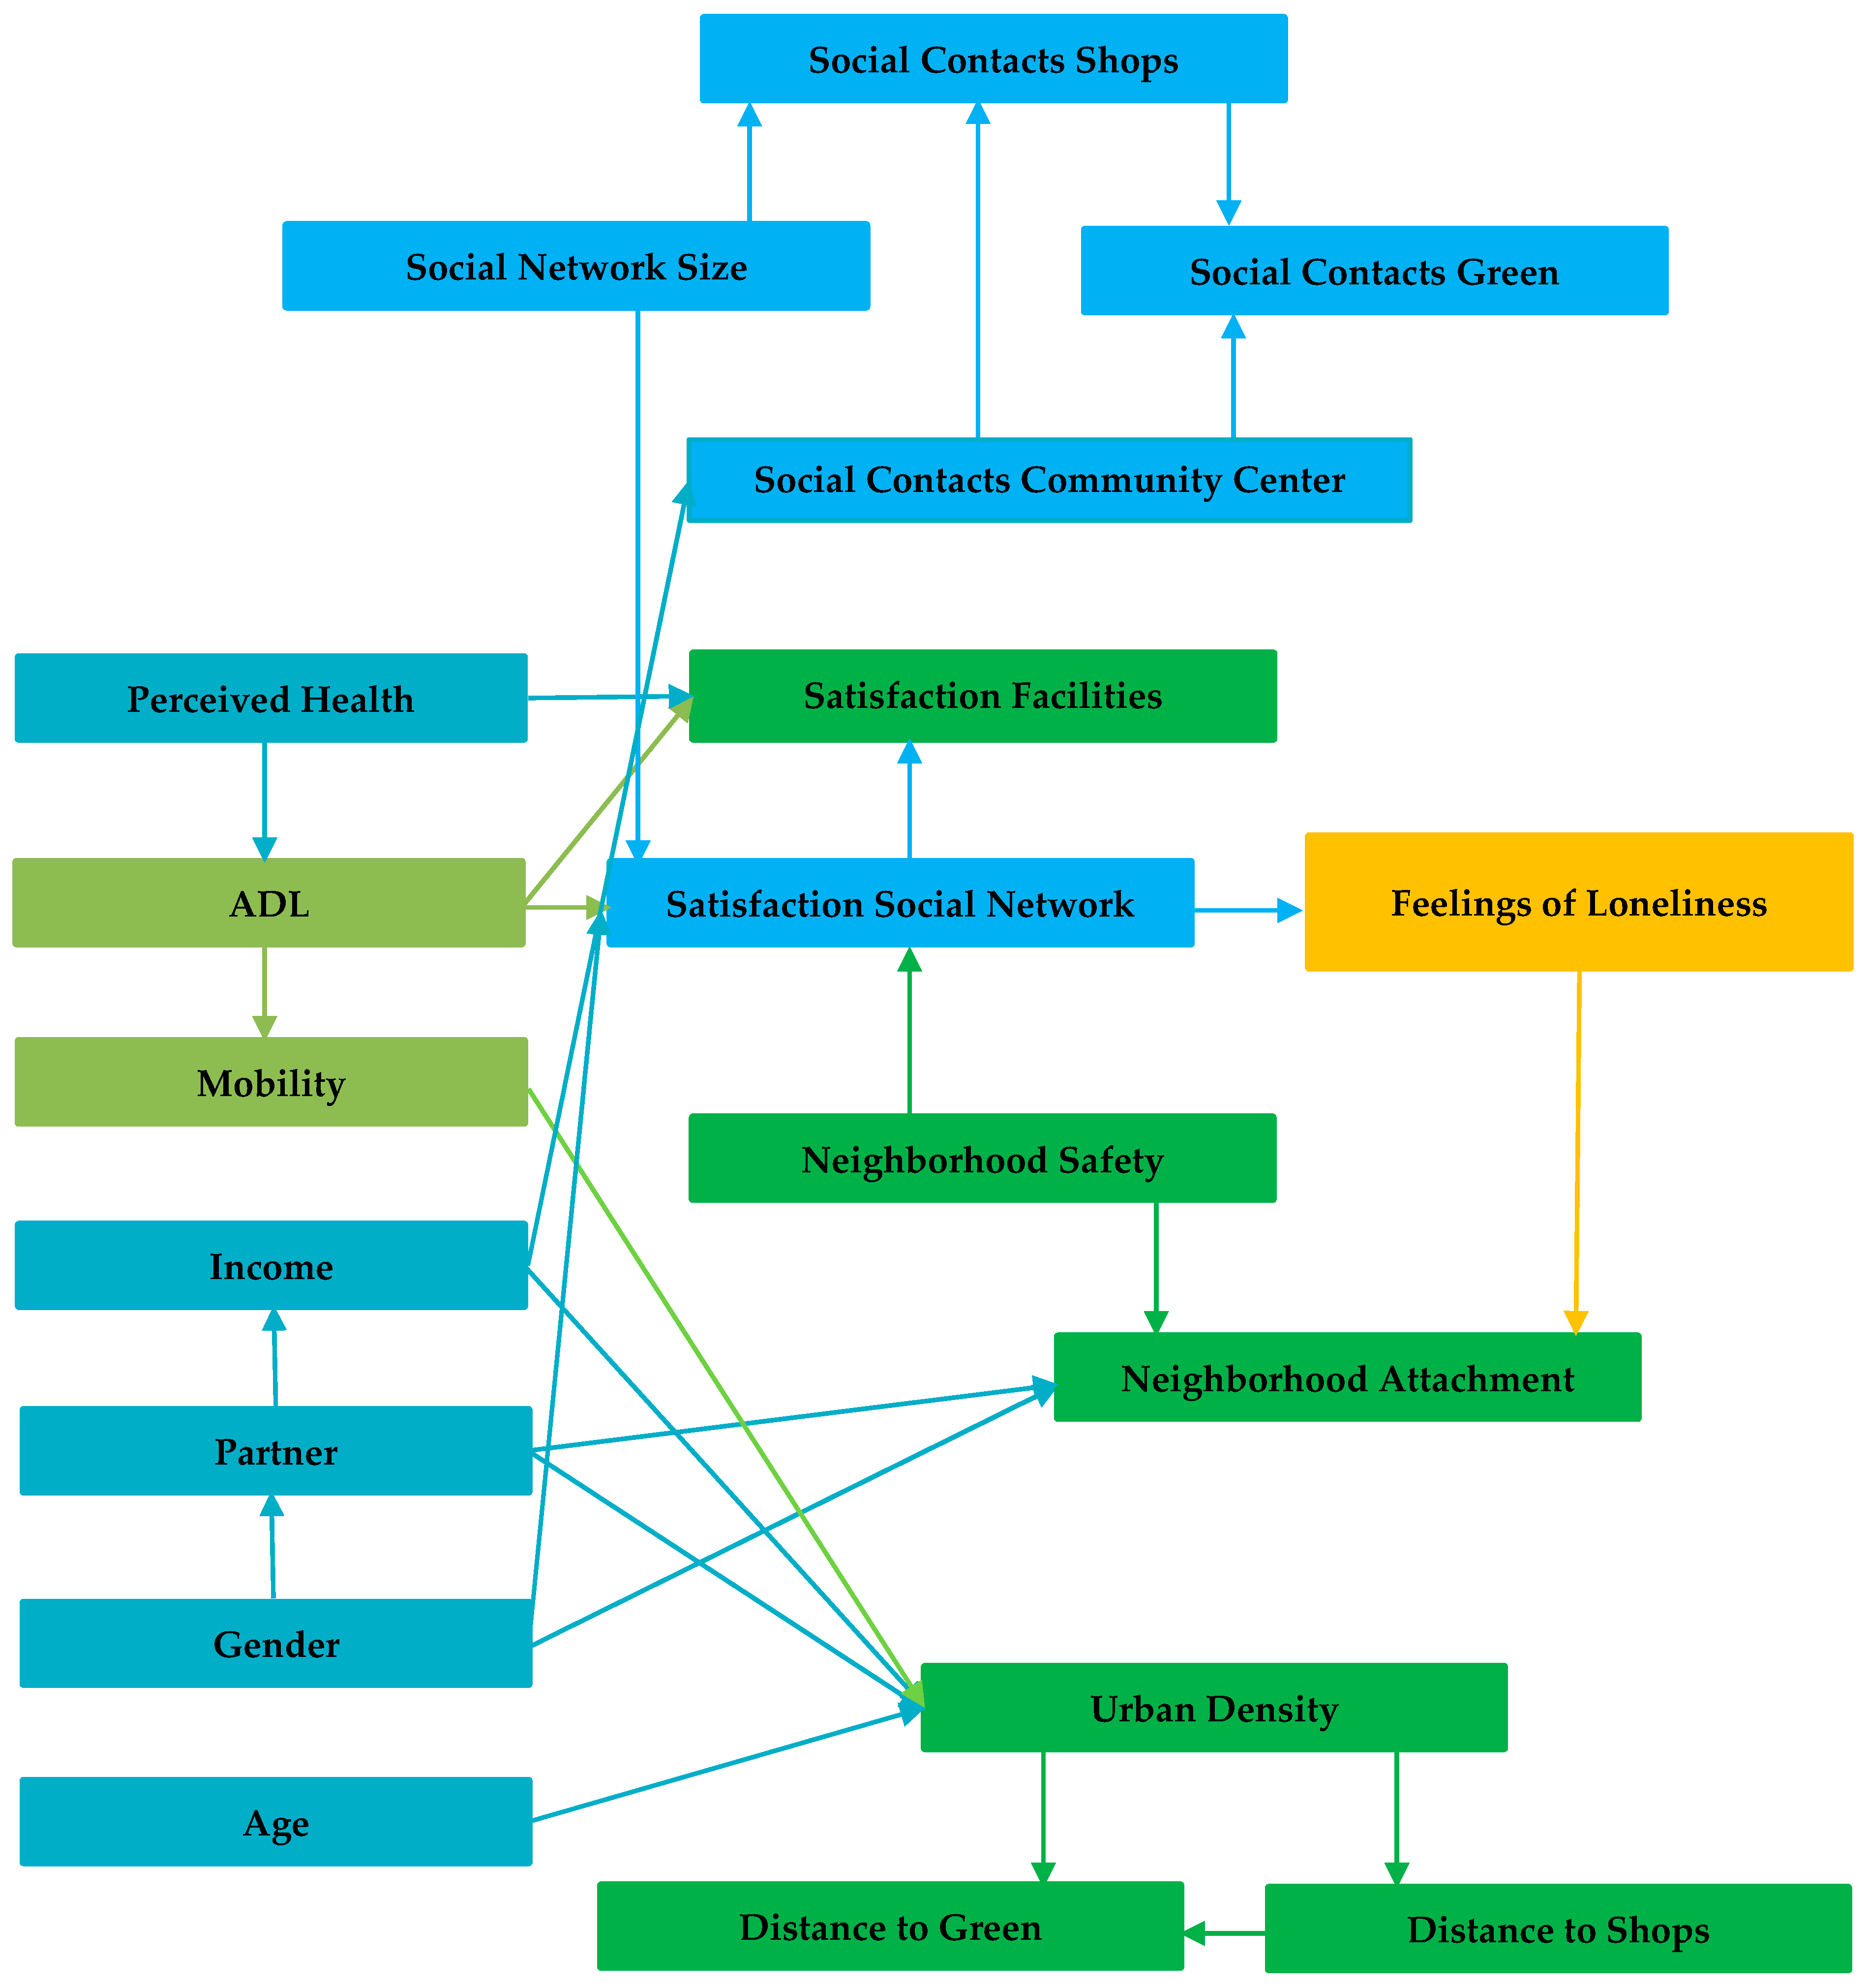
3.3. Bayesian Belief Network Modeling
4. Results
4.1. Profile of Respondents
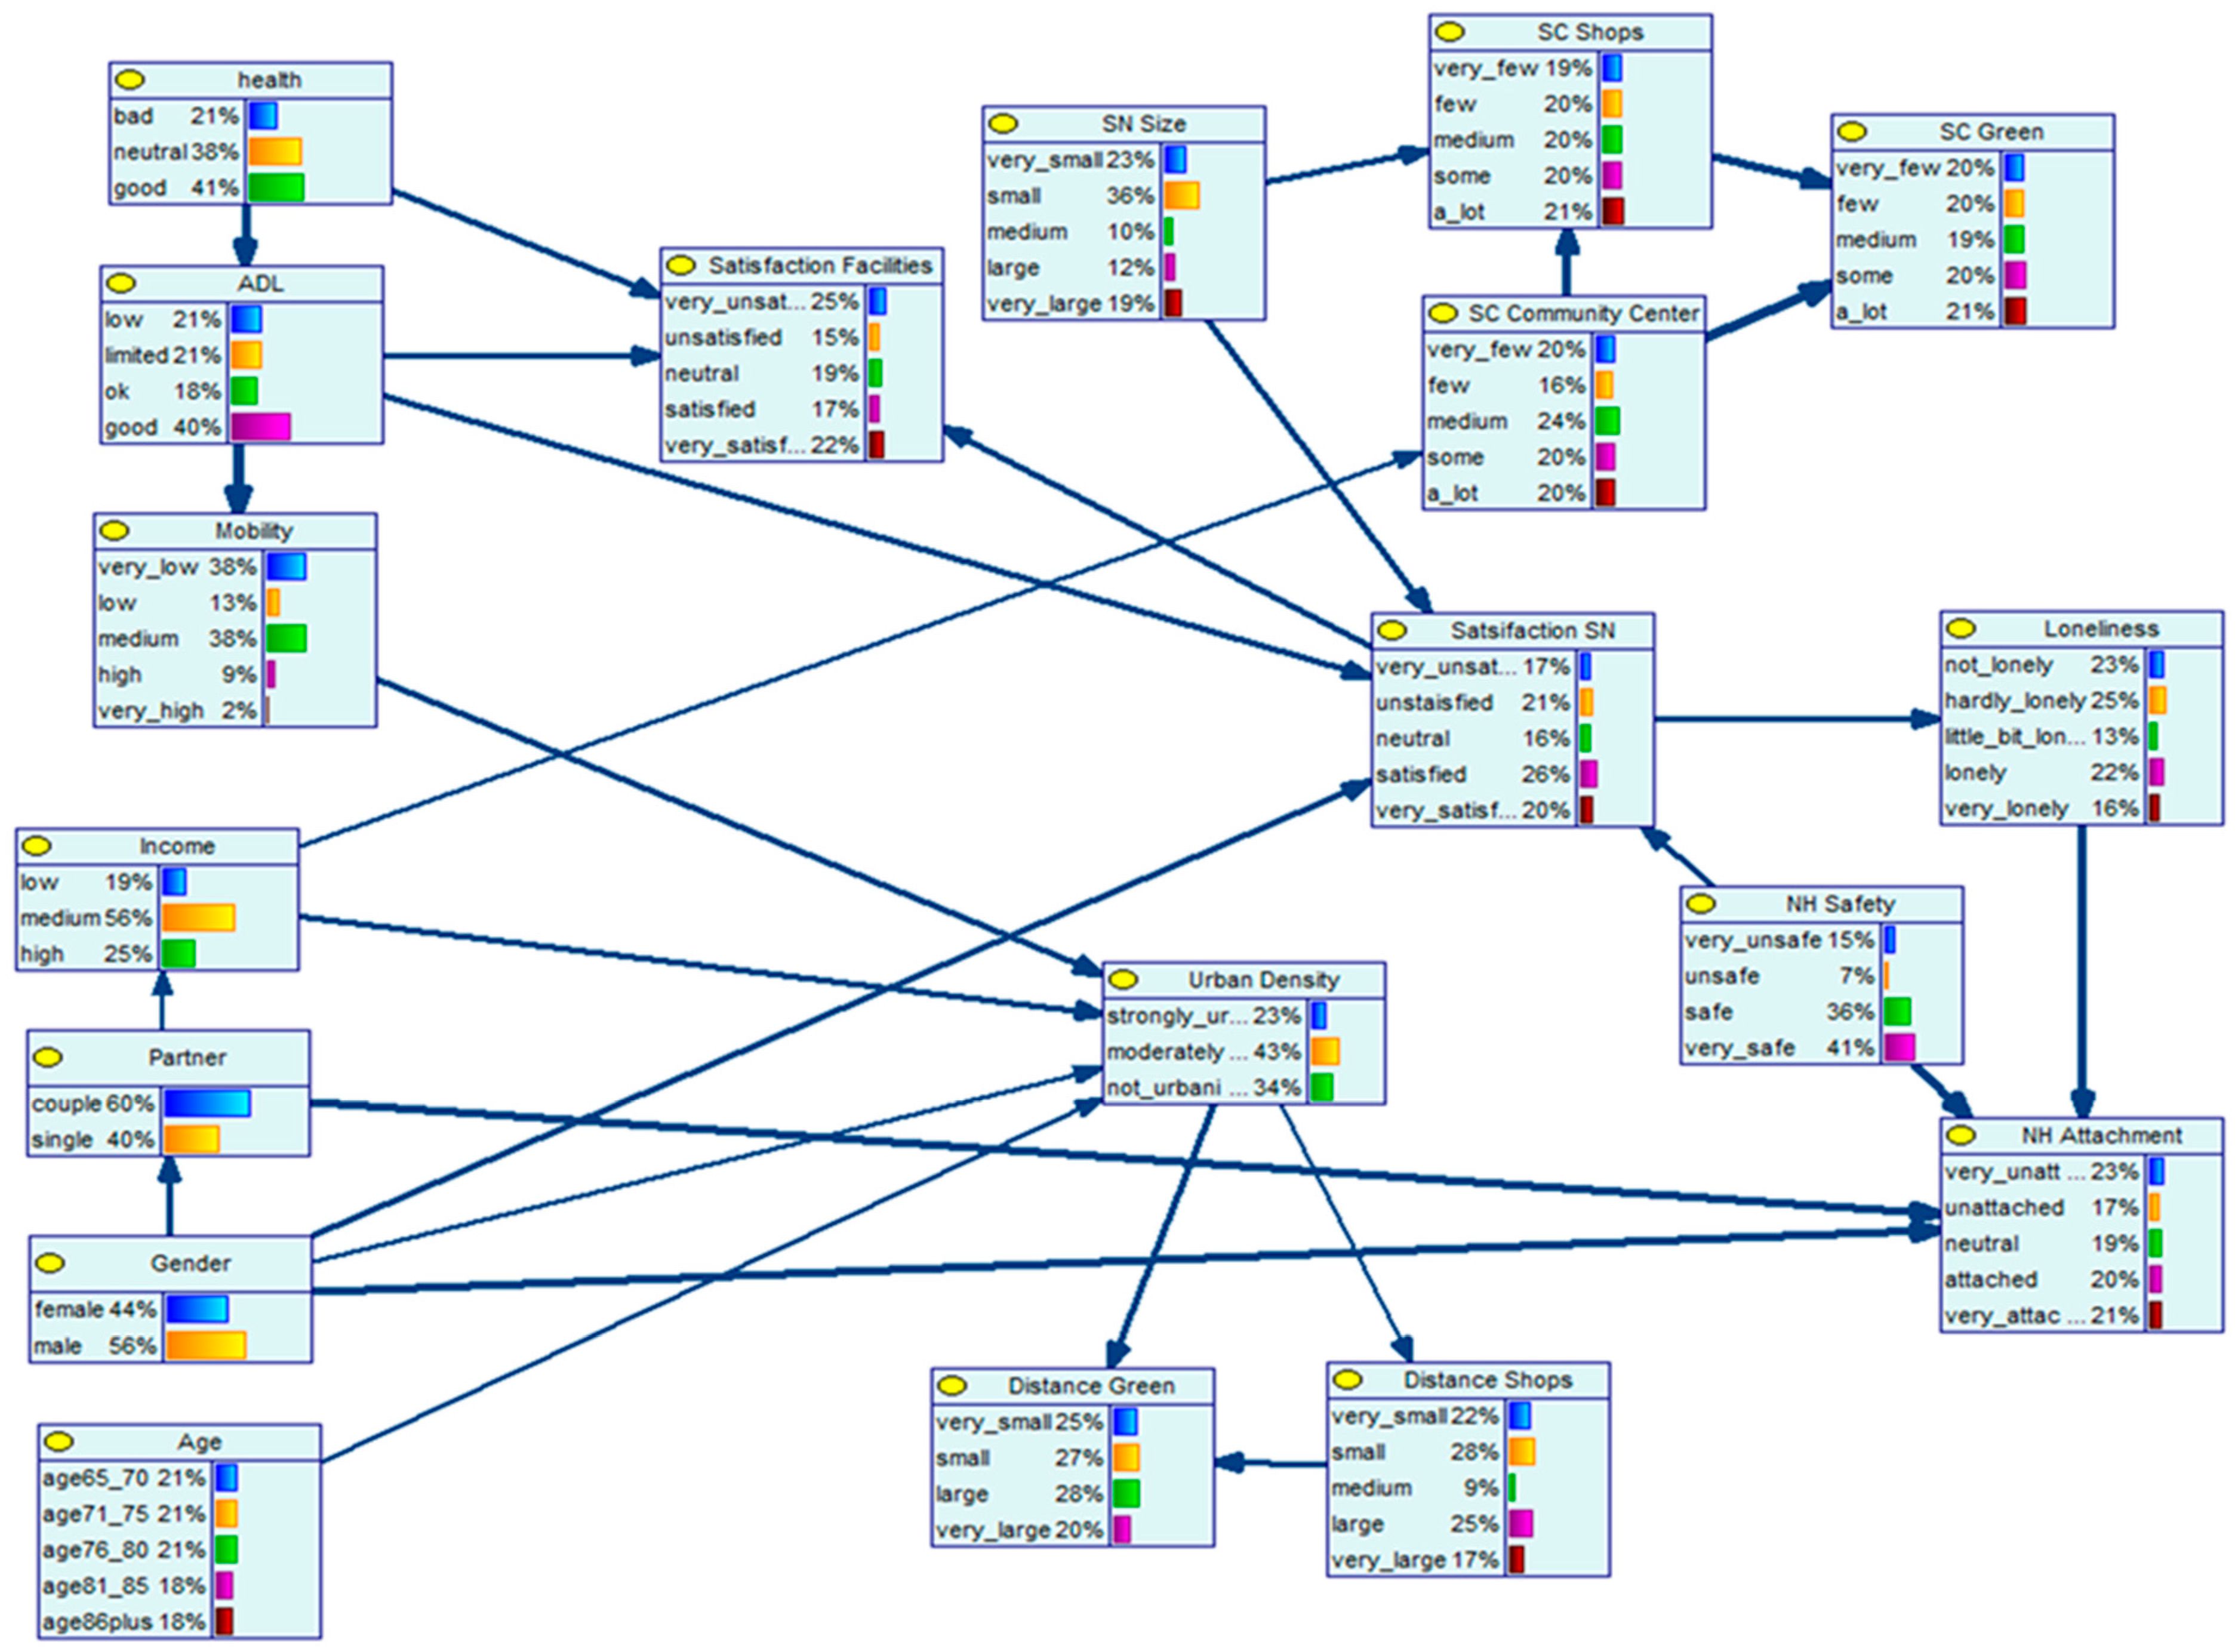
4.2. Bayesian Belief Network
4.2.1. Satisfaction with Social Network and Feelings of Loneliness
4.2.2. Neighborhood Attachment and Feelings of Loneliness
4.2.3. Health Status and Satisfaction with Amenities in the Neighborhood
4.2.4. Neighborhood Safety and Neighborhood Attachment
4.2.5. Neighborhood Safety and Satisfaction with Social Network
5. Discussion
6. Conclusions
Author Contributions
Funding
Conflicts of Interest
References
- United Nations. World Population Prospects: The 2017 Revision, Key Findings and Advance Tables; Working Paper No. ESA/P/WP/248; United Nations: New York, NY, USA, 2017. [Google Scholar]
- Ritsema van Eck, J.; Van Dam, F.; De Groot, C.; De Jong, A. Demografische Ontwikkelingen 2010–2040. Ruimtelijke Effecten en Regionale Diversiteit; Planbureau voor de Leefomgeving: Den Haag, The Netherlands, 2013. [Google Scholar]
- Patterson, I. Baby boomers and adventure tourism: The importance of marketing the leisure experience. World Leis. 2002, 44, 4–10. [Google Scholar] [CrossRef]
- Pino, L.; González-Vélez, A.E.; Prieto-Flores, M.-E.; Ayala, A.; Fernandez-Mayoralas, G.; Rojo-Perez, F.; Martinez-Martin, P.; Forjaz, M.J. Self-perceived health and quality of life by activity status in community-dwelling older adults. Geriatr. Gerontol. Int. 2013, 14, 464–473. [Google Scholar] [CrossRef] [PubMed]
- Tang, F.; Lee, Y. Social support networks and expectations for aging in place and moving. Res. Aging 2011, 33, 444–464. [Google Scholar] [CrossRef]
- Von Hippel, W.; Henry, J.D.; Matovic, D. Aging and social satisfaction: Offsetting positive and negative effects. Psychol. Aging 2008, 23, 435–439. [Google Scholar] [CrossRef] [PubMed]
- Cattan, M.; White, M.; Bond, J.; Learmouth, A. Preventing social isolation and loneliness among older people: A systematic review of health promotion interventions. Ageing Soc. 2005, 25, 41–67. [Google Scholar] [CrossRef]
- Ettema, D.; Gärling, T.; Olsson, L.E.; Friman, M. Out-of-home activities, daily travel, and subjective well-being. Transp. Res. A Policy Pract. 2010, 44, 723–732. [Google Scholar] [CrossRef]
- Helliwell, J.F.; Putnam, R.D. The social context of well-being. Philos. Trans. R. Soc. Lond. B Biol. Sci. 2004, 359, 1435–1446. [Google Scholar] [CrossRef]
- Schwanen, T.; Wang, D. Well-being, context, and everyday activities in space and time. Ann. Am. Assoc. Geogr. 2014, 104, 833–851. [Google Scholar] [CrossRef]
- Delmelle, E.C.; Haslauer, E.; Prinz, T. Social satisfaction, commuting and neighborhoods. J. Transp. Geogr. 2013, 30, 110–116. [Google Scholar] [CrossRef]
- Umberson, D.; Montez, J.K. Social relationships and health: A flashpoint for health policy. J. Health Soc. Behav. 2010, 51 (Suppl. 1), S54–S66. [Google Scholar] [CrossRef]
- Boldy, D.; Grenade, L.; Lewin, G.; Karol, E.; Burton, E. Older peoples decisions regarding ‘ageing in place’: A Western Australian case study. Australasian J. Ageing 2010, 30, 136–142. [Google Scholar] [CrossRef] [PubMed]
- World Health Organization. Global Age-Friendly Cities: A Guide; WHO: Geneva, Switzerland, 2007. [Google Scholar]
- Davey, J.; Nana, G.; De Joux, V.; Arcus, M.; NewZealand Institute for Research on Ageing/Business & Economic Research Ltd. Accommodation Options for Older People in Aotearoa/New Zealand; Centre for Housing Research Aotearoa/New Zealand: Wellington, New Zealand, 2004. [Google Scholar]
- Greenfield, E.A. Support from neighbors and aging in place: Can NORC programs make a difference? Gerontologist 2015, 56, 651–659. [Google Scholar] [CrossRef] [PubMed]
- Keenan, T.A. Home and Community Preferences of the 45+ Population; AARP Research & Strategic Analysis: Washington, DC, USA, 2010. [Google Scholar]
- Levasseur, M.; Généreux, M.; Bruneau, J.-F.; Vanasse, A.; Chabot, É.; Beaulac, C.; Bédard, M.-M. Importance of proximity to resources, social support, transportation and neighborhood security for mobility and social participation in older adults: Results from a scoping study. BMC Public Health 2015, 15, 503. [Google Scholar] [CrossRef] [PubMed]
- Dallago, L.; Perkins, D.D.; Santinello, M.; Boyce, W.; Molcho, M.; Morgan, A. Adolescent place attachment, social capital, and perceived safety: A comparison of 13 countries. Am. J. Community Psychol. 2009, 44, 148–160. [Google Scholar] [CrossRef] [PubMed]
- Livingston, M.; Bailey, N.; Kearns, A. People’s Attachment to Place: The Influence of Neighbourhood Deprivation; Project Report; Charterd Institute of Housing/Joseph Rowntree Foundation: Coventry, UK, 2008. [Google Scholar]
- Bowling, A.; Stafford, M. How do objective and subjective assessments of neighbourhood influence social and physical functioning in older age? Findings from a British survey of ageing. Sos. Sci. Med. 2007, 64, 2533–2549. [Google Scholar] [CrossRef] [PubMed]
- Weijs-Perrée, M.; Van den Berg, P.; Arentze, T.; Kemperman, A. Social networks, social satisfaction and place attachment in the neighborhood. Region 2017, 4, 133. [Google Scholar] [CrossRef]
- Perissinotto, C.M.; Cenzer, I.S.; Covinsky, K.E. Loneliness in older persons: A predictor of functional decline and death. JAMA Intern. Med. 2012, 172, 1078–1083. [Google Scholar] [CrossRef]
- Scharf, T.; De Jong-Gierveld, J. Loneliness in urban neighbourhoods: An Anglo-Dutch comparison. Eur. J. Ageing 2008, 5, 103–115. [Google Scholar] [CrossRef]
- Van den Berg, P.; Kemperman, A.; De Kleijn, B.; Borgers, A. Ageing and loneliness: The role of mobility and the built environment. Trav. Behav. Soc. 2016, 5, 48–55. [Google Scholar] [CrossRef]
- De Jong-Gierveld, J.; Van Tilburg, T. The De Jong Gierveld short scales for emotional and social loneliness: Tested on data from 7 countries in the UN generations and gender surveys. Eur. J. Ageing 2010, 7, 121–130. [Google Scholar] [CrossRef]
- De Jong-Gierveld, J. Eenzaamheid: Een Meersporig Onderzoek; Van Loghum Slaterus: Deventer, The Netherlands, 1984. [Google Scholar]
- Demakakos, P.; Nunn, S.; Nazroo, J. Loneliness, relative deprivation and life satisfaction. In Retirement, Health and Relationships of the Older Population in England: The 2004 English Longitudinal Study of Ageing (Wave 2); Banks, J., Breeze, E., Lessof, C., Nazroo, J., Eds.; The Institute for Fiscal Studies: London, UK, 2006; pp. 297–338. [Google Scholar]
- Moorer, P.; Suurmeijer, T.P.B.M. The effects of neighbourhoods on size of social network of the elderly and loneliness: A multilevel approach. Urban Stud. 2001, 38, 105–118. [Google Scholar] [CrossRef]
- Wenger, G.C. Social networks and the prediction of elderly people at risk. Aging Ment. Health. 1997, 1, 311–320. [Google Scholar] [CrossRef]
- Wenger, G.C.; Tucker, I. Using network variation in practice: Identification of support network type. Health Soc. Care Community 2002, 10, 28–35. [Google Scholar] [CrossRef] [PubMed]
- Weijs-Perrée, M.; Van den Berg, P.; Arentze, T.; Kemperman, A. Factors influencing social satisfaction and loneliness: A path analysis. J. Transp. Geogr. 2015, 45, 24–31. [Google Scholar] [CrossRef]
- Bonsang, E.; Soest, A. Satisfaction with job and income among older individuals across European countries. SSRN Elec. J. 2010, 105, 227–254. [Google Scholar] [CrossRef]
- Wrzus, C.; Hänel, M.; Wagner, J.; Neyer, F.J. Social network changes and life events across the life span: A meta-analysis. Psychol. Bull. 2013, 139, 53–80. [Google Scholar] [CrossRef] [PubMed]
- Pinquart, M.; Sörensen, S. Influences on loneliness in older adults: A meta-analysis. Basic Appl. Soc. Psychol. 2001, 23, 245–266. [Google Scholar] [CrossRef]
- Coyle, C.E.; Dugan, E. Social isolation, loneliness and health among older adults. J. Aging Health 2012, 24, 1346–1363. [Google Scholar] [CrossRef]
- Havens, B.; Hall, M. Social isolation, loneliness, and the health of older adults. Indian J. Gerontol. 2001, 14, 144–153. [Google Scholar]
- Kweon, B.-S.; Sullivan, W.C.; Wiley, A.R. Green common spaces and the social integration of inner-city older adults. Environ. Behav. 1998, 30, 832–858. [Google Scholar] [CrossRef]
- Metz, D. Mobility of older people and their quality of life. Transp. Policy 2000, 7, 149–152. [Google Scholar] [CrossRef]
- Spinney, J.E.; Scott, D.M.; Newbold, K.B. Transport mobility benefits and quality of life: A time-use perspective of elderly Canadians. Transp. Policy 2009, 16, 1–11. [Google Scholar] [CrossRef]
- Glanz, T.A. Walkability, Social Interaction, and Neighborhood Design. Regional Planning Program: Student Projects and Theses. 2011. Available online: http://digitalcommons.unl.edu/cgi/viewcontent.cgi?article=1005&context=arch_crp_theses (accessed on 9 January 2019).
- Hacihasanoğlu, R.; Yildirim, A.; Karakurt, P. Loneliness in elderly individuals, level of dependence in activities of daily living (ADL) and influential factors. Arch. Gerontol. Geriatr. 2012, 54, 61–66. [Google Scholar] [CrossRef] [PubMed]
- Nyqvist, F.; Victor, C.R.; Forsman, A.K.; Cattan, M. The association between social capital and loneliness in different age groups: A population-based study in Western Finland. BMC Public Health 2016, 16, 542. [Google Scholar] [CrossRef] [PubMed]
- Van der Houwen, K.; Kloosterman, R. Vertrouwen in En Contacten met Buurtgenoten. 2011. Available online: https://www.cbs.nl/nl-nl/achtergrond/2011/13/veel-vertrouwen-en-contact-in-de-buurt (accessed on 9 January 2019).
- Roh, S.; Jang, Y.; Chiriboga, D.A.; Kwag, K.H.; Cho, S.; Bernstein, K. Perceived neighborhood environment affecting physical and mental health: A study with Korean American older adults in New York City. J. Immigr. Minor. Health 2011, 13, 1005–1012. [Google Scholar] [CrossRef] [PubMed]
- Kearns, A.; Whitley, E.; Tannahill, C.; Ellaway, A. ‘Lonesome town’? Is loneliness associated with the residential environment, including housing and neighborhood factors? J. Community Psychol. 2015, 43, 849–867. [Google Scholar] [CrossRef] [PubMed]
- Suurmeijer, T.P.; Doeglas, D.M.; Moum, T.; Briançon, S.; Krol, B.; Sanderman, R.; Guillemin, F.; Bjelle, A.; Van den Heuvel, W.J. The Groningen activity restriction scale for measuring disability: Its utility in international comparisons. Am. J. Public Health 1994, 84, 1270–1273. [Google Scholar] [CrossRef]
- Hendriks, S. Woonzorgzones. Woonzorgzones en de Woontevredenheid vna 75-Plussers. Een Onderzoek naar Woonzorgzone Drielanden in Harderwijk; Universiteit Utrecht: Utrecht, The Netherlands, 2009. [Google Scholar]
- De Jong-Gierveld, J.; Van Tilburg, T. A 6-item scale for overall, emotional, and social loneliness. Res. Aging 2006, 28, 582–598. [Google Scholar] [CrossRef]
- Arentze, T.A.; Timmermans, H.J.P. Regimes in social-cultural events-driven activity sequences: Modeling approach and empirical application. Transp. Res. A Policy Pract. 2009, 43, 311–322. [Google Scholar] [CrossRef]
- Heckerman, D.; Mandani, A.; Wellman, M.P. Real-world applications of Bayesian networks. Commun. ACM 1995, 38, 24–26. [Google Scholar] [CrossRef]
- Pearl, J. Probabilistic Reasoning in Intelligent Systems: Networks of Plausible Inference; Morgan Kaufman: San Francisco, CA, USA, 1988. [Google Scholar]
- Kemperman, A.D.A.M.; Timmermans, H.J.P. Green spaces in the direct living environment and social contacts of the aging population. Landsc. Urban. Plan. 2014, 129, 44–54. [Google Scholar] [CrossRef]
- Cheng, J.; Bell, D.; Liu, W. Learning Bayesian networks from data: An information-theory based approach. Artif. Intell. 2002, 137, 43–90. [Google Scholar] [CrossRef]
- Lauritzen, S.L. The EM algorithm for graphical association models with missing data. Comput. Stat. Data Anal. 1995, 19, 191–201. [Google Scholar] [CrossRef]
- BayesFusion. Genie 2.1. 2018. Available online: https://www.bayesfusion.com/news/ (accessed on 15 January 2018).
- Hur, M.; Morrow-Jones, H. Factors that influence residents’ satisfaction with neighborhoods. Environ. Behav. 2008, 40, 619–635. [Google Scholar] [CrossRef]
- Afshar, P.F.; Foroughan, M.; Vedadhir, A.; Tabatabaei, M.G. The effects of place attachment on social well-being in older adults. Educ. Gerontol. 2016, 43, 45–51. [Google Scholar] [CrossRef]
- Morrison, P.S.; Smith, R. Loneliness: An overview. In Narratives of Loneliness: Multidisciplinary Perspectives from the 21st Century; Sagan, O., Miller, E., Eds.; Routledge: London, UK, 2017; pp. 11–25. [Google Scholar]


| Item | Factor: Mobility Intensity |
|---|---|
| Car driver | 0.705 |
| Bicycling | 0.677 |
| Walking | 0.758 |
| Eigenvalue | 1.5 |
| % of explained variance Walking | 51 |
| Item | Factor: Satisfaction with Social Network |
|---|---|
| Satisfaction social contacts | 0.884 |
| Satisfaction network size | 0.889 |
| Satisfaction network quality | 0.905 |
| Eigenvalue | 2.4 |
| % of explained variance | 80 |
| Item | Factor 1: Recreation Spaces | Factor 2: Community Amenities | Factor 3: Shopping Amenities |
|---|---|---|---|
| shops daily goods | 0.859 | ||
| shops non-daily good | 0.835 | ||
| sport amenities | 0.732 | ||
| community center | 0.753 | ||
| cafes/restaurants | 0.685 | ||
| green spaces | 0.869 | ||
| walking/biking amenities | 0.847 | ||
| recreational areas | 0.669 | ||
| Eigenvalue | 3.3 | 1.1 | 1.113 |
| % of explained variance | 41 | 14 |
| Item | Factor: Neighborhood Attachment |
|---|---|
| I’m attached to my neighborhood | 0.624 |
| I’m actively involved in my neighborhood | 0.493 |
| I like the type of people living in my neighborhood | 0.780 |
| I like the social contacts in my neighborhood | 0.877 |
| People in my neighborhood share similar values and beliefs | 0.811 |
| People in my neighborhood help each other | 0.805 |
| I feel at home in my neighborhood | 0.815 |
| Eigenvalue | 4.0 |
| % of explained variance | 57 |
| Item | Factor: Neighborhood Safety |
|---|---|
| Safety during the day | 0.927 |
| Safety at night | 0.927 |
| Eigenvalue | 1.7 |
| % of explained variance | 86 |
| Item | Factor: Satisfaction with Amenities |
|---|---|
| Public transport | 0.675 |
| Care amenities | 0.607 |
| Sport amenities | 0.793 |
| Food & drink amenities | 0.754 |
| Community center | 0.777 |
| Green spaces | 0.686 |
| Walking & biking amenities | 0.733 |
| Recreational amenities | 0.714 |
| Eigenvalue | 4.1 |
| % of explained variance | 52 |
| Variables | Levels | % | Variables | Levels | % |
|---|---|---|---|---|---|
| Sociodemographics | |||||
| Gender | Male | 44.0 | Partner | No | 60.4 |
| Female | 56.0 | Yes | 39.6 | ||
| Income level | Low | 18.7 | Perceived health | (very) Bad | 21.4 |
| Medium | 56.0 | Neutral | 37.9 | ||
| High | 25.3 | (very) Good | 40.7 | ||
| Age | 65–70 | 17.0 | |||
| 71–75 | 22.5 | ||||
| 76–80 | 19.2 | ||||
| 81–85 | 23.6 | ||||
| 86+ | 17.6 | ||||
| Mobility | |||||
| Mobility Intensity | Very low | 18.1 | Activities of Daily Living | Low | 21.4 |
| Low | 18.1 | Limited | 20.9 | ||
| Medium | 24.2 | Ok | 17.6 | ||
| High | 18.7 | Good | 40.1 | ||
| Very high | 20.9 | ||||
| Social Participation | |||||
| Network size | Very small | 22.5 | Satisfaction Social Network | Very unsatisfied | 14.8 |
| Small | 36.3 | Unsatisfied | 24.2 | ||
| Medium | 10.4 | Neutral | 14.3 | ||
| Large | 11.5 | Satisfied | 30.2 | ||
| Very large | 19.2 | Very satisfied | 16.5 | ||
| Social contacts in green spaces | Very few | 20.3 | Social contacts in sport amenities | Very few | 19.8 |
| Few | 19.8 | Few | 16.5 | ||
| Medium | 19.2 | Medium | 23.6 | ||
| Some | 20.9 | Some | 20.3 | ||
| A lot | 19.8 | A lot | 19.8 | ||
| Social contacts in shops | Very few | 19.8 | |||
| Few | 20.3 | ||||
| Medium | 19.8 | ||||
| Some | 20.3 | ||||
| A lot | 19.8 | ||||
| Living Environment | |||||
| Urban density | Urban | 45.1 | Neighborhood Safety | Very unsafe | 15.4 |
| Suburban | 19.8 | Unsafe | 7.1 | ||
| Rural | 35.2 | Safe | 36.3 | ||
| Very safe | 41.2 | ||||
| Distance to green | Very small | 19.8 | Distance to shops | Very small | 18.1 |
| Small | 39.6 | Small | 34.6 | ||
| Large | 21.4 | Medium | 7.1 | ||
| Very large | 19.2 | Large | 22.5 | ||
| Very large | 17.6 | ||||
| Neighborhood attachment | Very unattached | 23.6 | Satisfaction with amenities | Very unsatisfied | 28.0 |
| Unattached | 16.5 | Unsatisfied | 12.1 | ||
| Neutral | 18.1 | Neutral | 20.3 | ||
| Attached | 23.1 | Satisfied | 15.9 | ||
| Very attached | 18.7 | Very satisfied | 23.6 | ||
| Loneliness | |||||
| Feelings of loneliness | Not lonely | 23.1 | |||
| Hardly lonely | 25.3 | ||||
| Little bit lonely | 12.6 | ||||
| Lonely | 23.1 | ||||
| Very lonely | 15.9 | ||||
| Satisfaction Social Network | Feelings of Loneliness | Total | ||||
|---|---|---|---|---|---|---|
| Not Lonely | Hardly Lonely | Little Bit Lonely | Lonely | Very Lonely | ||
| Very unsatisfied | 0 | 7 | 7 | 30 | 56 | 100 |
| Unsatisfied | 2 | 14 | 14 | 43 | 27 | 100 |
| Neutral | 12 | 31 | 3 | 23 | 4 | 100 |
| Satisfied | 40 | 36 | 9 | 13 | 2 | 100 |
| Very satisfied | 53 | 33 | 7 | 7 | 0 | 100 |
| No evidence | 23 | 25 | 13 | 22 | 16 | 100 |
| Feelings of Loneliness | Neighborhood Attachment | Total | ||||
|---|---|---|---|---|---|---|
| Very Unattached | Unattached | Neutral | Attached | Very Attached | ||
| Not lonely | 8 | 15 | 18 | 25 | 34 | 100 |
| Hardly lonely | 18 | 6 | 38 | 18 | 20 | 100 |
| Little bit lonely | 7 | 41 | 6 | 21 | 25 | 100 |
| Lonely | 31 | 24 | 13 | 20 | 12 | 100 |
| Very lonely | 55 | 12 | 8 | 12 | 14 | 100 |
| No evidence | 23 | 17 | 19 | 20 | 21 | 100 |
| ADL | Satisfaction with Amenities | Total | ||||
|---|---|---|---|---|---|---|
| Very Unsatisfied | Unsatisfied | Neutral | Satisfied | Very Satisfied | ||
| Low | 49 | 14 | 12 | 5 | 20 | 100 |
| Limited | 33 | 16 | 22 | 23 | 6 | 100 |
| Ok | 37 | 11 | 10 | 11 | 31 | 100 |
| Good | 14 | 12 | 25 | 19 | 31 | 100 |
| No evidence | 27 | 14 | 20 | 16 | 23 | 100 |
| Safety | Neighborhood Attachment | Total | ||||
|---|---|---|---|---|---|---|
| Very Unattached | Unattached | Neutral | Attached | Very Attached | ||
| Very unsafe | 37 | 15 | 21 | 12 | 14 | 100 |
| Unsafe | 28 | 19 | 18 | 20 | 15 | 100 |
| Safe | 21 | 18 | 21 | 23 | 17 | 100 |
| Very safe | 18 | 17 | 16 | 20 | 28 | 100 |
| No evidence | 23 | 17 | 19 | 20 | 21 | 100 |
| Safety | Satisfaction Social Network | Total | ||||
|---|---|---|---|---|---|---|
| Very Unsatisfied | Unsatisfied | Very Unsatisfied | Unsatisfied | Very Unsatisfied | ||
| Very unsafe | 22 | 25 | 11 | 28 | 13 | 100 |
| Unsafe | 15 | 21 | 25 | 24 | 15 | 100 |
| Safe | 23 | 19 | 18 | 27 | 13 | 100 |
| Very safe | 11 | 22 | 14 | 25 | 29 | 100 |
| No evidence | 17 | 21 | 16 | 26 | 20 | 100 |
© 2019 by the authors. Licensee MDPI, Basel, Switzerland. This article is an open access article distributed under the terms and conditions of the Creative Commons Attribution (CC BY) license (http://creativecommons.org/licenses/by/4.0/).
Share and Cite
Kemperman, A.; van den Berg, P.; Weijs-Perrée, M.; Uijtdewillegen, K. Loneliness of Older Adults: Social Network and the Living Environment. Int. J. Environ. Res. Public Health 2019, 16, 406. https://doi.org/10.3390/ijerph16030406
Kemperman A, van den Berg P, Weijs-Perrée M, Uijtdewillegen K. Loneliness of Older Adults: Social Network and the Living Environment. International Journal of Environmental Research and Public Health. 2019; 16(3):406. https://doi.org/10.3390/ijerph16030406
Chicago/Turabian StyleKemperman, Astrid, Pauline van den Berg, Minou Weijs-Perrée, and Kevin Uijtdewillegen. 2019. "Loneliness of Older Adults: Social Network and the Living Environment" International Journal of Environmental Research and Public Health 16, no. 3: 406. https://doi.org/10.3390/ijerph16030406
APA StyleKemperman, A., van den Berg, P., Weijs-Perrée, M., & Uijtdewillegen, K. (2019). Loneliness of Older Adults: Social Network and the Living Environment. International Journal of Environmental Research and Public Health, 16(3), 406. https://doi.org/10.3390/ijerph16030406