The Accuracy of Digital Face Scans Obtained from 3D Scanners: An In Vitro Study


Abstract

1. Introduction
2. Materials and Methods
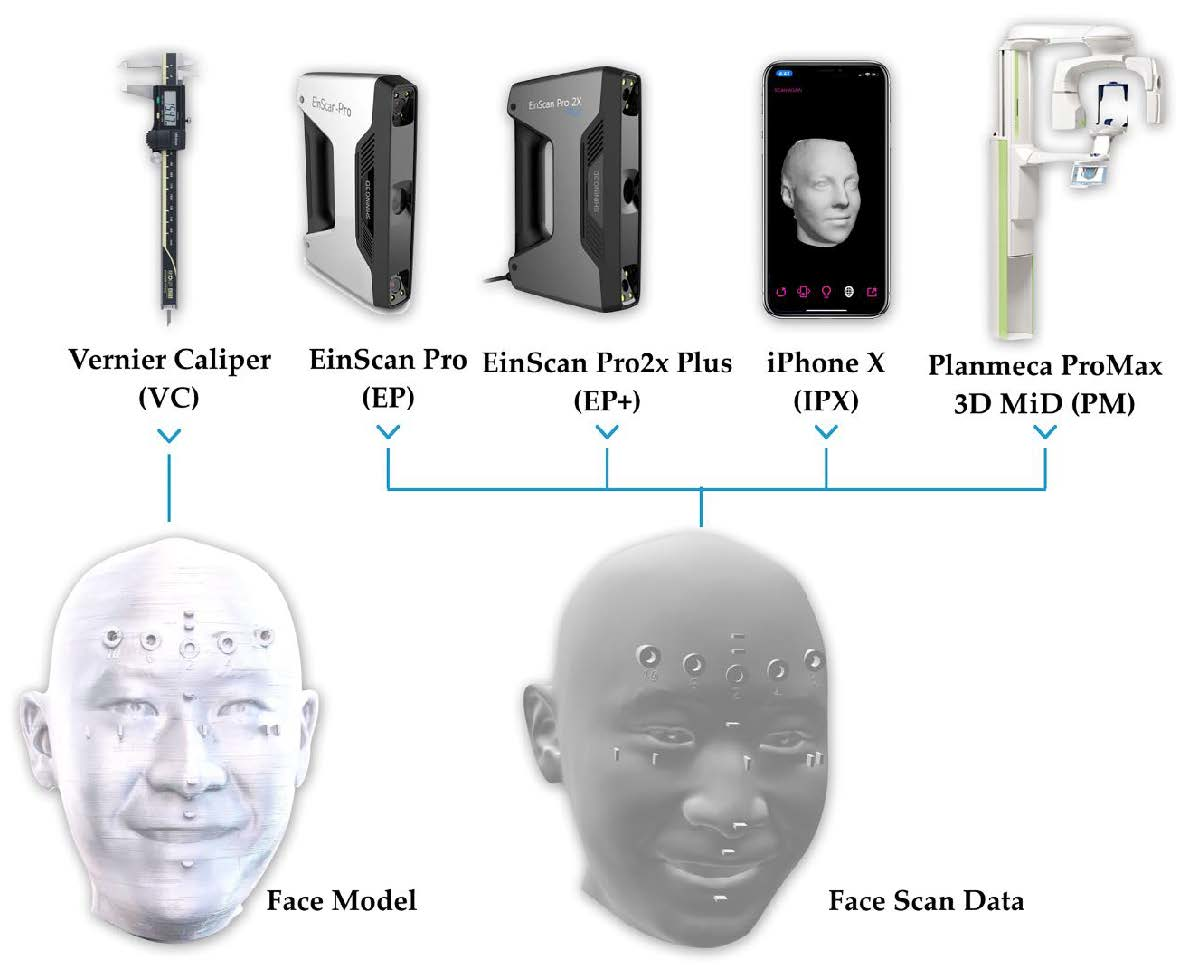
2.1. Scanning
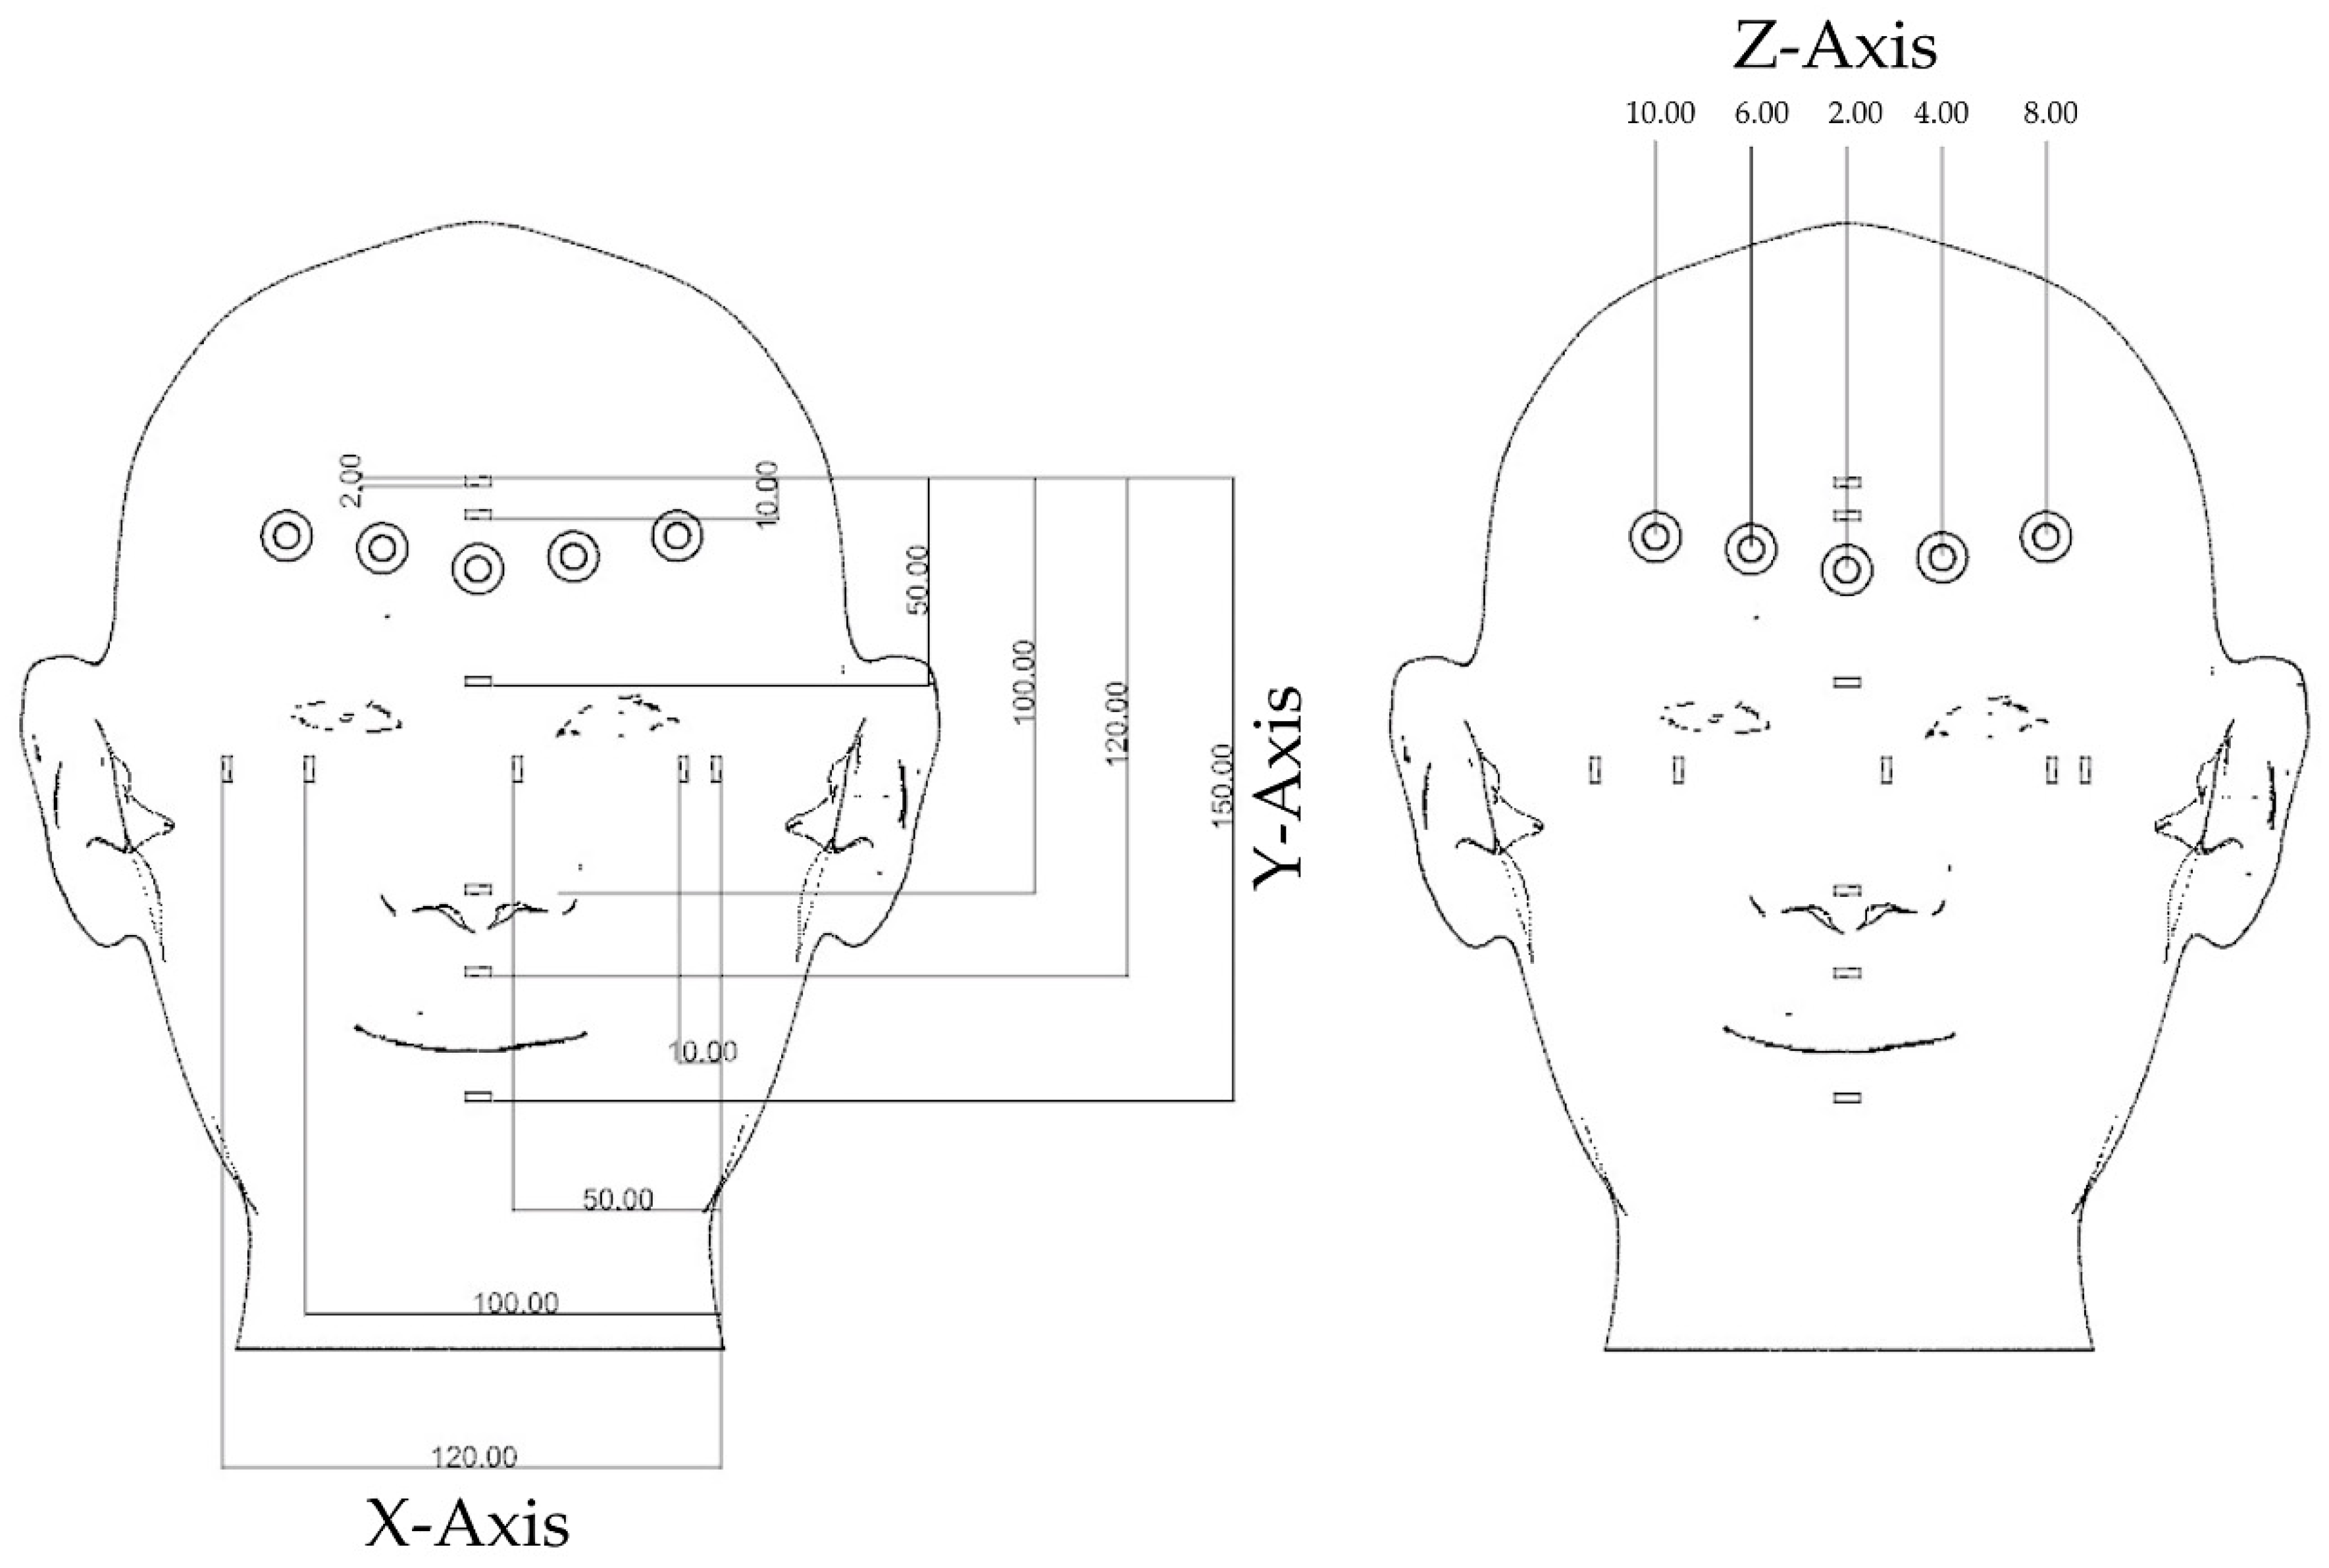
2.2. Measurement
2.3. Comparison
3. Results
3.1. Scanning Time
3.2. Scanning Accuracy
4. Discussion
5. Conclusions
- The accuracy of a 3D scanner is affected by the scanning length and pattern of scanning.
- The accuracy of an optical scan is dependent on the technology used by each scanner.
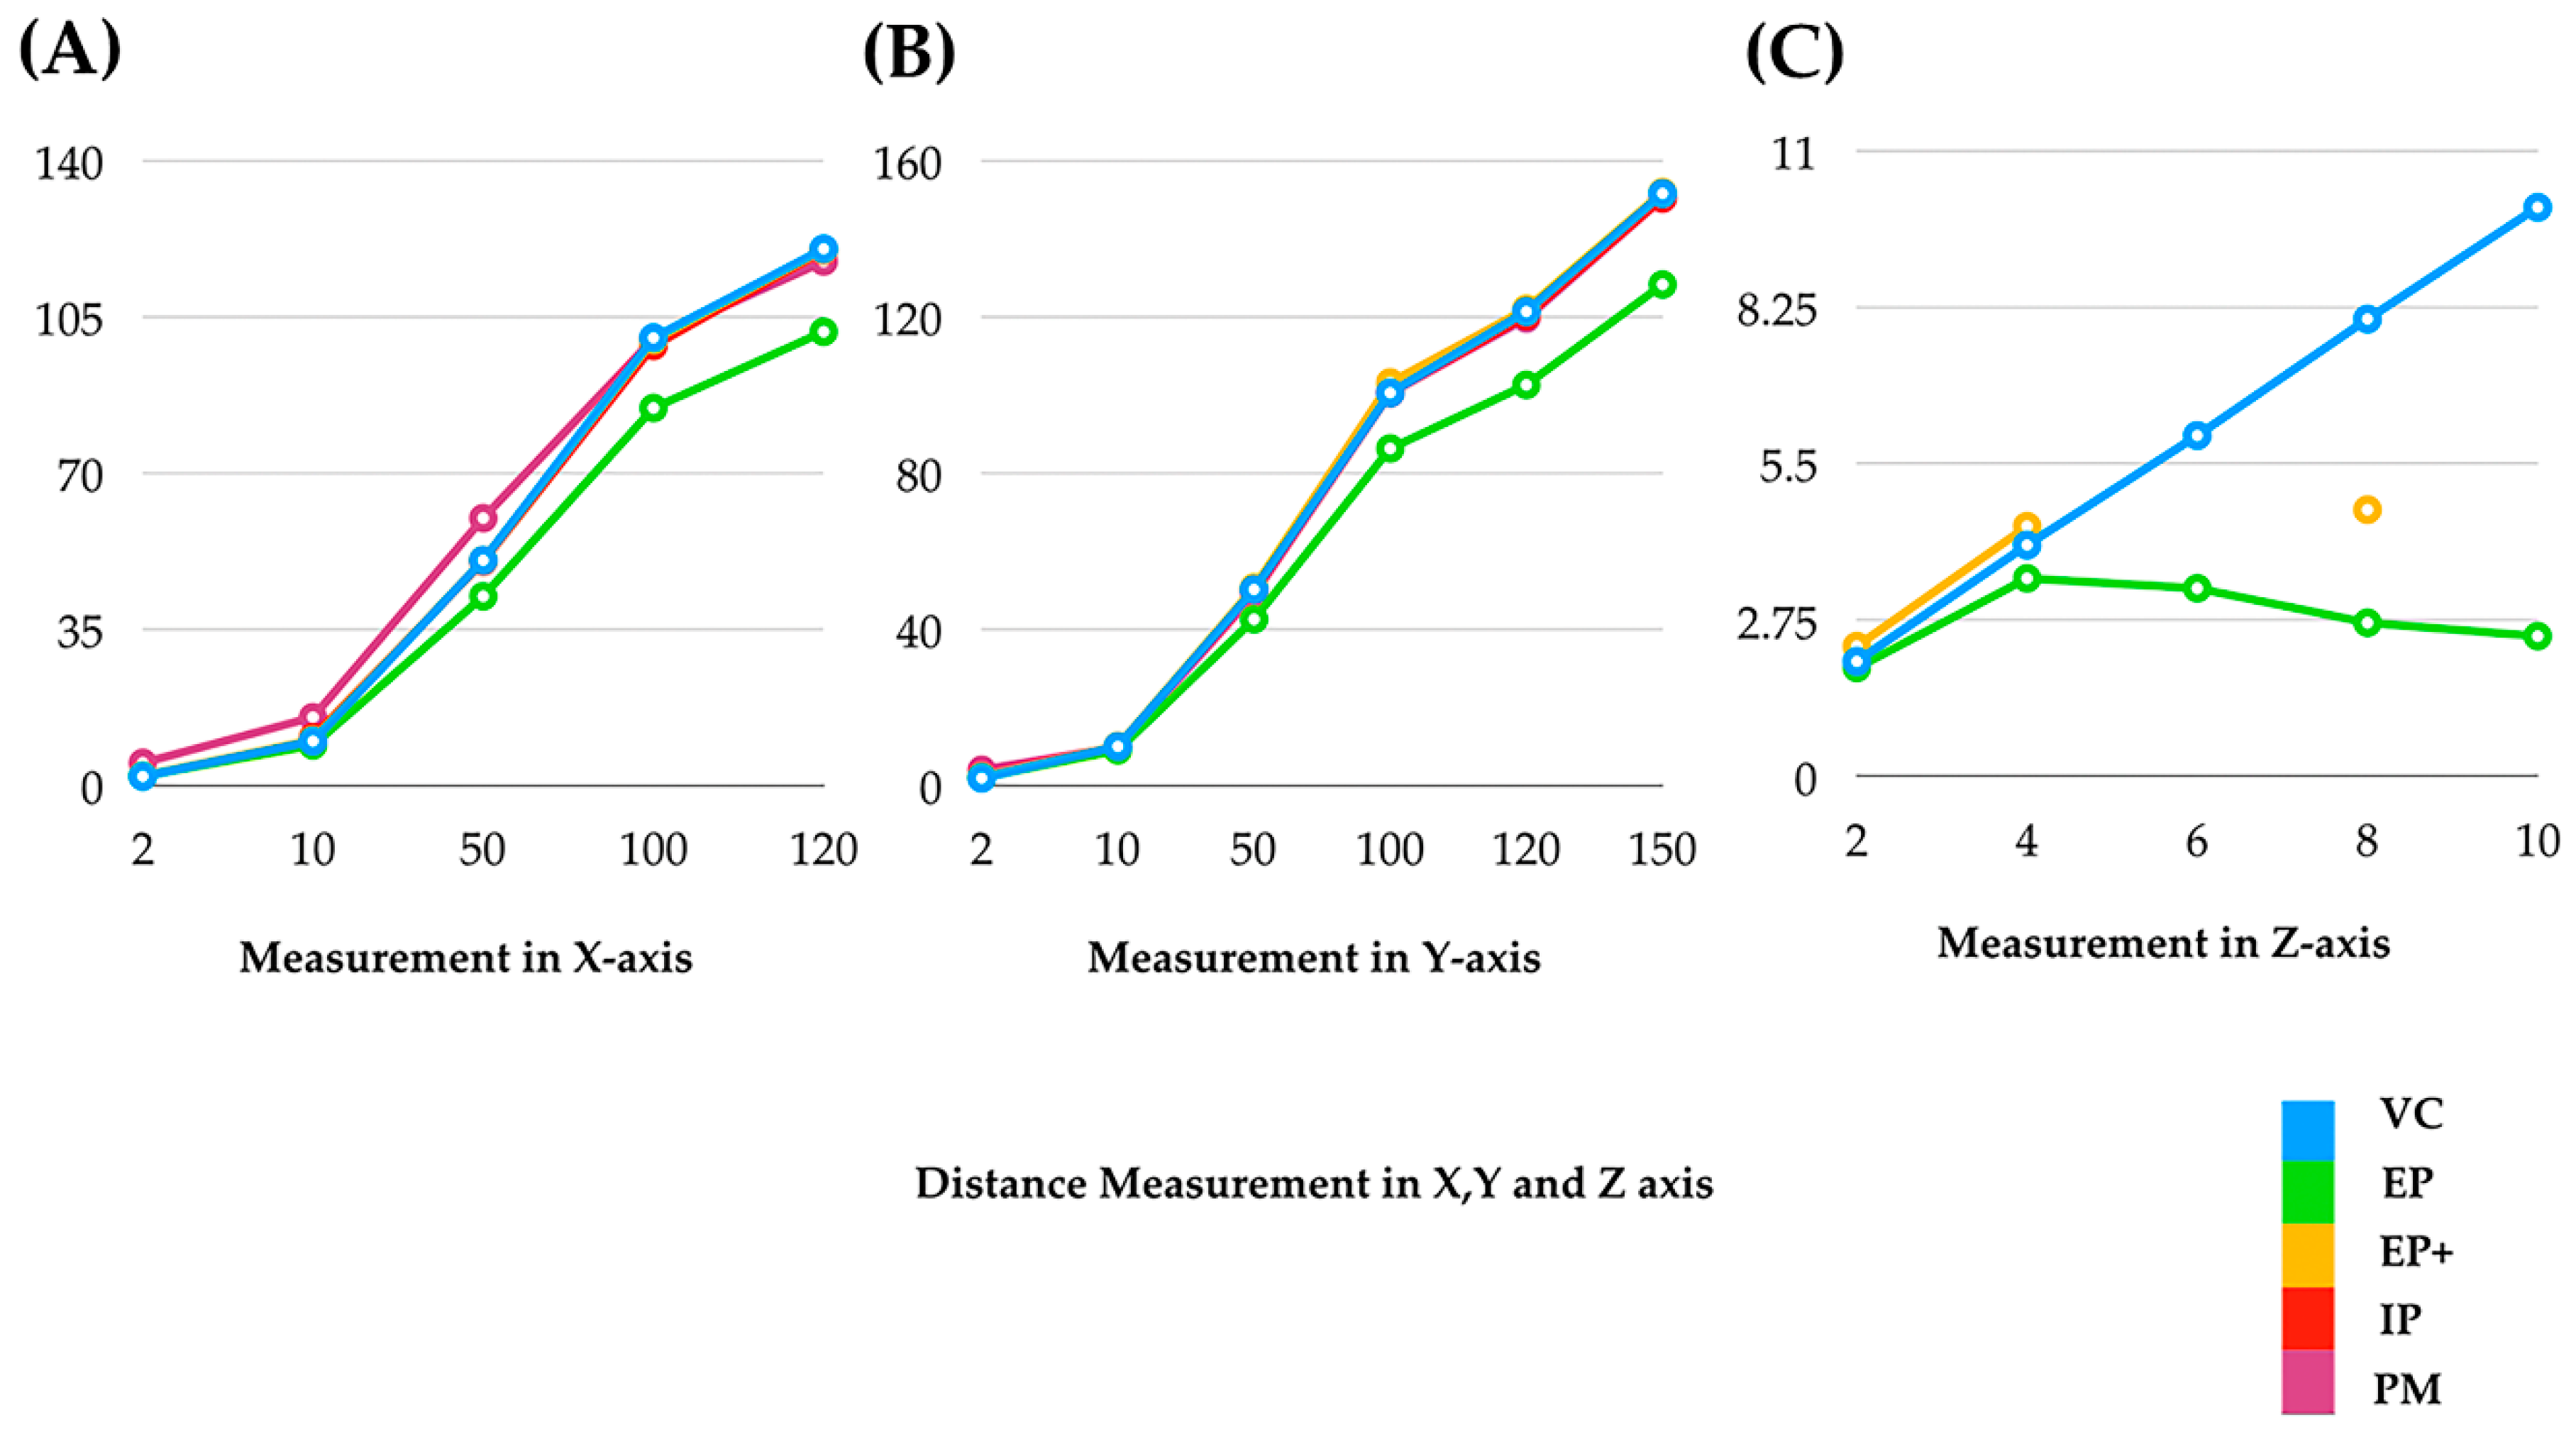
- Among the scanners evaluated, EinScan Pro 2X Plus (EP+) showed the highest accuracy (accuracy until 150 mm of length). EinScan Pro (EP) showed moderate accuracy (accurate until 10 mm of length). iPhone (IPX) and ProMax 3D Mid (PM) showed the least accuracy (accuracy from 10 mm to 120 mm in length).
- In addition, EP+ showed accuracy measuring the 2 mm of depth (diameter 6 mm). All other scanners (EP, IPX, and PM) showed less accuracy measuring depth.
- Hence, it is recommended to use EinScan Pro 2X Plus for the face scan for facial driven design and other scanning purposes.
- For measuring the depth of more than 2 mm, these scanners are not recommended. Further development of the scanners is needed for accurately measuring depth.
Author Contributions
Acknowledgments
Conflicts of Interest
References
- Ahmad, I. Anterior dental aesthetics: Facial perspective. Br. Dent. J. 2005, 199, 15–21. [Google Scholar] [CrossRef] [PubMed][Green Version]
- Zhao, Y.J.; Xiong, Y.X.; Wang, Y. Three-Dimensional Accuracy of Facial Scan for Facial Deformities in Clinics: A New Evaluation Method for Facial Scanner Accuracy. PLoS ONE 2017, 12, e0169402. [Google Scholar] [CrossRef] [PubMed]
- Li, C.; Barreto, A.; Chin, C.; Zhai, J. Biometric identification using 3D face scans. Biomed. Sci. Instrum. 2006, 42, 320–325. [Google Scholar] [PubMed]
- Xiao, N.G.; Perrotta, S.; Quinn, P.C.; Wang, Z.; Sun, Y.H.P.; Lee, K. On the facilitative effects of face motion on face recognition and its development. Front. Psychol. 2014, 5, 633. [Google Scholar] [CrossRef] [PubMed]
- Berlin, N.F.; Berssenbrügge, P.; Runte, C.; Wermker, K.; Jung, S.; Kleinheinz, J.; Dirksen, D. Quantification of facial asymmetry by 2D analysis—A comparison of recent approaches. J. Cranio Maxillofac. Surg. 2014, 42, 265–271. [Google Scholar] [CrossRef]
- Kim, J.Y.; Jung, H.D.; Jung, Y.S.; Hwang, C.J.; Park, H.S. A simple classification of facial asymmetry by TML system. J. Cranio Maxillofac. Surg. 2014, 42, 313–320. [Google Scholar] [CrossRef] [PubMed]
- Zeike, S.; Choi, K.E.; Lindert, L.; Pfaff, H. Managers’ Well-Being in the Digital Era: Is it Associated with Perceived Choice Overload and Pressure from Digitalization? An Exploratory Study. Int. J. Environ. Res. Public Health 2019, 16, 1746. [Google Scholar] [CrossRef]
- Berssenbrügge, P.; Berlin, N.F.; Kebeck, G.; Runte, C.; Jung, S.; Kleinheinz, J.; Dirksen, D. 2D and 3D analysis methods of facial asymmetry in comparison. J. Cranio Maxillofac. Surg. 2014, 42, e327–e334. [Google Scholar] [CrossRef]
- Toma, A.; Zhurov, A.; Playle, R.; Ong, E.; Richmond, S. Reproducibility of facial soft tissue landmarks on 3D laser-scanned facial images. Orthod. Craniofac. Res. 2009, 12, 33–42. [Google Scholar] [CrossRef]
- Ko, B.C. A Brief Review of Facial Emotion Recognition Based on Visual Information. Sensors 2018, 18, 401. [Google Scholar] [CrossRef]
- Zuo, K.J.; Saun, T.J.; Forrest, C.R. Facial Recognition Technology: A Primer for Plastic Surgeons. Plast. Reconstr. Surg. 2019, 143, 1298e–1306e. [Google Scholar] [CrossRef] [PubMed]
- Hibler, B.P.; Schwitzer, J.; Rossi, A.M.; Hible, B.P. Assessing Improvement of Facial Appearance and Quality of Life after Minimally-Invasive Cosmetic Dermatology Procedures Using the FACE-Q Scales. J. Drugs Dermatol. 2016, 15, 62–67. [Google Scholar] [PubMed]
- Lee, J.G.; Jung, S.J.; Lee, H.J.; Seo, J.H.; Choi, Y.J.; Bae, H.S.; Park, J.T.; Kim, H.J. Quantitative anatomical analysis of facial expression using a 3D motion capture system: Application to cosmetic surgery and facial recognition technology. Clin. Anat. 2015, 28, 735–744. [Google Scholar] [CrossRef] [PubMed]
- Huang, Y.H.; Seelaus, R.; Zhao, L.; Patel, P.K.; Cohen, M. Virtual surgical planning and 3D printing in prosthetic orbital reconstruction with percutaneous implants: A technical case report. Int. Med Case Rep. J. 2016, 9, 341–345. [Google Scholar] [CrossRef] [PubMed]
- Beuer, F.; Schweiger, J.; Edelhoff, D. Digital dentistry: An overview of recent developments for CAD/CAM generated restorations. Br. Dent. J. 2008, 204, 505–511. [Google Scholar] [CrossRef] [PubMed]
- Davidowitz, G.; Kotick, P.G. The use of CAD/CAM in dentistry. Dent. Clin. N. Am. 2011, 55, 559–570. [Google Scholar] [CrossRef]
- Ferrini, F.; Sannino, G.; Chiola, C.; Capparé, P.; Gastaldi, G.; Gherlone, E.F. Influence of Intra-Oral Scanner (I.O.S.) on The Marginal Accuracy of CAD/CAM Single Crowns. Int. J. Environ. Res. Public Health 2019, 16, 544. [Google Scholar] [CrossRef]
- Solaberrieta, E.; Garmendia, A.; Brizuela, A.; Otegi, J.R.; Pradíes, G.; Szentpétery, A. Intraoral Digital Impressions for Virtual Occlusal Records: Section Quantity and Dimensions. BioMed Res. Int. 2016, 2016, 1–7. [Google Scholar] [CrossRef]
- Richert, R.; Goujat, A.; Venet, L.; Viguie, G.; Viennot, S.; Robinson, P.; Farges, J.C.; Fages, M.; Ducret, M. Intraoral Scanner Technologies: A Review to Make a Successful Impression. J. Health Eng. 2017, 2017, 8427595. [Google Scholar] [CrossRef]
- Jacobs, R.; Salmon, B.; Codari, M.; Hassan, B.; Bornstein, M.M. Cone beam computed tomography in implant dentistry: Recommendations for clinical use. BMC Oral Health 2018, 18, 88. [Google Scholar] [CrossRef]
- Scarfe, W.; Li, Z.; Aboelmaaty, W.; Scott, S.; Farman, A. Maxillofacial cone beam computed tomography: Essence, elements and steps to interpretation. Aust. Dent. J. 2012, 57, 46–60. [Google Scholar] [CrossRef] [PubMed]
- Mangano, C.; Luongo, F.; Migliario, M.; Mortellaro, C.; Mangano, F.G. Combining Intraoral Scans, Cone Beam Computed Tomography and Face Scans: The Virtual Patient. J. Craniofac. Surg. 2018, 29, 2241–2246. [Google Scholar] [CrossRef]
- Pellegrino, G.; Mangano, C.; Mangano, R.; Ferri, A.; Taraschi, V.; Marchetti, C. Augmented reality for dental implantology: A pilot clinical report of two cases. BMC Oral Health 2019, 19, 158. [Google Scholar] [CrossRef] [PubMed]
- Kumar, M.; D’Souza, S.J. Comparative Evaluation of Two Techniques in Achieving Balanced Occlusion in Complete Dentures. Med. J. Armed Forces India 2010, 66, 362–366. [Google Scholar] [CrossRef][Green Version]
- Hassan, B.; Greven, M.; Wismeijer, D. Integrating 3D facial scanning in a digital workflow to CAD/CAM design and fabricate complete dentures for immediate total mouth rehabilitation. J. Adv. Prosthodont. 2017, 9, 381–386. [Google Scholar] [CrossRef] [PubMed]
- Hassan, B.; Gimenez Gonzalez, B.; Tahmaseb, A.; Greven, M.; Wismeijer, D. A digital approach integrating facial scanning in a CAD-CAM workflow for complete-mouth implant-supported rehabilitation of patients with edentulism: A pilot clinical study. J. Prosthet. Dent. 2017, 117, 486–492. [Google Scholar] [CrossRef] [PubMed]
- AlGhazzawi, T.F. Advancements in CAD/CAM technology: Options for practical implementation. J. Prosthodont. Res. 2016, 60, 72–84. [Google Scholar] [CrossRef] [PubMed]
- Solaberrieta, E.; Garmendia, A.; Minguez, R.; Brizuela, A.; Pradies, G. Virtual facebow technique. J. Prosthet. Dent. 2015, 114, 751–755. [Google Scholar] [CrossRef]
- Solaberrieta, E.; Otegi, J.R.; Minguez, R.; Etxaniz, O. Improved digital transfer of the maxillary cast to a virtual articulator. J. Prosthet. Dent. 2014, 112, 921–924. [Google Scholar] [CrossRef]
- Lee, H.; Cha, J.; Chun, Y.-S.; Kim, M. Comparison of the occlusal contact area of virtual models and actual models: A comparative in vitro study on Class I and Class II malocclusion models. BMC Oral Health 2018, 18, 109. [Google Scholar] [CrossRef]
- Stanley, M.; Paz, A.G.; Miguel, I.; Coachman, C. Fully digital workflow, integrating dental scan, smile design and CAD-CAM: Case report. BMC Oral Health 2018, 18, 134. [Google Scholar] [CrossRef] [PubMed]
- Mangano, F.; Mangano, C.; Margiani, B.; Admakin, O. Combining Intraoral and Face Scans for the Design and Fabrication of Computer-Assisted Design/Computer-Assisted Manufacturing (CAD/CAM) Polyether-Ether-Ketone (PEEK) Implant-Supported Bars for Maxillary Overdentures. Scanning 2019, 2019, 4274715. [Google Scholar] [CrossRef] [PubMed]
- Jamayet, N.B.; Viwattanatipa, N.; Amornvit, P.; Pornprasertsuk, S.; Chindasombatjaroen, J.; Alam, M.K. Comparison of Crown Width/Length Ratio of Six Maxillary Anterior Teeth between Different Facial Groups in Bangladeshi Population. Int. Med. J. 2014, 21, 49–54. [Google Scholar]
- Sitthiphan, P.; Viwattanatipa, N.; Amornvit, P.; Shrestha, B.; Srithavaj, M.T.; Alam, M.K. Comparison of Maxillary Anterior Teeth Crown Ratio (Width/Length) between Gender in Laotian Population. Int. Med. J. 2014, 22, 199–205. [Google Scholar]
- Afroz, S.; Rathi, S.; Rajput, G.; Rahman, S.A. Dental Esthetics and Its Impact on Psycho-Social Well-Being and Dental Self Confidence: A Campus Based Survey of North Indian University Students. J. Indian Prosthodont. Soc. 2013, 13, 455–460. [Google Scholar] [CrossRef]
- Esfahanizadeh, N.; Daneshparvar, N.; Askarpour, F.; Akhoundi, N.; Panjnoush, M. Correlation between Bone and Soft Tissue Thickness in Maxillary Anterior Teeth. J. Dent. Tehran 2016, 13, 302–308. [Google Scholar]
- Rudolph, H.; Salmen, H.; Moldan, M.; Kühn, K.; Sichwardt, V.; Wöstmann, B.; Luthardt, R.G. Accuracy of intraoral and extraoral digital data acquisition for dental restorations. J. Appl. Oral Sci. 2016, 24, 85–94. [Google Scholar] [CrossRef]
- Rokaya, D.; Kitisubkanchana, J.; Wonglamsam, A.; Santiwong, P.; Srithavaj, T.; Humagain, M. Nepalese Esthetic Dental (NED) Proportion in Nepalese Population. Kathmandu. Univ. Med. J. 2015, 51, 249–254. [Google Scholar] [CrossRef]
- Rokaya, D.; Humagain, M.; Amornvit, P. Maxillary Anterior Teeth Proportions for Creating Esthetically Pleasuring Smile in Nepalese Patients. J. Nepal Health Res. Counc. 2018, 16, 362. [Google Scholar] [CrossRef]
- Zagar, M.; Knezović Zlatarić, D. Influence of esthetic dental and facial measurements on the Caucasian patients’ satisfaction. J. Esthet. Restor. Dent. 2011, 23, 12–20. [Google Scholar] [CrossRef]
- Rokaya, D.; Bhattarai, B.P.; Suttagul, K.; Kafle, D.; Humagain, M. Mentolabial sulcus: An esthetic-based classification. J. Datta Meghe Inst. Med. Sci. Univ. 2018, 13, 16. [Google Scholar] [CrossRef]
- Rokaya, D.; Suttagul, K.; Sapkota, B.; Maharjan, S.K. Gender Based Comparison of the Relationships of Maxillary Anterior Teeth and Facial Measurements. J. Int. Dent. Med. Res. 2018, 11, 465–469. [Google Scholar]
- Cowie, J.; Calveley, E.; Bowers, G.; Bowers, J. Evaluation of a Digital Consultation and Self-Care Advice Tool in Primary Care: A Multi-Methods Study. Int. J. Environ. Res. Public Health 2018, 15, 896. [Google Scholar] [CrossRef] [PubMed]
- Lawson, N.C.; Burgess, J.O. Clinicians reaping benefits of new concepts in impressioning. Compend. Contin. Educ. Dent. 2015, 36, 152–153. [Google Scholar] [PubMed]
- Mangano, F.; Gandolfi, A.; Luongo, G.; Logozzo, S. Intraoral scanners in dentistry: A review of the current literature. BMC Oral Health 2017, 17, 149. [Google Scholar] [CrossRef] [PubMed]
- Schepke, U.; Meijer, H.J.; Kerdijk, W.; Cune, M.S. Digital versus analog complete-arch impressions for single-unit premolar implant crowns: Operating time and patient preference. J. Prosthet. Dent. 2015, 114, 403–406.e1. [Google Scholar] [CrossRef]
- Goracci, C.; Franchi, L.; Vichi, A.; Ferrari, M. Accuracy, reliability, and efficiency of intraoral scanners for full-arch impressions: A systematic review of the clinical evidence. Eur. J. Orthod. 2016, 38, 422–428. [Google Scholar] [CrossRef]
- Mangano, F.G.; Hauschild, U.; Veronesi, G.; Imburgia, M.; Mangano, C.; Admakin, O. Trueness and precision of 5 intraoral scanners in the impressions of single and multiple implants: A comparative in vitro study. BMC Oral Health 2019, 19, 101. [Google Scholar] [CrossRef]
- Abduo, J.; Elseyoufi, M. Accuracy of Intraoral Scanners: A Systematic Review of Influencing Factors. Eur. J. Prosthodont. Restor. Dent. 2018, 26, 101–121. [Google Scholar]
- Medina-Sotomayor, P.; Pascual-Moscardó, A.; Camps, I. Correction: Accuracy of four digital scanners according to scanning strategy in complete-arch impressions. PLoS ONE 2018, 13, e0209883. [Google Scholar] [CrossRef]
- Mutwalli, H.; Braian, M.; Mahmood, D.; Larsson, C. Trueness and Precision of Three-Dimensional Digitizing Intraoral Devices. Int. J. Dent. 2018, 2018, 5189761. [Google Scholar] [CrossRef] [PubMed]
- Braian, M.; Wennerberg, A. Trueness and precision of 5 intraoral scanners for scanning edentulous and dentate complete-arch mandibular casts: A comparative in vitro study. J. Prosthet. Dent. 2019, 122, 129–136.e2. [Google Scholar] [CrossRef] [PubMed]
- Amornvit, P.; Rokaya, D.; Sanohkan, S. Applications of PEEK in Implant Retained Finger Prosthesis. J. Int. Dent. Med. Res. 2019, 12. in press. [Google Scholar]
- Van Der Meer, W.J.; Andriessen, F.S.; Wismeijer, D.; Ren, Y. Application of Intra-Oral Dental Scanners in the Digital Workflow of Implantology. PLoS ONE 2012, 7, e43312. [Google Scholar] [CrossRef] [PubMed]
- Besl, P.; McKay, H. A method for registration of 3-D shapes. IEEE Trans. Pattern Anal. Mach. Intell. 1992, 14, 239–256. [Google Scholar] [CrossRef]
- Park, H.N.; Lim, Y.J.; Yi, W.J.; Han, J.S.; Lee, S.P. A comparison of the accuracy of intraoral scanners using an intraoral environment simulator. J. Adv. Prosthodont. 2018, 10, 58–64. [Google Scholar] [CrossRef]
- Matta, R.E.; Adler, W.; Wichmann, M.; Heckmann, S.M. Accuracy of impression scanning compared with stone casts of implant impressions. J. Prosthet. Dent. 2017, 117, 507–512. [Google Scholar] [CrossRef]
- You, Y.; Shen, Y.; Zhang, G.; Xing, X. Real-Time and High-Resolution 3D Face Measurement via a Smart Active Optical Sensor. Sensors 2017, 17, 734. [Google Scholar] [CrossRef]
- Lee, S.J.; MacArthur, R.X.; Gallucci, G.O. An evaluation of student and clinician perception of digital and conventional implant impressions. J. Prosthet. Dent. 2013, 110, 420–423. [Google Scholar] [CrossRef]
- Aragón, M.L.C.; Pontes, L.F.; Bichara, L.M.; Flores-Mir, C.; Normando, D. Validity and reliability of intraoral scanners compared to conventional gypsum models measurements: A systematic review. Eur. J. Orthod. 2016, 38, 429–434. [Google Scholar] [CrossRef]


| Scanners | Scanning Time (min) | Data Processing Time (min) | Total Time for Scanning Process (min) |
|---|---|---|---|
| EP | 2.14 ± 0.03 | 4.63 ± 0.11 | 6.77 ± 0.15 |
| EP+ | 2.12 ± 0.01 | 7.28 ± 0.2 | 9.4 ± 0.21 |
| IPX | 0.29 ± 0.01 | 0.28 ± 0.04 | 0.57 ± 0.03 |
| PM | 0.22 ± 0.01 | 0.48 ± 0.05 | 0.7 ± 0.05 |
| Measurements | Groups | Mean ± SD (mm) | Comparison from Vernier Caliper (VC) Using One-Way ANOVA | |||
|---|---|---|---|---|---|---|
| VC vs. EP | VC vs. EP+ | VC vs. IPX | VC vs. PM | |||
| X1 | VC | 2.11 ± 0.04 | 0.82 | 0.62 | NA | <0.001 * |
| EP | 2.2 ± 0.15 | |||||
| EP+ | 2.25 ± 0.37 | |||||
| IPX | NA | |||||
| PM | 5.15 ± 1.04 | |||||
| X2 | VC | 10.02 ± 0.05 | 0.21 | 0.94 | 0.39 | <0.001 * |
| EP | 9.04 ± 0.44 | |||||
| EP+ | 10.29 ± 0.25 | |||||
| IPX | 10.8 ± 1.18 | |||||
| PM | 15.36 ± 2.15 | |||||
| X3 | VC | 50.48 ± 0.25 | <0.001 * | 1 | 0.96 | <0.001 * |
| EP | 42.41 ± 0.51 | |||||
| EP+ | 50.51 ± 0.4 | |||||
| IPX | 50.23 ± 1.36 | |||||
| PM | 59.92 ± 3.34 | |||||
| X4 | VC | 100.28 ± 0.06 | <0.001 * | 0.79 | <0.01 * | 0.99 |
| EP | 84.55 ± 0.51 | |||||
| EP+ | 99.82 ± 0.63 | |||||
| IPX | 98.43 ± 1.11 | |||||
| PM | 100.08 ± 0.94 | |||||
| X5 | VC | 120.18 ± 0.05 | <0.001 * | 0.97 | 0.77 | 0.064 |
| EP | 116.3 ± 0.25 | |||||
| EP+ | 120.02 ± 0.127 | |||||
| IPX | 119.83 ± 0.99 | |||||
| PM | 117.36 ± 2.88 | |||||
| Measurements | Groups | Mean ± SD (mm) | Comparison from Vernier Caliper (VC) Using One-Way ANOVA | |||
|---|---|---|---|---|---|---|
| VC vs. EP | VC vs. EP+ | VC vs. IPX | VC vs. PM | |||
| Y1 | VC | 1.97 ± 0.15 | 0.48 | 0.25 | NA | <0.001 * |
| EP | 2.15 ± 0.09 | |||||
| EP+ | 2.22 ± 0.389 | |||||
| IPX | NA | |||||
| PM | 4.1 ± 0.46 | |||||
| Y2 | VC | 10.08 ± 0.05 | 0.04 * | 0.82 | NA | 0.966 |
| EP | 9.06 ± 0.43 | |||||
| EP+ | 10.24 ± 0.48 | |||||
| IPX | NA | |||||
| PM | 9.90 ± 0.90 | |||||
| Y3 | VC | 50.21 ± 0.05 | <0.001 * | 0.62 | 0.99 | 0.027 * |
| EP | 42.60 ± 0.24 | |||||
| EP+ | 50.70 ± 0.81 | |||||
| IPX | 50.13 ± 0.8 | |||||
| PM | 48.93 ± 1.49 | |||||
| Y4 | VC | 100.52 ± 0.67 | <0.001 * | 0.14 | 0.95 | 1 |
| EP | 86.28 ± 0.22 | |||||
| EP+ | 101.76 ± 0.96 | |||||
| IPX | 100.81 ± 0.99 | |||||
| PM | 100.41 ± 0.57 | |||||
| Y5 | VC | 121.30 ± 0.18 | <0.001 * | 0.4 | 1.65 | 0.029 * |
| EP | 102.56 ± 0.27 | |||||
| EP+ | 121.98 ± 0.71 | |||||
| IPX | 120.37 ± 0.93 | |||||
| PM | 119.53 ± 1.18 | |||||
| Y6 | VC | 151.49 ± 0.11 | <0.001 * | 0.62 | <0.001 * | 0.028 * |
| EP | 128.22 ± 0.54 | |||||
| EP+ | 151.86 ± 0.32 | |||||
| IPX | 150.30 ± 0.60 | |||||
| PM | 150.15 ± 0.92 | |||||
| Measurements | Groups | Mean ± SD (mm) | Comparison from Vernier Caliper (VC) Using One-Way ANOVA | |||
|---|---|---|---|---|---|---|
| VC vs. EP | VC vs. EP+ | VC vs. IPX | VC vs. PM | |||
| Z1 | VC | 2.02 ± 0.08 | 0.03 * | <0.001 * | NA | NA |
| EP | 1.9 ± 0.06 | |||||
| EP+ | 2.23 ± 0.18 | |||||
| IPX and PM | NA | |||||
| Z2 | VC | 4.06 ± 0.03 | <0.001 * | <0.001 * | NA | NA |
| EP | 3.48 ± 0.09 | |||||
| EP+ | 4.39 ± 0.13 | |||||
| IPX and PM | NA | |||||
| Z3 | VC | 5.99 ± 0.05 | <0.001 * | <0.001 * | NA | NA |
| EP | 3.3 ± 1.48 | |||||
| EP+ | 1.85 ± 0.07 | |||||
| IPX and PM | NA | |||||
| Z4 | VC | 8.04 ± 0.02 | <0.001 * | <0.001 * | NA | NA |
| EP | 2.7 ± 0.44 | |||||
| EP+ | 4.69 ± 0.19 | |||||
| IPX and PM | NA | |||||
| Z5 | VC | 10 ± 0.05 | <0.001 * | <0.001 * | NA | NA |
| EP | 2.46 ± 0.05 | |||||
| EP+ | 1.95 ± 0.05 | |||||
| IPX and PM | NA | |||||
| Capturing Difficultness | Landmarks |
|---|---|
| Easy | Forehead, cheek, and chin |
| Medium | Ear lobe and eye lids |
| Hard | Teeth, extra auditory canal, and nostril |
© 2019 by the authors. Licensee MDPI, Basel, Switzerland. This article is an open access article distributed under the terms and conditions of the Creative Commons Attribution (CC BY) license (http://creativecommons.org/licenses/by/4.0/).
Share and Cite
Amornvit, P.; Sanohkan, S. The Accuracy of Digital Face Scans Obtained from 3D Scanners: An In Vitro Study. Int. J. Environ. Res. Public Health 2019, 16, 5061. https://doi.org/10.3390/ijerph16245061
Amornvit P, Sanohkan S. The Accuracy of Digital Face Scans Obtained from 3D Scanners: An In Vitro Study. International Journal of Environmental Research and Public Health. 2019; 16(24):5061. https://doi.org/10.3390/ijerph16245061
Chicago/Turabian StyleAmornvit, Pokpong, and Sasiwimol Sanohkan. 2019. "The Accuracy of Digital Face Scans Obtained from 3D Scanners: An In Vitro Study" International Journal of Environmental Research and Public Health 16, no. 24: 5061. https://doi.org/10.3390/ijerph16245061
APA StyleAmornvit, P., & Sanohkan, S. (2019). The Accuracy of Digital Face Scans Obtained from 3D Scanners: An In Vitro Study. International Journal of Environmental Research and Public Health, 16(24), 5061. https://doi.org/10.3390/ijerph16245061