Development of Physical Performance Tasks during Rapid Growth in Brazilian Children: The Cariri Healthy Growth Study

 ,
,  ,
, 
Abstract
1. Introduction
2. Materials and Methods
2.1. Design and Participants
2.2. Measurements and Tests
2.2.1. Anthropometry
2.2.2. Physical Performance
2.3. Data Quality Control
2.4. Statistical Procedures
3. Results
4. Discussion
5. Conclusions
Author Contributions
Acknowledgments
Conflicts of Interest
References
- Beunen, G.; Malina, R.; Van’t Hof, M.; Simons, J.; Ostyn, M.; Renson, R.; Van Gerven, D. Adolescent Growth and Motor Performance: A Longitudinal Study in Belgian Boys; Human Kinetics: Champaign, IL, USA, 1988. [Google Scholar]
- Ortega, F.B.; Ruiz, J.R.; Castillo, M.J.; Sjostrom, M. Physical fitness in childhood and adolescence: A powerful marker of health. Int. J. Obes. 2008, 32, 1–11. [Google Scholar] [CrossRef] [PubMed]
- Bustamante, A.; Beunen, G.; Maia, J. Evaluation of physical fitness levels in children and adolescents: Establishing percentile charts for the central region of Peru. Rev. Peru. Med. Exp. Salud Publica 2012, 29, 188–197. [Google Scholar] [PubMed]
- Silva, S.; Maia, J.; Claessens, A.L.; Beunen, G.; Pan, H. Growth references for Brazilian children and adolescents: Healthy growth in Cariri study. Ann. Hum. Biol. 2012, 39, 11–18. [Google Scholar] [CrossRef] [PubMed]
- Chaves, R.; Baxter-Jones, A.; Gomes, T.; Souza, M.; Pereira, S.; Maia, J. Effects of Individual and School-Level Characteristics on a Child’s Gross Motor Coordination Development. Int. J. Environ. Res. Public Health 2015, 12, 8883–8896. [Google Scholar] [CrossRef]
- Roche, A.; Sun, S. Human Growth: Assessment and Interpretation; Cambridge University Press: Cambridge, UK, 2003. [Google Scholar]
- Lefevre, J.; Beunen, G.; Steens, G.; Claessens, A.; Renson, R. Motor performance during adolescence and age thirty as related to age at peak height velocity. Ann. Hum. Biol. 1990, 17, 423–435. [Google Scholar] [CrossRef]
- Rauch, F.; Bailey, D.A.; Baxter-Jones, A.; Mirwald, R.; Faulkner, R. The ‘muscle-bone unit’ during the pubertal growth spurt. Bone 2004, 34, 771–775. [Google Scholar] [CrossRef]
- Carron, A.; Bailey, D. Strenght development in boys from 10 through 16 years. Monogr. Soc. Res. Child Dev. 1974, 39, 1–37. [Google Scholar]
- Kemper, H.C.G.; Verschuur, R. Motor performance fitness tests. In Growth, Health and Fitness of Teenagers: Longitudinal Reseasrch in International Perspective; Medicine and Sport Science; Kemper, H.C.G., Ed.; Karger: Basel, Switzerland, 1985. [Google Scholar]
- Geithner, C.A.; Thomis, M.A.; Vanden Eynde, B.; Maes, H.H.; Loos, R.J.; Peeters, M.; Claessens, A.L.; Vlietinck, R.; Malina, R.M.; Beunen, G.P. Growth in peak aerobic power during adolescence. Med. Sci. Sports Exerc. 2004, 36, 1616–1624. [Google Scholar] [CrossRef]
- Yague, P.H.; De La Fuente, J.M. Changes in height and motor performance relative to peak height velocity: A mixed-longitudinal study of Spanish boys and girls. Am. J. Hum. Biol. Off. J. Hum. Biol. Counc. 1998, 10, 647–660. [Google Scholar] [CrossRef]
- Philippaerts, R.M.; Vaeyens, R.; Janssens, M.; Van Renterghem, B.; Matthys, D.; Craen, R.; Bourgois, J.; Vrijens, J.; Beunen, G.; Malina, R.M. The relationship between peak height velocity and physical performance in youth soccer players. J. Sports Sci. 2006, 24, 221–230. [Google Scholar] [CrossRef]
- Espenschade, A. Motor Performance in Adolescence. Including the Study of Relationships with Measures of Physical Growth and Maturity; Society for Research in Child Development: Washington, DC, USA, 1940. [Google Scholar]
- Faust, M.S. Somatic Development of Adolescent Girls. Monogr. Soc. Res. Child Dev. 1977, 42, 1–90. [Google Scholar] [CrossRef] [PubMed]
- PNUD. Programa nas Nações Unidas para o Desenvolvimento. Available online: http://www.pnud.org.br/IDH/Default.aspx?indiceAccordion=1&li=li_AtlasMunicipios (accessed on 10 November 2019).
- IBGE. Instituto Brasileiro de Geografia e Estatística. Available online: http://www.ibge.gov.br/home/ (accessed on 10 November 2019).
- Gordon, C.C.; Chumlea, W.C.; Roche, A.F. Stature, recumbent length, and weight. In Anthropometric Standardization Reference Manual; Lohman, T.G., Roche, A.F., Martorell, R., Eds.; Human Kinetics Books: Champaign, IL, USA, 1988; pp. 3–8. [Google Scholar]
- Council of Europe. Eurofit: Handbook for the Eurofit Tests of Physical Fitness; Council of Europe, Committee for the Development of Sport: Strasbourg, France, 1993. [Google Scholar]
- AAHPERD. American Alliance for Health, Physical Educations, Recreation and Dance. In Health Related Physical Fitness Manual; AAHPERD: Washington, DC, USA, 1980. [Google Scholar]
- Heras, P. Croissance et Développement moteur pendant les années pubertaires. In Etude Longitudinale et Transversale D’enfants Minorquins du Cycle Supérieur de L’enseignement Élémentaire (11–15 ans); Free University of Brussels: Brussels, Belgium, 1995. [Google Scholar]
- Hermanussen, M. Auxology: Studying Human Growth and Development; Schweizerbart: Stuttgart, Germany, 2013. [Google Scholar]
- Iuliano-Burns, S.; Mirwald, R.L.; Bailey, D.A. Timing and magnitude of peak height velocity and peak tissue velocities for early, average, and late maturing boys and girls. Am. J. Hum. Biol. Off. J. Hum. Biol. Counc. 2001, 13, 1–8. [Google Scholar] [CrossRef]
- Largo, R.H.; Gasser, T.; Prader, A.; Stuetzle, W.; Huber, P.J. Analysis of the adolescent growth spurt using smoothing spline functions. Ann. Hum. Biol. 1978, 5, 421–434. [Google Scholar] [CrossRef] [PubMed]
- Lindgren, G. Growth of schoolchildren with early, average and late ages of peak height velocity. Ann. Hum. Biol. 1978, 5, 253–267. [Google Scholar] [CrossRef] [PubMed]
- Tanner, J.M.; Whitehouse, R.H.; Takaishi, M. Standards from birth to maturity for height, weight, height velocity, and weight velocity: British children, 1965. II. Arch. Dis. Child. 1966, 41, 613–635. [Google Scholar] [CrossRef] [PubMed]
- Malina, R.; Bouchard, C.; Bar-Or, O. Growth, Maturation and Physical Activity, 4th ed.; Human Kinetics Books: Champaign, IL, USA, 2004. [Google Scholar]
- Aksglaede, L.; Olsen, L.W.; Sorensen, T.I.; Juul, A. Forty years trends in timing of pubertal growth spurt in 157,000 Danish school children. PLoS ONE 2008, 3, e2728. [Google Scholar] [CrossRef] [PubMed]
- Kobayashi, K.; Kitamura, K.; Miura, M.; Sodeyama, H.; Murase, Y.; Miyashita, M.; Matsui, H. Aerobic power as related to body growth and training in Japanese boys: A longitudinal study. J. Appl. Physiol. Respir. Environ. Exerc. Physiol. 1978, 44, 666–672. [Google Scholar] [CrossRef]
- Round, J.M.; Jones, D.A.; Honour, J.W.; Nevill, A.M. Hormonal factors in the development of differences in strength between boys and girls during adolescence: A longitudinal study. Ann. Hum. Biol. 1999, 26, 49–62. [Google Scholar] [CrossRef]
- Ellis, J.D.; Carron, A.V.; Bailey, D.A. Physical performance in boys from 10 through 16 years. Hum. Biol. 1975, 47, 263–281. [Google Scholar]
- Mirwald, R.L.; Bailey, D.A.; Cameron, N.; Rasmussen, R.L. Longitudinal comparison of aerobic power in active and inactive boys aged 7.0 to 17.0 years. Ann. Hum. Biol. 1981, 8, 405–414. [Google Scholar] [CrossRef]
- Starosta, W.; Hirtz, P. Periodi sensibili e sviluppo della coordinazione motoria. Riv. Cult. Sport. 1990, 9, 55–61. [Google Scholar]
- Cole, T.J. Optimal design for longitudinal studies to estimate pubertal height growth in individuals. Ann. Hum. Biol. 2018, 45, 314–320. [Google Scholar] [CrossRef] [PubMed]
- Mayorga-Vega, D.; Bocanegra-Parrilla, R.; Ornelas, M.; Viciana, J. Criterion-Related Validity of the Distance- and Time-Based Walk/Run Field Tests for Estimating Cardiorespiratory Fitness: A Systematic Review and Meta-Analysis. PLoS ONE 2016, 11, e0151671. [Google Scholar] [CrossRef] [PubMed]


| Months from PHV | ||||||||||||||
|---|---|---|---|---|---|---|---|---|---|---|---|---|---|---|
| Variable | −18 | −15 | −12 | −9 | −6 | −3 | 0 | 3 | 6 | 9 | 12 | 15 | 18 | |
| Boys | ||||||||||||||
| Height (cm·year−1) | mean | 2.69 | 3.69 | 3.42 | 4.11 | 5.22 | 7.26 | 8.49 | 7.3 | 5.34 | 5.32 | 5.20 | 3.49 | 2.64 |
| sd | 2.68 | 1.97 | 2.28 | 2.19 | 2.61 | 2.5 | 4.02 | 3.07 | 3.27 | 2.7 | 2.65 | 1.97 | 2.64 | |
| n | 9 | 19 | 33 | 57 | 84 | 95 | 131 | 79 | 79 | 57 | 42 | 10 | 10 | |
| Girls | ||||||||||||||
| Height (cm·year−1) | mean | 2.22 | 2.98 | 3.64 | 4.10 | 4.66 | 6.00 | 7.26 | 5.73 | 3.78 | 3.20 | 2.87 | 2.30 | 2.57 |
| sd | 1.38 | 1.96 | 2.71 | 1.90 | 2.46 | 2.95 | 4.11 | 2.40 | 2.32 | 2.11 | 2.16 | 1.50 | 0.97 | |
| n | 9 | 18 | 32 | 47 | 71 | 85 | 123 | 78 | 77 | 42 | 31 | 2 | 3 | |
| Months from PHV | ||||||||||||||
|---|---|---|---|---|---|---|---|---|---|---|---|---|---|---|
| Variables | −18 | −15 | −12 | −9 | −6 | −3 | 0 | 3 | 6 | 9 | 12 | 15 | 18 | |
| Boys | ||||||||||||||
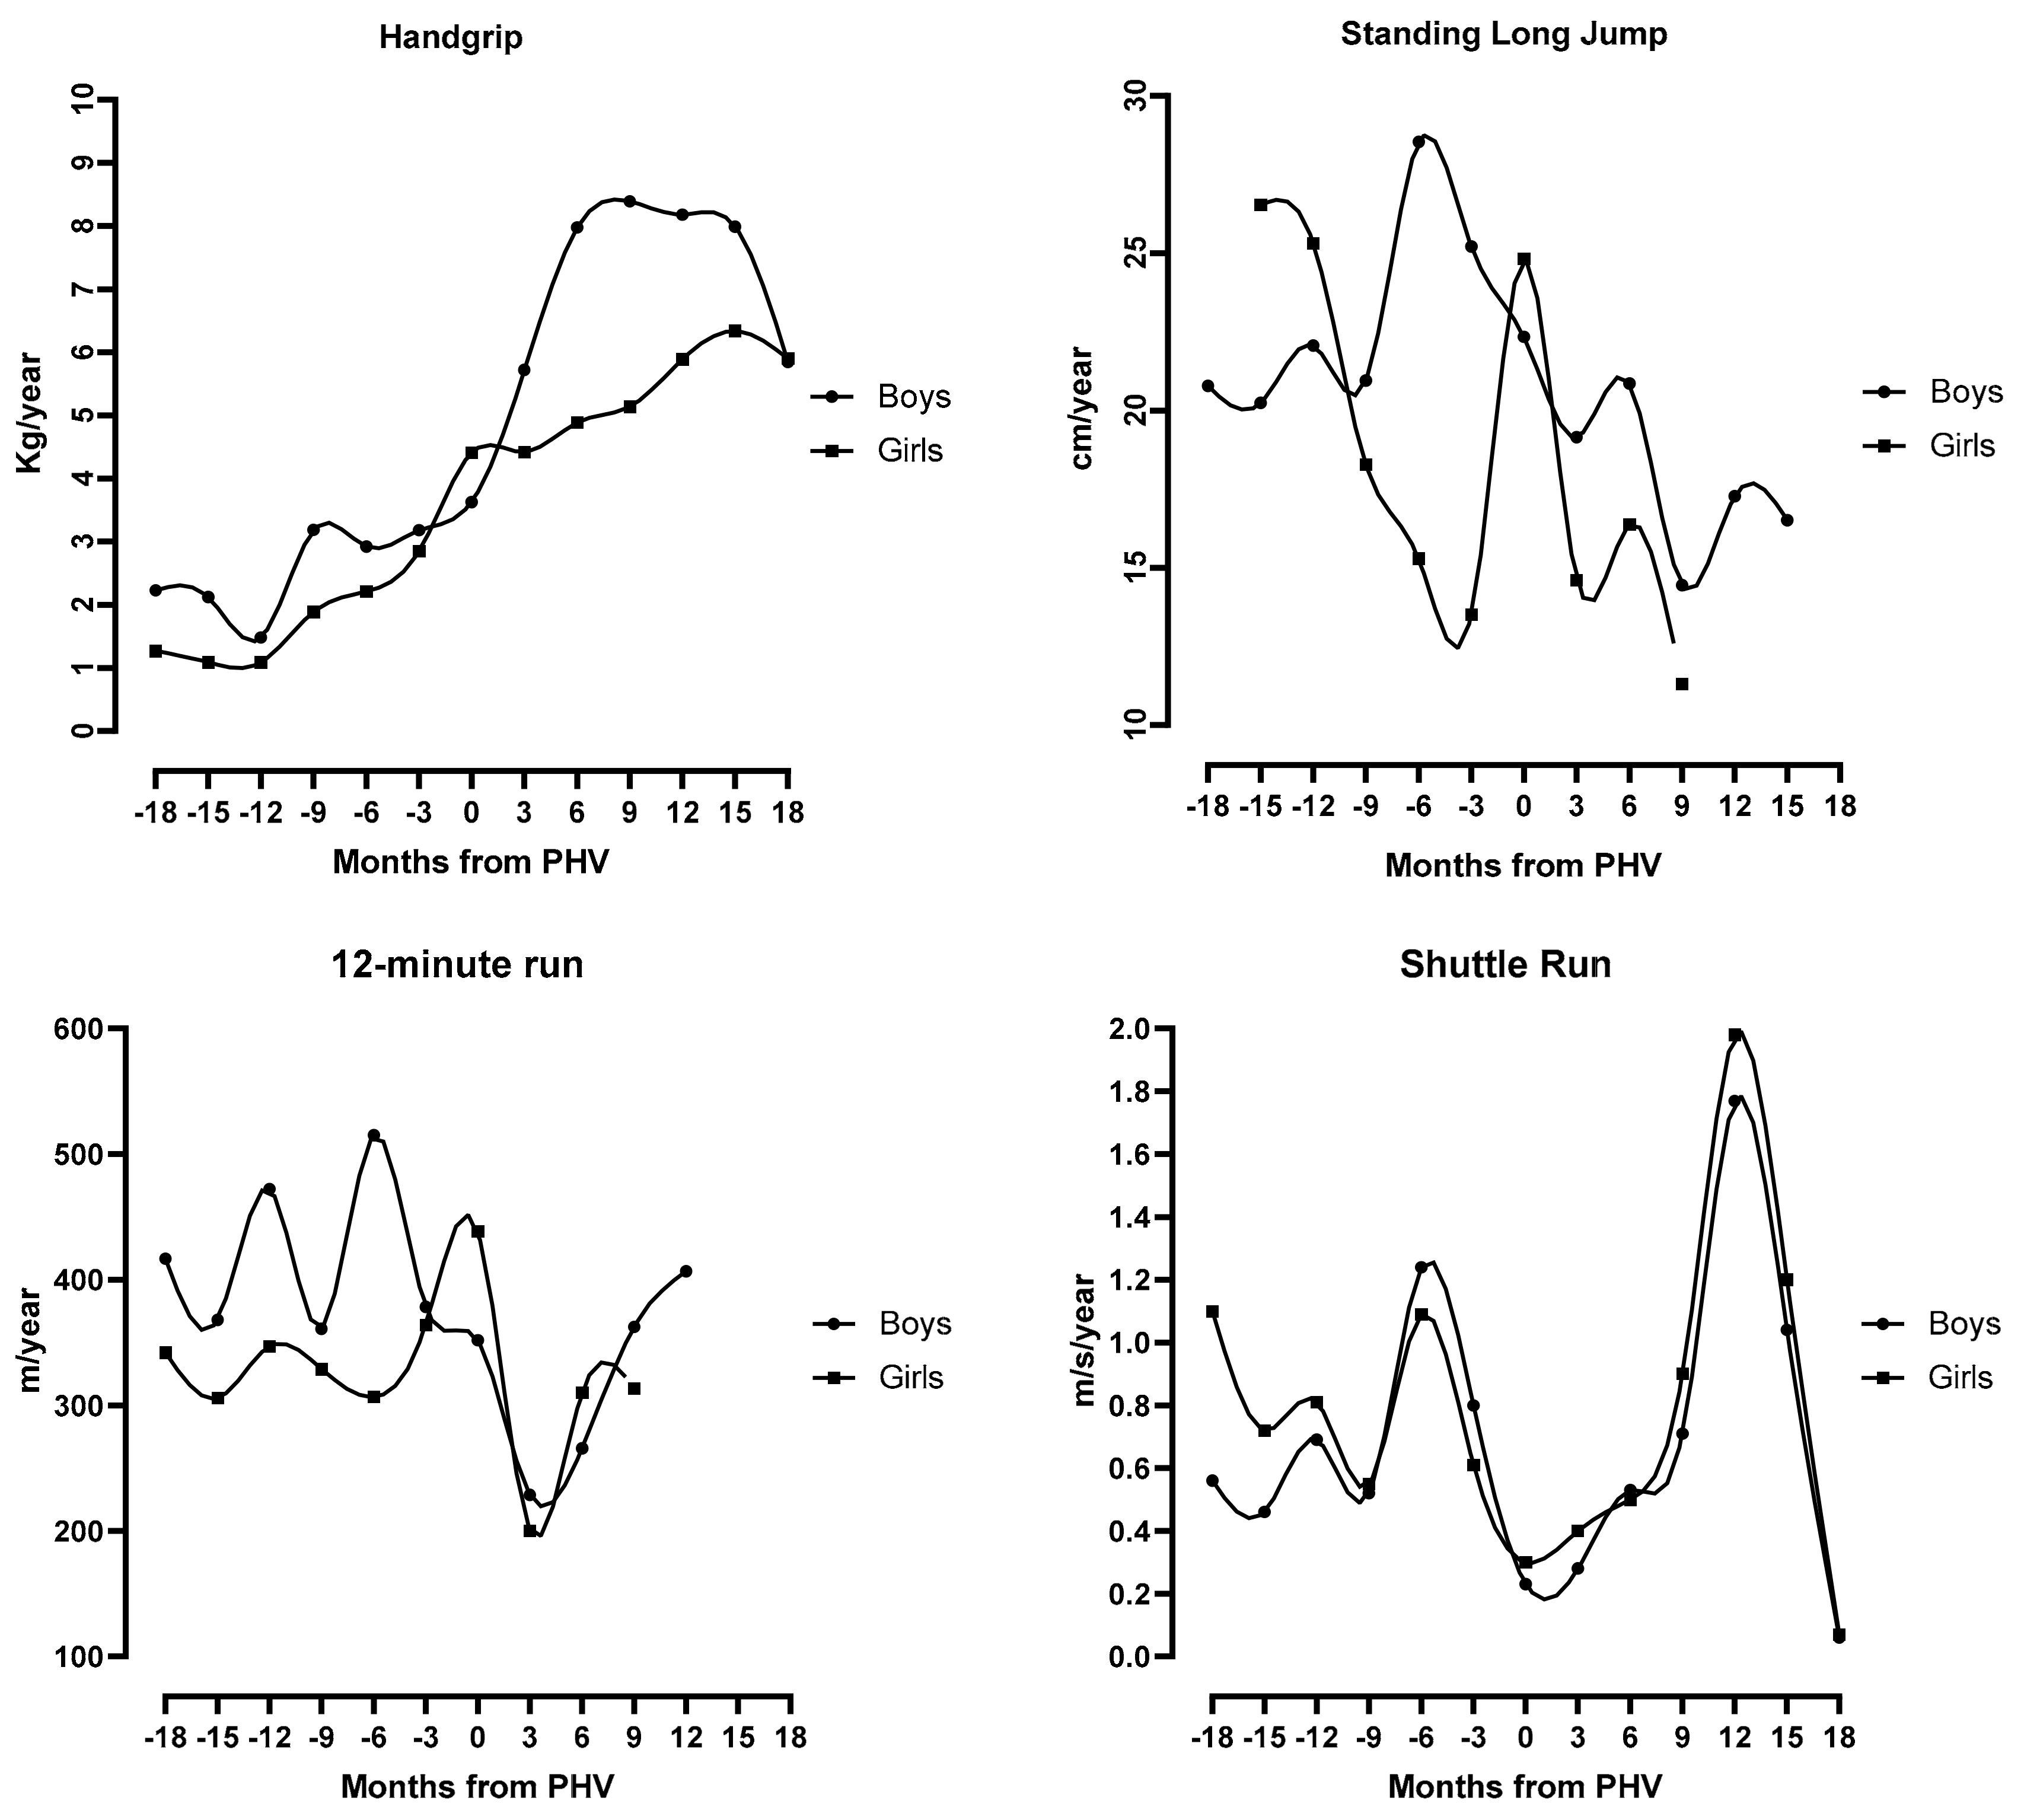
| Handgrip (kg·year−1) | mean | 2.23 | 2.12 | 1.48 | 3.19 | 2.92 | 3.18 | 3.63 | 5.72 | 7.98 | 8.39 | 8.18 | 7.99 | 5.85 |
| n | 19 | 20 | 45 | 50 | 85 | 90 | 95 | 77 | 65 | 46 | 32 | 24 | 18 | |
| Standing long jump (cm·year−1) | mean | 20.78 | 20.24 | 22.07 | 20.95 | 28.54 | 25.21 | 22.34 | 19.15 | 20.86 | 14.45 | 17.28 | 16.51 | n/a |
| n | 9 | 16 | 30 | 36 | 57 | 64 | 61 | 38 | 34 | 26 | 15 | 7 | ||
| 12 min run (m·year−1) | mean | 416.73 | 367.91 | 472.07 | 360.96 | 515.07 | 378.42 | 351.81 | 228.56 | 265.82 | 362.34 | 406.72 | n/a | n/a |
| n | 7 | 9 | 21 | 26 | 24 | 35 | 29 | 21 | 17 | 11 | 6 | |||
| Shuttle run (m·s−1·year−1) | mean | 0.56 | 0.46 | 0.69 | 0.52 | 1.24 | 0.80 | 0.23 | 0.28 | 0.53 | 0.71 | 1.77 | 1.04 | 0.06 |
| n | 9 | 15 | 34 | 37 | 66 | 71 | 65 | 66 | 45 | 53 | 34 | 28 | 19 | |
| Girls | ||||||||||||||
| Handgrip (kg·year−1) | mean | 1.27 | 1.09 | 1.09 | 1.89 | 2.21 | 2.85 | 4.41 | 4.42 | 4.89 | 5.14 | 5.89 | 6.34 | 5.90 |
| n | 18 | 18 | 44 | 48 | 75 | 78 | 87 | 76 | 62 | 42 | 31 | 18 | 14 | |
| Standing long jump (cm·year−1) | mean | n/a | 26.54 | 25.32 | 18.28 | 15.29 | 13.51 | 24.83 | 14.61 | 16.37 | 11.31 | n/a | n/a | n/a |
| n | 10 | 16 | 26 | 24 | 36 | 26 | 22 | 15 | 7 | |||||
| 12 min run (m·year−1) | mean | 341.94 | 305.63 | 346.92 | 328.89 | 306.73 | 364.17 | 438.46 | 200.15 | 310.27 | 313.51 | n/a | n/a | n/a |
| n | 4 | 9 | 4 | 23 | 13 | 22 | 19 | 11 | 19 | 7 | ||||
| Shuttle run (m·s−1·year−1) | mean | 1.10 | 0.72 | 0.81 | 0.55 | 1.09 | 0.61 | 0.30 | 0.40 | 0.50 | 0.90 | 1.98 | 1.2 | 0.07 |
| n | 14 | 17 | 26 | 37 | 45 | 54 | 64 | 60 | 46 | 45 | 34 | 27 | 16 | |
| Boys | Girls | |||
|---|---|---|---|---|
| Variables | Timing | Peak Velocity (Unit·Year−1) | Timing | Peak Velocity (Unit·Year−1) |
| Handgrip | 9 to 12 months after PHV | 8.39–8.18 kg·year−1 | 15 months after PHV | 6.34 kg·year−1 |
| Standing long jump | 6 months before PHV | 28.54 cm·year−1 | 15 to 12 months before PHV, as well as at moment of PHV | 26.54 to 25.32 cm·year−1; 24.83 cm·year−1 |
| 12 min run | 6 months before PHV | 515.07 m·year−1 | At moment of PHV | 438.46 m·year−1 |
| Shuttle run | 12 months after PHV | 1.77 m·s−1·year−1 | 12 months after PHV | 1.98 m·s−1·year−1 |
© 2019 by the authors. Licensee MDPI, Basel, Switzerland. This article is an open access article distributed under the terms and conditions of the Creative Commons Attribution (CC BY) license (http://creativecommons.org/licenses/by/4.0/).
Share and Cite
Silva, S.; Mendes, H.; Freitas, D.; Prista, A.; Tani, G.; Katzmarzyk, P.T.; Baxter-Jones, A.D.G.; Valdivia, A.B.; Maia, J. Development of Physical Performance Tasks during Rapid Growth in Brazilian Children: The Cariri Healthy Growth Study. Int. J. Environ. Res. Public Health 2019, 16, 5029. https://doi.org/10.3390/ijerph16245029
Silva S, Mendes H, Freitas D, Prista A, Tani G, Katzmarzyk PT, Baxter-Jones ADG, Valdivia AB, Maia J. Development of Physical Performance Tasks during Rapid Growth in Brazilian Children: The Cariri Healthy Growth Study. International Journal of Environmental Research and Public Health. 2019; 16(24):5029. https://doi.org/10.3390/ijerph16245029
Chicago/Turabian StyleSilva, Simonete, Hudday Mendes, Duarte Freitas, António Prista, Go Tani, Peter T. Katzmarzyk, Adam D. G. Baxter-Jones, Alcibíades Bustamante Valdivia, and José Maia. 2019. "Development of Physical Performance Tasks during Rapid Growth in Brazilian Children: The Cariri Healthy Growth Study" International Journal of Environmental Research and Public Health 16, no. 24: 5029. https://doi.org/10.3390/ijerph16245029
APA StyleSilva, S., Mendes, H., Freitas, D., Prista, A., Tani, G., Katzmarzyk, P. T., Baxter-Jones, A. D. G., Valdivia, A. B., & Maia, J. (2019). Development of Physical Performance Tasks during Rapid Growth in Brazilian Children: The Cariri Healthy Growth Study. International Journal of Environmental Research and Public Health, 16(24), 5029. https://doi.org/10.3390/ijerph16245029