The Association between Ground Floor Features and Public Open Space Face-To-Face Interactions: Evidence from Nantou Village, Shenzhen


Abstract
1. Introduction
2. Literature Review
2.1. Architectural Articulation
2.2. Permeability
2.3. Personalization
2.4. Enclosure
2.5. Land Use
2.6. Amenities Provision
2.7. Limitations of Previous Studies
3. Materials and Methods
3.1. Case Study
3.2. Analytical Framework
3.3. Observation, Data Collection, and Preparation
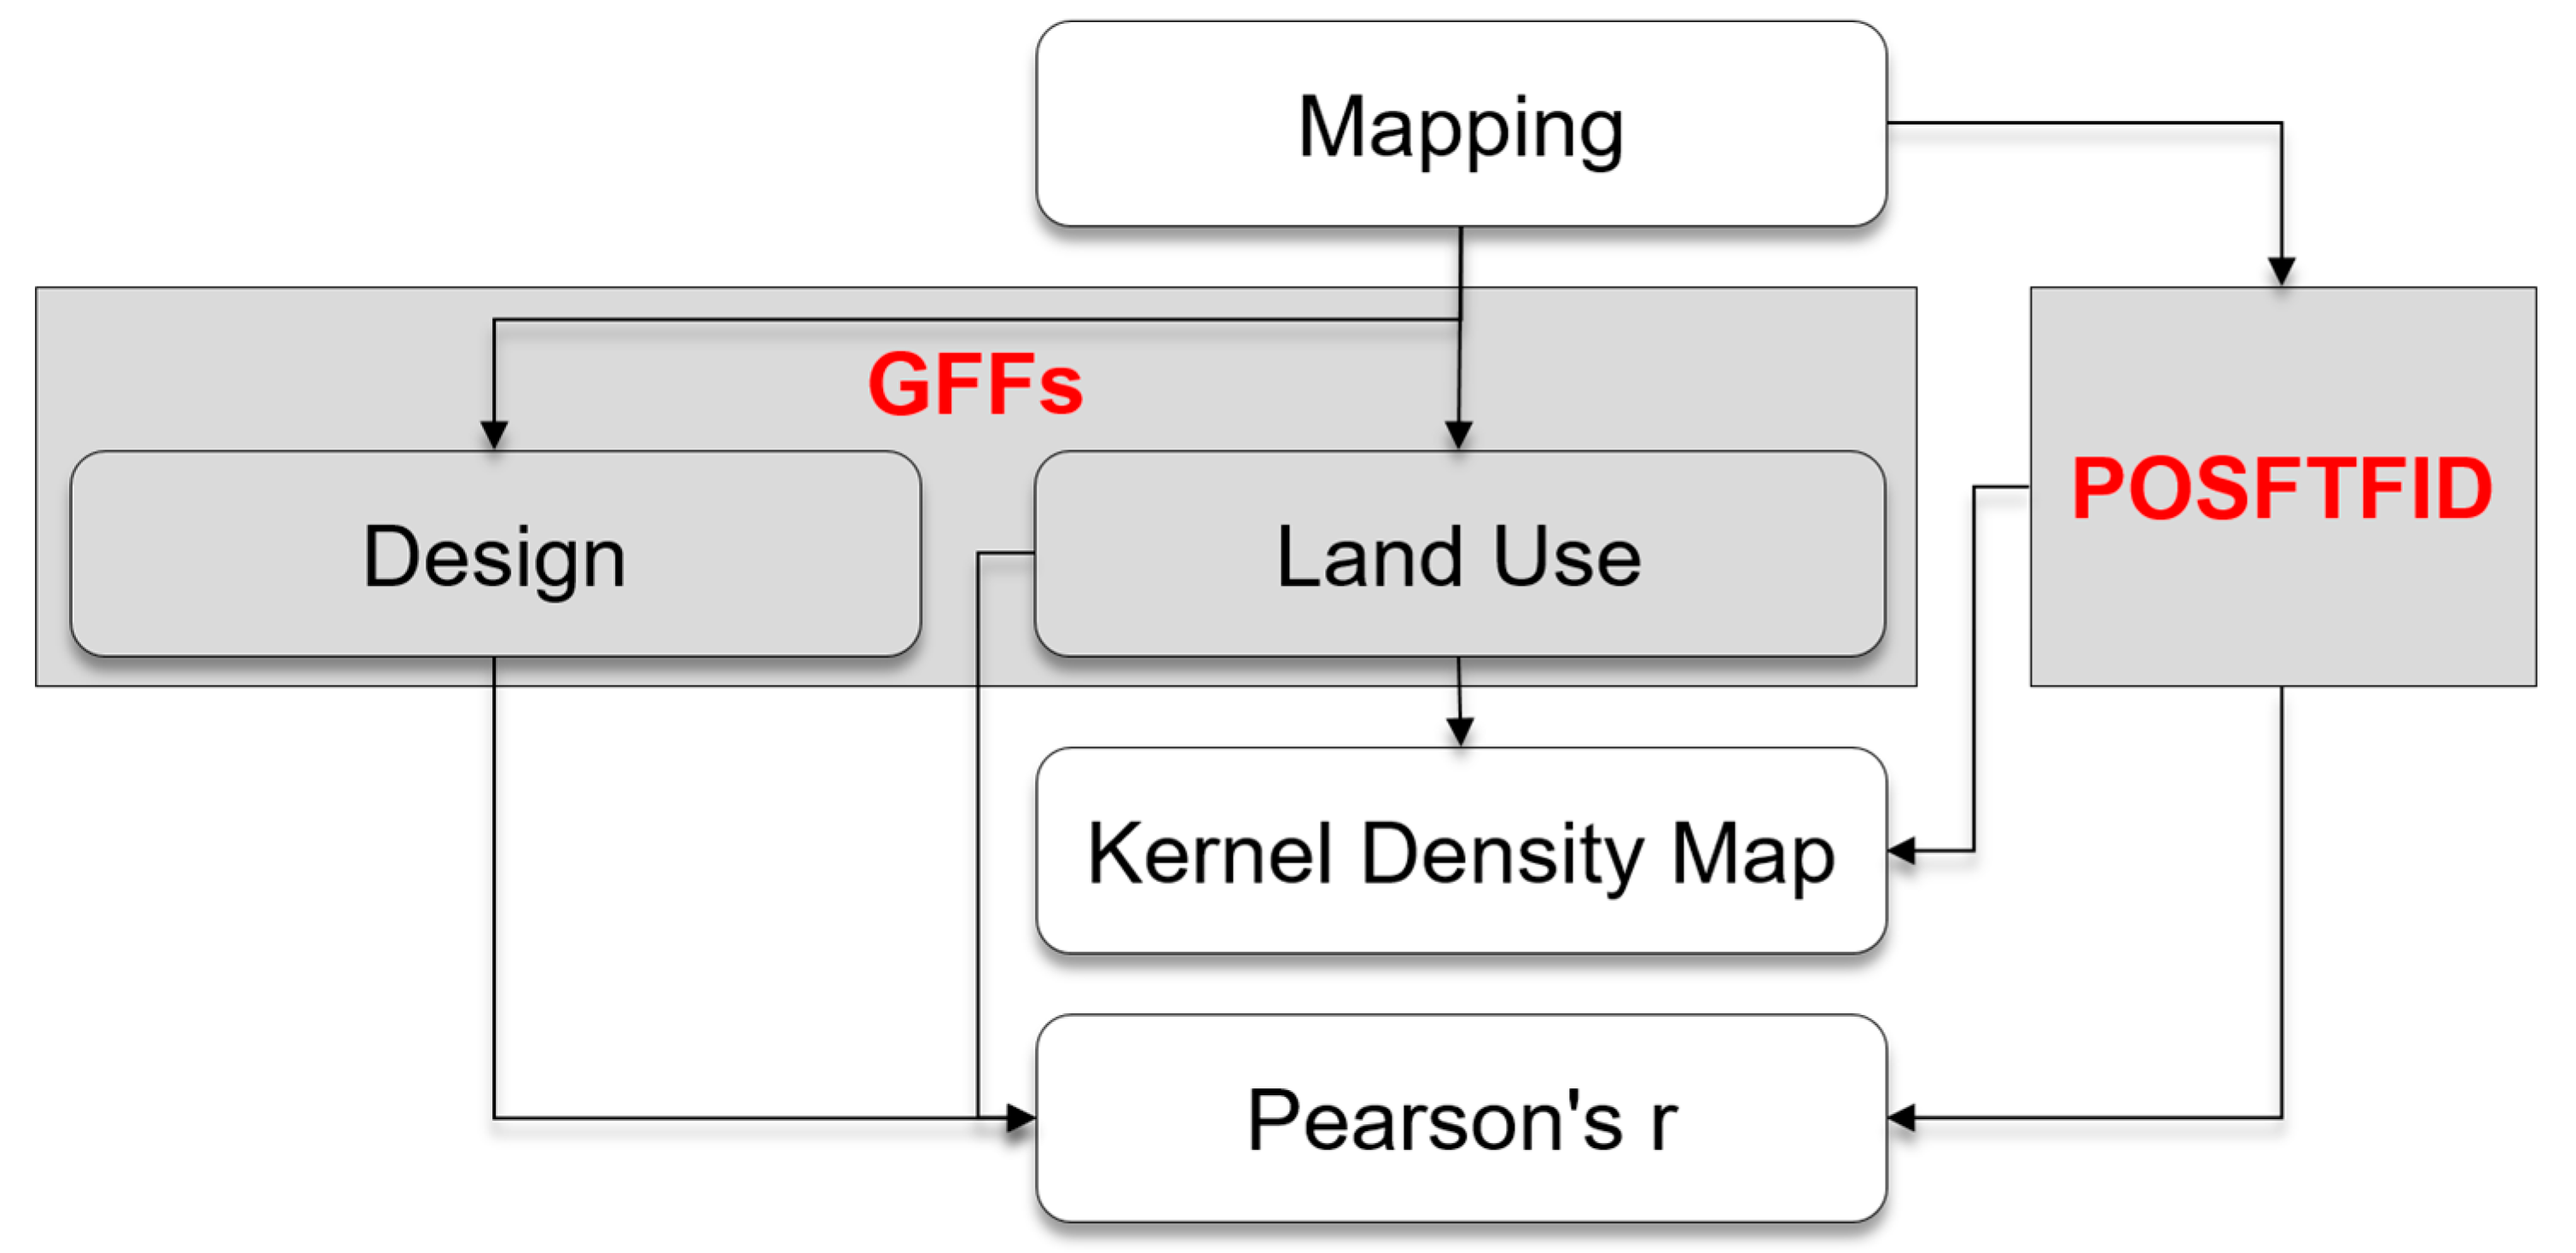
3.4. Data Analysis
4. Results and Discussion
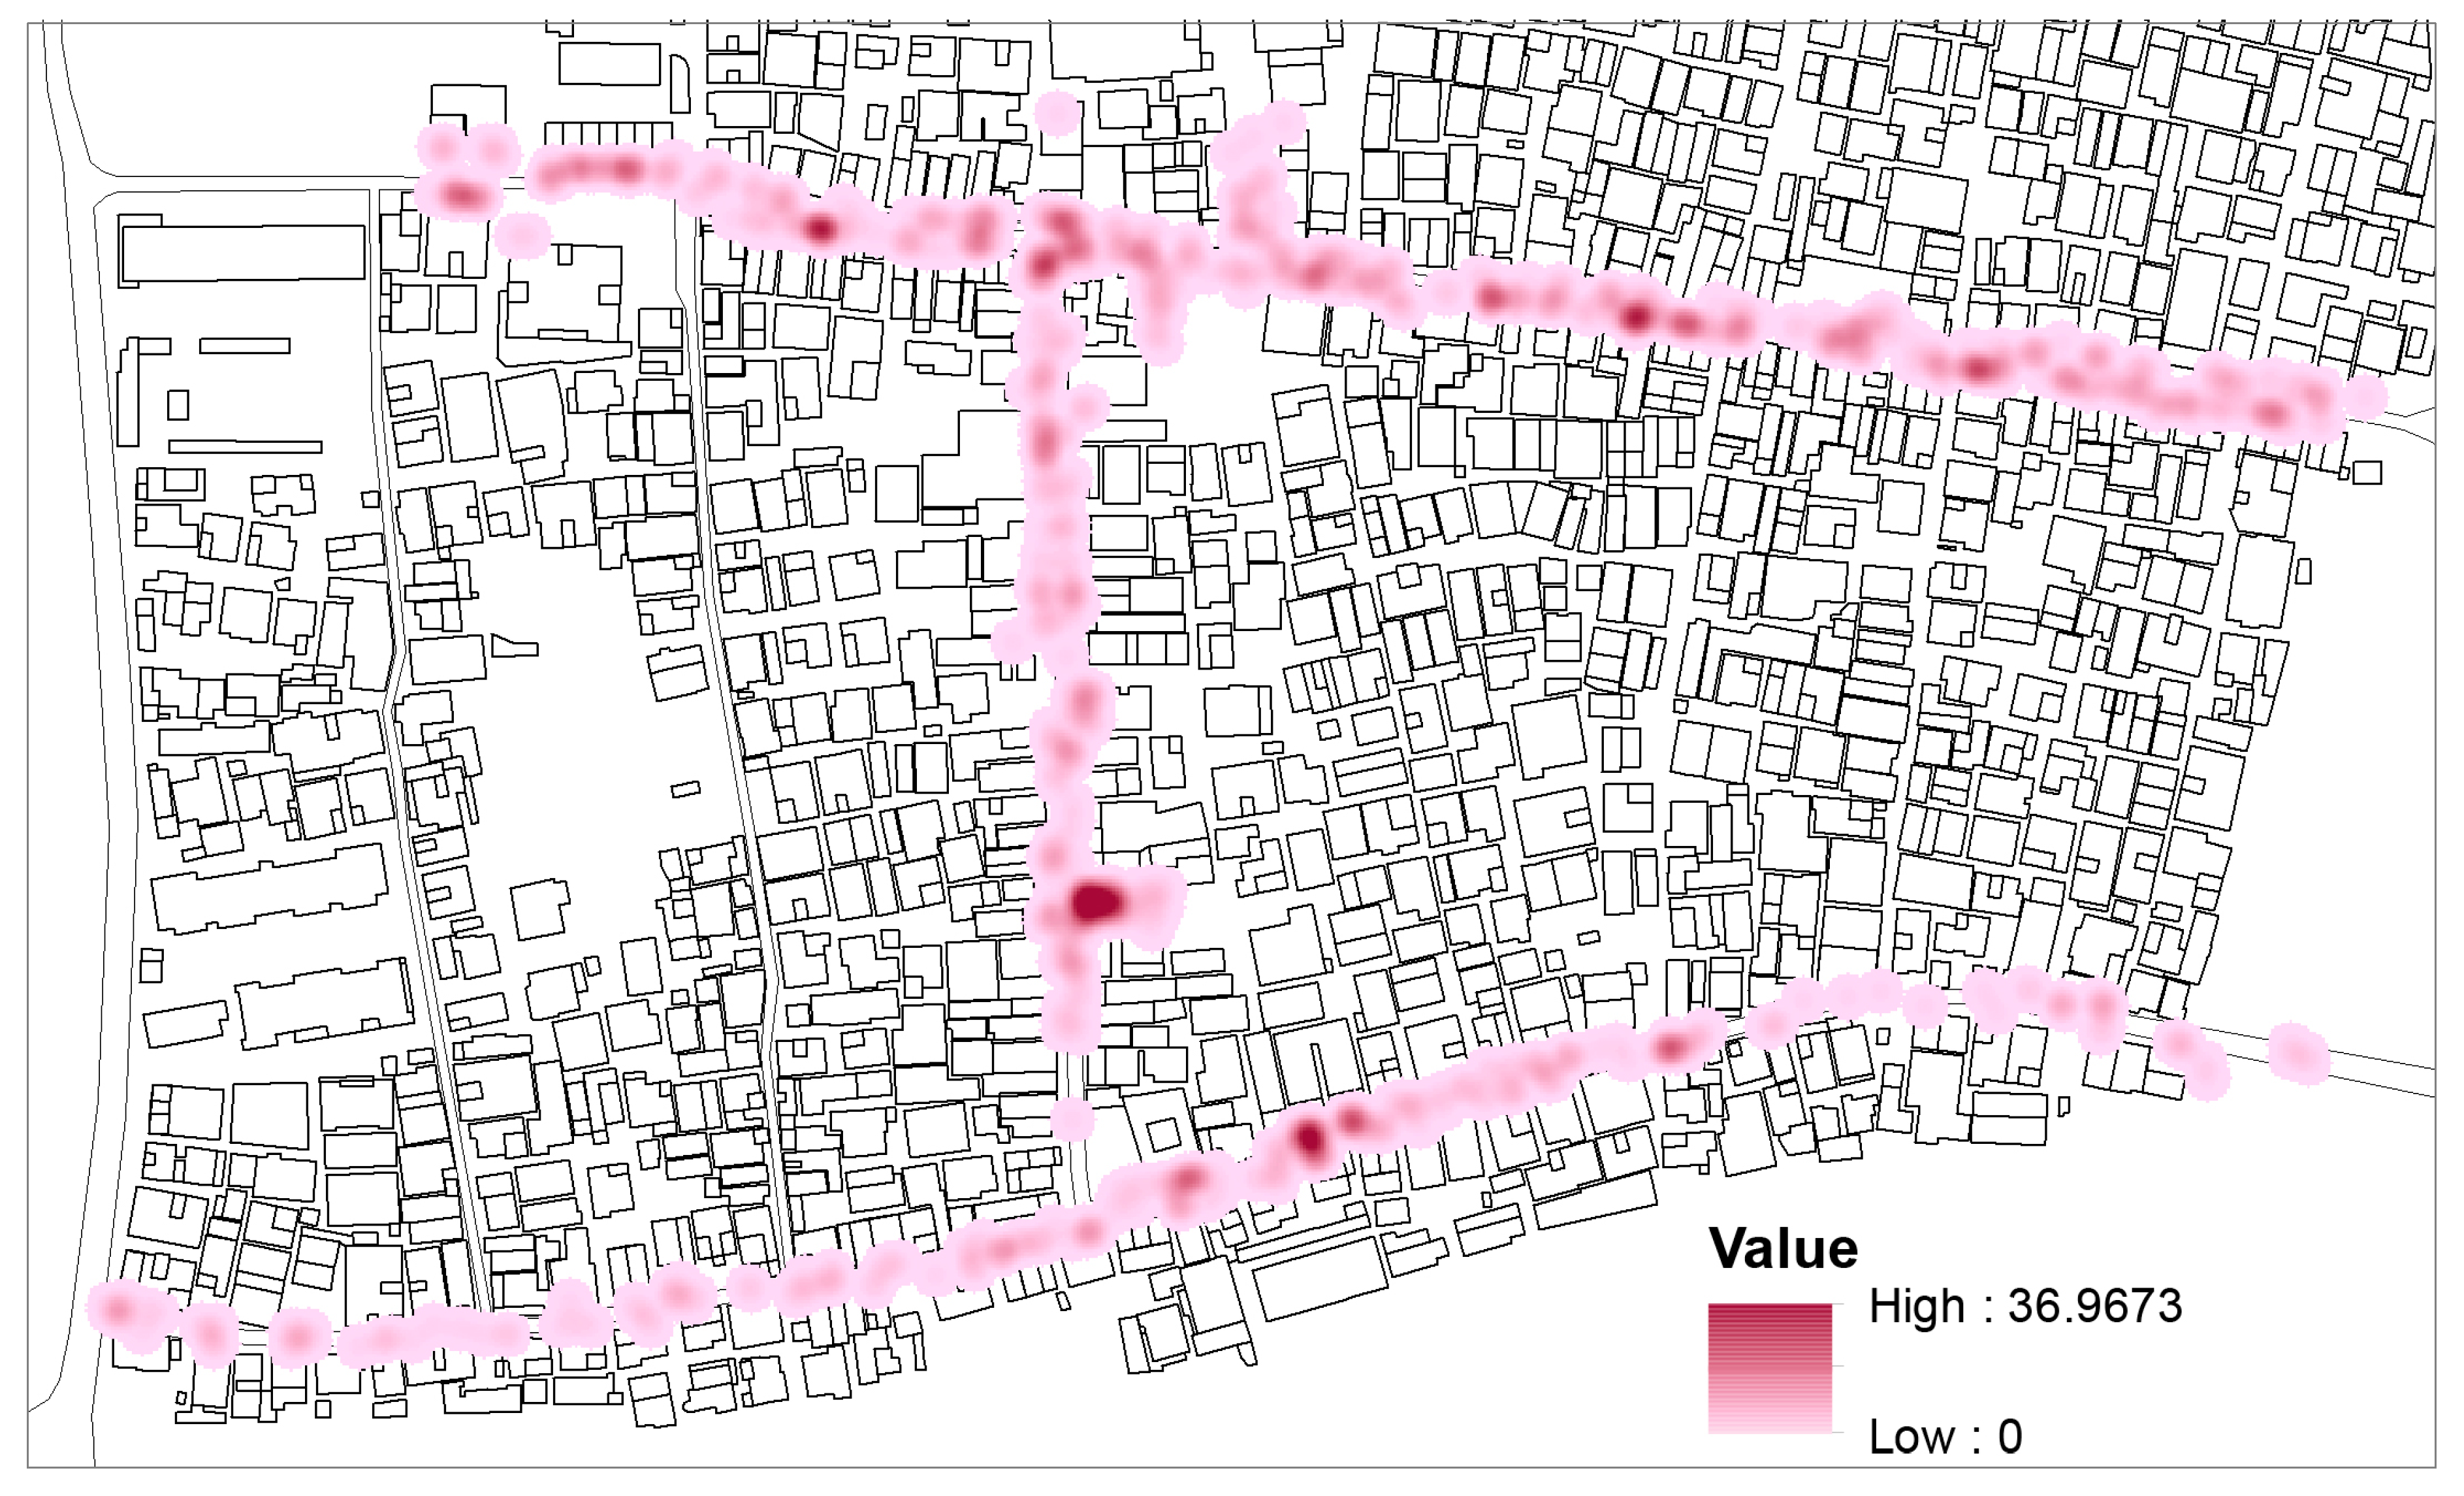
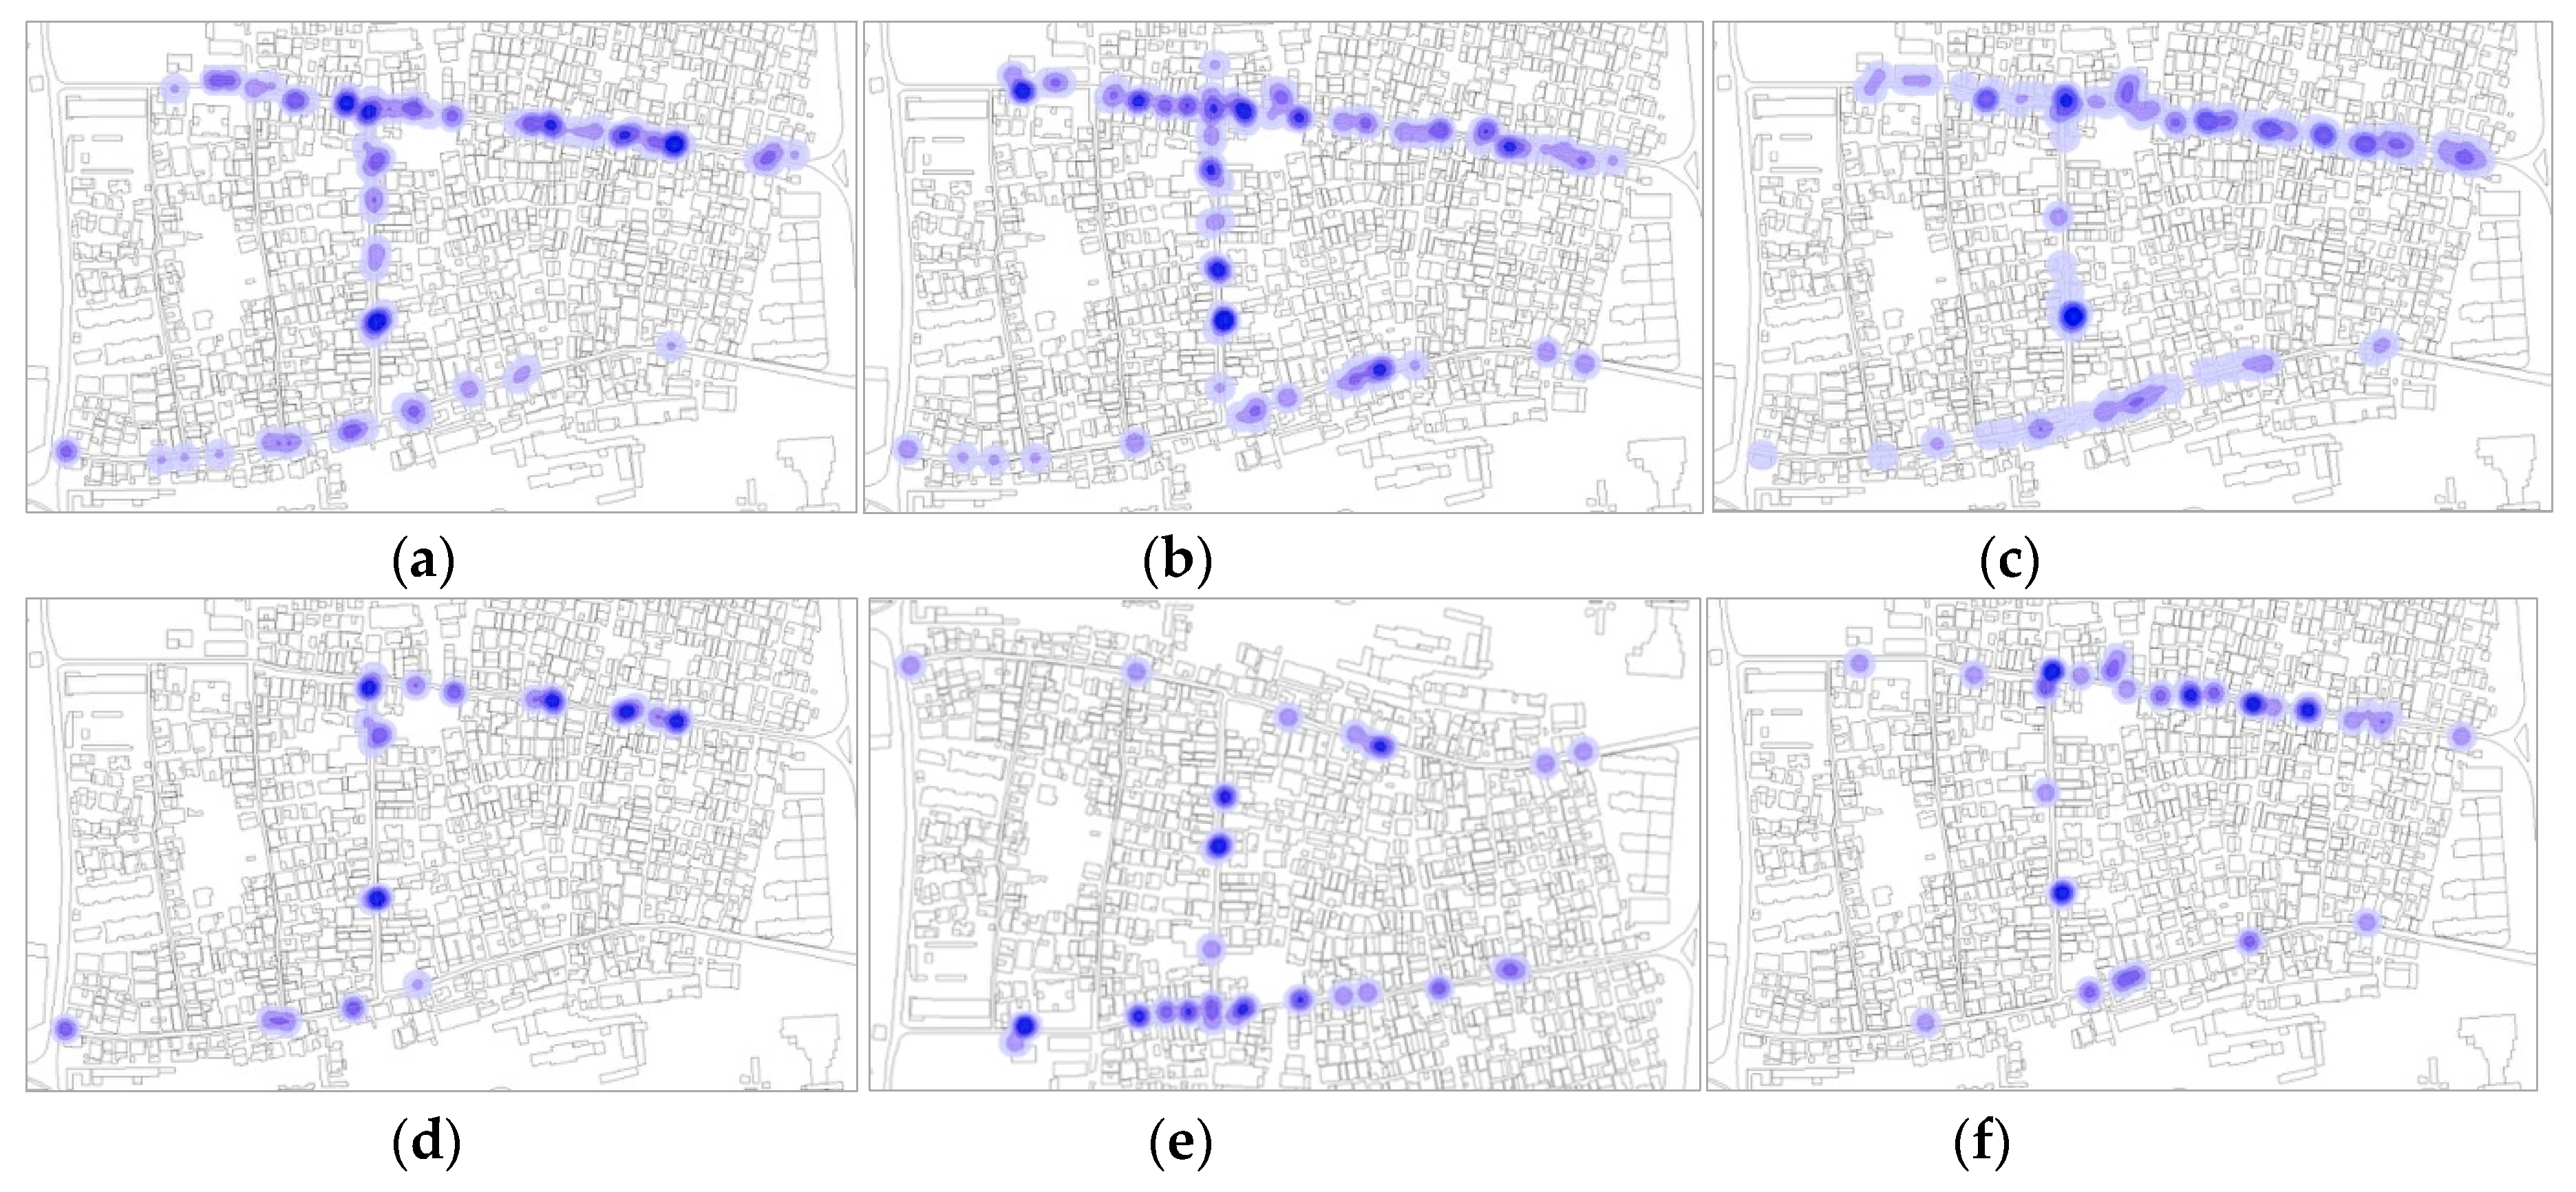
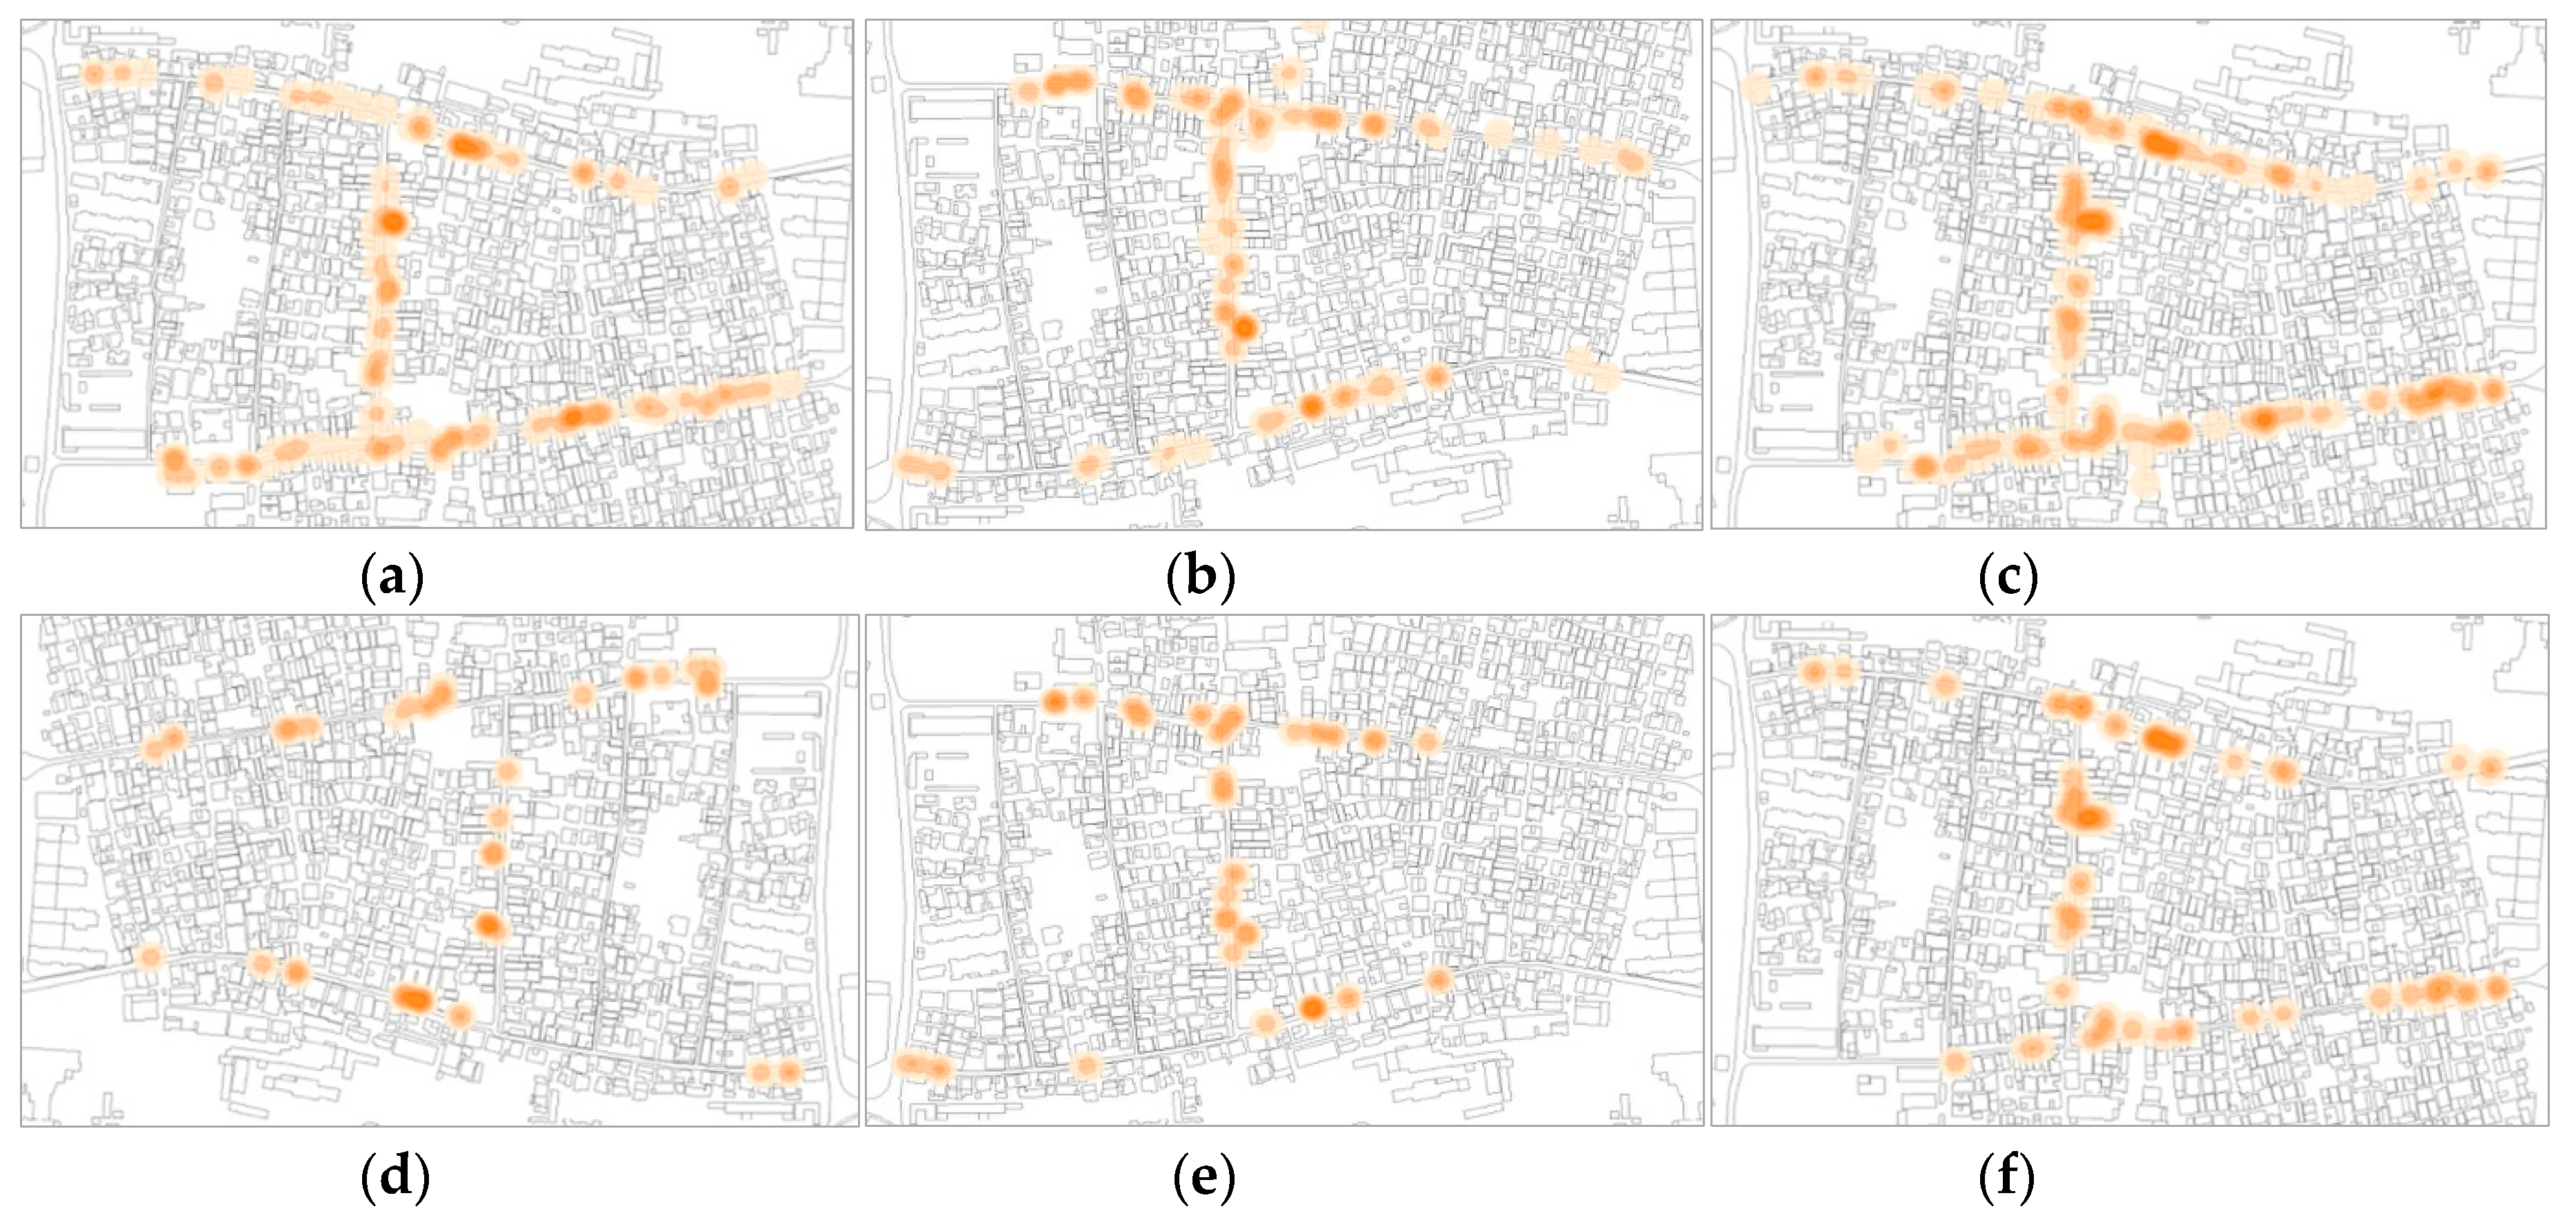
4.1. Kernel Density Map
4.2. Correlation
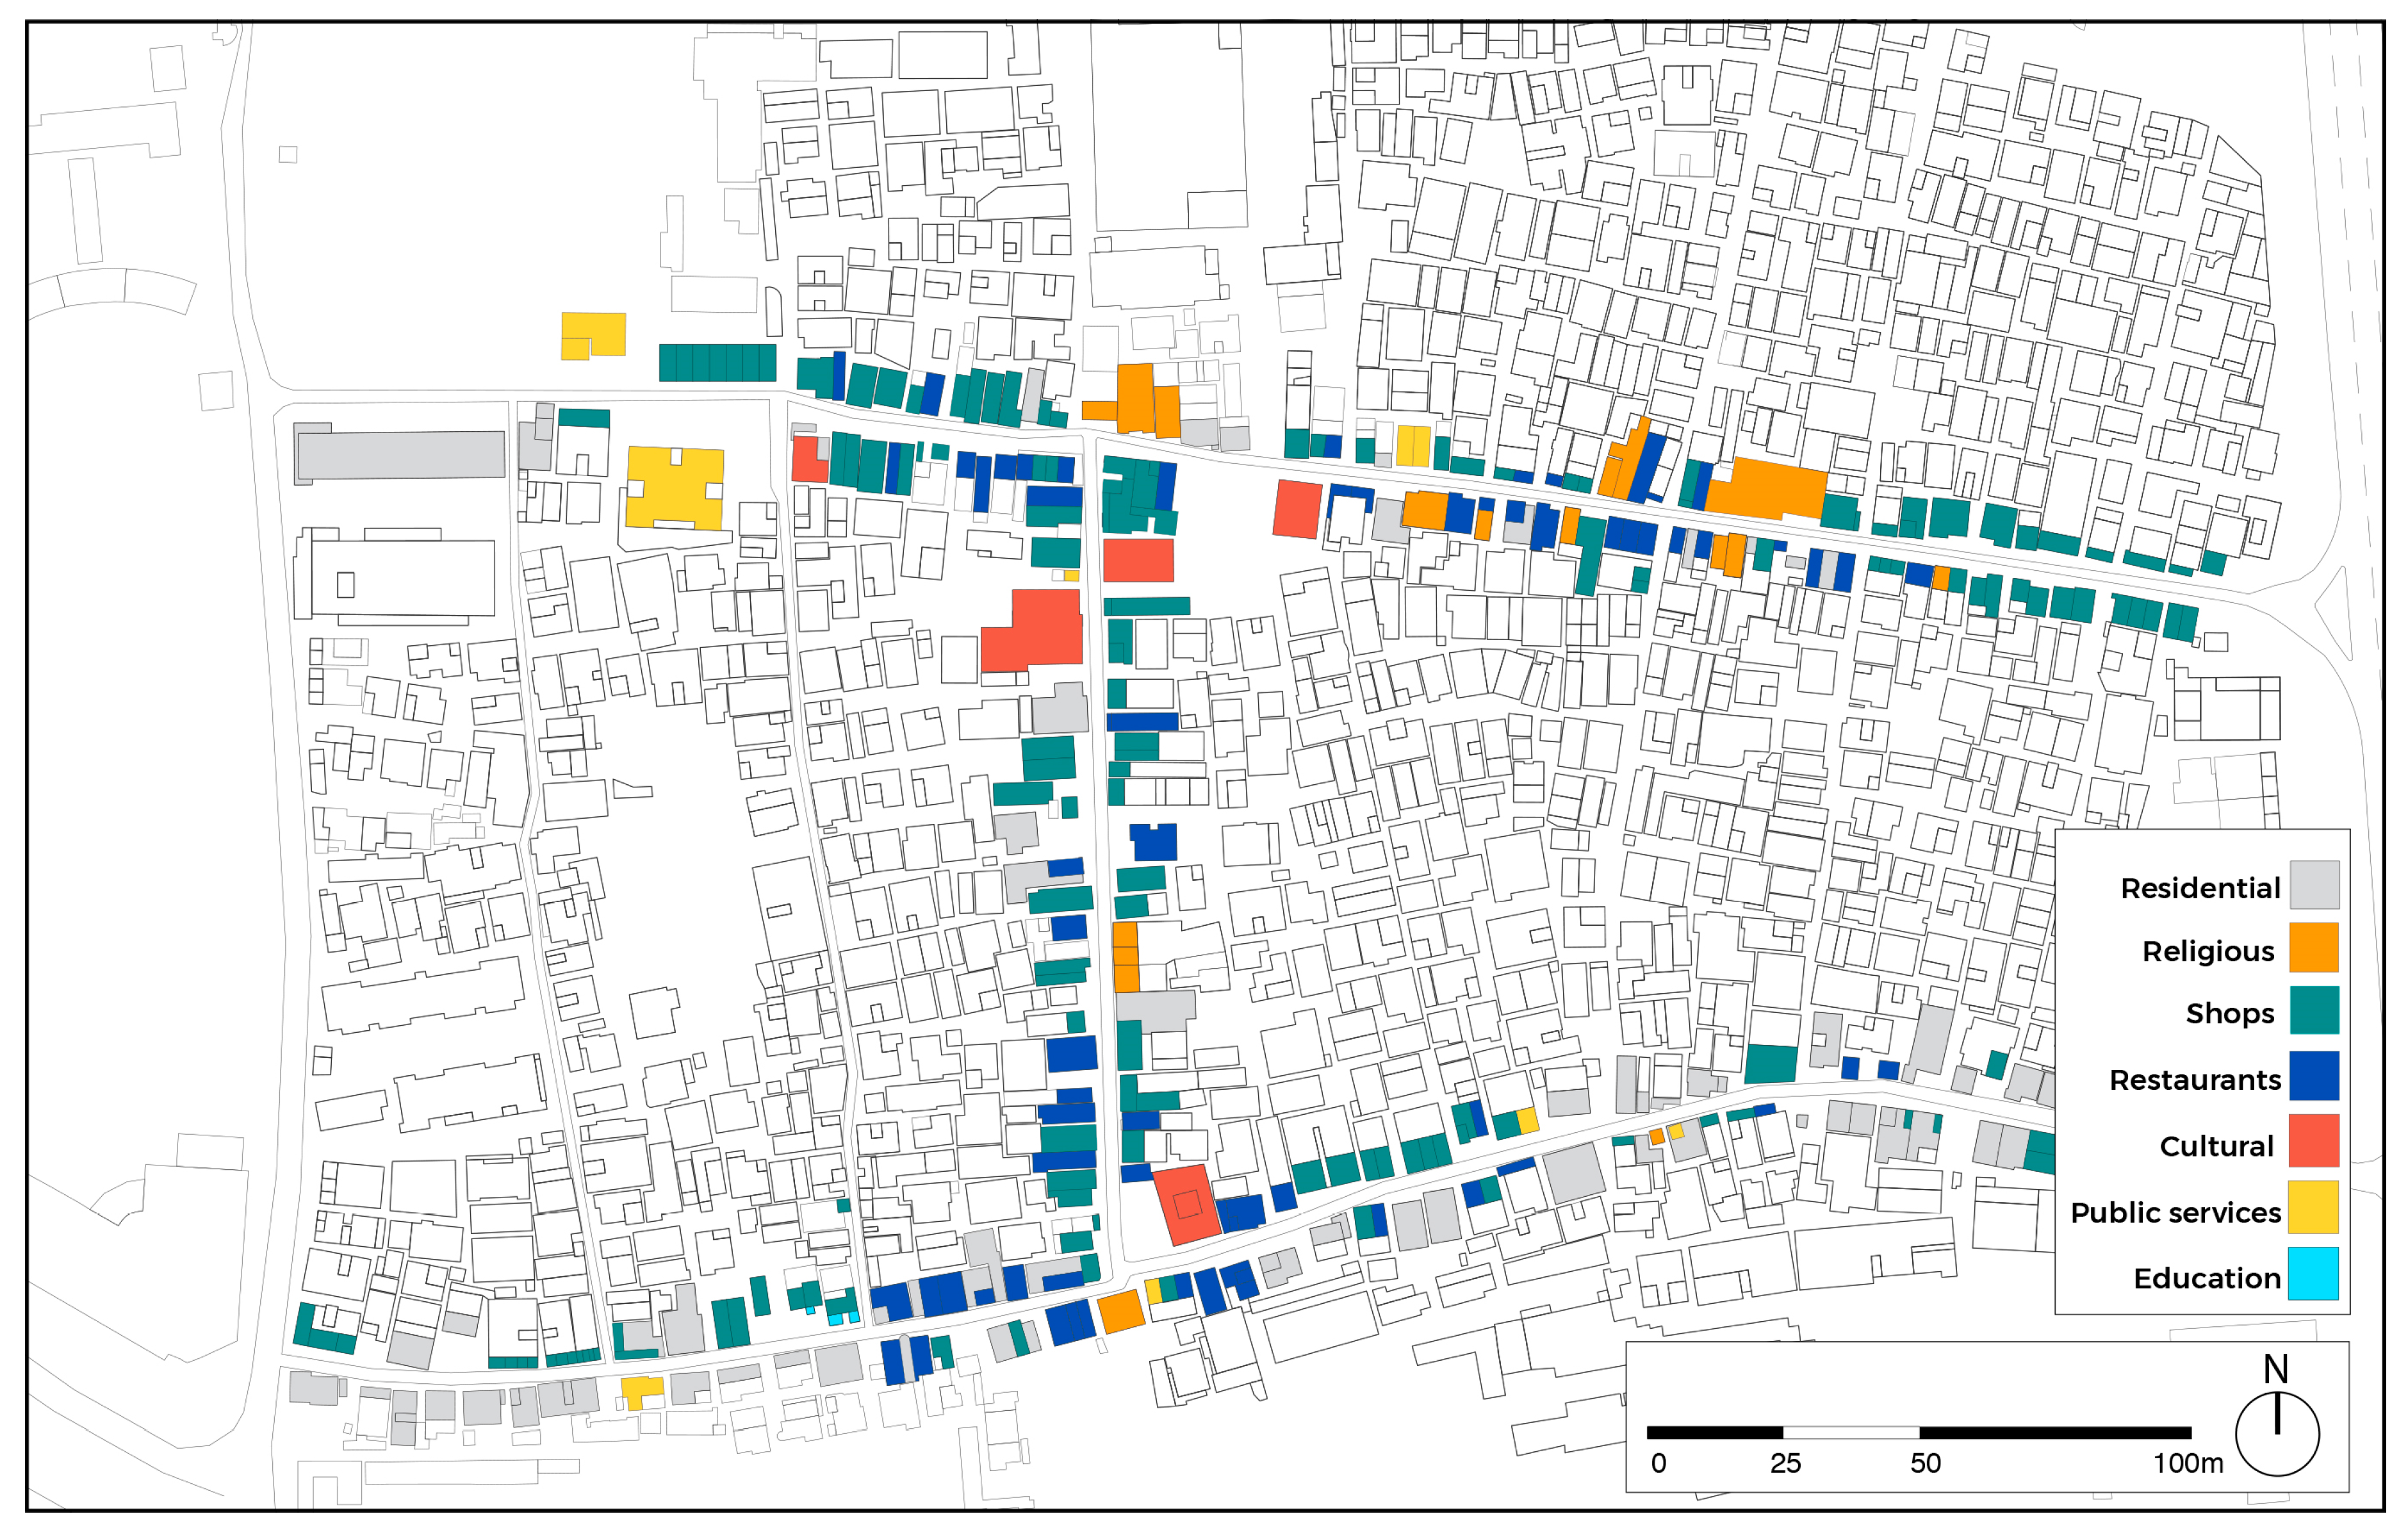
4.2.1. Land Use
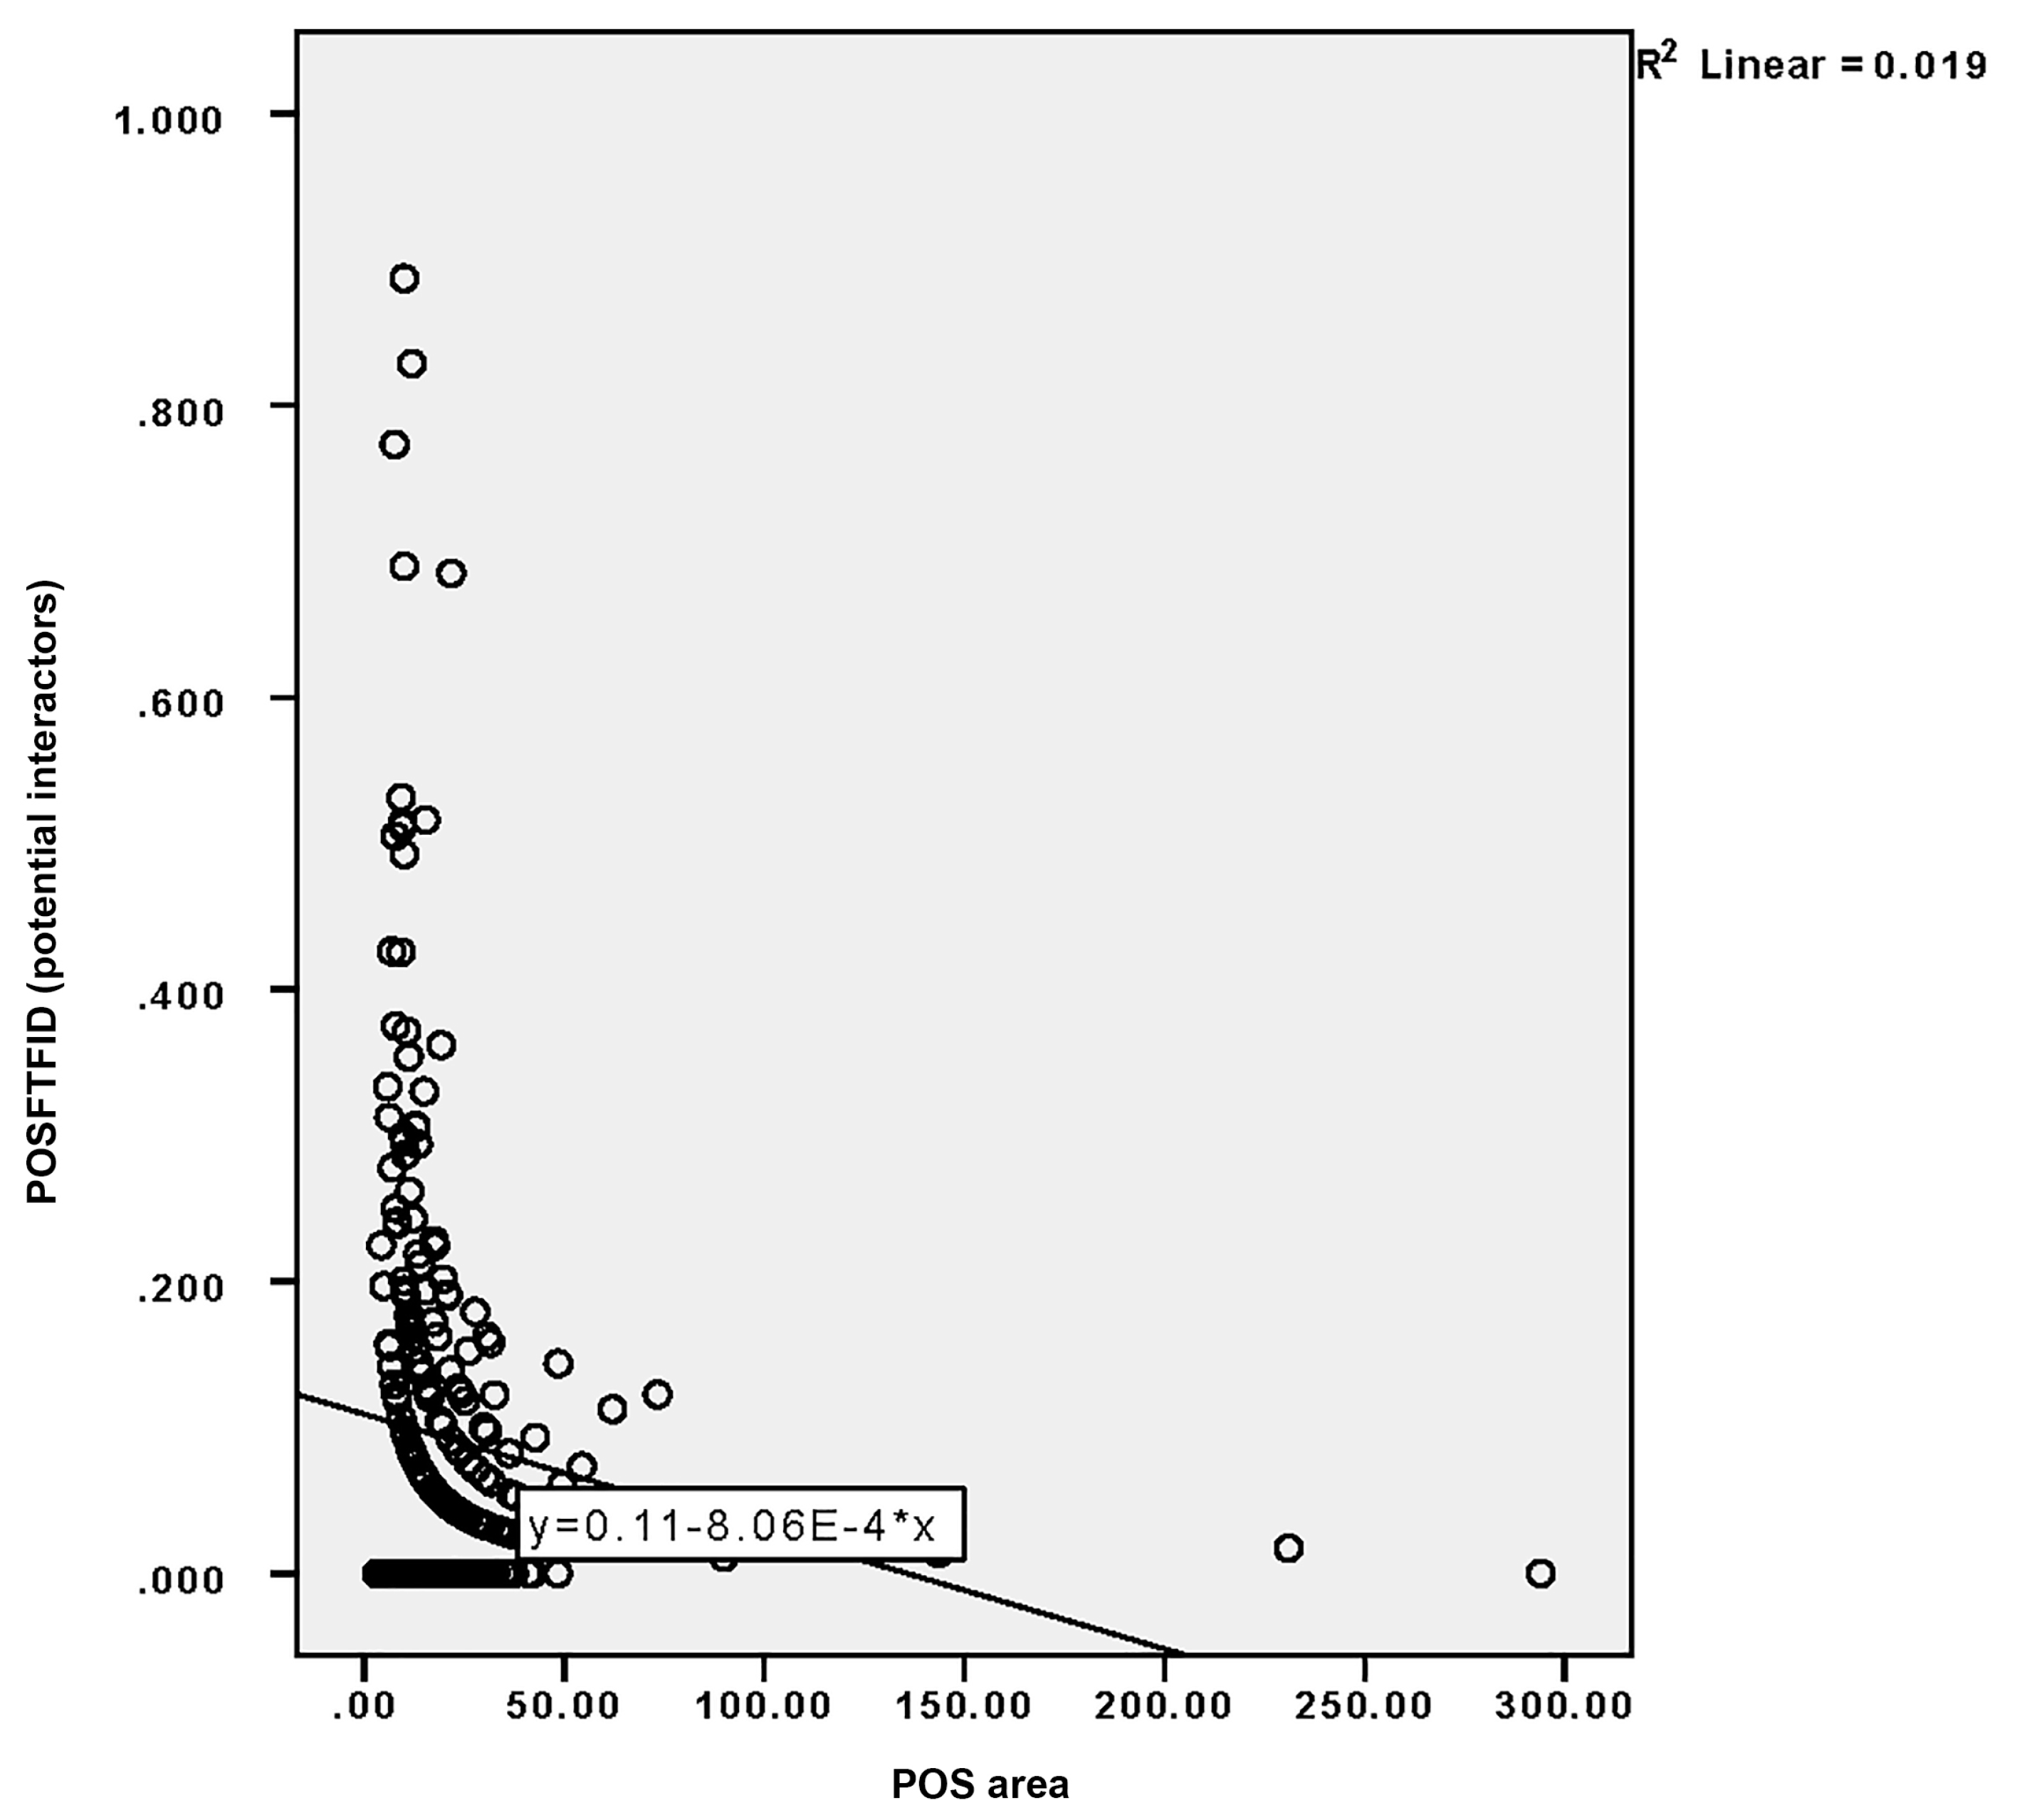
4.2.2. Design-Related GFFs
4.3. Hypotheses Validation
4.3.1. Hypothesis 1
4.3.2. Hypothesis 2
4.3.3. Hypothesis 3
5. Conclusions
Author Contributions
Funding
Acknowledgments
Conflicts of Interest
References
- Ding, D.; Gebel, K. Built environment, physical activity, and obesity: What have we learned from reviewing the literature? Health Place 2012, 18, 100–105. [Google Scholar] [CrossRef]
- Ewing, R.; Meakins, G.; Hamidi, S.; Nelson, A.C. Relationship between urban sprawl and physical activity, obesity, and morbidity-Update and refinement. Health Place 2014, 26, 118–126. [Google Scholar] [CrossRef] [PubMed]
- Sallis, J.F.; Floyd, M.F.; Rodríguez, D.A.; Saelens, B.E. Role of built environments in physical activity, obesity, and cardiovascular disease. Circulation 2012, 125, 729–737. [Google Scholar] [CrossRef] [PubMed]
- Durand, C.P.; Andalib, M.; Dunton, G.F.; Wolch, J.; Pentz, M.A. A systematic review of built environment factors related to physical activity and obesity risk: Implications for smart growth urban planning. Obes. Rev. 2011, 12, 173–182. [Google Scholar] [CrossRef]
- Sallis, J.F.; Glanz, K. The Role of Built Environments in Physical Activity, Eating, and Obesity in Childhood. Futur. Child. 2006, 16, 89–108. [Google Scholar] [CrossRef]
- An, R.; Shen, J.; Yang, Q.; Yang, Y. Impact of built environment on physical activity and obesity among children and adolescents in China: A narrative systematic review. J. Sport Health Sci. 2019, 8, 153–169. [Google Scholar] [CrossRef]
- Galvez, M.P.; Pearl, M.; Yen, I.H. Childhood obesity and the built environment. Curr. Opin. Pediatr. 2010, 22, 202–207. [Google Scholar] [CrossRef] [PubMed]
- Berke, E.M.; Koepsell, T.D.; Moudon, A.V.; Hoskins, R.E.; Larson, E.B. Association of the built environment with physical activity and obesity in older persons. Am. J. Public Health 2007, 97, 486–492. [Google Scholar] [CrossRef]
- Christian, H.; Giles-Corti, B.; Knuiman, M.; Timperio, A.; Foster, S. The influence of the built environment, social environment and health behaviors on body mass index. Results from RESIDE. Prev. Med. 2011, 53, 57–60. [Google Scholar] [CrossRef]
- Evans, G.W.; Wells, N.M.; Moch, A. Housing and mental health: A review of the evidence and a methodological and conceptual critique. J. Soc. Issues 2003, 59, 475–500. [Google Scholar] [CrossRef]
- Barros, P.; Fat, L.N.; Garcia, L.M.T.; Slovic, A.D.; Thomopoulos, N.; Sá, T.H.; Morais, P.; Mindell, J.S. Social consequences and mental health outcomes of living in high-rise residential buildings and the influence of planning, urban design and architectural decisions: A systematic review. Cities 2019, 93, 263–272. [Google Scholar] [CrossRef]
- Francis, J.; Wood, L.J.; Knuiman, M.; Giles-Corti, B. Quality or quantity? Exploring the relationship between Public Open Space attributes and mental health in Perth, Western Australia. Soc. Sci. Med. 2012, 74, 1570–1577. [Google Scholar] [CrossRef] [PubMed]
- Hystad, P.; Payette, Y.; Noisel, N.; Boileau, C. Green space associations with mental health and cognitive function. Environ. Epidemiol. 2019, 3, e040. [Google Scholar] [CrossRef]
- Gascon, M.; Triguero-Mas, M.; Martínez, D.; Dadvand, P.; Forns, J.; Plasència, A.; Nieuwenhuijsen, M.J. Mental health benefits of long-term exposure to residential green and blue spaces: A systematic review. Int. J. Environ. Res. Public Health 2015, 12, 4354–4379. [Google Scholar] [CrossRef]
- Wandersman, A.; Nation, M. Urban Neighborhoods and Mental Health: Psychological Contributions to Understanding Toxicity, Resilience, and Interventions. Am. Psychol. 1998, 53, 647–656. [Google Scholar] [CrossRef]
- Kraut, R.; Kiesler, S.; Boneva, B.; Cummings, J.; Helgeson, V.; Crawford, A. Internet paradox revisited. J. Soc. Issues 2002, 58, 49–74. [Google Scholar] [CrossRef]
- Caplan, S.E. Preference for Online Social Interaction: A Theory of Problematic Internet Use and Psychosocial Well-Being. Commun. Res. 2003, 30, 625–648. [Google Scholar] [CrossRef]
- Hari, R.; Henriksson, L.; Malinen, S.; Parkkonen, L. Centrality of Social Interaction in Human Brain Function. Neuron 2015, 88, 181–193. [Google Scholar] [CrossRef]
- Bernstein, M.J.; Zawadzki, M.J.; Juth, V.; Benfield, J.A.; Smyth, J.M. Social interactions in daily life: Within-person associations between momentary social experiences and psychological and physical health indicators. J. Soc. Pers. Relat. 2018, 35, 372–394. [Google Scholar] [CrossRef]
- Leyden, K.M. Social Capital and the Built Environment: The Importance of Walkable Neighborhoods. Am. J. Public Health 2003, 93, 1546–1551. [Google Scholar] [CrossRef]
- Holt-Lunstad, J. Why Social Relationships are Important for Physical Health: A Systems Approach to Understanding and Modifying Risk and Protection. Ssrn 2018, 69, 437–458. [Google Scholar] [CrossRef] [PubMed]
- Duncan, S.J.; Fiske, D.W. Face-to-Face Interaction; Routledge: New York, NY, USA, 2016; Volume 53. [Google Scholar]
- Goffman, E. Interaction Ritual. Essays in Face-To-Face Behavior; Routledge: New York, NY, USA, 1967. [Google Scholar]
- Goffman, E. Behavior in Public Places; The Free Press: New York, NY, USA, 1963. [Google Scholar]
- Gehl, J.; Svarre, B. How to Study Public Life; Island Press: Washington, DC, USA, 2013. [Google Scholar]
- Gehl, J. Life between Buildings, 6th ed.; The Danish Architectural Press: Copenaghen, Denmark, 1987. [Google Scholar]
- Kibanov, M.; Atzmueller, M.; Scholz, C.; Stumme, G. Temporal evolution of contacts and communities in networks of face-to-face human interactions. Sci. China Inf. Sci. 2014, 57, 1–17. [Google Scholar] [CrossRef][Green Version]
- Barrat, A.; Cattuto, C.; Colizza, V.; Gesualdo, F.; Isella, L.; Pandolfi, E.; Pinton, J.-F.; Ravà, L.; Rizzo, C.; Romano, M.; et al. Empirical temporal networks of face-to-face human interactions. Eur. Phys. J. Spec. Top. 2013, 222, 1295–1309. [Google Scholar] [CrossRef]
- Lynch, K. The Image of the City; The MIT Press: Cambridge, MA, USA, 1960. [Google Scholar]
- Jacobs, J. The Death and Life of Great American Cities; Vintage Books: New York, NY, USA, 1961. [Google Scholar]
- Whyte, W.H. The Social Life of Small Urban Spaces, 12th ed.; Project for Public Spaces: New York, NY, USA, 1980. [Google Scholar]
- Mehta, V. Look closely and you will see, listen carefully and you will hear: Urban design and social interaction on streets. J. Urban Des. 2009, 14, 29–64. [Google Scholar] [CrossRef]
- Dovey, K.; Wood, S. Public/private urban interfaces: Type, adaptation, assemblage. J. Urban 2015, 8, 1–16. [Google Scholar] [CrossRef]
- Hassan, D.M.; Moustafa, Y.M.; El-Fiki, S.M. Ground-floor façade design and staying activity patterns on the sidewalk: A case study in the Korba area of Heliopolis, Cairo, Egypt. Ain Shams Eng. J. 2019, 10, 453–461. [Google Scholar] [CrossRef]
- Appleyard, D.; Gerson, M.S.; Lintell, M. Livable Streets; University of California Press: Berkeley, CA, USA, 1981. [Google Scholar]
- Gehl, J. Life between Buildings: Using Public Space; Van Nostrand Reinhold: New York, NY, USA, 1987. [Google Scholar]
- Heffernan, E.; Heffernan, T.; Pan, W. The relationship between the quality of active frontages and public perceptions of public spaces. Urban Des. Int. 2014, 19, 92–102. [Google Scholar] [CrossRef]
- López, T.G. Influencia de la configuración del borde público-privado: Parámetros de diseño. Cuad. Investig. Urban. 2007, 52, 3–65. [Google Scholar]
- Kickert, C.C. Active centers-Interactive edges: The rise and fall of ground floor frontages. Urban Des. Int. 2016, 21, 55–77. [Google Scholar] [CrossRef]
- Can, I.; Heath, T. In-between spaces and social interaction: A morphological analysis of Izmir using space syntax. J. Hous. Built Environ. 2016, 31, 31–49. [Google Scholar] [CrossRef]
- Shahlaei, A.; Mohajeri, M. In-Between Space, Dialectic of Inside and Outside in Architecture. Int. J. Archit. Urban Dev. 2015, 5, 73–80. [Google Scholar]
- Nooraddin, H. In-between space: Towards establishing new methods in Street Design. Glob. Buil Environ. Rev. 2002, 2, 50–57. [Google Scholar]
- Elsheshtawy, Y. Urban complexity: Toward the measurement of the physical complexity of street-scapes. J. Archit. Plan. Res. 1997, 14, 301–316. [Google Scholar]
- Mehta, V. Lively streets: Determining environmental characteristics to support social behavior. J. Plan. Educ. Res. 2007, 27, 165–187. [Google Scholar] [CrossRef]
- Ewing, R.; Handy, S. Measuring the unmeasurable: Urban design qualities related to walkability. J. Urban Des. 2009, 14, 65–84. [Google Scholar] [CrossRef]
- Long, Y.; Ye, Y. Measuring human-scale urban form and its performance. Landsc. Urban Plan. 2019, 191, 103612. [Google Scholar] [CrossRef]
- Gehl, J.; Kaefer, L.J.; Reigstad, S. Close encounters with buildings. T. Plan. Archit. 2005, 29, 70–80. [Google Scholar] [CrossRef]
- Mehta, V. Lively Streets: Exploring the Relationship between Built Environment and Social Behavior; University of Maryland: College Park, MD, USA, 2006. [Google Scholar]
- Gehl, J.; Kaefer, L.J.; Reigstad, S. Close encounters with buildings. Urban Des. Int. 2006, 11, 29–47. [Google Scholar] [CrossRef]
- Elsheshtawy, Y. Where the sidewalk ends: Informal street corner encounters in Dubai. Cities 2013, 31, 382–393. [Google Scholar] [CrossRef]
- van Nes, A. Measuring the urban private-public interface. WIT Trans. Ecol. Environ. 2008, 117, 389–398. [Google Scholar]
- Clemente, O.; Ewing, R.; Handy, S.; Brownson, R. Measuring Urban Design Qualities. An Illustrated Field Manual; Robert Wood Johnson Foundation: Princeton, NJ, USA, 2005. [Google Scholar]
- Mehta, V.; Bosson, J.K. Third places and the social life of streets. Environ. Behav. 2010, 42, 779–805. [Google Scholar] [CrossRef]
- Montgomery, J. Cafe culture and the city: The role of pavement cafes in urban public social life. J. Urban Des. 1997, 2, 83–102. [Google Scholar] [CrossRef]
- Mehta, V. Evaluating Public Space. J. Urban Des. 2014, 19, 53–88. [Google Scholar] [CrossRef]
- Villani, C.; Zordan, M.; Talamini, G.; Cheng, Y.H. Temporarily Pedestrianized Street in Hong Kong: Governmental Strategy of Implementation and Tactics of Appropriation by Foreign Domestic Workers. In Proceedings of the AESOP 2019 Congress Book of Papers, Venice, Italy, 9–13 July 2019; p. 2559. [Google Scholar]
- Ewing, R.; Handy, S.; Brownson, R.C.; Clemente, O.; Winston, E. Identifying and Measuring Urban Design Qualities Related to Walkability. J. Phys. Act. Health 2006, 3, s223–s240. [Google Scholar] [CrossRef] [PubMed]
- Lin, Y.; de Meulder, B. A conceptual framework for the strategic urban project approach for the sustainable redevelopment of ‘villages in the city’ in Guangzhou. Habitat Int. 2012, 36, 380–387. [Google Scholar] [CrossRef]
- Kaiser, C.M. Urban Villages within the Megalopolis of Shenzhen: A (De)Centralised Driver for Urban Change? Oncurating. Available online: http://www.on-curating.org/issue-41-reader/urban-villages-within-the-megalopolis-of-shenzhen-a-decentralised-driver-for-urban-change.html#.XeeRMC2h1Z1 (accessed on 15 September 2019).
- Zordan, M. Ground China. Starting from Villages. In Walkable Cities in High-Density China. Livable, Healthy and Sustainable; Tongji University Press: Shanghai, China, 2018; pp. 41–81. [Google Scholar]
- Talamini, G.; Ferreira, D.P. An informal transportation as a feeder of the rapid transit system. Spatial analysis of the e-bike taxi service in Shenzhen, China. Transp. Res. Interdiscip. Perspect. 2019, 1, 100002. [Google Scholar] [CrossRef]
- Talamini, G. Where Buildings and Actions Interpenetrate. In Walkable Cities in High-Density China. Livable, Healthy and Sustainable; Tongji University Press: Shanghai, China, 2018; pp. 193–211. [Google Scholar]
- Mondada, L. Video recording as the reflexive preservation and configuration of phenomenal features for analysis. In Video Analysis: Methodology and Methods: Qualitative Audiovisual Data Analysis in Sociology; Knoblauch, H., Schnettler, B., Raab, J., Soeffner, H.-G., Eds.; Lang: Bern, Switzerland, 2006; pp. 51–67. [Google Scholar]
- Groat, L.; Wang, D. Architectural Research Methods, 2nd ed.; John Wiley & Sons, Inc.: Hoboken, NJ, USA, 2013. [Google Scholar]
- Foot, D. Operational Urban Models. An introduction; Routledge: Oxon, UK; New York, NY, USA, 1981. [Google Scholar]
- Wood, L.; Frank, L.D.; Giles-Corti, B. Sense of community and its relationship with walking and neighborhood design. Soc. Sci. Med. 2010, 70, 1381–1390. [Google Scholar] [CrossRef]


| Type | Features | Description | Observable Variables | Measurement | Findings | Source |
|---|---|---|---|---|---|---|
| Architectural articulation | Façade articulation | - | Texture, size, colour, façade components, and shape | Building shape (no rectangular silhouettes), pedestrian/car setbacks | Creation of a more human scale environment, creation of stationary activities place through subspace in the façade | [33,44,45] |
| Rhythm | - | Vertical and horizontal lines in the façade | Height (building) to width (sidewalk) ratio, proportion of first floor with windows, number of ground-level doors facing the street, average sidewalk width | Attraction of pedestrians’ attention to ground-level, impact on walking speed (slower) | [45,47] | |
| Scale | - | Presence of narrow units in the architectural façade | Increase in façade niches and contribution to pedestrian activities | |||
| Permeability | Physical permeability | Physical access to a space | Degree of street-front permeability on the block-segment, number of ground-level entrances, proportion of active uses | Attraction of pedestrians’ attention to explore the ground-level façade Increase in pedestrian activities in front of higher transparency façades | [48] | |
| Transparency | Degree to which people can see human activity or what lies beyond the edge from the street | Degree of transparency (impermeable/opaque /transparent) | Proportion first floor with windows | [32,33,38,45] | ||
| Personalization | Degree to which a street appears to be modified and claimed by residents or store owners | Presence of decorative elements and signs, addition of seating and shading, landscaped areas, Dominant building colours | - | Promotion of pedestrian activities at the ground-level, contribution to sense of security to users | [44,48,50] | |
| Enclosure | Degree to which public space is visually defined by buildings, walls, trees | Height to width ratio, number of street furniture and vegetation, proportion sky ahead | People preference for enclosed spaces | [25,45,48,52] | ||
| Land use | Diversity in the ground-level land use | Presence of commercial local stores, | number of independent businesses on the block-segment, number of outdoor dining, entropy index | Promotion of pedestrian activities on the streets, contribution to sense of security to users (eyes on the street) | [30,48,53,54] | |
| Amenities provision | Number of seating space and shaded areas | Seating space and shaded areas | number of public (non-commercial) or commercial seating on the block-segment, percentage shade and shelter from trees and canopies on the block-segment | Promotion of pedestrian activities on the streets, contribution to pedestrians’ comfort Increase in sense of human scale | [31,32,55] |
| Land Use | Potential Interactor | Sig. (2-Tailed) | Interactor | Sig. (2-Tailed) | Total | Sig. (2-Tailed) | N |
|---|---|---|---|---|---|---|---|
| Residential | −0.227 ** | 0.000 | −0.124 * | 0.034 | −0.221 ** | 0.000 | 292 |
| Religious | −0.030 | 0.607 | 0.071 | 0.223 | 0.028 | 0.631 | 292 |
| Retail | 0.099 | 0.091 | 0.067 | 0.255 | 0.117 * | 0.046 | 292 |
| Restaurant/Food | 0.185 ** | 0.001 | 0.076 | 0.194 | 0.150 * | 0.010 | 292 |
| Cultural | −0.016 | 0.788 | 0.032 | 0.586 | 0.012 | 0.835 | 292 |
| Public Service | 0.059 | 0.317 | −0.066 | 0.257 | −0.080 | 0.171 | 292 |
| Educational | −0.053 | 0.364 | −0.013 | 0.828 | −0.040 | 0.493 | 292 |
| Design | Unit | Potential Interactor | Sig. (2-Tailed) | Interactor | Sig. (2-Tailed) | Total | Sig. (2-Tailed) | N |
|---|---|---|---|---|---|---|---|---|
| Internal space | m2 | −0.088 | 0.135 | −0.067 | 0.252 | −0.105 | 0.073 | 292 |
| Visible space | m2 | 0.059 | 0.318 | 0.053 | 0.362 | 0.064 | 0.274 | 292 |
| Stairs | dummy | 0.220 ** | 0.000 | 0.089 | 0.129 | 0.182 ** | 0.002 | 292 |
| POS (buffer) | m2 | −0.140 * | 0.017 | −0.82 | 0.161 | −0.143 * | 0.015 | 292 |
| Visible/Inter. space | ratio | 0.131 * | 0.025 | 0.109 | 0.064 | 0.145 * | 0.013 | 292 |
| POS/Inter. space | ratio | −0.150 | 0.010 | 0.009 | 0.882 | −0.076 | 0.198 | 292 |
© 2019 by the authors. Licensee MDPI, Basel, Switzerland. This article is an open access article distributed under the terms and conditions of the Creative Commons Attribution (CC BY) license (http://creativecommons.org/licenses/by/4.0/).
Share and Cite
Zordan, M.; Talamini, G.; Villani, C. The Association between Ground Floor Features and Public Open Space Face-To-Face Interactions: Evidence from Nantou Village, Shenzhen. Int. J. Environ. Res. Public Health 2019, 16, 4934. https://doi.org/10.3390/ijerph16244934
Zordan M, Talamini G, Villani C. The Association between Ground Floor Features and Public Open Space Face-To-Face Interactions: Evidence from Nantou Village, Shenzhen. International Journal of Environmental Research and Public Health. 2019; 16(24):4934. https://doi.org/10.3390/ijerph16244934
Chicago/Turabian StyleZordan, Mirna, Gianni Talamini, and Caterina Villani. 2019. "The Association between Ground Floor Features and Public Open Space Face-To-Face Interactions: Evidence from Nantou Village, Shenzhen" International Journal of Environmental Research and Public Health 16, no. 24: 4934. https://doi.org/10.3390/ijerph16244934
APA StyleZordan, M., Talamini, G., & Villani, C. (2019). The Association between Ground Floor Features and Public Open Space Face-To-Face Interactions: Evidence from Nantou Village, Shenzhen. International Journal of Environmental Research and Public Health, 16(24), 4934. https://doi.org/10.3390/ijerph16244934