Ecological Security Assessment Based on Ecological Footprint Approach in Hulunbeir Grassland, China

Abstract
1. Introduction
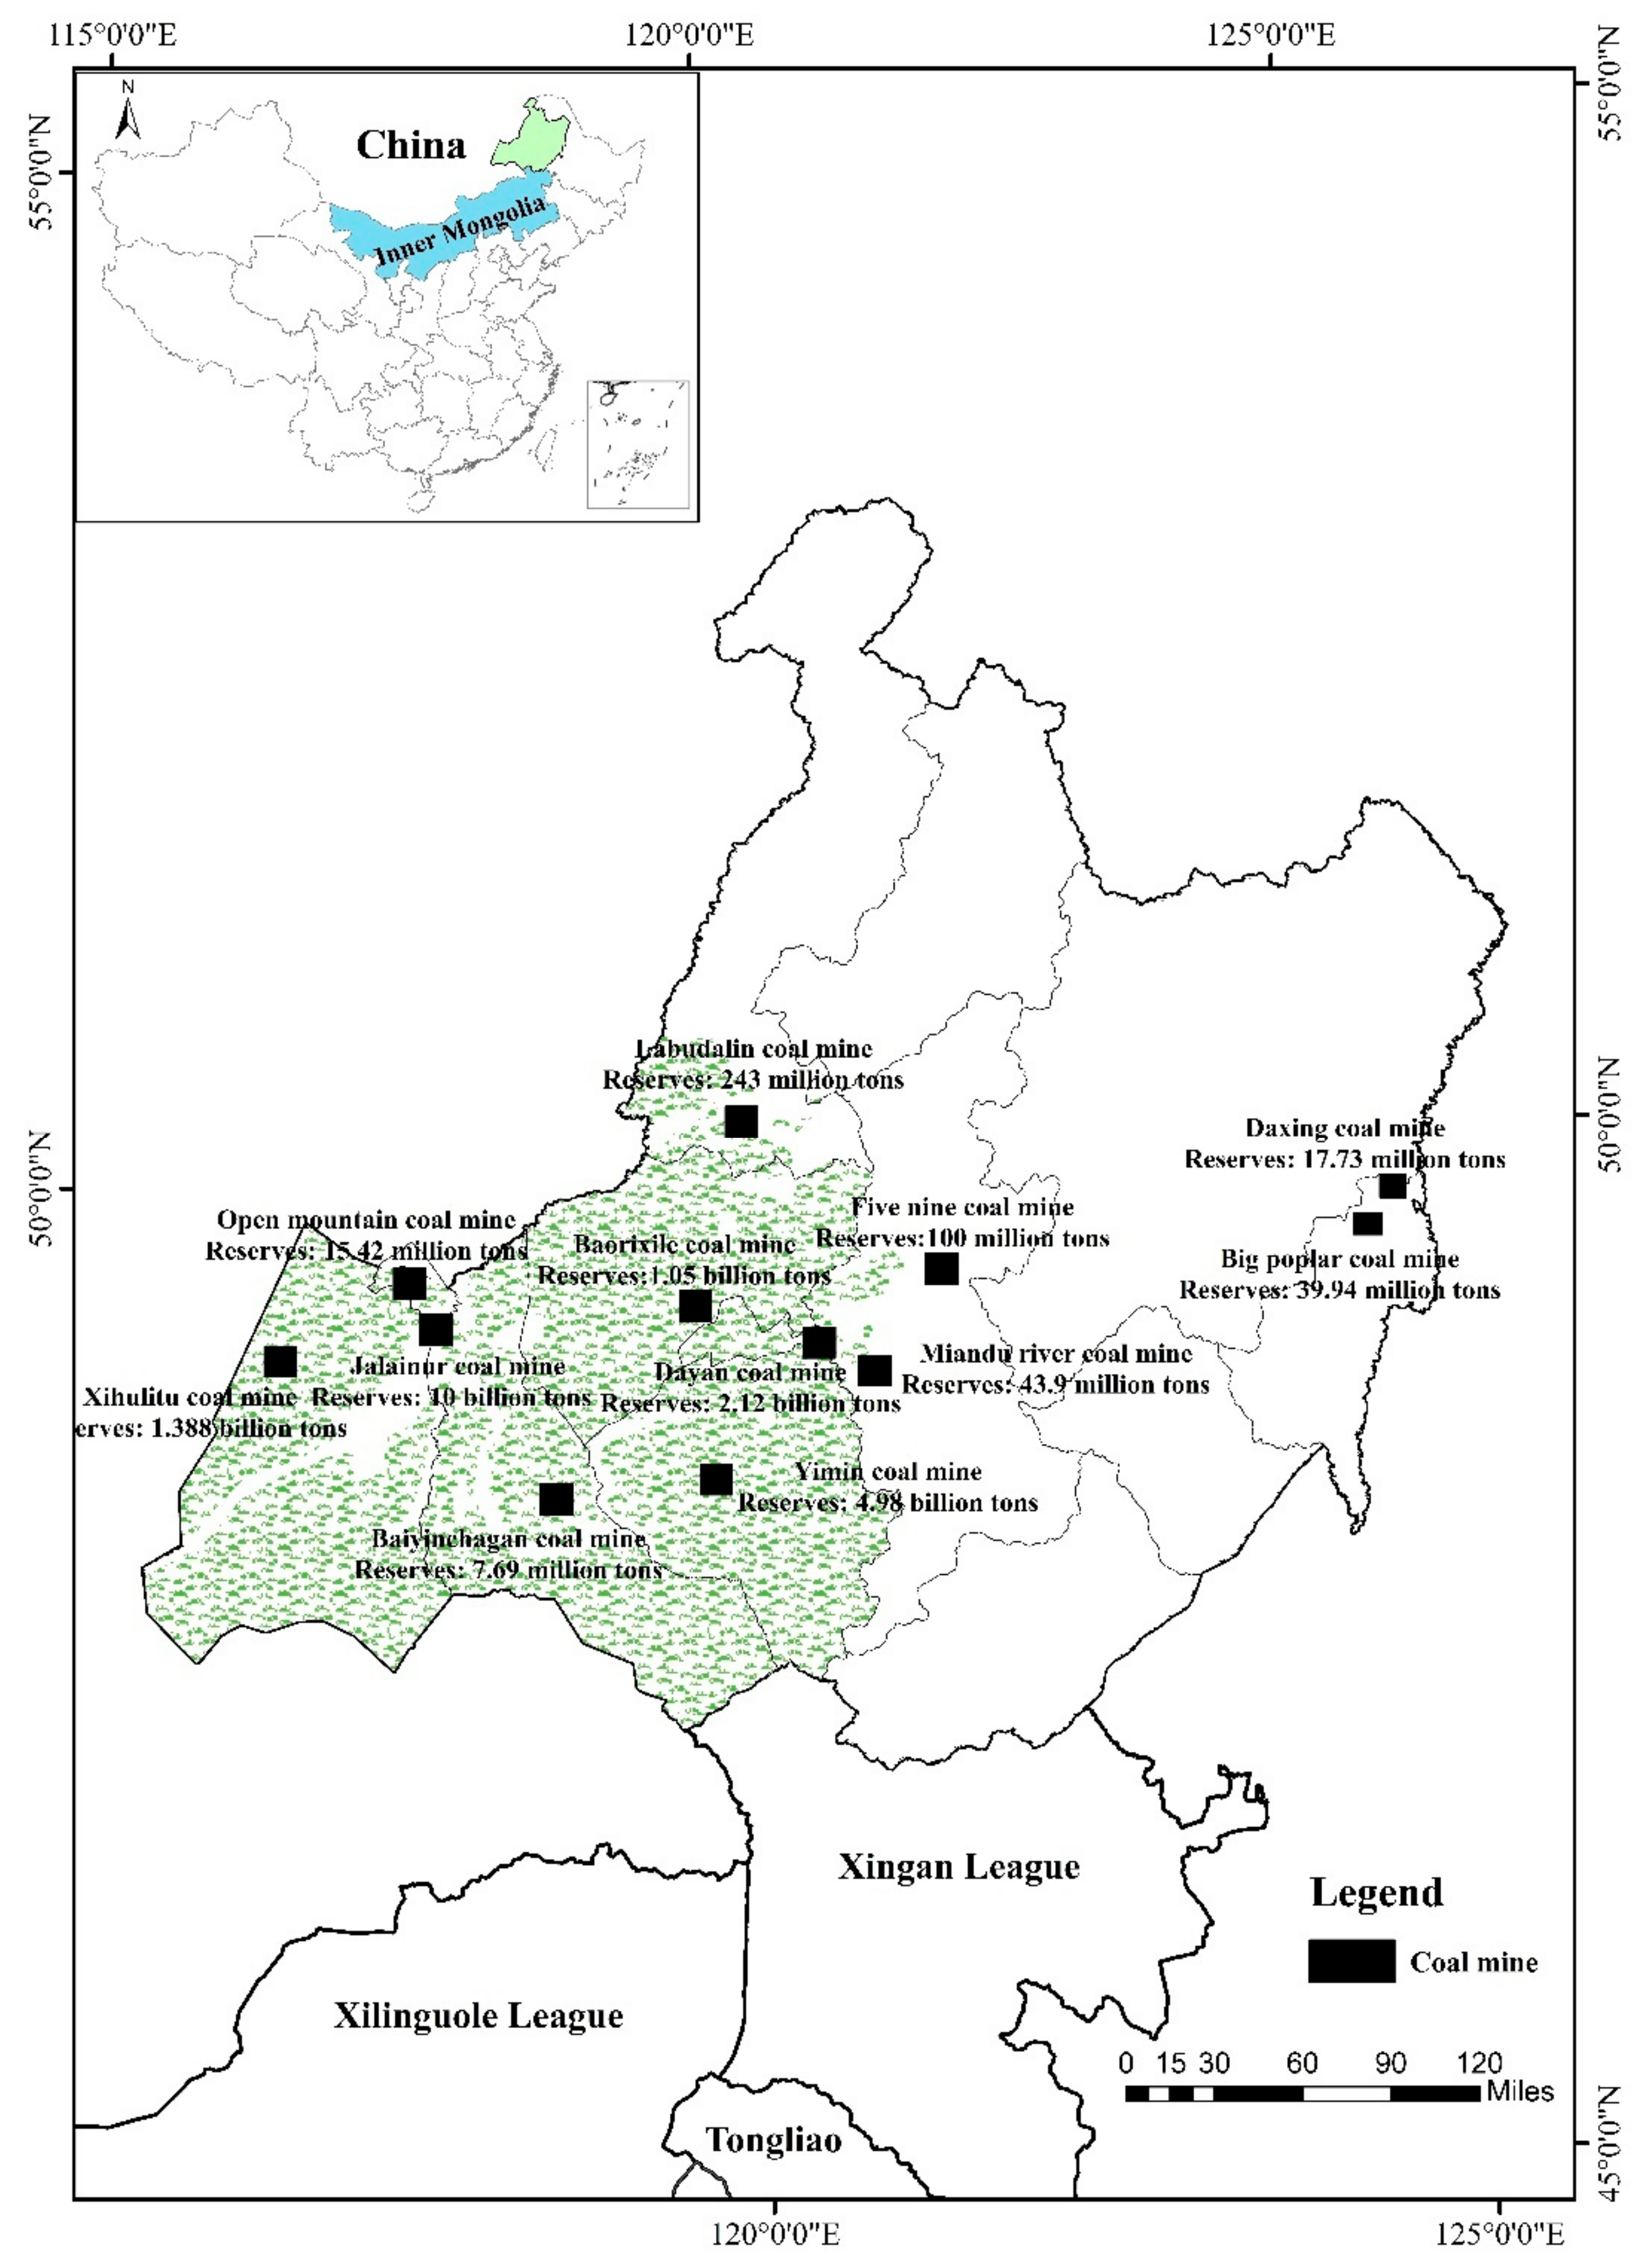
1.1. Study Area
1.2. Sources of Data
2. Methods
2.1. Construction of Ecological Security Evaluation Framework
2.2. Evaluation Model of Ecological Footprint
2.3. Evaluation Model of Ecological Security
2.3.1. Ecological Deficit/Surplus
2.3.2. Ecological Pressure Index
2.3.3. Ecological Coordination Coefficient and Ecological Footprint Diversity Index
2.4. The STIRPAT Modelling Approach
3. Results and Discussion
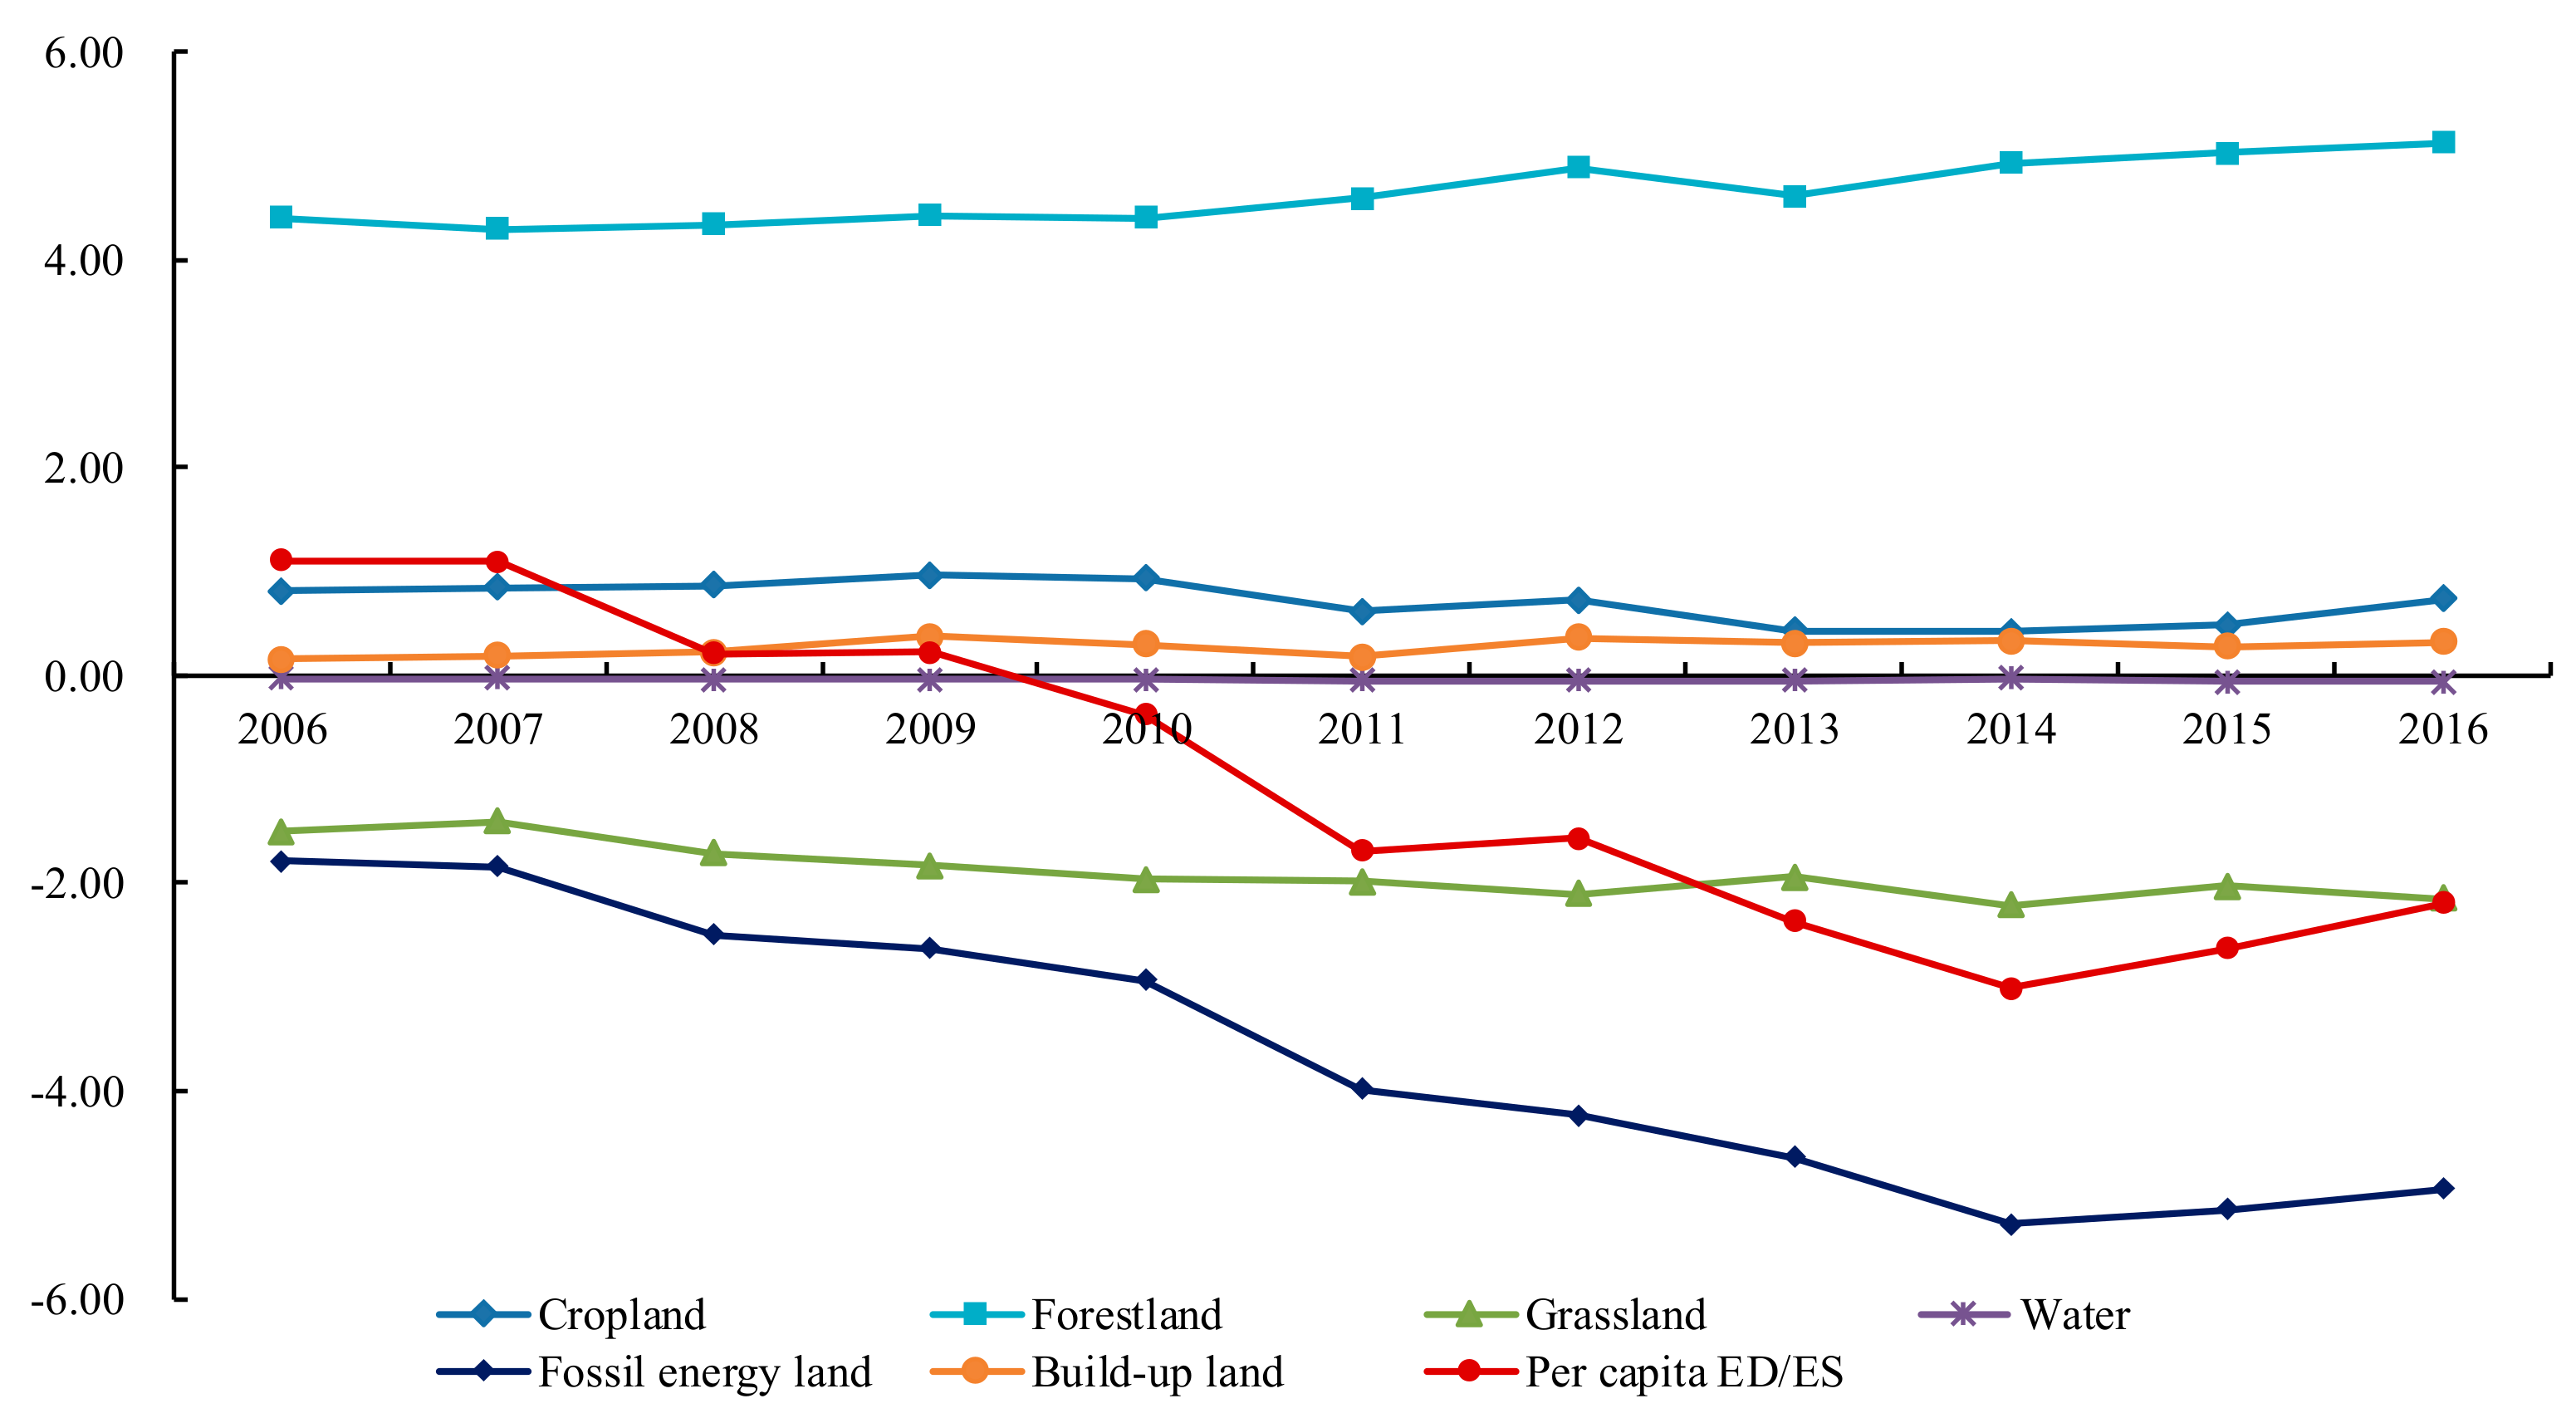
3.1. Evaluation Results of Ecological Footprint and Ecological Capacity
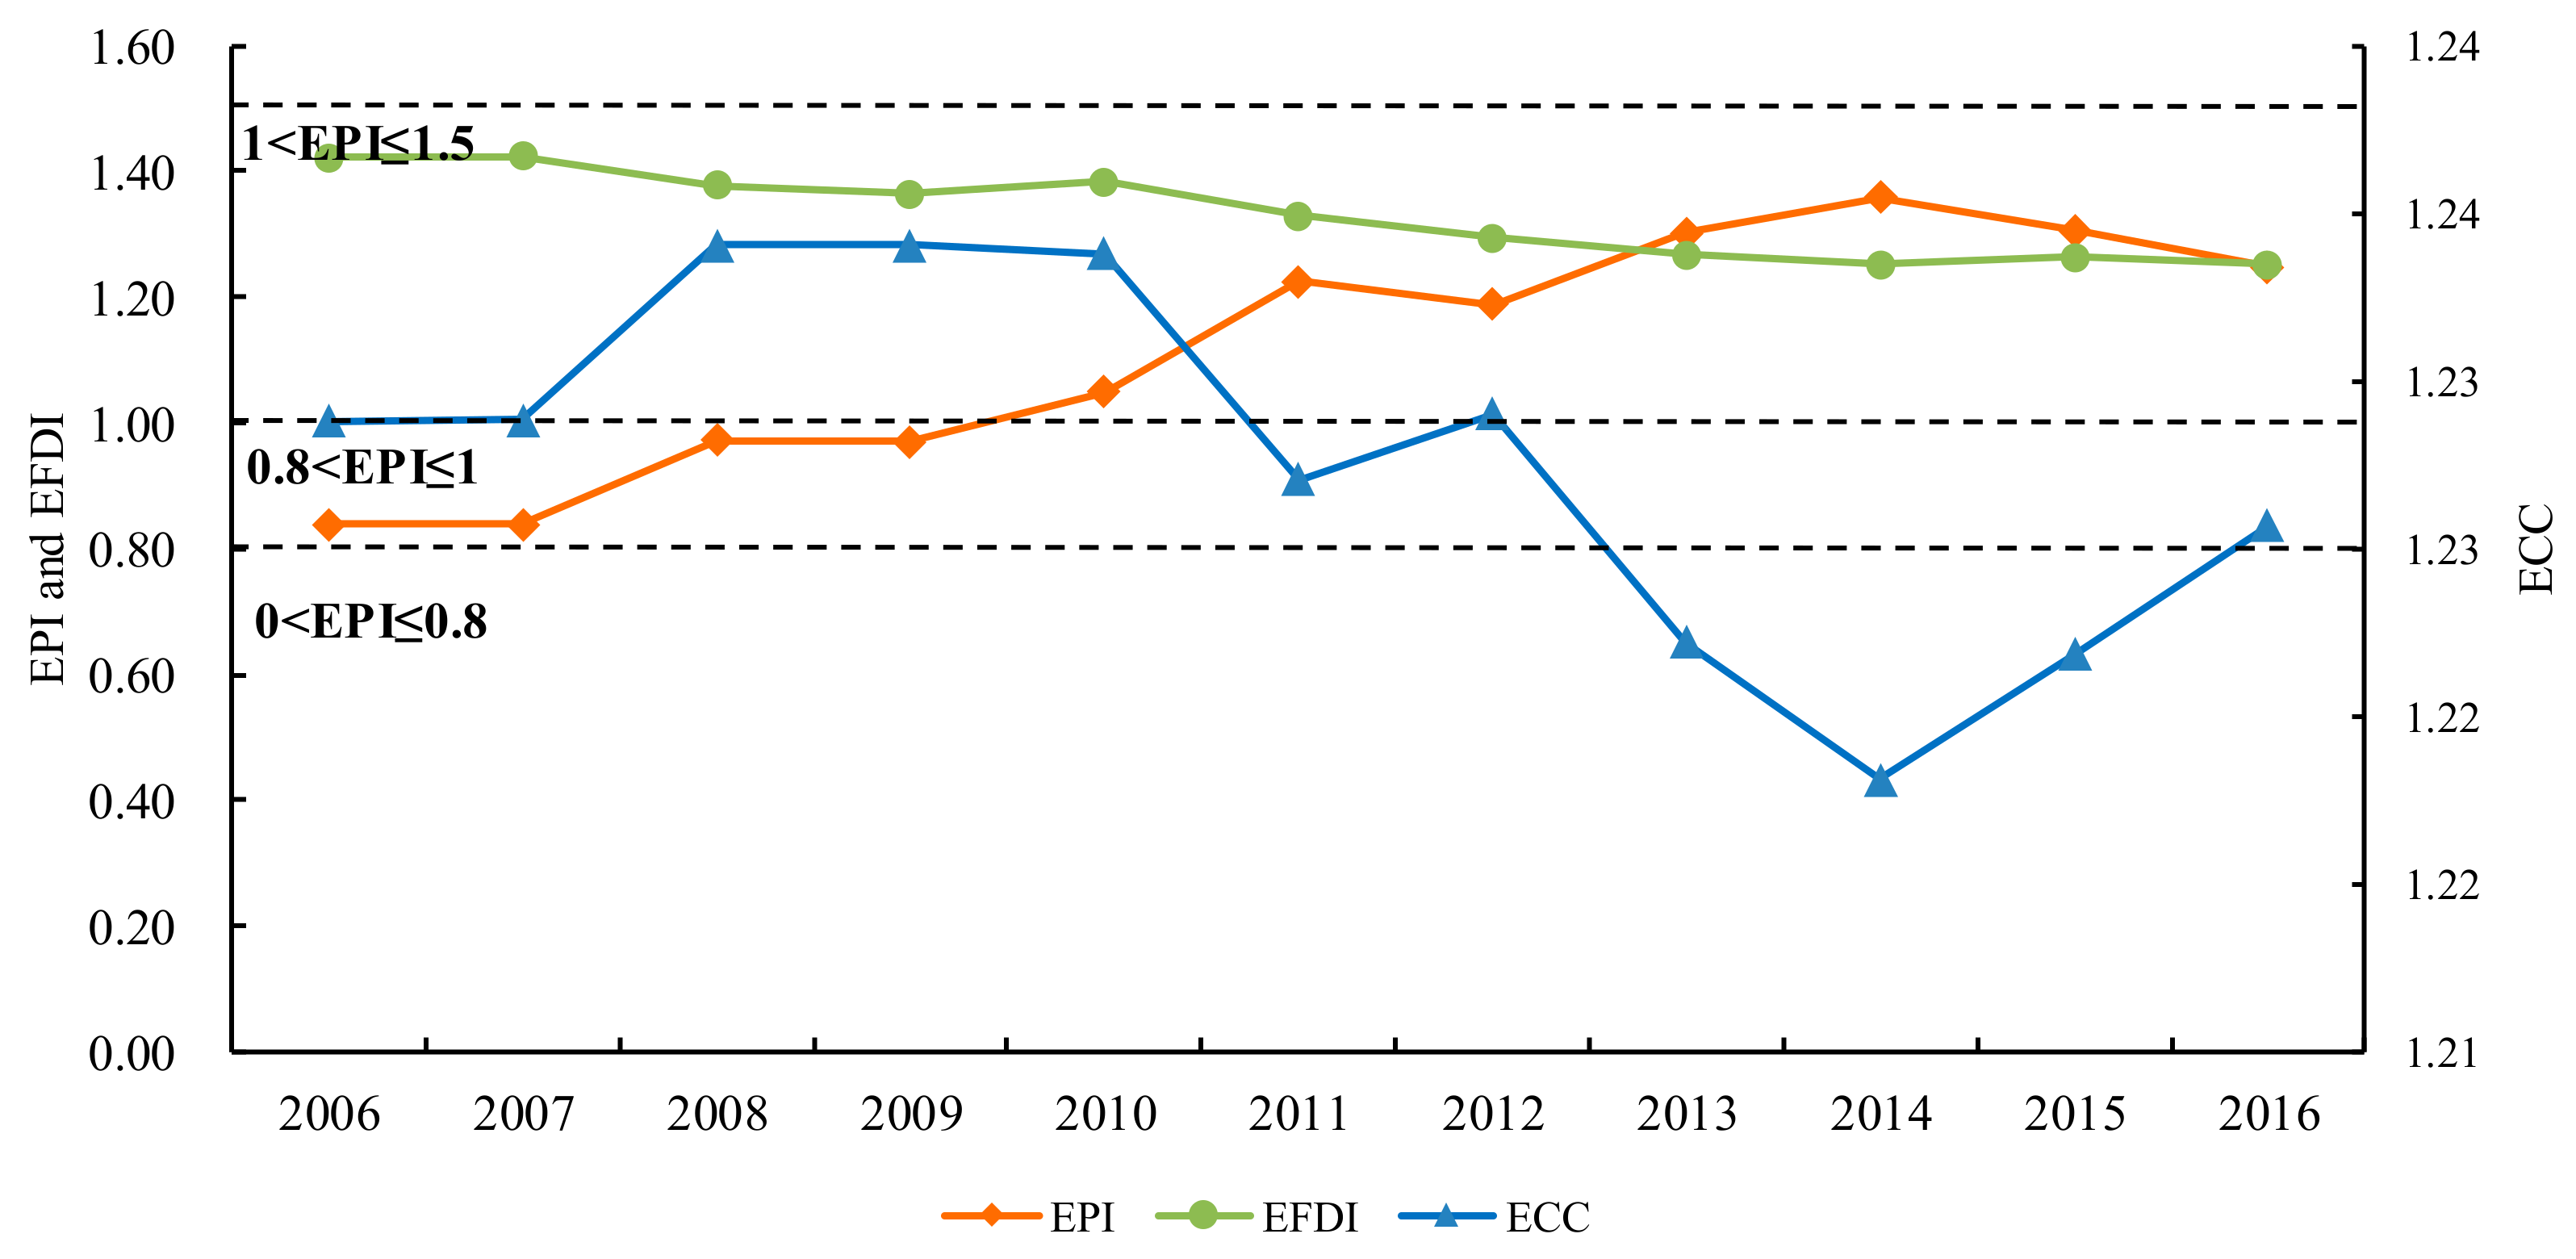
3.2. Evaluation Results of Ecological Security
3.3. Identification of Driving Factors of Ecological Footprint
4. Conclusions
Author Contributions
Funding
Conflicts of Interest
References
- Pang, Y.S.; Wang, L. A Review of Regional Ecological Security Evaluation. China Popul. Resour. Environ. 2014, 24, 337–344. [Google Scholar] [CrossRef]
- Teixidó-Figueras, J.; Duro, J.A. The building blocks of International Ecological Footprint inequality: A Regression-Based Decomposition. Ecol. Econ. 2015, 118, 30–39. [Google Scholar] [CrossRef]
- Kuosmanen, T.K. Measurement and Analysis of Eco-efficiency. An economist’s Perspective. J. Ind. Ecol. 2010, 9, 15–18. [Google Scholar] [CrossRef]
- Wang, Z.; Yang, L.; Yin, J.; Zhang, B. Assessment and prediction of environmental sustainability in China based on a modified ecological footprint model. Resour. Conserv. Recycl. 2018, 132, 301–313. [Google Scholar] [CrossRef]
- Nakajima, E.S.; Ortega, E. Carrying capacity using emergy and a new calculation of the ecological footprint. Ecol. Indic. 2016, 60, 1200–1207. [Google Scholar] [CrossRef]
- Peng, W.; Wang, X.; Li, X.; He, C. Sustainability evaluation based on the emergy ecological footprint method: A case study of Qingdao, China, from 2004 to 2014. Ecol. Indic. 2018, 85, 1249–1261. [Google Scholar] [CrossRef]
- Liu, D.; Chang, Q. Ecological security research progress in China. Acta Ecol. Sin. 2015, 35, 111–121. [Google Scholar] [CrossRef]
- Li, X.; Tian, M.; Wang, H.; Wang, H.; Yu, J. Development of an ecological security evaluation method based on the ecological footprint and application to a typical steppe region in China. Ecol. Indic. 2014, 39, 153–159. [Google Scholar] [CrossRef]
- He, G.; Yu, B.; Li, S.; Zhu, Y. Comprehensive evaluation of ecological security in mining area based on PSR-ANP-GRAY. Environ. Technol. 2018, 39, 3013–3019. [Google Scholar] [CrossRef]
- Aspinall, R.; Pearson, D. Integrated geographical assessment of environmental condition in water catchments: Linking landscape ecology, environmental modelling and GIS. J. Environ. Manag. 2000, 59, 299–319. [Google Scholar] [CrossRef]
- Kuchma, T.; Tarariko, O.; Syrotenko, O. Landscape Diversity Indexes Application for Agricultural Land Use Optimization. Procedia Technol. 2013, 8, 566–569. [Google Scholar] [CrossRef]
- Huang, C.; Vause, J.; Ma, H.; Yu, C. Using material/substance flow analysis to support sustainable development assessment: A literature review and outlook. Resour. Conserv. Recycl. 2012, 68, 104–116. [Google Scholar] [CrossRef]
- Chen, P.; Crawford-Brown, D.; Chang, C.; Ma, H. Identifying the drivers of environmental risk through a model integrating substance flow and input–output analysis. Ecol. Econ. 2014, 107, 94–103. [Google Scholar] [CrossRef]
- Huang, Z.; Wang, F.; Cao, W. Dynamic analysis of an ecological security pattern relying on the relationship between ecosystem service supply and demand: A case study on the Xiamen-Zhangzhou-Quanzhou city cluster. Acta Ecol. Sin. 2018, 38, 4327–4340. [Google Scholar] [CrossRef]
- Ren, Z.; Liu, Y. Exploring the Regional Ecological Security Evaluation Methods Based on Values: A Case Study in the Energy Region of Northern Shaanxi. Geogr. Res. 2013, 32, 5–15. [Google Scholar]
- Yang, Q.; Liu, G.; Hao, Y.; Coscieme, L.; Zhang, J.; Jiang, N.; Casazza, M.; Giannetti, B.F. Quantitative analysis of the dynamic changes of ecological security in the provinces of China through emergy-ecological footprint hybrid indicators. J. Clean. Prod. 2018, 184, 678–695. [Google Scholar] [CrossRef]
- Chu, X.; Deng, X.; Jin, G.; Wang, Z.; Li, Z. Ecological security assessment based on ecological footprint approach in Beijing-Tianjin-Hebei region, China. Phys. Chem. Earth 2017, 101, 43–51. [Google Scholar] [CrossRef]
- Wackernagel, M.; Schulz, N.B.; Deumling, D.; Linares, A.C.; Jenkins, M.; Kapos, V.; Monfreda, C.; Loh, J.; Myers, N.; Norgaard, R.; et al. Tracking the ecological overshoot of the human economy. Proc. Natl. Acad. Sci. USA 2002, 99, 9266–9271. [Google Scholar] [CrossRef]
- Li, J.; Chen, Y.; Xu, C.; Li, Z. Evaluation and analysis of ecological security in arid areas of Central Asia based on the emergy ecological footprint (EEF) model. J. Clean. Prod. 2019, 235, 664–677. [Google Scholar] [CrossRef]
- Wackernagel, M.; Onisto, L.; Bello, P.; Callejas Linares, A.; Susana López Falfán, I.; Méndez García, J.; Isabel Suárez Guerrero, A.; Guadalupe Suárez Guerrero, M. National natural capital accounting with the ecological footprint concept. Ecol. Econ. 1999, 29, 375–390. [Google Scholar] [CrossRef]
- Niccolucci, V.; Tiezzi, E.; Pulselli, F.M.; Capineri, C. Biocapacity vs Ecological Footprint of world regions: A geopolitical interpretation. Ecol. Indic. 2012, 16, 23–30. [Google Scholar] [CrossRef]
- Dong, H.; Li, P.; Feng, Z.; Yang, Y.; You, Z.; Li, Q. Natural capital utilization on an international tourism island based on a three-dimensional ecological footprint model: A case study of Hainan Province, China. Ecol. Indic. 2019, 104, 479–488. [Google Scholar] [CrossRef]
- Pan, H.; Zhuang, M.; Geng, Y.; Wu, F.; Dong, H. Emergy-based ecological footprint analysis for a mega-city: The dynamic changes of Shanghai. J. Clean. Prod. 2019, 210, 552–562. [Google Scholar] [CrossRef]
- Zhao, Y.; Zou, X.; Cheng, H.; Jia, H.; Wu, Y.; Wang, G.; Zhang, C.; Gao, S. Assessing the ecological security of the Tibetan plateau: Methodology and a case study for Lhaze County. J. Environ. Manag. 2006, 80, 120–131. [Google Scholar] [CrossRef] [PubMed]
- Bargaoui, A.S.; Liouane, N.; Nouri, F.Z. Environmental Impact Determinants: An Empirical Analysis based on the STIRPAT Model. Procedia Soc. Behav. Sci. 2014, 109, 449–458. [Google Scholar] [CrossRef]
- Yang, Y.; Hu, D. Natural capital utilization based on a three-dimensional ecological footprint model: A case study in northern Shaanxi, China. Ecol. Indic. 2018, 87, 178–188. [Google Scholar] [CrossRef]
- Xie, P.; Gao, S.; Sun, F. An analysis of the decoupling relationship between CO2 emission in power industry and GDP in China based on LMDI method. J. Clean. Prod. 2019, 211, 598–606. [Google Scholar] [CrossRef]
- York, R.; Rosa, E.A.; Dietz, T. STIRPAT, IPAT and ImPACT: Analytic tools for unpacking the driving forces of environmental impacts. Ecol. Econ. 2003, 46, 351–365. [Google Scholar] [CrossRef]
- Giampietro, M.; Saltelli, A. Footworking in circles: Reply to Goldfinger et al. (2014) “Footprint Facts and Fallacies: A Response to Giampietro and Saltelli (2014) Footprints to nowhere”. Ecol. Indic. 2014, 46, 260–263. [Google Scholar] [CrossRef]
- Bai, Y.; Deng, X.; Zhang, Q.; Wang, Z. Measuring environmental performance of industrial sub-sectors in China: A stochastic metafrontier approach. Phys. Chem. Earth Parts A/B/C 2017, 101, 3–12. [Google Scholar] [CrossRef]
- Sun, Y.; Yang, Y.; Zhang, Y.; Wang, Z. Assessing vegetation dynamics and their relationships with climatic variability in northern China. Phys. Chem. Earth Parts A/B/C 2015, 87, 79–86. [Google Scholar] [CrossRef]
- Zhang, Y.; Wang, Q.; Wang, Z.; Yang, Y.; Li, J. Impact of human activities and climate change on the grassland dynamics under different regime policies in the Mongolian Plateau. Sci. Total Environ. 2020, 698, 134304. [Google Scholar] [CrossRef] [PubMed]
- Ulucak, R.; Lin, D. Persistence of policy shocks to Ecological Footprint of the USA. Ecol. Indic. 2017, 80, 337–343. [Google Scholar] [CrossRef]
- China Electricity Council. Eight Mining Areas in Inner Mongolia have been Included in the State Plan of Coal Mining Areas. Available online: http://www.cec.org.cn/xiangguanhangye/2010-11-27/8907.html (accessed on 11 November 2019).
- Yang, C.M. Legal Research on Mineral Resources Exploitation and Ecological Environment Protection in Hulunbuir Grassland Area. J. Hulunbeir Univ. 2016, 24, 36–39. [Google Scholar] [CrossRef]
- Ma, Y.; Ju, X. Geological environment problems and prevention measures of mines in Hulunbeir city. Opencast Min. Technol. 2012, 85–88. [Google Scholar] [CrossRef]
- Chang, L. Research on the Prediction Model of Hulunbeir Grassland Degradation. Master’s Thesis, Northeast Forestry University, Harbin, China, 2014. [Google Scholar]
- Liu, M.C.; Li, W.H. The Calculation of China′s Equivalence Factor under Ecological Footprint Mode Based on Net Primary Production. J. Nat. Resour. 2009, 24, 1550–1559. [Google Scholar]
- Wackernagel, M.; Monfreda, C.; Schulz, N.B.; Erb, K.; Haberl, H.; Krausmann, F. Calculating national and global ecological footprint time series: Resolving conceptual challenges. Land Use Policy 2004, 21, 271–278. [Google Scholar] [CrossRef]
- Ren, J.J. Quantitative Analysis of Sustainability Development of Inner Mongolia Based on Ecological Footprint Model. Master’s Thesis, Inner Mongolia University, Hohhot, China, 2012. [Google Scholar]
- Sheng, Z.; Wu, C.; Hong, H.; Zhang, L. Linking the concept of ecological footprint and valuation of ecosystem services: A case study of economic growth and natural carrying capacity. Int. J. Sust. Dev. World 2009, 16, 137–142. [Google Scholar] [CrossRef]
- Dang, X.; Liu, G.; Xue, S.; Li, P. An ecological footprint and emergy based assessment of an ecological restoration program in the Loess Hilly Region of China. Ecol. Eng. 2013, 61, 258–267. [Google Scholar] [CrossRef]
- Yuan, W.B. Ecological Security Evaluation Based on the Ecological Footprint in Nanning City. Master’s Thesis, Jilin University, Changchun, China, 2010. [Google Scholar]
- Shannon, C.E.; Weaver, W. The Mathematical Theory of Communication Urbana; University of Illinois Press: Urbana, IL, USA, 1950. [Google Scholar]
- Ehrlich, P.R.; Holdren, J.P. Impact of Population Growth. Science 1971, 171, 1212–1217. [Google Scholar] [CrossRef]
- Dietz, T.; Rosa, E.A. Effects of population and affluence on CO2 emissions. Proc. Natl. Acad. Sci. USA 1997, 94, 175–179. [Google Scholar] [CrossRef] [PubMed]
- Chai, J.; Liang, T.; Lai, K.K.; Zhang, Z.G.; Wang, S. The future natural gas consumption in China: Based on the LMDI-STIRPAT-PLSR framework and scenario analysis. Energy Policy 2018, 119, 215–225. [Google Scholar] [CrossRef]
- Hu, M.J.; Zhou, N.; Li, Z.; Qi, X. Calculation and driving factor analysis of three-dimensional ecological footprint in Nanjing city. Geogr. Geo Inf. Sci. 2015, 31, 91–95. [Google Scholar] [CrossRef]
- Wen, L.; Shao, H. Influencing factors of the carbon dioxide emissions in China′s commercial department: A non-parametric additive regression model. Sci. Total Environ. 2019, 668, 1–12. [Google Scholar] [CrossRef]
- Zheng, D.; Liu, X.; Wang, Y.; Lv, L. Spatiotemporal evolution and driving forces of natural capital utilization in China based on three-dimensional ecological footprint. Prog. Geogr. 2018, 37, 1328–1339. [Google Scholar] [CrossRef][Green Version]
- Yang, Y.; Hu, D. Dynamic changes and driving factors of three dimensional ecological footprint in Yulin. J. Nat. Resour. 2018, 33, 1204–1217. [Google Scholar] [CrossRef][Green Version]
- Yang, C.; Zhu, Y. Analysis on Driving Force Factors of Ecological Footprint in Hunan Province from the Perspective of Green Development. Econ. Geogr. 2019, 14, 1–15. [Google Scholar]


| Items | Indicators | Data Sources |
|---|---|---|
| Biological account | Agricultural products: wheat, corn, rice, sorghum, potato, oil crop, vegetables, beans, wine, sugar, pork and eggs Forest products: fruits and wood Grass products: beef, lamb, poultry, milk, dairy products, sheep wool, goat wool, cashmere Aquatic products: freshwater | «Hulunbeir Statistical Yearbook» (2007–2017) |
| Energy account | The consumption of raw coal, crude oil, coke, gasoline, kerosene, diesel oil, fuel oil, electricity, heat | «Hulunbeir Statistical Yearbook» (2007–2017) |
| Land use | Land use area | Land Resources Data of the Ministry of Natural Resources (2006–2016) and «Hulunbeir Statistical Yearbook» (2007–2017) |
| Equivalence factor | cropland (2.8), grassland (0.5), forest land (1.1), water (0.2), fossil energy land (1.1), build-up land (2.8) | «Calculation of China’s equivalence factor under ecological footprint mode based on net primary production» [38] |
| Yield factor | cropland (1.7), grassland (0.19), forestland (0.91), water (1), fossil energy land (0), build-up land (1.7) | «Calculating national and global ecological footprint time series: resolving conceptual challenges» [39] «Quantitative analysis of sustainability development of inner Mongolia» [40] |
| Population, economy, and technology | Population: year-end resident population, urbanization rate Economy: per capita GDP, proportion of secondary industry output value Technology: unit GDP energy consumption | «Hulunbeir Statistical Yearbook» (2007–2017) «Inner Mongolia statistical yearbook» (2007–2017) National economy and society developed statistical bulletin in Hulunbeir (2006–2016) |
| Ecological Security Grade | Range of EPI | Characterization State | Ecological Security Alarm Level |
|---|---|---|---|
| 1 | <0.5 | Pretty safe | No alarm |
| 2 | 0.50–0.80 | Safe | |
| 3 | 0.81–1.00 | Moderately safe | Low alarm |
| 4 | 1.01–1.50 | Moderately risky | Moderate alarm |
| 5 | 1.51–2.00 | Risky | High alarm |
| 6 | >2 | Very risky | Severe alarm |
| Year | Cropland | Forestland | Grassland | Water | Fossil Energy Land | Build-Up Land | ef | EF (ha) |
|---|---|---|---|---|---|---|---|---|
| 2006 | 1.33 | 0.64 | 1.80 | 0.07 | 1.79 | 0.07 | 5.71 | 1.51 × 10⁷ |
| 2007 | 1.27 | 0.69 | 1.75 | 0.07 | 1.85 | 0.06 | 5.69 | 1.55 × 10⁷ |
| 2008 | 1.63 | 0.64 | 2.00 | 0.07 | 2.50 | 0.06 | 6.90 | 1.88 × 10⁷ |
| 2009 | 1.87 | 0.67 | 2.12 | 0.08 | 2.63 | 0.04 | 7.39 | 2.01 × 10⁷ |
| 2010 | 2.24 | 0.55 | 2.24 | 0.08 | 2.94 | 0.17 | 8.22 | 2.23 × 10⁷ |
| 2011 | 2.27 | 0.39 | 2.27 | 0.09 | 3.99 | 0.26 | 9.26 | 2.50 × 10⁷ |
| 2012 | 2.65 | 0.42 | 2.41 | 0.09 | 4.23 | 0.13 | 9.93 | 2.52 × 10⁷ |
| 2013 | 2.72 | 0.37 | 2.23 | 0.09 | 4.64 | 0.15 | 10.21 | 2.75 × 10⁷ |
| 2014 | 2.99 | 0.39 | 2.51 | 0.08 | 5.29 | 0.18 | 11.43 | 2.89 × 10⁷ |
| 2015 | 3.10 | 0.30 | 2.33 | 0.10 | 5.14 | 0.25 | 11.23 | 2.84 × 10⁷ |
| 2016 | 3.09 | 0.19 | 2.45 | 0.10 | 4.95 | 0.26 | 11.04 | 2.79 × 10⁷ |
| Year | Cropland | Forestland | Grassland | Water | Build-Up Land | Biodiversity Conservation Area | ec | Total EC (ha) |
|---|---|---|---|---|---|---|---|---|
| 2006 | 2.15 | 5.04 | 0.30 | 0.03 | 0.22 | 0.93 | 6.81 | 1.84 × 10⁷ |
| 2007 | 2.11 | 4.98 | 0.35 | 0.04 | 0.25 | 0.93 | 6.79 | 1.85 × 10⁷ |
| 2008 | 2.50 | 4.97 | 0.29 | 0.04 | 0.27 | 0.97 | 7.10 | 1.94 × 10⁷ |
| 2009 | 2.84 | 5.09 | 0.28 | 0.04 | 0.41 | 1.04 | 7.62 | 2.07 × 10⁷ |
| 2010 | 3.17 | 4.95 | 0.28 | 0.04 | 0.47 | 1.07 | 7.84 | 2.13 × 10⁷ |
| 2011 | 2.88 | 4.97 | 0.28 | 0.04 | 0.43 | 1.03 | 7.56 | 2.05 × 10⁷ |
| 2012 | 3.37 | 5.30 | 0.30 | 0.04 | 0.49 | 1.14 | 8.36 | 2.12 × 10⁷ |
| 2013 | 3.15 | 4.98 | 0.28 | 0.04 | 0.46 | 1.07 | 7.84 | 2.11 × 10⁷ |
| 2014 | 3.41 | 5.31 | 0.30 | 0.04 | 0.50 | 1.15 | 8.41 | 2.13 × 10⁷ |
| 2015 | 3.58 | 5.32 | 0.30 | 0.04 | 0.53 | 1.17 | 8.59 | 2.17 × 10⁷ |
| 2016 | 3.83 | 5.31 | 0.30 | 0.04 | 0.57 | 1.21 | 8.85 | 2.24 × 10⁷ |
| Year | Ecological Pressure Index | Ecological Security Grade | Characterization State | Ecological Security Alarm Level |
|---|---|---|---|---|
| 2006 | 0.83 | 3 | Moderately safe | Low alarm |
| 2007 | 0.84 | Moderately safe | ||
| 2008 | 0.97 | Moderately safe | ||
| 2009 | 0.97 | Moderately safe | ||
| 2010 | 1.05 | 4 | Moderately risky | Moderate alarm |
| 2011 | 1.22 | Moderately risky | ||
| 2012 | 1.19 | Moderately risky | ||
| 2013 | 1.30 | Moderately risky | ||
| 2014 | 1.36 | Moderately risky | ||
| 2015 | 1.31 | Moderately risky | ||
| 2016 | 1.25 | Moderately risky |
| Index | A | T | P | U | C |
|---|---|---|---|---|---|
| A- per capita GDP | 1 | 0.905 ** | −0.811 ** | 0.816 ** | −988 ** |
| Significance test | 0.000 | 0.002 | 0.002 | 0.000 | |
| T-proportion of the second industry | 0.905 ** | 1 | −587 | 0.561 | −0.882 ** |
| Significance test | 0.000 | 0.057 | 0.072 | 0.000 | |
| P- year-end resident population | −0.811 ** | 0.587 | 1 | −0.955 ** | 0.800 ** |
| Significance test | 0.002 | 0.057 | 0.000 | 0.003 | |
| U- urbanization rate | 0.816 ** | 0.561 | −0.955 ** | 1 | −0.814 ** |
| Significance test | 0.002 | 0.072 | 0.000 | 0.002 | |
| C- unit GDP energy consumption | −0.988 ** | 0.882 ** | 0.800 ** | −0.814 ** | 1 |
| Significance test | 0.000 | 0.000 | 0.003 | 0.002 |
| Component | Initial Eigenvalues | Extraction Sums of Squared Loadings | Rotate Sums of Squared Loadings | ||||||
|---|---|---|---|---|---|---|---|---|---|
| Total | % of Variance | Cumulative% | Total | % of Variance | Cumulative% | Total | % of Variance | Cumulative% | |
| F1 | 4.199 | 83.979 | 83.979 | 4.199 | 83.979 | 83.979 | 2.445 | 48.908 | 48.908 |
| F2 | 0.668 | 13.354 | 97.332 | 0.668 | 13.354 | 97.332 | 2.421 | 48.425 | 97.332 |
| Category | Rotational Component Matrix | Principal Component Score Coefficient Matrix | ||
|---|---|---|---|---|
| Indicator | Component | Component | ||
| F1 | F2 | F1 | F2 | |
| LnA | 0.481 | 0.874 | −0.135 | 0.459 |
| LnT | 0.253 | 0.957 | −0.384 | 0.675 |
| LnP | −0.923 | −0.339 | 0.584 | −0.286 |
| LnU | 0.929 | 0.344 | 0.585 | −0.284 |
| LnC | −0.660 | −0.713 | −0.121 | −0.206 |
| Component | Unstandardized Coefficients | Sig | |
|---|---|---|---|
| B | Std. Error | ||
| F1 | 0.795 | 0.477 | 0.134 |
| F2 | 1.160 | 0.091 | 0.000 |
| R2 | 0.976 | ||
| Adjusted R2 | 0.970 | ||
| F-statistic | 160.668 | ||
| Sig. | 0.000 | ||
© 2019 by the authors. Licensee MDPI, Basel, Switzerland. This article is an open access article distributed under the terms and conditions of the Creative Commons Attribution (CC BY) license (http://creativecommons.org/licenses/by/4.0/).
Share and Cite
Guo, S.; Wang, Y. Ecological Security Assessment Based on Ecological Footprint Approach in Hulunbeir Grassland, China. Int. J. Environ. Res. Public Health 2019, 16, 4805. https://doi.org/10.3390/ijerph16234805
Guo S, Wang Y. Ecological Security Assessment Based on Ecological Footprint Approach in Hulunbeir Grassland, China. International Journal of Environmental Research and Public Health. 2019; 16(23):4805. https://doi.org/10.3390/ijerph16234805
Chicago/Turabian StyleGuo, Shanshan, and Yinghong Wang. 2019. "Ecological Security Assessment Based on Ecological Footprint Approach in Hulunbeir Grassland, China" International Journal of Environmental Research and Public Health 16, no. 23: 4805. https://doi.org/10.3390/ijerph16234805
APA StyleGuo, S., & Wang, Y. (2019). Ecological Security Assessment Based on Ecological Footprint Approach in Hulunbeir Grassland, China. International Journal of Environmental Research and Public Health, 16(23), 4805. https://doi.org/10.3390/ijerph16234805