Article

Assessing Agricultural Livelihood Vulnerability to Climate Change in Coastal Bangladesh

1
Key Laboratory of Urban Environment and Health, Institute of Urban Environment, Chinese Academy of Sciences, Xiamen 361021, China
2
International School, University of Chinese Academy of Sciences, Beijing 100049, China
3
Xiamen Key Lab of Urban Metabolism, Institute of Urban Environment, Chinese Academy of Sciences, Xiamen 361021, China
4
Department of Agricultural Extension and Rural Development, Bangabandhu Sheikh Mujibur Rahman Agricultural University, Gazipur 1706, Bangladesh
*
Authors to whom correspondence should be addressed.
Int. J. Environ. Res. Public Health 2019, 16(22), 4552; https://doi.org/10.3390/ijerph16224552
Submission received: 12 October 2019 / Revised: 5 November 2019 / Accepted: 12 November 2019 / Published: 18 November 2019

Abstract

:
The adverse impacts of climate change exert mounting pressure on agriculture-dependent livelihoods of many developing and developed nations. However, integrated and spatially specific vulnerability assessments in less-developed countries like Bangladesh are rare, and insufficient to support the decision-making needed for climate-change resilience. Here, we develop an agricultural livelihood vulnerability index (ALVI) and an integrated approach, allowing for (i) mapping out the hot spots of vulnerability distribution; (ii) identifying key factors of spatially heterogeneous vulnerability; and (iii) supporting intervention planning for adaptation. This study conceptualized vulnerability as a function of exposure, sensitivity, and adaptive capacity by developing a composite index from a reliable dataset of 64 indicators comprising biophysical, agro-ecological, and socioeconomic variables. The empirical studies of coastal Bangladesh revealed that Bhola, Patuakhali, and Lakshmipur districts, around the mouth of the deltaic Meghna estuaries, are the hot spot of vulnerability distribution. Furthermore, the spatially heterogeneous vulnerability was triggered by spatial variation of erosion, cyclones, drought, rain-fed agriculture, land degradation, soil phosphorus, crop productivity, sanitation and housing condition, infant mortality, emergency shelters, adoption of agro-technology. The integrated approach could be useful for monitoring and evaluating the effectiveness of adaptation intervention by substituting various hypothetical scenarios into the ALVI framework for baseline comparison.

1. Introduction

Agriculture is the primary means of livelihood for 2.5 billion people in the world [1] and contributes 26% of GDP (gross domestic production) in the economy of many low-income developing countries [2]. However, climate change is a global driver adversely affecting the sustainability of the agricultural production system through increased variability in temperature and rainfall, and the frequency and intensity of extreme weather events. The effects are expected to be many-fold: such as altering crop pest infestation and disease outbreaks; crop failure; yield reduction; loss of fish biodiversity; and higher livestock mortality [3,4].
The coastal zones encompass only 2% of the earth’s surface but accommodate over 10% of the global population [5]. The Intergovernmental Panel on Climate Change (IPCC) has projected that sea-level rise will continue throughout the 21st century and beyond that [6], which in turn will adversely affect the coastal region of the tropical and sub-tropical developing countries because of their over-dependence on natural resource-based livelihoods such as agriculture [6,7]. The agriculture of the deltaic region will be more affected because of land submergence, salinization of soil and fresh groundwater, and losses caused by permanent coastal erosion with consequences of farm production, livelihood diversification, household well-being, and food security [8].
Vulnerability to climate change is driven by biophysical and socio-economic factors that intensify the susceptibility of a community to the impact of climatic stressors [9,10]. Many of the studies focusing on climate change risk and adaptation considered vulnerability assessment, and a majority of them interpreted vulnerability as a pre-existing condition while some others considered as an outcome [11]. Over the decades, the concept of vulnerability has evolved from many research disciplines: human ecology, political ecology, physical science, and spatial analysis [12,13], and these diverse approaches have resulted in different interpretations of the term ‘vulnerability’. However, much of the literature on vulnerability has applied the IPCC definition: “the degree to which a system is susceptible to and unable to cope with, adverse effects of climate change, including climate variability and extremes. The vulnerability is a function of the characters, magnitude, and rate of climate change and variation to which a system is exposed, its sensitivity, and its adaptive capacity” [14]. In general, there are two approaches to measuring vulnerability, i.e., vulnerability variable assessments, and the indicator approach [15]. Currently, indicator-based assessments are one of the most common ways to quantify climate change-led vulnerability [16], but they have faced widespread criticism for not being able to capture the complexity of vulnerable systems [17], and their lack of uniformity, particularly in the process of selecting the indicators, scale of measurement, weighting, variable transformation, and aggregation [18,19,20,21,22]; indeed, this remains a challenging task in constructing a robust vulnerability index [23]. However, there is consensus among the scientific community that indicator-based assessments can serve as a decent starting point for the analysis and discussion of vulnerability [13], especially when visualization techniques are applied [23].
Since agriculture is one of the sectors most vulnerable to climate change, efforts are being attempted to outline and compare different levels of agricultural vulnerability by generating composite indices based on sets of indicators by reflecting multiple dimensions of the vulnerability concept, capturing the exposure, sensitivity, and adaptive capacity of agroecological systems [16]. In fact, numerous studies [15,23,24,25,26,27,28,29] in the literature have been conducted at multiple scales and have covered different sectors of agriculture, including crops, fisheries, forestry, and livestock. The primary focus of these studies was to “help policymakers identify ‘hotspots’ in allocating adaptation resources, communicate climate risks to the public, monitor the effects of adaptation measures, and understand the weakness in the socio-ecological system that leads to vulnerability” [30]. However, most of these studies showed ‘snapshot’ views of agricultural systems’ vulnerability by incorporating some commonly used indicators [23], and little research has focused on agricultural practices in small densely populated countries whose economies are predominantly based on subsistence farming; such countries differ widely from countries with large but low-density populations, where commercial farming prevails and farms are less diversified.
Bangladesh is an agro-economy-based developing country [31] where agricultural livelihoods, particularly in the coastal region, are becoming more vulnerable to increased intensity of climatic variability and extreme weather events (floods, droughts, storm surges and cyclones), along with environmental degradation (salinization, inundation and soil erosion) over different time horizons [8,32]. The coastal communities, in particular, have a high exposure to these stressors [33,34,35,36,37,38]. For example, the last two mega-cyclone events—Sidr and Aila—occurred in 2007 and 2009, causing a large number of human casualties; losses to the economy, agriculture and infrastructure; and imbalances in ecological processes; and ruining the livelihoods of millions of people, eventually instigating mass migration from the southwestern coastal region to other areas of the country [35,38,39]. Meanwhile, about 63% of the cultivable area in the coastal zone is affected by various degrees of soil salinity and predicted that a one-meter rise of sea level will place almost 20% of the land area of Bangladesh under the sea and cause 20–30 million people to be displaced from the coastal zone [36]. The production of oilseed, jute, and sugarcane has already been discontinued as a result of salinization, triggering land-use change towards saline aquacultures like shrimp or rice-shrimp systems that adversely affect the environment [8]. Hence, adapting to an unprecedented rate of climate change is becoming the biggest challenge, prompting an urgent need for broader adaptation options [40] for safeguarding the jeopardized agricultural livelihoods of coastal people and anticipation of even greater climatic variation in the future [34,41,42]. Assessing agricultural livelihood vulnerability to climate change is therefore imperative to formulate and implement targeted adaptation strategies and setting priority areas for investment in the agricultural sector [43].
Studies focusing on vulnerability assessment have so far not been comprehensive or appropriately delineated, especially in the coastal region of Bangladesh. Although a large number of vulnerability studies [27,34,35,38,42,44,45,46,47,48,49,50,51,52,53,54,55] are being conducted, almost none of the previous studies addressed integrated agriculture (i.e., crops, fisheries, and livestock) or took into account the connections between different spatial scales, addressed multiple hazards, or led to the formulation of intervention planning to enhance adaptation capacity. These latter two issues comprise a global research gap [56]. Notably, vulnerability assessment of the farming sector was restricted to a localized small area [46,55] and specialized fields like fisheries [27]. Hence, the agricultural vulnerability in coastal Bangladesh needs to be assessed by capturing fisheries and livestock along with the crop sector because, in reality, the elements of this tri-economy are invariably mutually dependent and most productive agriculture in the Asian region is located around the river—floodplains, swamp, lakes, and other water reservoirs [57]. So these three major farming enterprises deserve to be interconnected [58] to assess climate change vulnerability for a country like Bangladesh, which is driven by an agro-based economy. Furthermore, vulnerability assessment in coastal Bangladesh should be conducted to the administrative unit (district) at which government agencies allocate resources, which is one mechanism to help ensure that output from vulnerability assessments can be integrated into strategic government plans. Such an assessment at the district level could empower decision-makers and other non-governmental bodies to effectively direct the adaptation investment [59].
Therefore, this study aims to (i) develop a framework for assessing agricultural livelihood vulnerability to climate change and apply it to the coastal region of Bangladesh; (ii) map out the hot spots of vulnerability distribution; (iii) identify critical factors of spatially heterogeneous vulnerability; and (iv) support intervention planning for climate change adaptation. The agricultural livelihood vulnerability index (ALVI) model, built upon the integration of socioeconomic, agro-ecological, and biophysical variables (64 in all) in the vulnerability concept is a novel approach because it adds some new robust indicators such as a salinity severity index, arsenic problems, and the use of different agro-technologies.

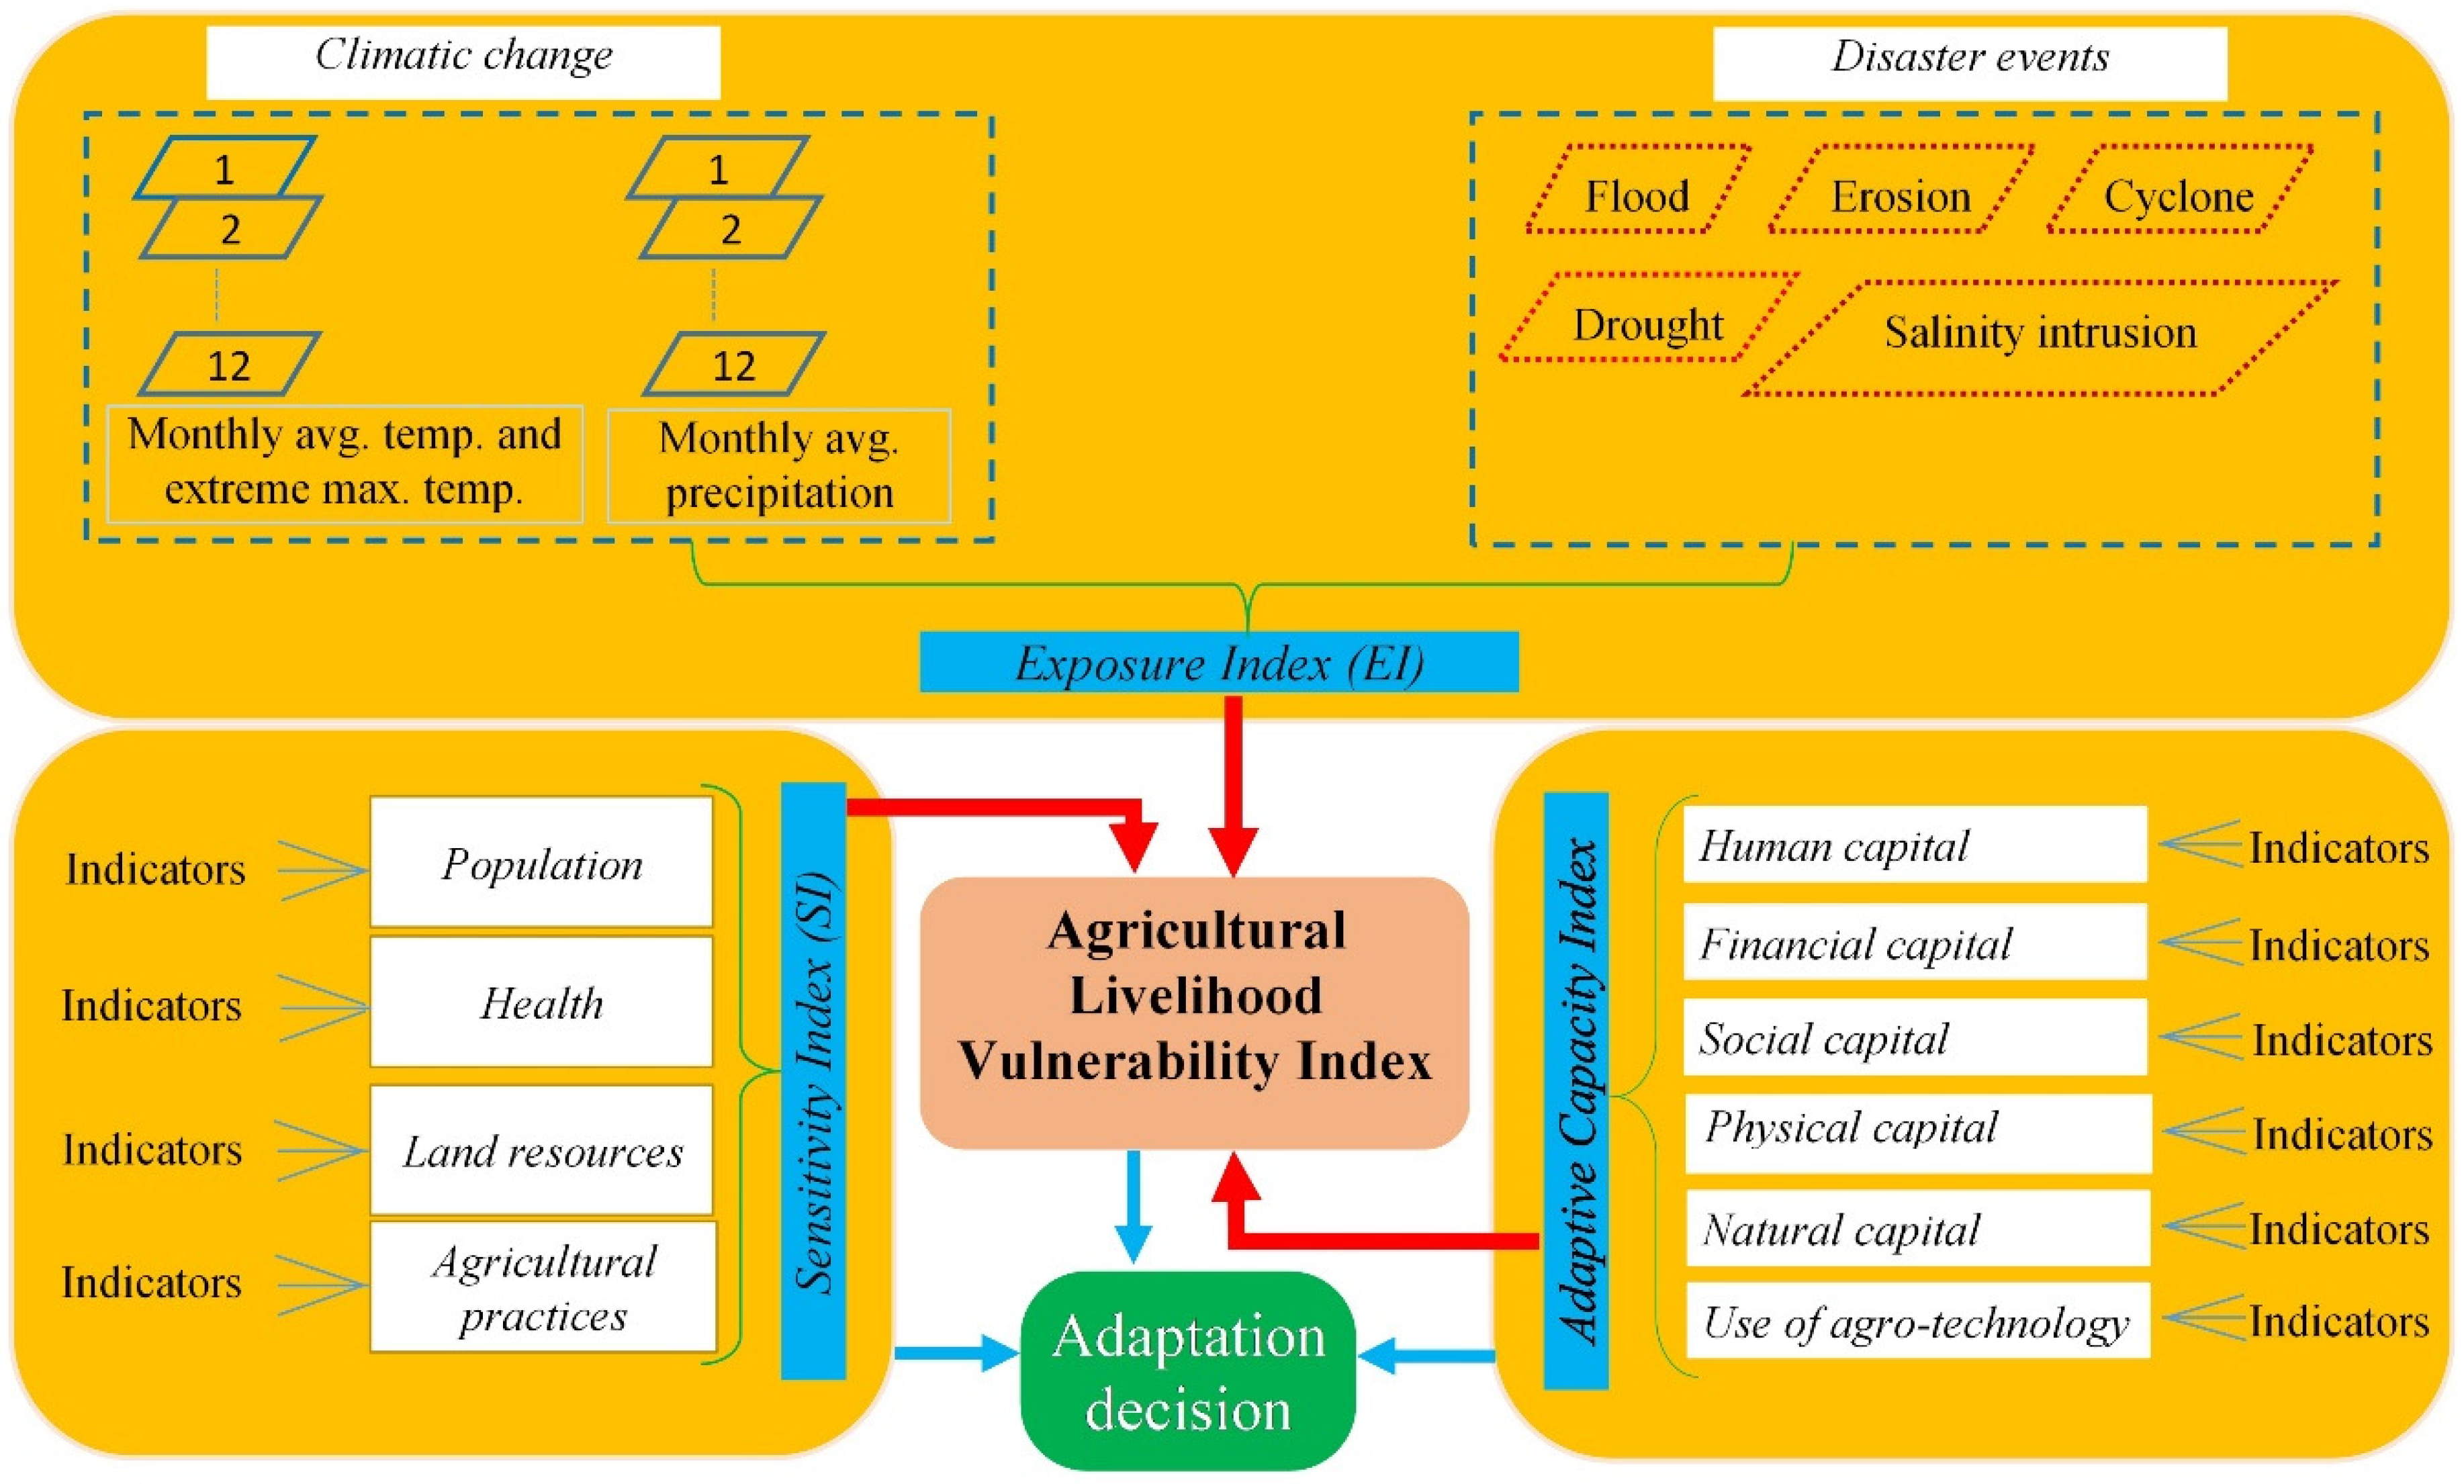
2. The Agricultural Livelihood Vulnerability Index: Conceptual Framework

The vulnerability assessment of our study takes as its starting point the IPCC typology, which describes climate change-led vulnerability as a function of exposure, sensitivity, and adaptive capacity [14]. The reasons for adopting the E-S-A framework are threefold: first, it accumulates the main elements of socioeconomic and ecological systems at multiple scales; secondly, it accentuates adaptive capacity, which determines the level of vulnerability to a greater extent; and finally, it affords an integrated assessment by capturing a diverse set of layers and suitable indicators.
Agricultural livelihood refers to “individuals or communities whose livelihoods depend on crops, livestock, fish, trees, and other renewable resources” [1]. In this study, agricultural livelihood vulnerability is defined as the degree to which the agricultural sector and dependent economic endeavors are unable to recover from or adapt to the adverse impacts of climatic variability and disasters affecting farming practices. Therefore, livelihoods within an agricultural community will be more vulnerable if the community is highly exposed to the effects of climatic variability and extreme events such as erratic rainfall and cyclones; shows great sensitivity to crop, fisheries and livestock production along with demographic pressures and health susceptibilities; and at the same time has inadequate adaptive capacity such as livelihood capital and adaptive agro-technology (Figure 1).

3. Methods

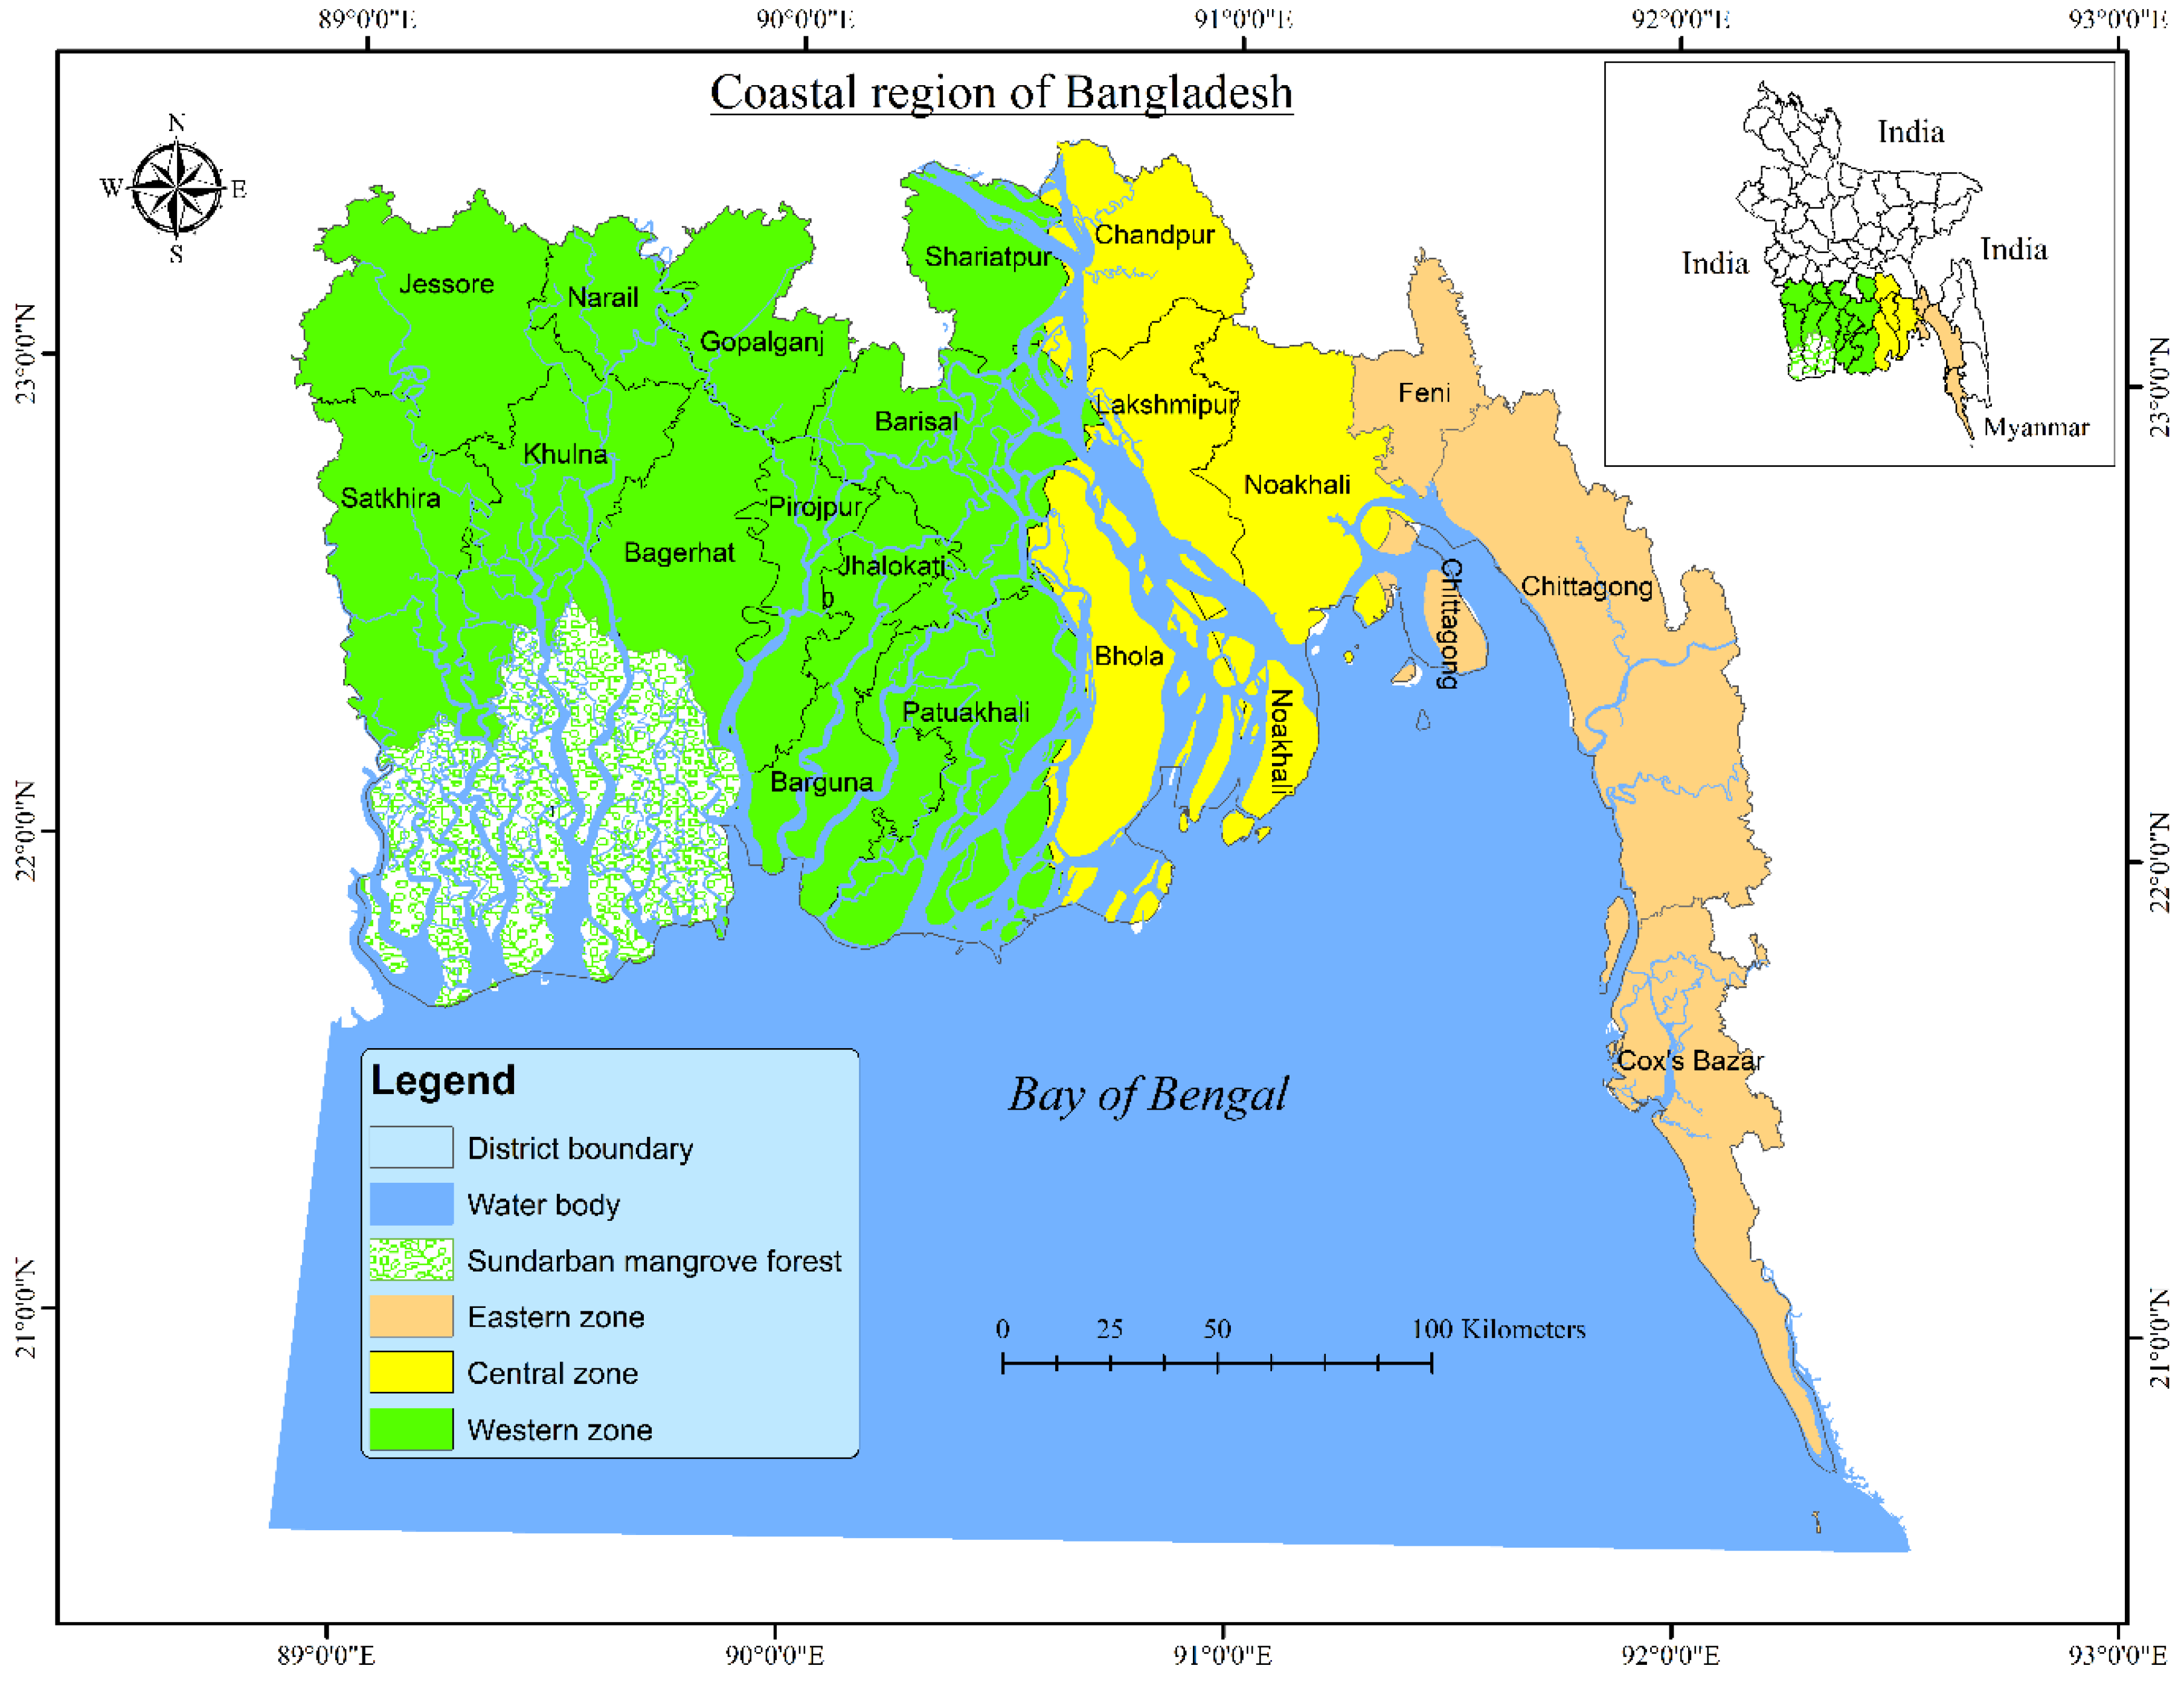
3.1. Profile of the Case Study Area

The present study covered the entire coastal region of Bangladesh lying between 20°6′ N to 23°5′ N latitude and 88°5′ E to 92°6′ E longitude (Figure 2). It comprises 32% (47,201 km2) of the total geographical land area of Bangladesh [36,38] and is home to about 40 million people in 19 administrative districts, where almost 80% of people are living in rural areas, and more than 70% of them are involved with agriculture-related activities [60]. This region is unique from ecological and economical points of view, containing a world heritage Sundarban mangrove forest (6017 sq. km), the world’s longest natural sea beach (120 km), coral islands, mountains, tidal estuaries, renewable and non-renewable energy resources, productive agricultural lands and marine resources [55,61]. The entire coastal region of Bangladesh is divided into three distinct zones: east coast, central coast, and west coast (Figure 2). The eastern coast is characterized by higher elevations and stable landmasses, and has experienced massive land-use changes; whereas the central coast is characterized by the Ganges-Brahmaputra floodplain, an active delta at a lower elevation, and has suffered massive erosion and accretion of sediments from the strong currents and tides. On the other hand, the west coast is a mature delta with large saline areas; it harbors a mangrove forest, yet experiences substantial anthropogenic pressures [62]. The entire coastal region; however, is characterized by low-lying topography: 62% of the land is below 3 m elevation, and about 86% is below 5 m above average sea level [55,61].

3.2. Indicator Selection, Data Collection and Transformation to Spatial Scale

In general, three diverse research streams are underlined in the literature regarding agricultural vulnerability to climate change: biophysical, agro-ecological, and socioeconomic aspects [24]. The biophysical aspects consider agricultural systems’ exposure to climate change and variability by incorporating indicators like precipitation variability, the occurrence of flood, drought, and environmental degradation [28]. The agro-ecological dimensions are represented by the sensitivity of farmland and production to climate shocks [26,28]. The socioeconomic aspect is reflected by analyzing climate change’s impact on agricultural productivity and farm income [24] as well as social vulnerability, which primarily incorporates indicators relating to vulnerable social groups and their capacity to adapt to climate change [23,24,28,29]. The indicator method of this study consists of 64 indicators (see details in Table 1) reflecting socioeconomic, agro-ecological, and biophysical variables.
The time-series data (1964–2013) on maximum and minimum temperature, and rainfall from 19 weather stations spread over the entire coastal region, were obtained from the Bangladesh Meteorological Division (BMD), Agargaon, Dhaka. The historical data on frequency and intensity of floods and cyclones were collected from the Bangladesh Bureau of Statistics (BBS) report, and the hazard score was computed following the methodology of Barua et al. (2016) [63]. The district-level average drought intensity score was obtained from Alamgir et al. (2019) [64], calculated based on the time series precipitation data during 1994–2013 for the Kharif season.
The district-level data on area and intensity of salinity were collected from the Soil Resources Development Institute (SRDI). The salinity severity index was calculated using Equation (1):
Salinity   Severity   Index   ( SSI ) = i = 0 5 S i   A i i = 0 5 A i
where Si represents the salinity class; Ai represents the % area under the ith salinity class, i.e., i = 0, 1, 2, 3, 4, 5. S0 = no salinity or < 2 ds/m; S1 = 2–4 ds/m; S2 = 4–8 ds/m; S3 = 8–12 ds/m; S4 = 12–16 ds/m; S5 = above 16 ds/m.
Seven Landsat TM and OLI-TIRS scenes (30×30-m resolution) covering the entire coastal region of Bangladesh for the years 1998 and 2018 were collected from the LSDS Science Research and Development (LSRD) database of the United States Geological Survey (USGS) (https://espa.cr.usgs.gov/) (free of cost); these were used to calculate the land use/land cover (LULC) changes (Figure S1 and Table S1). The rate of riverbank erosion (km/year) was estimated based on the dynamics of LULC change [65], and the land-use intensity (LUI) was estimated by considering the results of LULC following Huang et al. (2012) [66].
The land degradation index was constructed based on key informants’ perception analysis [29]. Components of land degradation assessment in this study included anthropogenic activities, i.e., agricultural mismanagement, overgrazing, fuel-wood consumption, deforestation, industry, and urbanization.
The cross-sectional data on land resources—i.e., soil organic matter, soil phosphorous; agricultural practices, livelihood capital, and agro-technology use at the district level—were compiled from the districts’ statistical reports (Jila Batayan) and the Agricultural and Fisheries statistical yearbook of Bangladesh published by BBS.

3.3. Index Formation and Spatial Mapping

Since the collected data had different ranges and scales, they were normalized to rescale within a dimensionless range (0–1) for ensuring uniformity and comparability of the indicators. We used inverse values of some sensitivity and adaptive capacity indicators to ensure that the increase in value always represented an increase in sensitivity and adaptive capacity [57].
The relative weights of the 64 indicators (see Table 1) under three major components were estimated using the analytic hierarchy process (AHP) [67]. The consistency ratio (CR) in AHP ranged between 0.1 and 8.8%, which was satisfactory [68] (see details of the AHP approach in the supplementary materials and Tables S2 and S3). Since different variables affect vulnerability unevenly, the equal weight method was not used. Moreover, statistical methods are often criticized for ignoring local knowledge and traditional values [15].
This study applied a weighted sum of sub-indices [18,57] technique for aggregation purposes. Therefore, exposure, sensitivity, and the adaptive capacity index were assumed as the linear sum of their indicators, and measured according to Equation (2):
EI ,   SI ,   ACI =   i = 1 m W i Y i
where EI, SI, and ACI represent the values of the exposure index, sensitivity index and adaptive capacity index, respectively; Wi represents the weight of the ith indicator (i = 1, 2, …, m); and Yi represents the normalized value of the ith indicator. A similar technique was applied for analyzing the index of the 12 (twelve) sub-components.
In this study, agricultural livelihood vulnerability to climate change was determined by subtracting the adaptive capacity index from the arithmetic sum of the exposure index and sensitivity index [28,69] following Equation (3):
Vulnerability = {(Exposure + Sensitivity) − Adaptive capacity}
ALVI = (EI + SI − ACI)
Further normalization of calculated EI, SI, ACI and ALVI indices provided us with index values between 0 and 1, where a value closer to 0 means a lower level of relationship to EI, SI, ACI or ALVI, and a value closer to 1 means a higher level [69]. The categorization of EI, SI, ACI, and ALVI into five classes of attributes (very low, low, moderate, high, and very high) at the spatial scale was accomplished by employing the equal interval approach under an ArcGIS environment [57,69]. Furthermore, the coefficient of correlation was run to find the relationships among EI, SI, ACI, and ALVI [26,56].

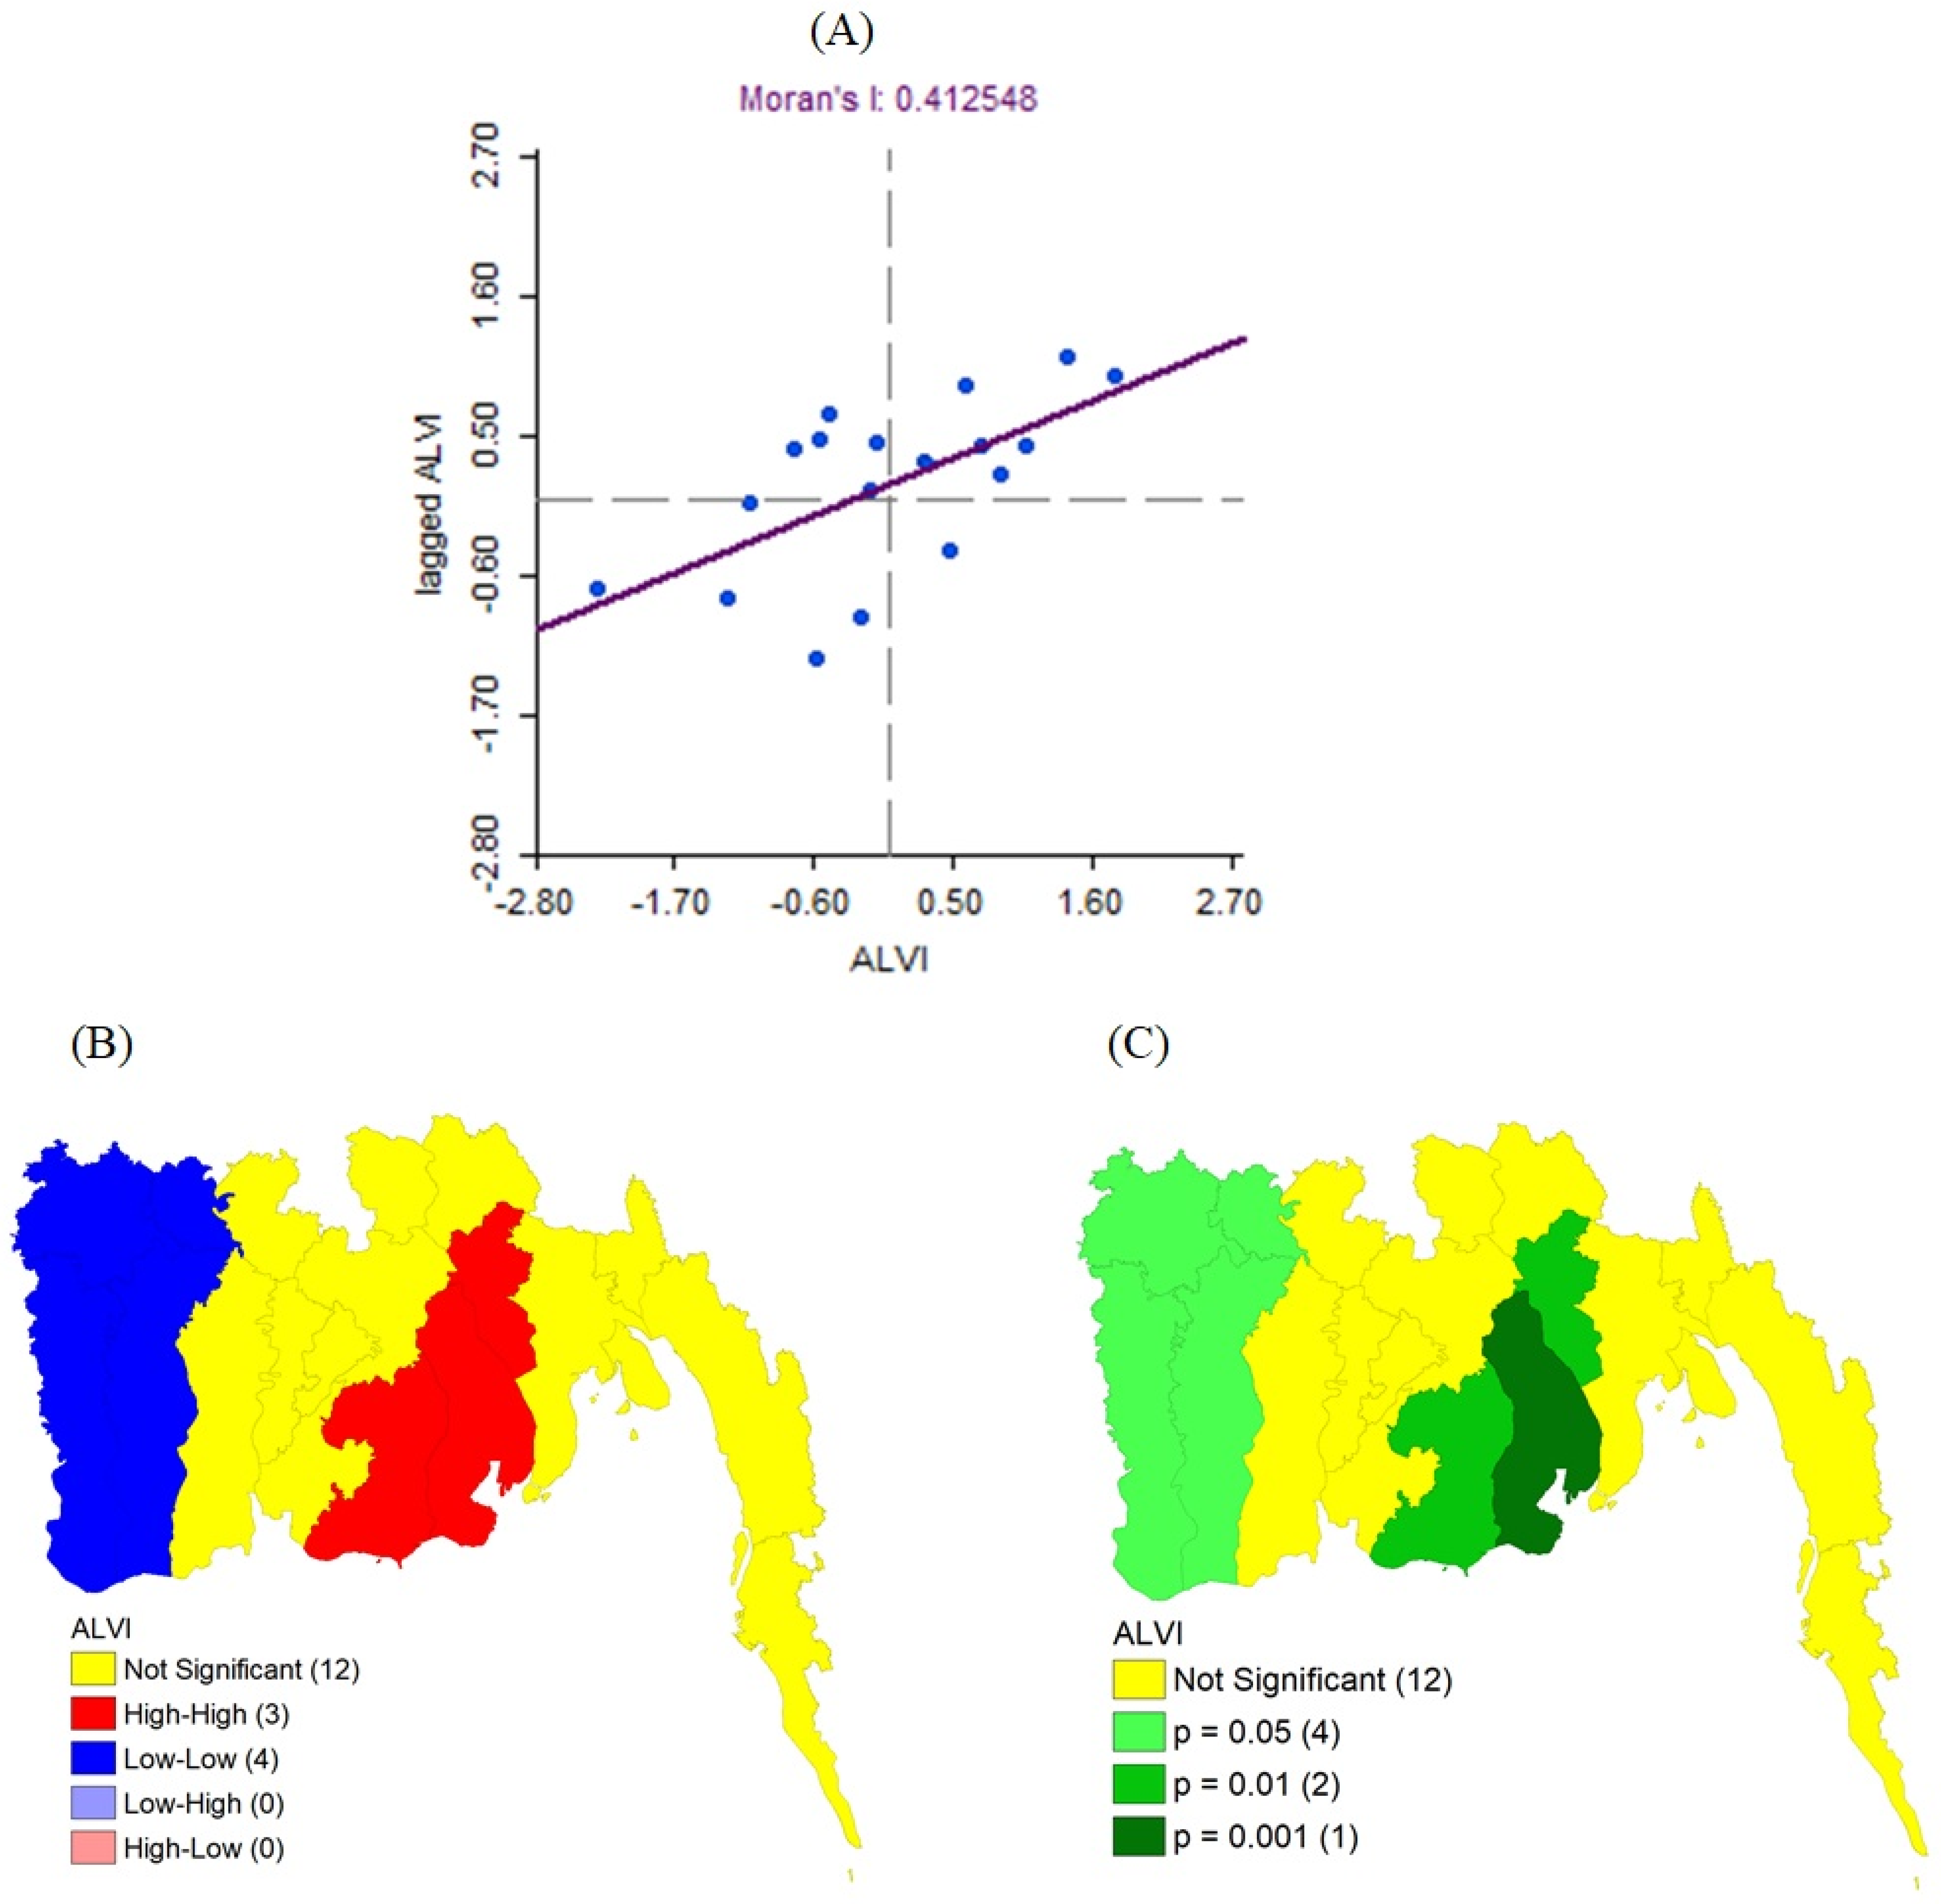
3.4. Hot Spot Analysis

We used an Exploratory Spatial Data Analysis (ESDA) technique—spatial autocorrelation—to analyze the distribution characteristics of ALVI across the coastal districts of Bangladesh. The spatial autocorrelation analysis was performed through GeoDa-1.12.1.161 software following the methodology of Jha and Haripriya (2019) [69]. In spatial autocorrelation, Moran’s I designates a value score range from +1 to −1, which indicates the spatial pattern between the neighboring regions and observations [69]. A Moran’s I score that is close to +1 shows a strong similarity pattern between the high and low values, whereas −1 reflects a strong dissimilarity pattern indicating a varied pattern of high and low values. On the other hand, LISA (Local Indicators of Spatial Association) identifies four types of spatial clusters—HH (high-high), HL (high-low), LH (low-high), and LL (low-low)—at the local level. An HH value indicates a region of high ALVI values surrounded by other regions of high ALVI values, and is referred to as ‘hot spot’; whereas LL values represent a region with low ALVI scores bounded by less vulnerable regions and is referred to as ‘cold spot’. The HL and LH areas are those with extreme values, reflecting a negative spatial autocorrelation, and are referred to as ‘spatial outliers’.

3.5. Development of Intervention Plan

Since uncertainty is interlinked with climate change, exposure is beyond the reach of policy interventions. However, adopting suitable policy interventions for reducing sensitivity and enhancing adaptive capacity could reduce vulnerability [56]. To this end, district-wise sensitivity and adaptive capacity index values were plotted on the X and Y axes, respectively, of a scatter diagram, to develop a decision matrix that could help identify socioeconomically vulnerable areas so that effective interventions could be taken, on a priority basis. Districts in the quadrants with SI scores ≤ 0.50 and ACI scores > 0.5 were treated as low vulnerability areas, whereas highly vulnerable districts were recognized when SI score > 0.5 ≤ ACI score. Furthermore, the normalized relative values (rescaled) of the indicators under sensitivity and adaptive capacity components were plotted on circumplex charts, to identify the drivers (sensitivity indicator value > 0.5 ≥ adaptive capacity indicator value) and buffers (sensitivity indicator value ≤ 0.5 < adaptive capacity indicator value) by using the mean value (0.5) as a threshold boundary.

4. Results and Analysis

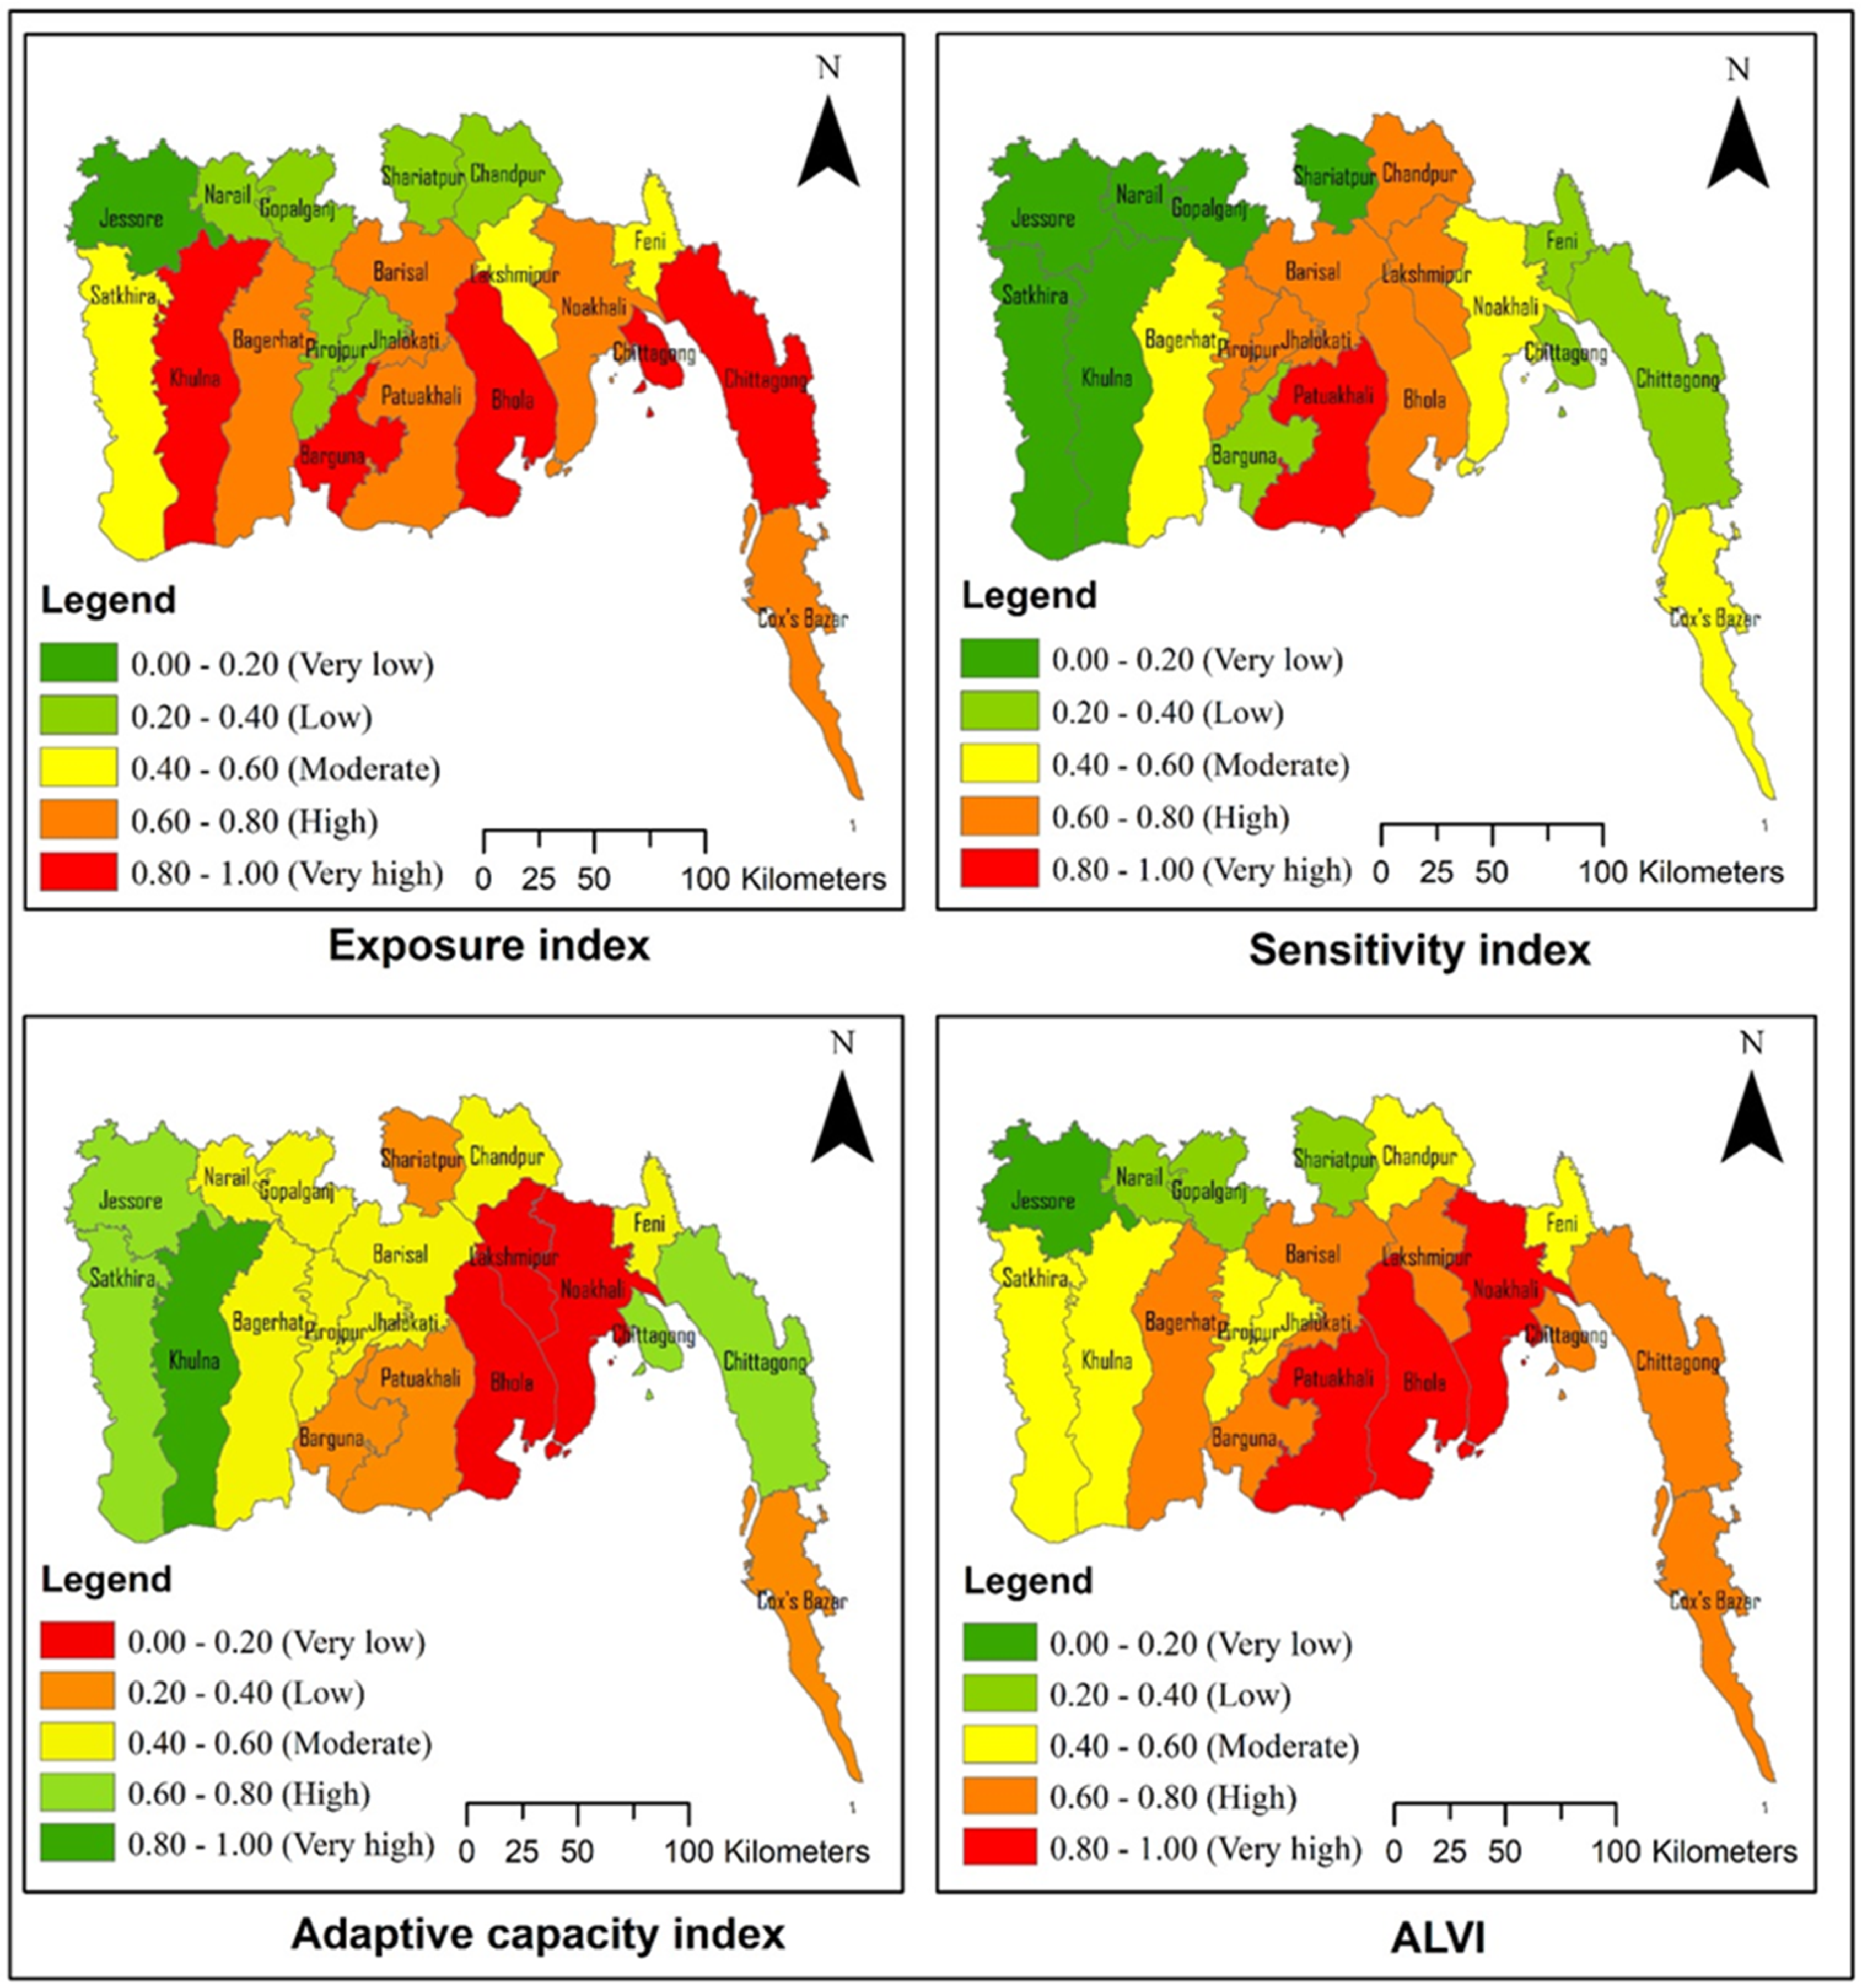
4.1. Exposure Dimension

Aggregation of the weighted value of indicators under the exposure dimension reveals (Figure 3, Table S4) that four (Bhola, Khulna, Barguna, and Chittagong) out of the 19 districts had very high levels of exposure, with index scores of 0.560–0.651. However, the Bhola district is the only island district, and it had the top-ranked exposure index value (0.651), which corresponded to its higher exposure to erosion, flood, cyclone, and drought. The Barisal, Patuakhali, Bagerhat, Noakhali, and Cox’sbazar districts had exposure index scores between 0.482–0.566 and were grouped into districts with high exposure to climate disasters. The aggregated land area of the high to very high exposure districts accounted for 65.87% of the total study area, indicating that two-thirds of the coastal region is highly exposed to climate disaster. Approximately 23.33 million people (60.59% of the total population) are living in the districts located in these highly exposed areas. On the other hand, seven districts (Jessore, Jhalokati, Narail, Gopalganj, Pirojpur, Shariatpur and Chandpur), mainly distributed along the interior coast and had low to the very low exposure index values, and their aggregated land area accounted for 20.87% of the total study area.

4.2. Sensitivity Dimension

Agricultural susceptibility indicates the probability of the agricultural farming sector’s being affected by the impacts of climate change. Findings (Figure S2 and Table S5) revealed that ten (Barisal, Chandpur, Satkhira, Khulna, Bagerhat, Patuakhali, Bhola, Lakshmipur, Pirojpur, and Jhalokati) out of the nineteen districts had high to very high levels of agricultural susceptibility, and their aggregated land area accounted for 56.52% of the total study area. The Patuakhali district had the highest susceptibility score (0.315) of agricultural practices sub-dimension, which corresponded to a significant proportion of marginalized farm holdings (34.24%), crop area (60.43%), rain-fed agricultural land (95.54%), with a higher gross agricultural production (1.15), and low yield (1.99 ton/ha) of rice.
Combining the indicators under the sensitivity component reveals (Figure 3 and Table S4) that the Patuakhali district had the highest sensitivity score (0.655) and was categorized as having very high sensitivity to climate change. The districts of Chandpur, Bhola, Noakhali, Lakshmipur, Jhalokati, and Pirojpur were grouped into the category of high sensitivity, with index scores of 0.542–0.604. The aggregated land area of the high to very high sensitivity districts accounted for 41.25% of the total study area. Hence, the agricultural livelihoods of 14.68 million people (38.13%) are highly sensitive to climate change, and this area corresponded to the dominance of crop-based (58.16%) and rain-fed (76.34%) farming; low crop diversity (1.83) and productivity (rice ~ 2.42 ton/ha); and low soil phosphorus (12.38 µg/gm) and organic matter (2.09%) content. Moreover, these highly sensitive districts accommodate the highest proportion of the rural (88.20%), marginalized (37.87%) and economically poor (23.05%) population with unhygienic sanitation conditions (45.34%), distant water sources (21.58%), and high infant mortality rates (47.50%).

4.3. Adaptive Capacity Dimension

Findings suggests (Figure 3 and Table S4) that the Khulna district alone fell under the category of very high adaptive capacity, with an index value 0.562, corresponding to its higher proportion of employed population (35%), female workforce (6.30%), income diversification (IDI = 5347.11), medical density (15.39/100,000 people), structurally sound houses (41.30%), dams (25.06%), natural forests (46.21%) and lower fertilizer application (0.11 ton/ha). The districts Jessore, Satkhira, and Chittagong had index scores between 0.460–0.510 and were categorized under the high adaptive capacity group. On the other hand, seven (Shariatpur, Barguna, Patuakhali, Bhola, Lakshmipur, Noakhali and Cox’sbazar) out of the nineteen districts had low to very low adaptive capacity, with index values ranging from 0.306 to 0.406. The aggregated land area of the low to very low adaptive capacity districts accounted for 37% of the total study area, which was mainly distributed in the high-exposure and -sensitivity zone and signifies their vulnerability to future climate change impacts. Critical factors of low adaptive capacity corresponded to the districts’ literacy rate (50.14%), structurally sound houses (12.60%), dependence on agriculture (55.94%), and adoption of agricultural technologies such as improved crop variety (55.75%), irrigation pumps (27.38%), and harvesters (9.82%).

4.4. Agricultural Livelihood Vulnerability Index

The ALVI score at the district level ranged from 0.177 to 0.882. Results (Figure 3 and Table S4) revealed that three (Bhola, Patuakhali, and Noakhali) out of the nineteen districts had very high levels of vulnerability, with ALVI scores of 0.759–0.882. The Bhola district—the only island district—ranked first in ALVI, which corresponds to very high exposure (0.651), moderate sensitivity (0.519), and very low adaptive capacity (0.342). The Barisal, Bagerhat, Barguna, Lakshmipur, Chittagong, and Cox’sbazar districts had ALVI scores of 0.605–0.716 and were grouped under the high vulnerability category. The aggregated land area of the high to very high vulnerability districts accounted for 59.60% of the total study area, signifying that 22.75 million people (59.07%) are highly vulnerable to climate change. The moderate vulnerability districts, with ALVI scores of 0.450–0.543. included Satkhira, Khulna, Pirojpur, Jhalokati, Feni, and Chandpur. Only four districts (Jessore, Narail, Gopalganj, and Shariatpur) had low to very low ALVI, and all of these districts are situated in the interior part of the western coastal region. This finding is in accord with Quader et al. (2017) [42], who concluded that some island areas of the eastern zone are very susceptible to cyclone hazards. A comparatively high vulnerability to salinity intrusion was reported in the southwestern region [51], while fisherman’s livelihoods were more vulnerable to climate change in the Patuakhali district than in Cox’sbazar [27]. A higher level of vulnerability and livelihood risk existed in the more cyclone-affected areas [42], while saline-prone areas were found to be more vulnerable than flood- and drought-prone areas [52].
Correlation analysis (Table S6) revealed that both the EI and the SI showed very highly significant positive relationships with ALVI (rALVI vs.EI = 0.833 **, p < 0.01; rALVI vs.SI = 0.620 **, p < 0.01). However, ACI showed a very highly significant negative correlation with ALVI (rALVI vs.ACI = −0.524 *, p < 0.05). Hence it could be expected that the exposure, sensitivity, and adaptive capacity dimensions had almost equal influences in determining the agricultural livelihood vulnerability of the coastal communities to climate disasters. An almost identical phenomenon was observed in some other Asian countries, where sensitivity [26,56] and adaptive capacity [25,26,56,57,70] predominantly influence vulnerability to climatic hazards. Furthermore, a very weak correlation (rEI vs.SI = 0.240; rEI vs.ACI = −0.093, rSI vs.ACI = −0.284, p > 0.05;) was found among the major components, suggesting that these three components occur independently, a result that also supports the findings of Li et al. (2015) [26], who assessed agricultural vulnerability in China, and Krishnan et al. (2018) [56], who assessed coastal vulnerability due to climate change in India.

4.5. Hot Spots and Factors of Spatially Heterogeneous Vulnerability

The Moran scattered plot (Figure 4A) provided a relatively high Moran’s I score (0.4125) of the ALVI, indicating that the distribution pattern of the ALVI in the study area exhibited evident clustering, displaying a strong positive correlation. According to Figure 4B, only two types of significant autocorrelations could be found in the study area: High-High (HH), and Low-Low (LL). Consequently, we did not find any High-Low (HL) or Low-High (LH) spatial outliers, and the remaining groups were found to be insignificant (Figure 4B). Figure 4B shows that the values of the HH cluster were mainly concentrated along the mouth of the Meghna estuaries and distributed in the three districts Bhola, Patuakhali, and Lakshmipur, which were categorized as highly (Lakshmipur) to very highly (Bhola and Patuakhali) vulnerable districts (Figure 3). On the other hand, LL clusters were concentrated in the southwestern coastal region and distributed in the four districts Satkhira, Khulna, Jessore, and Narail. The LISA significance map (Figure 4C) shows that the significance of ALVI in HH and LL was 0.001 to 0.05, which indicates a strong positive correlation, and signifies that the ALVI values of these districts are positively related to the ALVI of neighboring districts.
In this study, we disaggregated indicator values across vulnerability classes in the ANOVA test to discover the factors of spatial differences in the agricultural livelihood vulnerabilities, among the coastal districts. As was revealed in the ANOVA test results (Table 2), there are significant spatial differences in riverbank erosion, cyclone hazard, and drought intensity with regards to exposure components which contributed to describing the differential level of vulnerability among the coastal districts. Furthermore, spatial differences of infant mortality rate, unhygienic sanitation conditions, land degradation, soil phosphorus, rain-fed agricultural land, and crop productivity that corresponded different levels of agricultural sensitivity to climate change and described heterogeneous vulnerability across the coastal districts. On the other hand, spatial variation of structurally sound houses, emergency shelters, open waterbody, improved crop variety, and use of pesticides and irrigation pumps have influenced adaptive capacity and resulted differential level of vulnerability to climate change. In other words, these are the factors with regards to exposure, sensitivity, and adaptive capacity that act as key factors of heterogeneous vulnerability among the coastal districts.

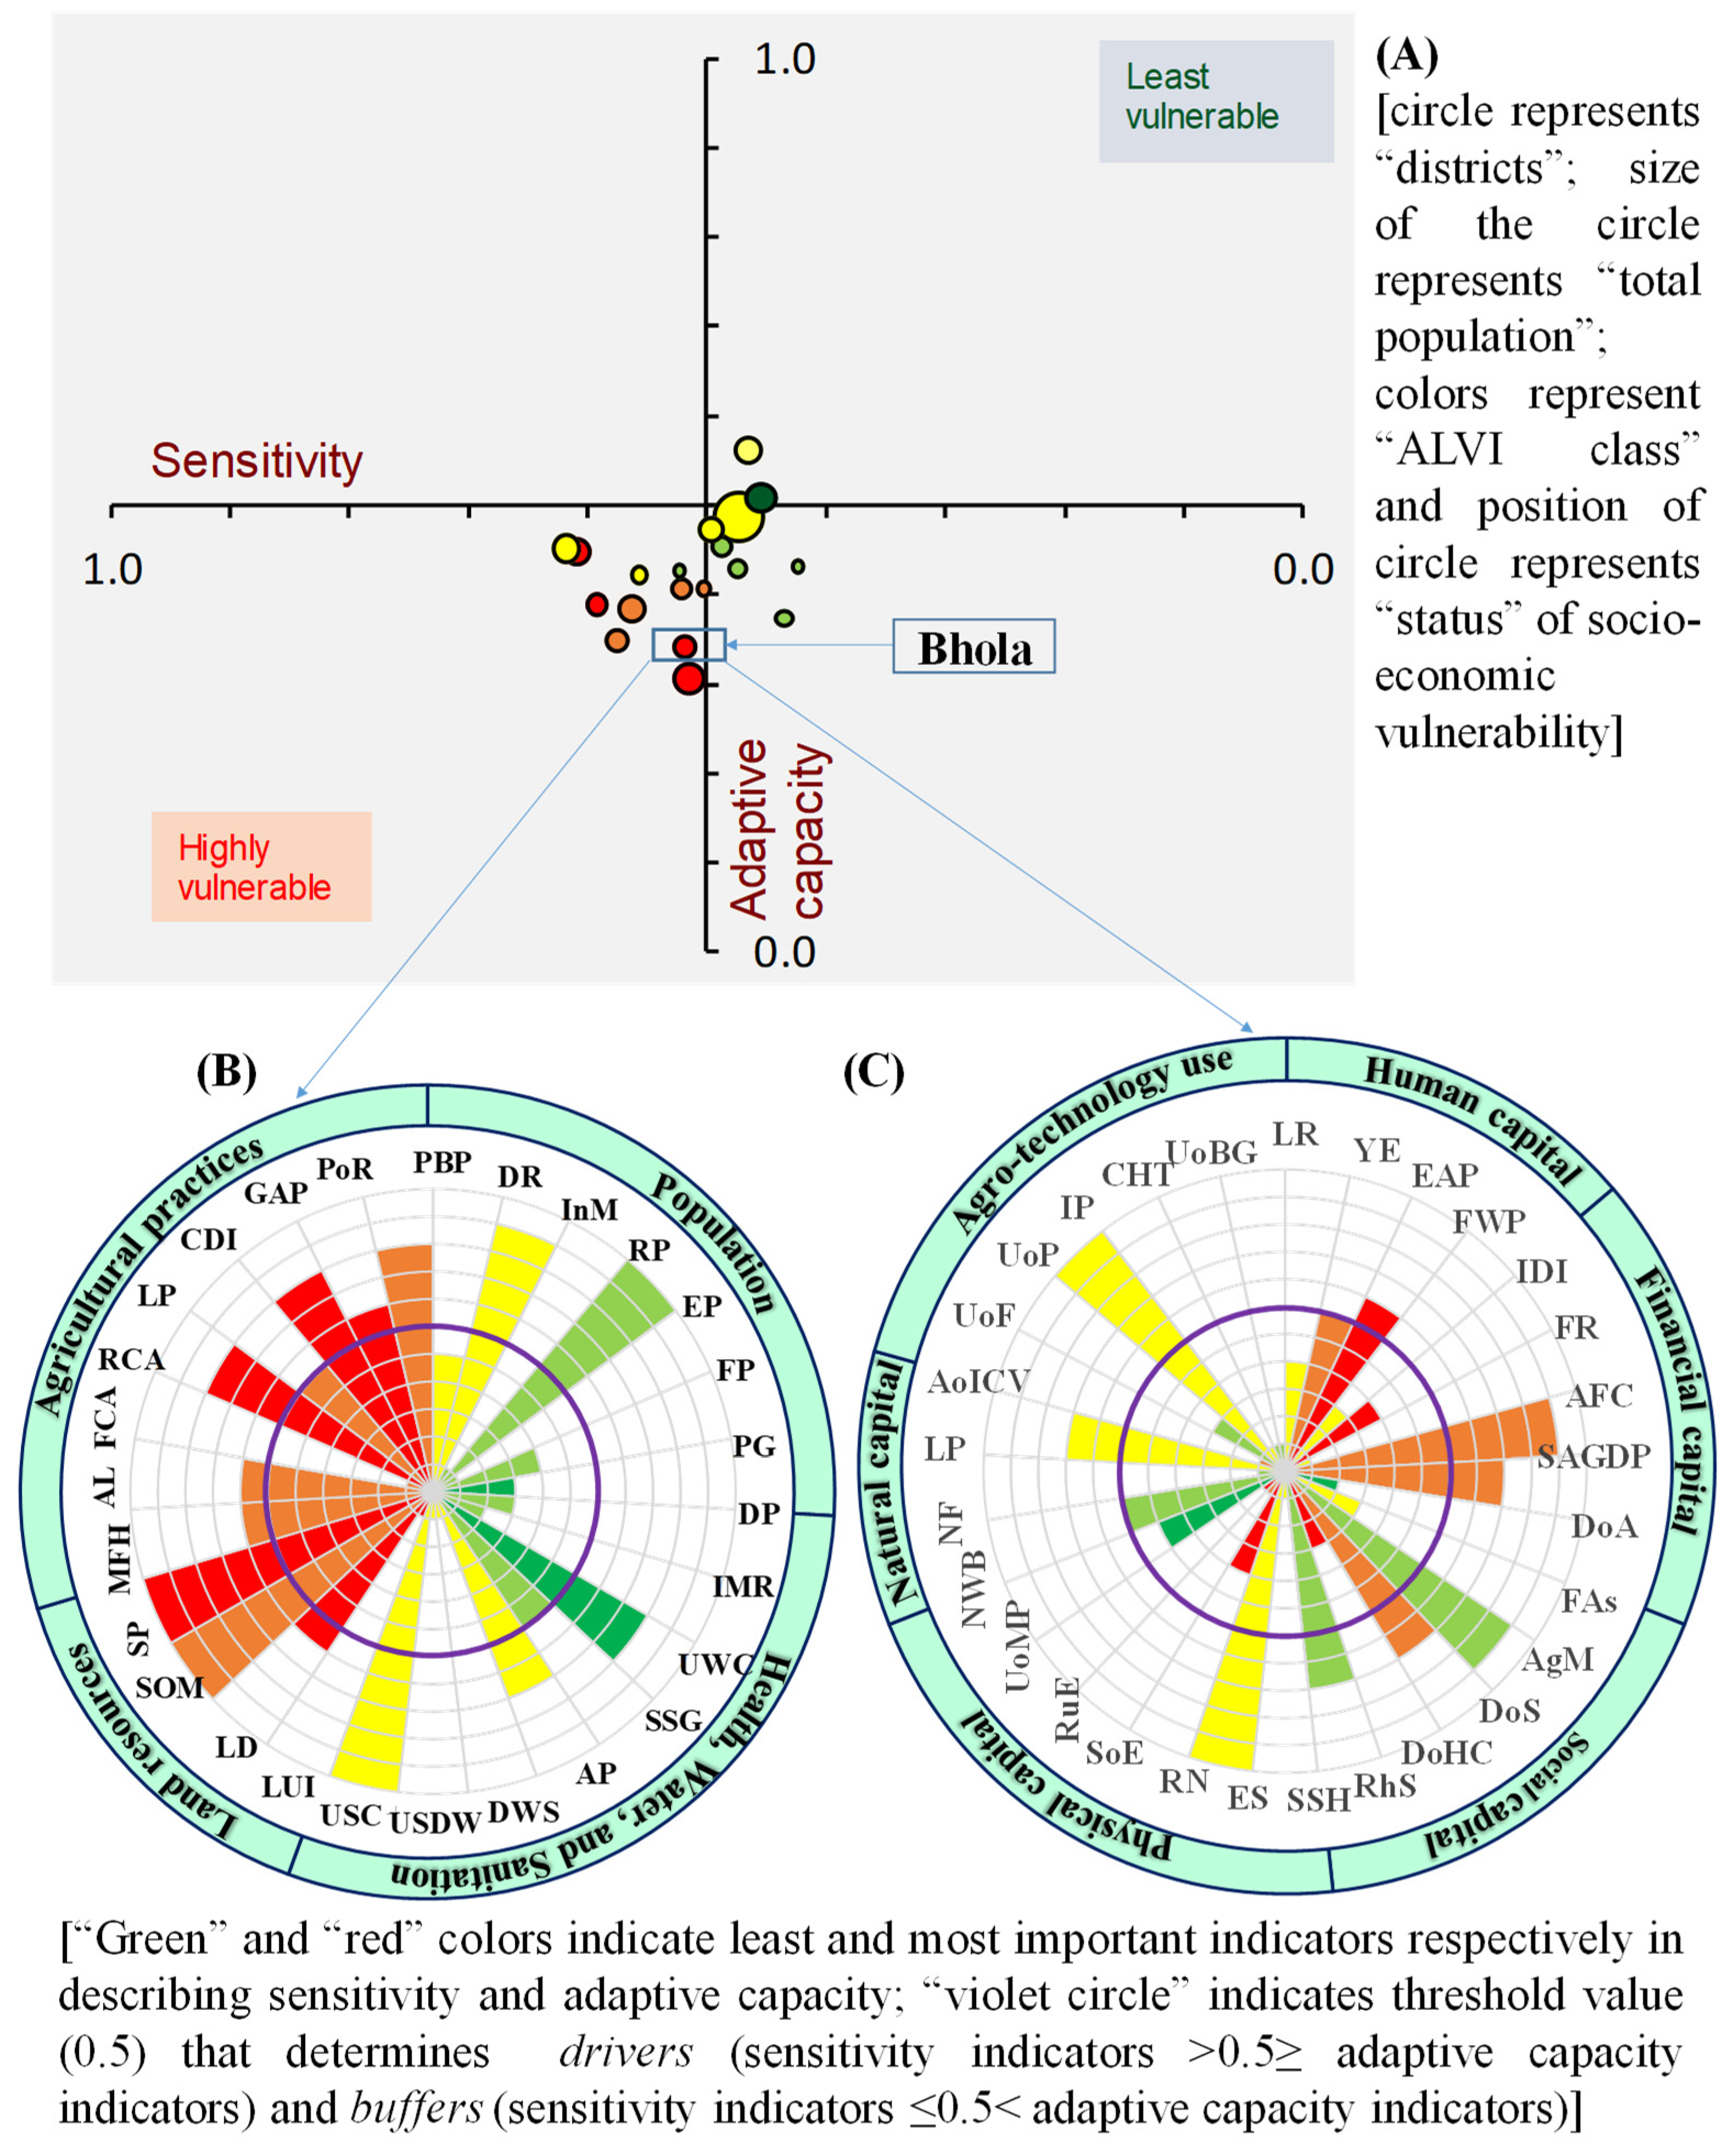
4.6. District-Level Intervention Planning

As shown in Figure 5A, all the districts having high to very high ALVI were placed in the third quadrant (highly vulnerable), indicating that those districts are socioeconomically more vulnerable and should be prioritized for intervention planning.
The circumplex chart (Figure 5B) for a sample district, Bhola (similar results for other districts are compiled in Figures S3 and S4), shows that dependency ratio (DR), rural population (RP), underweight children (UWC), unhygienic sanitation conditions (USC), soil organic matter (SOM), soil phosphorus (SP), rain-fed agricultural land (RAL), crop diversity index (CDI), and productivity of rice (PoR) were the key drivers contributing to high sensitivity in the Bhola district, implying that vulnerability was structured to some extent, due to a higher rate of rural smallholder farm households and their dependency on agri-based livelihoods, with low diversity and productivity of the land. On the other hand, the primary drivers that lowered the adaptive capacity of the Bhola district were found to be literacy rate (LR), female work participation (FWP), income diversity index (IDI), foreign remittances (FM), dependency on agriculture (DA), farmers’ associations (FAs), density of healthcare facilities (DoHC), structurally sound houses (SSH), road network (RN), share of embankments (SoE), rural electrification (RE), natural forest area (NFA), adoption of improved crop varieties (AoICV), use of fertilizer (UoF), irrigation pumps (IP), crop harvesters/threshers (CHT), and use of biogas (UoB) (Figure 5C). Diversifying agricultural systems, implementing irrigation facilities and technology-based farming practices, education, sanitation, income diversification by non-agricultural industries and infrastructural development—especially disaster-resistant houses, electricity, and roads—are therefore some of the prioritized actions to be considered to reduce the sensitivity and enhance the adaptive capacity of Bhola.

5. Discussion

5.1. Implication of Relative Spatial Vulnerability among Districts

At a glance, the vulnerability map suggests that all the top-ranked vulnerable districts are distributed at the mouth of the famous deltaic Meghna estuaries and the Ganges-Brahmaputra coastal plain adjacent to the south-central coastline. This finding partially supports the previous vulnerability assessments [27,51], while disagreeing with regard to agricultural vulnerability assessment of Uddin et al. (2019) [48]. Uddin et al. (2019) [48] considered that only two variables—rice production and irrigation pump use—reflected agricultural vulnerability, and applied the PCA (principal component analysis) method. The ALVI approach, however, includes more indicators to represent the diversified agriculture of coastal Bangladesh, and applies unequal weighting of indicators by the experts’ judgment, providing more accurate results [15,18,21,56,71]. The most vulnerable region was also found to be the most exposed to climatic variability and disasters, compared to other districts, a result in agreement with the hazard map of Bangladesh developed by CEGIS [42] and some other literature [48,63].
A closer inspection of the vulnerability map; however, reveals that the top two most vulnerable districts (Bhola and Patuakhali) possessed higher exposures and sensitivities and lower adaptive capacity, and are in a hot-spot zone. The higher level of adaptive capacity and low sensitivity of the Khulna district, on the other hand, ameliorated its high exposure to climate disaster. In contrast, the Chittagong district, despite its high level of adaptive capacity and low sensitivity, was influenced by a very high level of exposure and pushed the district to higher vulnerability. On the other hand, exceptionally low adaptive capacity, coupled with high exposure and moderate sensitivity, pushed Noakhali towards being a very highly vulnerable district. In general, districts in the interior coast had less exposure, sensitivity, and overall vulnerability to climate change.
A crucial finding was a very high level of vulnerability in the Patuakhali district. The district is categorized as highly prone to climate disasters, especially cyclones, sea level rise [27], and low tendency to adopt innovative agricultural technologies [46]. This study supports previous findings regarding farm technology use capacity and high exposure to cyclones. However, the Patuakhali district is less exposed to precipitation variability, flood hazards, and extreme temperature events, and, combined with a relatively lower level of literacy, industrial workers, structurally sound houses, road density, electricity, agricultural diversity index, crop productivity, and cropping intensity, and a higher level of rain-fed cropland, dependence on agricultural production, and unhygienic sanitation conditions triggered the district’s high vulnerability.

5.2. Benefits of the ALVI Approach

The ALVI can be useful in assessing the impact and effectiveness of a program or policy by producing a model index value of contributing indicators and thereby yielding an updated ALVI score. For example, if the purpose of a disaster risk reduction program is to minimize crop loss, the length of dams being constructed in a geographical area over a stipulated period could be incorporated, and new ALVI scores calculated. The new ALVI could then be contrasted with the baseline ALVI to estimate the intervention’s effects on the district’s agricultural vulnerability to climate change.
The purpose of developing the ALVI model was to present an integrated assessment tool that can cover the multidimensionality of the aspect being assessed with minimal data limitations. It allows us to improve on the strategies utilized by prior studies, by covering all aspects of the coastal locale—rural and urban, island and mainland—and carefully utilizes a combination of census, survey, meteorological, and spatial data to overcome data limitations as far as possible. By using data from multiple years, the changes in ALVI score over a specific period can be measured. For instance, we have used most of the socioeconomic data for the year 2011, which could be used as baseline data to be compared to data on the same variables, which will be readily available in the year 2021 (the target year for the Bangladesh Government’s statistical division) and will allow the change in ALVI to be calculated over a 10-year period.
The ALVI approach uses a spatial autocorrelation technique to discover the hot spots of vulnerability distribution (Figure 4) and develop a strategy to find the drivers of vulnerability (Figure 5). The results can be used to develop an intervention plan, to help policymakers target specific geographic locations where they can take intervention measures, easily selecting an area on a priority basis. Spatial autocorrelation also helps find the cold spots—the areas where vulnerability is very low, enabling progressive changes in the more vulnerable areas by copying the successful adaptation strategies of these cold spots.
The proposed ALVI model can also be used as a generalized operational method in other geographical areas, to accumulate multi-dimensional spatial information that can be used to identify vulnerability and assist policy-makers in supporting climate-change adaptation. However, the selection of variables requires a careful and methodical assessment, as climate change-induced vulnerability is a complex phenomenon and is strongly correlated with local socioeconomic, ecological and biophysical conditions. Furthermore, a decent data management strategy at an appropriate spatial scale is needed for an accurate reflection of agricultural sector vulnerability through ALVI.

5.3. Limitations of the Study and the ALVI Approach

Since vulnerability is a multidimensional concept and not directly measurable, it is associated with a high level of uncertainty in the indicator selection, measurement, and classification processes [71]. First, it was challenging to select the specific indicators for crops, fisheries, and livestock, because different crops, fish species, and livestock varieties are found in different districts, and uniform indicators had to be adopted across the districts.
Secondly, the trend of agricultural production and the extent of technology use were considered in this study, rather than simply using an existing crop model to predict the future scenario of agricultural output. However, linking a crop model in multi-indicator approaches could be more useful for estimating the sensitivity and adaptive capacity of agriculture [25,72].
Thirdly, it was challenging to find district-level historical data on climate disasters and, most importantly, for the same period of time. Moreover, a few districts did not have any weather stations, and for those districts, data from the nearest weather station were used. Therefore, there is room for reducing the uncertainty of vulnerability assessment, if more specific data become available for the same period.
Finally, we classified the vulnerability of a coastal district based on a beta distribution of vulnerability index scores. However, it is expected that the classification of vulnerability may not prevail over the long term because an improvement in adaptive capacity may moderate climate change impacts in the future [14].

6. Conclusions

Understanding and prioritizing which areas and communities, at sub-national scales, are most vulnerable to climate change has become a growing concern in policy circles in order to develop a sustainable adaptation plan. We developed an ALVI method for assessing the relative vulnerability of coastal agricultural livelihoods to climate change impacts with regards to the spatial variations of climatic change, disaster events, demography, health, land resources, agricultural practices, livelihood capitals, and agro-technology use. The proposed framework could help in identifying the most vulnerable geographic units and their hot spots for prioritized attention. It can also help distinguish the causal factors to existing vulnerability, referred to in this study as ‘drivers’ and ‘buffers’, with the former being identified as aspects for prioritized investment to support adaptation intervention.
The investigation, using an ALVI framework in coastal Bangladesh—a representative area of integrated and subsistence agricultural farming, which is particularly threatened by climate change—revealed that the agricultural livelihoods of 22.75 million people in 9 administrative districts are predominantly vulnerable to climate change, most notably (i) the Bhola district, due to low soil phosphorus and organic matter content, a larger area of rain-fed cropland, low crop diversity and productivity (sensitivity); the lowest level of foreign remittances, income diversity, agro-technology use, structurally sound houses (adaptive capacity); and high levels of erosion, drought, and cyclones (exposure); and (ii) the Patuakhali district, due to salinity intrusion, drought, and cyclones (exposure); low cropping intensity, diversity and productivity, and a larger area of rain-fed cropland (sensitivity); relatively lower levels of literacy, structurally sound houses, road density, electricity, and agro-technology use (adaptive capacity).
The hot spot of vulnerability distribution was concentrated in the rural agricultural districts (Bhola, Patuakhali, and Lakshmipur), where livelihoods are mainly dependent on crop-based farming and are continuously threatened by multiple climatic disasters such as floods, erosion, and cyclones. On the other hand, the vulnerability cold spots were distributed along the world’s largest mangrove forest, the Sundarbans, which offers numerous livelihood opportunities and reduces the vulnerability of surrounding districts (Satkhira, Khulna, Jessore, and Narail) by providing an ecological buffer against climatic disasters. Furthermore, the spatially heterogeneous vulnerability among the coastal districts was influenced by the indicators of exposure (rate of erosion, cyclones, and drought); sensitivity (infant mortality rate, distance to water source, unhygienic sanitation conditions, land degradation, soil phosphorus, rain-fed agricultural land, productivity of rice); and adaptive capacity (structurally sound housing and density of emergency shelters, open waterbody, adoption of improved crop varieties, pesticides, and irrigation facilities).
The proposed assessment method provides a concrete example of a set of potential adaptation measures for specific geographical units that will assist policymakers in prioritizing investments for intervention. For example, diversification of agricultural systems by allowing water-intensive crops; adoption of farming technology (crop variety, harvester use, irrigation pumps); construction of dams and roads, and enhancing the plantation mangrove forest program, are some of the potential adaptation options for the most vulnerable district, Bhola. These measures could reduce the sensitivity and modify the agricultural system’s exposure to stressors such as flood, erosion, drought, and cyclones. Subsequently, findings of this study may accelerate the shift of adaptation efforts to areas with greater exposure, increased sensitivity, or lower adaptive capacity.

Supplementary Materials

The following are available online at https://www.mdpi.com/1660-4601/16/22/4552/s1, Table S1: Random index (RI) values, Table S2: Results of AHP analysis, Table S3: Land cover classification scheme used in this study, Table S4: Ranking of coastal districts based on the overall vulnerability index score along with exposure, sensitivity and adaptive capacity components, Table S5: Index value of different sub-dimensions of exposure, sensitivity and adaptive capacity dimensions, Table S6: Correlation co-efficient; Figure S1: LULC dynamics of the coastal region of Bangladesh during 1998 to 2018, Figure S2: Mapping of susceptibility of agricultural practices to climate change across the coastal districts, Figure S3: Visualization of drivers and buffers of Sensitivity dimension for specific districts on the circumplex charts for planning intervention decision, Figure S4: Visualization of drivers and buffers of adaptive capacity dimension for specific districts on the circumplex charts for planning intervention decision.

Author Contributions

Conceptualization, M.Z.H. and S.C.; Methodology, M.Z.H. and L.X.; Software, M.Z.H.; Validation, M.Z.H., S.C. and L.X., Formal Analysis, M.Z.H.; Investigation, M.Z.H.; Data Curation, M.Z.H. and I.I.; Writing – Original Draft Preparation, M.Z.H.; Writing—Review & Editing, M.Z.H., S.C., L.X., I.I., J.T., and S.D.; Visualization, M.Z.H. and I.I.; Supervision, S.C.; Project Administration, S.C. and L.X.; Funding Acquisition, S.C. and L.X.

Funding

This study was jointly supported by The National Key Research and Development Program of China (2017YFC0506603), Bureau of International Co-operation Chinese Academy of Sciences (132C35KYSB20150005), National Natural Science Foundation of China (41661144032), and Chinese Academy of Sciences-The World Academy of Sciences (CAS−TWAS) President’s Fellowship Program for international Ph.D. students at University of Chinese Academy of Sciences (UCAS), China.

Acknowledgments

Authors extend their sincere gratitude to the experts and employees of different organizations in Bangladesh who spared us their valuable time during AHP and key informants’ interview. Bangladesh Bureau of Statistics (BBS) is acknowledged to make the population census data available online. We also extend earnest gratitude to the editor and anonymous reviewers for their productive comments and valued suggestions.

Conflicts of Interest

The authors declare no conflict of interest.

References

  1. FAO. Increasing Resilience of Agricultural Livelihoods; Food and Agricultural Organization of the United Nations: Rome, Italy, 2016. [Google Scholar]
  2. Rosenzweig, C.; Elliott, J.; Deryng, D.; Ruane, A.C.; Müller, C.; Arneth, A.; Boote, K.J.; Folberth, C.; Glotter, M.; Khabarov, N.; et al. Assessing agricultural risks of climate change in the 21st century in a global gridded crop model inter-comparison. Proc. Natl. Acad. Sci. USA 2014, 111, 3268–3273. [Google Scholar] [CrossRef] [PubMed]
  3. World Bank. World Data Bank: World Development Indicators. The World Bank Group, 2014. Available online: http://databank. worldbank.org/data/ (accessed on 12 October 2019).
  4. Morton, J.F. The impact of climate change on smallholder and subsistence agriculture. Proc. Natl. Acad. Sci. USA 2007, 104, 19680–19685. [Google Scholar] [CrossRef] [PubMed]
  5. Neumann, B.; Vafeidis, A.T.; Zimmermann, J.; Nicholls, R.J. Future coastal population growth and exposure to sea-level rise and coastal flooding-a global assessment. PLoS ONE 2015, 10, e0118571. [Google Scholar] [CrossRef] [PubMed]
  6. IPCC. The Ocean and Cryosphere in a Changing Climate; Chapter Four: Sea Level Rise and Implications for Low Lying Islands, Coasts and Communities; Contribution of Working Group IV to the Special Report of the Intergovernmental Panel on Climate Change (IPCC); Cambridge University Press: Cambridge, UK, 2019. [Google Scholar]
  7. IPCC. Climate Change 2014: Impacts, Adaptation, and Vulnerability; Part B: Regional Aspects; Contribution of Working Group II to the Fifth Assessment Report of the Intergovernmental Panel on Climate Change (IPCC); Cambridge University Press: Cambridge, UK, 2014. [Google Scholar]
  8. Khanom, T. Effect of salinity on food security in the context of interior coast of Bangladesh. Ocean Coast. Manag. 2016, 130, 205–212. [Google Scholar] [CrossRef]
  9. O’Brien, K.L.; Eriksen, S.; Schjolden, A.; Nygaard, L. What’s in a Word? Conflicting Interpretations of Vulnerability in Climate Change Research; Center for International Climate and Environmental Research: Oslo, Norway, 2009. [Google Scholar]
  10. Ford, J.D.; Smit, B. A framework for assessing the vulnerability of communities in the Canadian Arctic to risks associated with climate change. Arctic 2004, 27, 389–400. [Google Scholar] [CrossRef]
  11. Jurgilevich, A.; Räsänen, A.; Groundstroem, F.; Juhola, S. A systematic review of dynamics in climate risk and vulnerability assessments. Environ. Res. Lett. 2017, 12, 013002. [Google Scholar] [CrossRef]
  12. Adger, W.N. Vulnerability. Glob. Environ. Chang. 2006, 16, 268–281. [Google Scholar] [CrossRef]
  13. Cutter, S.L.; Boruff, B.J.; Shirley, W.L. Social Vulnerability to Environmental Hazards. Soc. Sci. Q. 2003, 84, 242–261. [Google Scholar] [CrossRef]
  14. IPCC. Climate Change 2007: Impacts, Adaptation and Vulnerability; Contribution of Working Group II to the Fourth Assessment Report of the Intergovernmental Panel on Climate Change (IPCC); Cambridge University Press: Cambridge, UK, 2007. [Google Scholar]
  15. Acheampong, E.N.; Ozor, N.; Owusu, E.S. Vulnerability assessment of northern Ghana to climate variability. Clim. Chang. 2014, 126, 31–44. [Google Scholar] [CrossRef]
  16. Neset, T.S.; Wiréhn, L.; Opach, T.; Glaas, E.; Linnér, B.O. Evaluation of indicators for agricultural vulnerability to climate change: The case of Swedish agriculture. Ecol. Indic. 2019, 105, 571–580. [Google Scholar] [CrossRef]
  17. Hinkel, J. Indicators of vulnerability and adaptive capacity: Towards a clarification of the science–policy interface. Glob. Environ. Chang. 2011, 21, 198–208. [Google Scholar] [CrossRef]
  18. Vincent, K. Uncertainty in adaptive capacity and the importance of scale. Glob. Environ. Chang. 2007, 17, 12–24. [Google Scholar] [CrossRef]
  19. Eriksen, S.H.; Kelly, P.M. Developing Credible Vulnerability Indicators for Climate Adaptation Policy Assessment. Mitig. Adapt. Strateg. Glob. Chang. 2007, 12, 495–524. [Google Scholar] [CrossRef]
  20. Hahn, M.B.; Riederer, A.M.; Foster, S.O. The livelihood vulnerability index: A pragmatic approach to assessing risks from climate variability and change- a case study in Mozambique. Glob. Environ. Chang. 2009, 19, 74–88. [Google Scholar] [CrossRef]
  21. Brooks, N.; Adger, W.N.; Kelly, P.M. The determinants of vulnerability and adaptive capacity at the national level and the implications for adaptation. Glob. Environ. Chang. 2005, 15, 151–163. [Google Scholar] [CrossRef]
  22. Turner, B.L.; Kasperson, R.E.; Matson, P.A.; McCarthy, J.J.; Corell, R.W.; Christensen, L.; Eckley, N.; Kasperson, J.X.; Luers, A.; Martello, M.L.; et al. A framework for vulnerability analysis in sustainability science. Proc. Natl. Acad. Sci. USA 2003, 100, 8074–8079. [Google Scholar] [CrossRef]
  23. Wiréhn, L.; Danielsson, Å.; Neset, T.S.S. Assessment of composite index methods for agricultural vulnerability to climate change. J. Environ. Manag. 2015, 156, 70–80. [Google Scholar] [CrossRef]
  24. Aleksandrova, M.; Gain, A.K.; Giupponi, C. Assessing agricultural systems vulnerability to climate change to inform adaptation planning: An application in Khorezm, Uzbekistan. Mitig. Adapt. Strateg. Glob. Chang. 2016, 21, 1263–1287. [Google Scholar] [CrossRef]
  25. Li, X.; Philp, J.; Cremades, R.; Roberts, A.; He, L.; Li, L.; Yu, Q. Agricultural vulnerability over the Chinese Loess Plateau in response to climate change: Exposure, sensitivity, and adaptive capacity. Ambio 2016, 45, 350–360. [Google Scholar] [CrossRef]
  26. Li, Y.; Xiong, W.; Hu, W.; Berry, P.; Ju, H.; Lin, E.; Wang, W.; Li, K.; Pan, J. Integrated assessment of China’s agricultural vulnerability to climate change: A multi-indicator approach. Clim. Chang. 2015, 128, 355–366. [Google Scholar] [CrossRef]
  27. Islam, M.N.; Sallu, S.; Hubacek, K.; Paavola, J. Vulnerability of fishery-based livelihoods to the impacts of climate variability and change: Insights from coastal Bangladesh. Reg. Environ. Chang. 2014, 14, 281–294. [Google Scholar] [CrossRef]
  28. Monterroso, A.; Conde, C.; Gay, C.; Gómez, D.; López, J. Two methods to assess vulnerability to climate change in the Mexican agricultural sector. Mitig. Adapt. Strateg. Glob. Chang. 2014, 19, 445–461. [Google Scholar] [CrossRef]
  29. Gbetibouo, G.A.; Ringler, C.; Hassan, R. Vulnerability of the South African farming sector to climate change and variability: An indicator approach. Nat. Resour. Forum 2010, 34, 175–187. [Google Scholar] [CrossRef]
  30. Tonmoy, F.N.; El-Zein, A.; Hinkel, J. Assessment of vulnerability to climate change using indicators: A meta-analysis of the literature. Wiley Interdiscip. Rev. Clim. Chang. 2014, 5, 775–792. [Google Scholar] [CrossRef]
  31. Nasim, F.A.; Hoque, M.Z.; Haque, M.E.; Islam, M.S.; Parveen, N.; Chakma, S.; Afrad, M.S.I. How does adoption of crop variety reduce the impact of drought in agriculture and mitigate food insecurity of smallholder farmers? A case study on BUdhan1 rice variety in Bangladesh. Asian J. Agric. Ext. Econ. Sociol. 2019, 30, 1–12. [Google Scholar] [CrossRef]
  32. Hoque, M.Z.; Cui, S.; Lilai, X.; Islam, I.; Ali, G.; Tang, J. Resilience of coastal communities to climate change in Bangladesh: Research gaps and future directions. Watershed Ecol. Environ. 2019. [Google Scholar] [CrossRef]
  33. Chen, J.; Mueller, V. Coastal climate change, soil salinity and human migration in Bangladesh. Nat. Clim. Chang. 2018, 8, 981–985. [Google Scholar] [CrossRef]
  34. Younus, M.A.F.; Kabir, M.A. Climate change vulnerability assessment and adaptation of Bangladesh: Mechanisms, notions and solutions. Sustainability 2018, 10, 4286. [Google Scholar] [CrossRef]
  35. Younus, M. An assessment of vulnerability and adaptation to cyclones through impact assessment guidelines: A bottom-up case study from Bangladesh coast. Nat. Hazards 2017, 89, 1437–1459. [Google Scholar] [CrossRef]
  36. MoA. Master Plan for Agricultural Development in the Southern Region of Bangladesh; Ministry of Agriculture: Dhaka, Bangladesh, 2013. [Google Scholar]
  37. Chowdhury, A.K.M.H.U.; Haque, M.E.; Hoque, M.Z.; Rokonuzzaman, M. Adoption of BRRI Dhan47 in the coastal saline areas of Bangladesh. Agric. J. 2012, 7, 286–291. [Google Scholar] [CrossRef]
  38. Shamsuddoha, M.; Chowdhury, K.R. Climate Change Impact and Disaster Vulnerabilities in the Coastal Areas of Bangladesh; COAST Trust and Equity and Justice Working Group: Dhaka, Bangladesh, 2007. [Google Scholar]
  39. Shamsuddoha, M.; Islam, M.; Haque, M.A.; Rahman, M.F.; Roberts, E.; Hasemann, A.; Roddick, S. Local Perspective on Loss and Damage in the Context of Extreme Events: Insights from Cyclone-Affected Communities in Coastal Bangladesh; Center for Participatory Research and Development (CRPD): Dhaka, Bangladesh, 2013. [Google Scholar]
  40. Jones, H.P.; Hole, D.G.; Zavaleta, E.S. Harnessing nature to help people adapt to climate change. Nat. Clim. Chang. 2012, 2, 504–509. [Google Scholar] [CrossRef]
  41. Brown, S.; Nicholls, R.J.; Lázár, A.N.; Hornby, D.D.; Hill, C.; Hazra, S.; Addo, K.A.; Haque, A.; Caesar, J.; Tompkins, E.L. What are the implications of sea-level rise for a 1.5, 2 and 3 °C rise in global mean temperatures in the Ganges-Brahmaputra-Meghna and other vulnerable deltas? Reg. Environ. Chang. 2018, 18, 1829–1842. [Google Scholar] [CrossRef] [Green Version]
  42. Quader, M.A.; Khan, A.U.; Kervyn, M. Assessing risks from cyclones for human lives and livelihoods in the coastal region of Bangladesh. Int. J. Environ. Res. Public Health 2017, 14, 831. [Google Scholar] [CrossRef] [PubMed] [Green Version]
  43. Watson, J.E.M.; Iwamura, T.; Butt, N. Mapping vulnerability and conservation adaptation strategies under climate change. Nat. Clim. Chang. 2013, 3, 989–994. [Google Scholar] [CrossRef]
  44. Hoque, M.A.A.; Ahmed, N.; Pradhan, B.; Roy, S. Assessment of coastal vulnerability to multi-hazardous events using geospatial techniques along the eastern coast of Bangladesh. Ocean Coast. Manag. 2019, 181, 104898. [Google Scholar] [CrossRef]
  45. Rabby, Y.W.; Hossain, M.B.; Hasan, M.U. Social vulnerability in the coastal region of Bangladesh: An investigation of social vulnerability index and scalar change effects. Int. J. Disaster Risk Reduct. 2019, 41, 101329. [Google Scholar] [CrossRef]
  46. Hasan, M.K.; Kumar, L. Comparison between meteorological data and farmer perceptions of climate change and vulnerability in relation to adaptation. J. Environ. Manag. 2019, 237, 54–62. [Google Scholar] [CrossRef]
  47. Rakib, M.A.; Sasaki, J.; Pal, S.; Newaz, M.A.; Bodrud-Doza, M.; Bhuiyan, M.A. An investigation of coastal vulnerability and internal consistency of local perceptions under climate change risk in the southwest part of Bangladesh. J. Environ. Manag. 2019, 231, 419–428. [Google Scholar] [CrossRef]
  48. Uddin, M.N.; Islam, A.S.; Bala, S.K.; Islam, G.T.; Adhikary, S.; Saha, D.; Haque, S.; Fahad, M.G.; Akter, R. Mapping of climate vulnerability of the coastal region of Bangladesh using principal component analysis. Appl. Geogr. 2019, 102, 47–57. [Google Scholar] [CrossRef]
  49. Mahmood, R.; Ahmed, N.; Zhang, li.; Li, G. Coastal vulnerability of Meghna estuary of Bangladesh using integrated geospatial technique. Int. J. Disaster Risk Reduct. 2020. [Google Scholar] [CrossRef]
  50. Bhuiyan, M.A.H.; Islam, S.M.D.; Azam, G. Exploring impacts and livelihood vulnerability of riverbank erosion hazard among rural household along the river Padma of Bangladesh. Environ. Syst. Res. 2017, 6, 25. [Google Scholar] [CrossRef]
  51. Ahsan, M.N.; Warner, J. The socioeconomic vulnerability index: A pragmatic approach for assessing climate change led risks–A case study in the south-western coastal Bangladesh. Int. J. Disaster Risk Reduct. 2014, 8, 32–49. [Google Scholar] [CrossRef]
  52. Toufique, K.A.; Islam, A. Assessing risks from climate variability and change for disaster-prone zones in Bangladesh. Int. J. Disaster Risk Reduct. 2014, 10, 236–249. [Google Scholar] [CrossRef]
  53. Islam, M.N.; Malak, M.A.; Islam, M.N. Community-based disaster risk and vulnerability models of a coastal municipality in Bangladesh. Nat. Hazards 2013, 69, 2083–2103. [Google Scholar] [CrossRef]
  54. Mullick, M.R.A.; Tanim, A.H.; Islam, S.S. Coastal vulnerability analysis of Bangladesh coast using fuzzy logic based geospatial techniques. Ocean Coast. Manag. 2019, 174, 154–169. [Google Scholar] [CrossRef]
  55. Huq, N.; Huge, J.; Boon, E.; Galn, A.K. Climate change impacts in agricultural communities in rural areas of coastal Bangladesh: A tale of many stories. Sustainability 2015, 7, 8437–8460. [Google Scholar] [CrossRef] [Green Version]
  56. Krishnan, P.; Ananthan, P.S.; Purvaja, R.; Jeevamani, J.J.; Infantina, J.A.; Rao, C.S.; Anand, A.; Mahendra, R.S.; Sekar, I.; Kareemulla, K.; et al. Framework for mapping the drivers of coastal vulnerability and spatial decision making for climate-change adaptation: A case study from Maharashtra, India. Ambio 2018. [Google Scholar] [CrossRef]
  57. Das, M.K.; Srivastava, P.K.; Rej, A.; Mandal, M.L.; Sharma, A.P. A framework for assessing vulnerability of inland fisheries to impacts of climate variability in India. Mitig. Adapt. Strateg. Glob. Chang. 2016, 21, 279–296. [Google Scholar] [CrossRef]
  58. Blanchard, J.L.; Watson, R.A.; Fulton, E.A.; Cottrell, R.S.; Nash, K.L.; Bryndum-Buchholz, A.; Büchner, M.; Carozza, D.A.; Cheung, W.W.; Elliott, J.; et al. Linked sustainability challenges and trade-offs among fisheries, aquaculture and agriculture. Nat. Ecol. Evol. 2017, 1, 1240–1249. [Google Scholar] [CrossRef]
  59. Fritzsche, K.; Schneiderbauer, S.; Bubeck, P.; Kienberger, S.; Buth, M.; Zebisch, M.; Kahlenborn, W. Vulnerability Source Book. Concept and Guidelines for Standardised Vulnerability Assessments. Deutsche Gesellschaft fur Internationale Zusammenarbeit (GIZ) GmbH, 2014; Available online: http://www.adaptationcommunity.net/?wpfbdl=203 (accessed on 12 October 2019).
  60. BBS. Statistical Yearbook of Bangladesh: JILA Series; Bangladesh Bureau of Statistics (BBS), Ministry of Planning: Dhaka, Bangladesh, 2011. [Google Scholar]
  61. CDS. Coastal Development Strategy (CDS); Ministry of Water Resources: Dhaka, Bangladesh, 2006. [Google Scholar]
  62. Chowdhury, Q.S.; Hossain, Q. Bengal Delta in Banglapedia; National Encyclopedia of Bangladesh; Asiatic Society of Bangladesh: Dhaka, Bangladesh, 2006. [Google Scholar]
  63. Barua, U.; Akhter, M.S.; Ansary, M.A. District-wise multi-hazard zoning of Bangladesh. Nat. Hazards 2016, 82, 1895–1918. [Google Scholar] [CrossRef]
  64. Alamgir, M.; Mohsenipour, M.; Homsi, R.; Wang, X.; Shahid, S.; Shiru, M.S.; Alias, N.E.; Yuzir, A. Parametric Assessment of Seasonal Drought Risk to Crop Production in Bangladesh. Sustainability 2019, 11, 1442. [Google Scholar] [CrossRef] [Green Version]
  65. Ahmed, A.; Drake, F.; Nawaz, R.; Woulds, C. Where is the coast? Monitoring coastal land dynamics in Bangladesh: An integrated management approach using GIS and remote sensing techniques. Ocean Coast. Manag. 2018, 151, 10–24. [Google Scholar] [CrossRef]
  66. Huang, Y.; Li, F.; Bai, X.; Cui, S. Comparing vulnerability of coastal communities to land use change: Analytical framework and a case study in China. Environ. Sci. Policy 2012, 23, 133–143. [Google Scholar] [CrossRef]
  67. Saaty, T.L. The Analytic Hierarchy Process; McGraw-Hill: New York, NY, USA, 1980. [Google Scholar]
  68. Saaty, T.L. Decision Making for Leaders: The Analytic Hierarchy Process for Decisions in a Complex World, 3rd ed.; RWS Publications: Pittsburgh, PA, USA, 2012. [Google Scholar]
  69. Jha, R.K.; Haripriya, G. An integrated assessment of vulnerability to floods using composite index –A district level analysis for Bihar, India. Int. J. Disaster Risk Reduct. 2019, 8. [Google Scholar] [CrossRef]
  70. Xu, L.; He, Y.; Huang, W.; Cui, S. A multi-dimensional integrated approach to assess flood risks on a coastal city, induced by sea-level rise and storm tides. Environ. Res. Lett. 2016, 11, 014001. [Google Scholar]
  71. Eakin, H.; Bojo’rquez-Tapia, L.A. Insights into the composition of household vulnerability from multi-criteria decision analysis. Glob. Environ. Chang. 2008, 18, 112–127. [Google Scholar] [CrossRef]
  72. Iglesias, A.; Garrote, L.; Quiroga, S.; Moneo, M. A regional comparison of the effects of climate change on agricultural crops in Europe. Clim. Chang. 2012, 112, 29–46. [Google Scholar] [CrossRef] [Green Version]
Figure 1. Framework of vulnerability assessment.
Ijerph 16 04552 g001
Figure 2. Case study area map showing the entire coastal region of Bangladesh with the different coastal zones and districts.
Ijerph 16 04552 g002
Figure 3. Mapping of spatial variation of exposure index, sensitivity index, adaptive capacity index, and agricultural livelihood vulnerability index, across the coastal districts.
Ijerph 16 04552 g003
Figure 4. Spatial analysis showing the pattern of vulnerability distribution across the study area: (A) Moran scatter plot of the ALVI values; (B) LISA cluster map; (C) LISA significance map. The red and blue color areas in map (B) indicate ‘hot spots’ and ‘cold spots’ of vulnerability distribution, respectively.
Ijerph 16 04552 g004
Figure 5. Decision matrix for entire coastal region incorporating 19 coastal districts by plotting sensitivity indices against adaptive capacity indices (A) and visualization of drivers and buffers of both Sensitivity and adaptive capacity components of a representative district on the circumplex charts (B,C), respectively, for intervention planning.
Ijerph 16 04552 g005
Table 1. Vulnerability components, sub-components, indicators and their functional relationships with major components and data sources, and final relative weight of indicators.
ComponentSub-ComponentIndicatorsSignProxyHRSourceTime Period Weight
ExposureClimateExtreme temperatureExTExtreme max. temp. (°C) in a 50-year return period+BMD1964–20130.066
Changes of temperatureCoTChanges on average annual temperature +BMD1964–20130.060
Precipitation variabilityPV(Max. precipitation–min. precipitation)/avg. precipitation+BMD1964–20130.161
Disaster Flood hazardFHComputation of flood hazard score a+BBS1951–20130.145
Riverbank erosion RERate of riverbank erosion (km/year)+USGS1998–20180.112
Cyclone hazardCHComputation of cyclone hazard score a+BBS1960–20150.156
Salinity intrusionSISalinity severity index+SRDI20100.185
Drought intensityDIDrought intensity in Kharif season+*1994–20130.114
SensitivityPopulationPopulation below poverty levelPBP% population below extreme poverty level+BBS20110.014
Dependency ratioDRRatio of the population < 14 and > 65 years to that 14–65 years+BBS20110.015
In migrationInM% floating people moving in from other areas+BBS20110.014
Rural populationRP% population living in rural area to total population+BBS20110.010
Ethnic populationEP% population living in tribal area+BBS20110.006
Female populationFP% female population to total population+BBS20110.012
Population growthPG% population increased during 2001 to 2011+BBS2001–20110.013
HealthDisabled populationDP% population physically disabled+BBS20110.010
Infant mortality rateIMRInfant mortality rate (no./1000 live births)+BBS20110.010
Underweight childrenUWC% of children under 5 years old who were underweight at birth+BBS20110.016
Severely stunted growthSSG% children under 5 years old reported as stunted growth+BBS20110.018
Arsenic problemAP% tube wells with potential threat of arsenic level > 50 mg/l+BBS20110.022
Distance from a water sourceDWS% households with water source greater than 200 meters away+BBS20110.020
Unsafe drinking waterUSDW% households drinking water from an open source+BBS20110.116
Un-hygienic sanitation conditionsUSC% households without hygienic sanitation facilities+BBS20110.101
Land resourcesLand use intensityLUILand use intensity+USGS20180.045
Land degradationLDPerceived land degradation index +Survey 20180.067
Soil organic matterSOMAverage organic matter content of soil (%)-SRDI20130.046
Soil phosphorusSPAverage phosphorus content in soil (µg/gm)-SRDI20130.040
Agricultural practicesMarginalized farm holdingsMFHFarm holding operating on 0.05 to 0.49 acre of land+BBS20110.040
Arable landAL% net cultivated land to total land+BBS20110.066
Fish-culture areaFCA% land utilized for inland fish farming+BBS20110.050
Rain-fed crop areaRCACropland not under irrigation facilities+BBS20110.078
Livestock potentialLPOwnership of livestock (no./household)+BBS20110.070
Crop diversity indexCDIComputation of CDI (Shannon diversity index) b-BBS20110.050
Gross agri. productionGAPPer capita annual GAP (m.ton) b+BBS20110.066
Productivity of ricePoRAverage yield of rice (ton/ha) in last 5 years-BBS2011–20150.060
Adaptive capacityHuman capitalLiteracy rateLRLiteracy rate of 7+ population+BBS20110.039
Youth educationYEYouth education enrollmet rate (%)+BBS20110.042
Economically active populationEAP% population employed in different sectors+BBS20110.049
Female work participationFWP% female population engaged at non-home workplace+BBS20110.030
Financial capitalIncome diversification indexIDINegative Herfindahl index of income diversification+BBS20110.053
Foreign remitterFR% households receiving foreign remittances+BBS20110.030
Access to farm credit AFC% households having received a loan from different sources +BBS20110.045
Share of agricultural GDPSAGDP% households with income come from agricultural sector+BBS20110.039
Dependence on agricultureDoA% households with main income dependent on agriculture -BBS20110.015
Social and institutional capitalFarmers associationsFAs% population member of a cooperative society+BBS20110.030
Agricultural marketsAgMNo. of agricultural markets per 1000 farm households+BBS20110.024
Density of schoolsDoSNo. of schools per 10,000 population+BBS20110.039
Density of healthcare facilitiesDoHCNo. of healthcare facilities per 10,000 population+BBS20110.053
Rehabilitation supportRhS% households receiving financial/rehabilitation support +BBS20110.019
Physical capitalStructurally sound housesSSH% houses with disaster-resistant construction +BBS20110.036
Emergency sheltersESCyclone and flood emergency shelters (no./10,000 population)+BBS20110.030
Road networkRNRoad density (meter/ha)+BBS20110.059
Share of embankments/damsSoE% total embankments constructed in a district +BBS20110.047
Rural electrificationRuE% rural households connected to electrical grid+BBS20110.053
Use of mobile phonesUoMP% households with mobile phone+BBS20110.018
Natural capitalOpen water bodiesNWB% area covered by rivers and other water bodies+USGS20180.020
Natural forestsNF% area under natural forests+BBS20110.022
Land potentialLPPer capita land potential (total land/total population)+BBS20110.031
Use of agro-technologyAdoption of improved crop variety AoICV% rice field cultivated with HYV seed+BBS20110.039
Use of fertilizer UoFFertilizer application rate (m.ton/ha)-BBS20110.029
Use of pesticide UoP% cropland sprayed with pesticides-BBS20110.030
Irrigation pumpIP% area under irrigation facilities+BBS20110.032
Crop harvester/thresherCHTNo. of harvesters/threshers per 100 farm households +BBS20110.027
Use of bio-gasUoBG% households using biogas for cooking +BBS20110.020
HR = Hypothesized relationship between the indicator and vulnerability dimensions; TP = Time Period; BMD = Bangladesh Meteorological Department; BBS = Bangladesh Bureau of Statistics; SRDI = Soil Resources Development Institute; HYV = High Yielding Variety; a See detailed methodology in Barua et al. 2016; b See detailed methodology in supplementary information; * [64] Alamgir et al. 2019.
Table 2. Key factors of spatially heterogeneous vulnerability.
Dimension Element Indicator F ValueSig. Level
Exposure Disaster eventsRiver bank erosion15.5070.000
Cyclone hazard5.1670.009
Drought intensity8.8040.001
SensitivityHealth Infant mortality rate2.5480.086
Distance to a water source 2.9430.059
Unhygienic sanitation condition2.9510.058
Land resourcesLand degradation3.3660.040
Soil phosphorus6.7360.003
Agricultural practicesRainfed agricultural land2.9400.059
Productivity of rice3.3870.039
Adaptive capacity Physical capitalStructurally sound housing 4.0500.022
Emergency shelter 4.7260.013
Natural capitalOpen waterbody5.3160.008
Use of agro-technologyImproved crop variety2.5780.082
Use of pesticide4.2190.019
Irrigation pump use2.9400.059

