Article

Influence of Iron on Cytotoxicity and Gene Expression Profiles Induced by Arsenic in HepG2 Cells

1
Key Laboratory of Integrated Regulation and Resource Development on Shallow Lakes of Ministry of Education, College of Environment, Hohai University, Nanjing 210098, China
2
State Key Laboratory of Pollution Control and Resource Reuse, School of the Environment, Nanjing University, Nanjing 210023, China
*
Author to whom correspondence should be addressed.
Int. J. Environ. Res. Public Health 2019, 16(22), 4484; https://doi.org/10.3390/ijerph16224484
Submission received: 19 October 2019 / Revised: 11 November 2019 / Accepted: 12 November 2019 / Published: 14 November 2019
(This article belongs to the Special Issue Metal Exposure and Health Risk Assessment)

Abstract

:
The toxicity of arsenic (As) could be influenced by many environmental factors and elements. Iron (Fe) is one of the elements that could be involved in As-induced toxicity. In this study, the interactive effects of Fe and As in HepG2 cells were analyzed based on cytotoxicity and transcriptomic analyses. The results showed that Fe could decrease cell viability and increase mitochondrial depolarization induced by As exposure. Oxidative stress and damage have been proven to be one of the main mechanisms of As toxicity. Our results showed that Fe increased the generation of reactive oxygen species (ROS) and lipid peroxidation product malondialdehyde (MDA) induced by As exposure. Microarray analysis further verified that Fe increased the alteration of gene expression and biological processes related to oxidative stress, cell proliferation, and the apoptotic signaling pathway caused by As exposure. Both results of cytotoxicity and transcriptomic analyses suggest that an increase of Fe in the human body could increase the As-induced toxicity, which should be considered during the health risk assessment of As.

1. Introduction

Arsenic (As) exposure is a worldwide public health concern [1]. Epidemiological studies and clinical observations indicate that As exposure is associated with an increased incidence of human cancer of the skin, liver, kidney, lung, prostate, and urinary bladder [2,3,4]. Besides the carcinogenic effect, epidemiological studies in highly exposed populations have also revealed strong links between arsenic exposure and skin lesions, hypertension, cardiovascular disease, diabetes, and respiratory disease [5,6,7,8]. Recently, the influence of other elements on As-toxicity has received more and more attention, which could change the real risk of As exposure in the environment. For example, vitamins, fruit, tea, glutathione, N-acetylcysteine, and zinc could reduce As-induced toxicity by increasing antioxidative enzymes to antagonize oxidative stress caused by As and/or increasing As methylation [9,10,11,12,13]. Similar interactive effects could also be found in other metals [14].
Iron (Fe) is a common element in the environment and human biological system, which is generally considered to have no toxic effects on humans. However, some researchers have found that Fe could be involved in As-induced oxidative damage and toxicity [15,16]. Oxidative stress has been proposed as a main mechanism of As toxicity [17,18]. The As species in the human body can cause Fe release from ferritin, which plays an important role in the storage of free Fe [19]. Endogenous free Fe participates in generating harmful oxygen species by Fenton reaction, which can induce oxidative stress and damage. Thus, the combined effects of Fe and As have received attention. When exogenous Fe and As were co-exposed by drinking water, earlier evidence showed that ferrous sulfate could reduce the clastogenic effects of As in mice [20], whereas a recent study revealed different findings—that there was a synergistic interaction between As2O3 and Fe in relation to rat livers [21]. Our previous studies found that Fe in drinking water could decrease As toxicity in mice by the co-flocculation of As and Fe in gastrointestinal tract [22]. However, we also found that the co-exposure of As and Fe induced synergistic effects in the cultural cell line. These results imply that the endogenous Fe in body (tissue) and exogenous Fe in drinking water (and food) could induce different effects on As toxicity. However, mechanisms of the synergistic effect of As and Fe are unclear, which could provide insight for the identification of their interactive effects and human health risk.
In this study, we determined the combined cytotoxicity of As and Fe and their underlying mechanisms in HepG2 cells. Influences of Fe on inorganic As-induced decrease in cell viability, reactive oxygen species (ROS) generation, mitochondrial depolarization, and oxidative damage were investigated by treating with As and Fe alone or in combination for 24 h. The gene expression profiles in HepG2 cells were characterized by cDNA microarray analysis. Combined with the above phenotypic toxicity, bioinformatics analysis was applied to determine the biological meaning of differentially expressed genes to characterize potential mechanisms of the synergistic effects of Fe and As.

2. Materials and Methods

2.1. Cell Culture and Treatment

Human hepatoma cell line HepG2 obtained from KeyGEN Biotech (China) was maintained in high glucose Dulbecco’s modified eagles medium (DMEM) with 10% sterile fetal bovine serum (FBS) under standard cell culture conditions (37 °C, and 5% CO2). Before being treated with As and Fe, HepG2 cells (10–18 passage) at a density of 10,000 cells per well were allowed to attach in 96-well plates for 24 h. Then, the HepG2 cells were exposed to As and/or Fe in DMEM medium for 24 h, and were used for further analyses. The exposure concentrations of As and Fe were set to 20 μM and 100 μM, respectively, which were based on their actual blood or urinary concentrations and reported effect concentrations [22,23]. Arsenic oxide was obtained from NSI Solution Inc. (Raleigh, NC, USA). Ferric chloride was obtained from Sigma Chemical Co. (St.Louis, MO, USA).

2.2. Cytotoxicity Test

Cell viability was determined by CCK-8 (Dojindo Molecular Technologies, Inc. Kumamoto, Japan). After As and/or Fe exposure, 10 μL of CCK-8 solution was added into each well of the 96-well plate. Then, the plate was incubated for 2 h at 37 °C. Spectrophotometric measurements were performed in a microplate reader (Synergy H1, BioTek, Winooski, VT, USA) at a wavelength of 450 nm. Based on the absorbance, the cell viability in the treated group was expressed as the percentage of viable cells compared with that of untreated control cells.

2.3. Mitochondrial Membrane Potential Assay

Mitochondrial membrane potential was analyzed by JC1 kit (KeyGEN, Nanjing, China). The JC1 is a lipophilic cationic probe which can enter into the mitochondria, where it accumulates and starts forming reversible complexes called J aggregates. The J aggregates exhibit excitation and emission in the red spectrum, which is different from the green spectrum of the JC1 molecule. In this study, after exposure, 50 μL JC1 solution (final concentration was 20 nM) was added into each well of the 96-well plate. The plate was incubated for 25 min at 37 °C. Then cells were washed twice with PBS buffer and analyzed on a microplate reader (Synergy H1, BioTek, Winooski, VT, USA) at two groups of fluorescence: green (excitation wavelength: 485 nm and emission wavelength: 530 nm) and red (excitation wavelength: 530 nm and emission wavelength: 590 nm). Mitochondrial membrane potential was determined by the ratio of red to green fluorescence intensity. A decrease in the ratio indicated mitochondrial depolarization, which participates in the induction of the apoptotic signaling pathway.

2.4. Oxidative Stress Analysis

Intracellular ROS were measured by DCFH-DA (molecular probes). DCFH-DA can passively enter the cell and hydrolyze to form DCFH, which is a nonfluorescent molecule and can be oxidized to fluorescent dichlorofluorescein (DCF) by cellular oxidants. During DCF assay, Hoechst 33342 (YeaSen Bio-technology, Shanghai, China) was used as a proxy measurement for the number of HepG2 remaining in each well. After Fe and/or As exposure, 50 μL DCF (final concentration 10μM) was added into each well of 96-well plate. After incubating for 25 min at 37 °C, the cells were washed twice with PBS. Then, 100 μL Hoechst 33342 (5 μg/ml) was added into each well. After incubating for 15 min at 37 °C, the cells were washed by PBS again and measured using a microplate reader (Synergy H1, BioTek, Winooski, VT, USA). The excitation and emission wavelength for DCF were 485 nm and 530 nm, respectively. The excitation and emission wavelengths for Hoechst 33342 were 350 nm and 460 nm, respectively. The fluorescence values of DCF were normalized by Hoechst fluorescence values in the same well to avoid test error due to the loss of cell numbers during the exposure experiment.
The oxidative stress and damage of cells was further determined by the measurement of superoxide dismutase (SOD) and lipid peroxidation product malondialdehyde (MDA). A total of 107 cells were collected by trypsinization, followed by homogenization and centrifugation at 3000 rpm for 5 min, and the supernatant was used for various estimations. The SOD activity and MDA level were measured using commercial kits (Jiancheng, Nanjing, China), which were determined by the absorbance of the microplate reader at a wavelength of 450nm and 532 nm, respectively. Then, the SOD activity and MDA level were expressed as U/mg protein and nmol/mg protein, respectively. The protein concentration was determined by using the Coomassie Brilliant Blue method (Jiancheng, Nanjing, China). Each experiment was performed in triplicate.

2.5. Microarray Analysis

Gene expression analysis was conducted by the cDNA Microarray. Total RNA extraction was performed using the Takara RNA Kit (Takara Biotechnology, Tokyo, Japan) and the quantity of total RNA was determined by a NanoDrop 2000. The cDNA synthesis was carried out in a 10 μL reaction solution containing 500 ng RNA and reverse transcription mix (Invitrogen, Waltham, MA, USA). The synthesized cDNA generated from the total RNA was fragmented and labeled using the Affymetrix GeneChip® WT Terminal Labeling kit, then hybridized to an Affymetrix GeneChip PrimeView Array (Affymetrix, Santa Clara, CA, USA) and scanned using an Affymetrix GeneChip Scanner 7G [24]. Microarray data quality analysis was performed using Affymetrix Expression Console software. Probe sets labeled as control were excluded from further analysis. The associated p-values for moderated t-statistics were adjusted using the false discovery rate (FDR) method due to multiple hypotheses testing. Differentially expressed genes (DEGs) were analyzed by function and pathway analysis using DAVID 6.7 (http://david.abcc.ncifcrf.gov/tools.jsp) to interpret their biological meaning. Altered biological pathways and processes were identified by mapping DEGs into the Gene Ontology (GO) database (http://www.geneontology.org) and the Kyoto Encyclopedia of Genes and Genomes (KEGG) pathway database (http://www.genome.ad.jp/kegg/pathway.html).

2.6. Real-Time Quantitative PCR (qPCR)

qPCR was applied to verify the results from cDNA microarray analysis based on the MIQE guidelines. First, cDNA was synthesized from 1 μg of total RNA with the Superscript III Reverse Transcriptase (Invitrogen) using random hexamers. The qPCR reactions were carried out on a Corbett Real-Time PCR Machine with the Platinum Taq DNA Polymerase (Invitrogen). The amount of template was quantified with SYBR Green (Invitrogen). The thermocycling regime was 95 °C for 2 min, followed by 40 cycles of 95 °C for 15 s, 54–55 °C for 30 s, and 72 °C for 30 s. Relative levels of target mRNA normalized to β-actin mRNA were calculated based on the 2−∆∆Ct method. The primer sequences used in this study are given in Table 1.

2.7. Statistical Analysis

The data were analyzed using the GraphPad Prism 6.0 software (GraphPad Software, San Diego, CA, USA). Statistical differences were evaluated using the one-way analysis of variance (ANOVA) test, followed by Tukey’s post hoc test. The homogeneity and normality of variance were determined by the Brown–Forsythe test and D’Agostino–Pearson test, respectively. Results were expressed as means ± standard deviation (SD). A p-value < 0.05 was considered statistically significant.

3. Results and Discussion

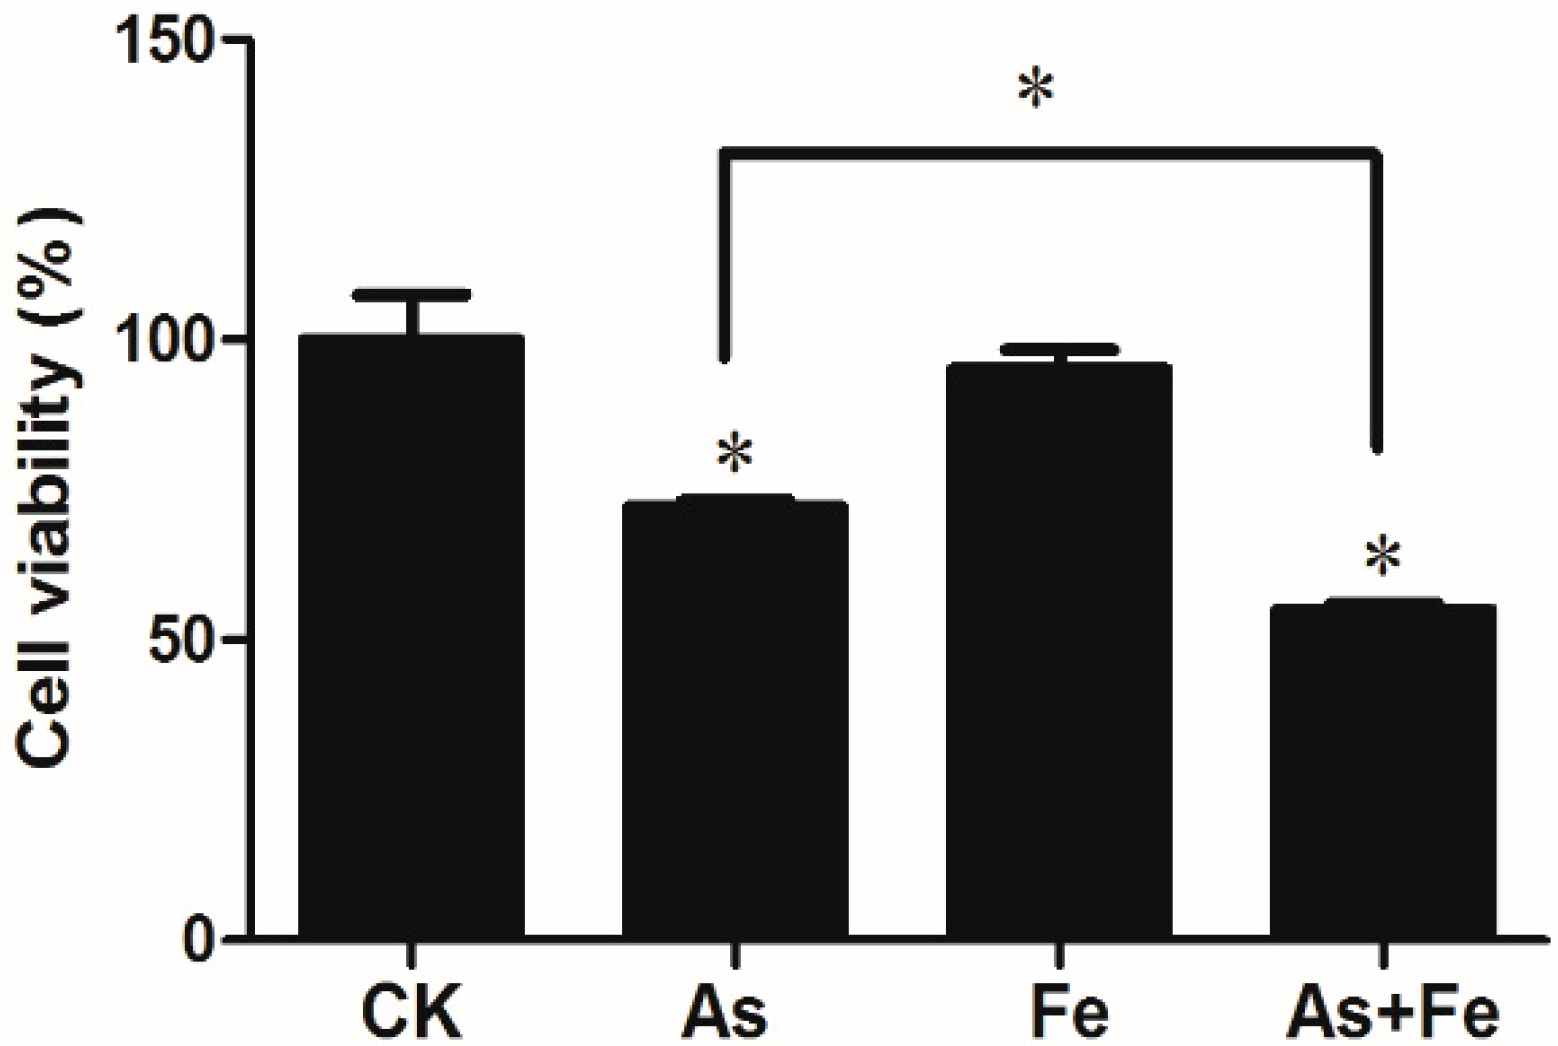
3.1. Cytotoxicity of As and Fe in HepG2

Liver is a target organ of arsenic carcinogenesis [25]. Thus, the human hepatoma HepG2 cell line was chosen to evaluate the combined toxicity of As and Fe. Results are shown in Figure 1; 100 μM Fe did not cause a significant decrease in cell viability in HepG2, but the cell viability of HepG2 exposed to 20 μM As was 72%, indicating As induced the cytotoxicity in HepG2 cells. This result is consistent with the previous report on other human lung cells [26]. When HepG2 cells were co-exposed to As and Fe, the cell viabilities were dramatically reduced to 55%, which was significantly lower than the effects of As alone exposure. The results showed the Fe at non-toxicological concentration could significantly increase the As toxicity, indicating the synergistic effects of As and Fe in in vitro cell lines.

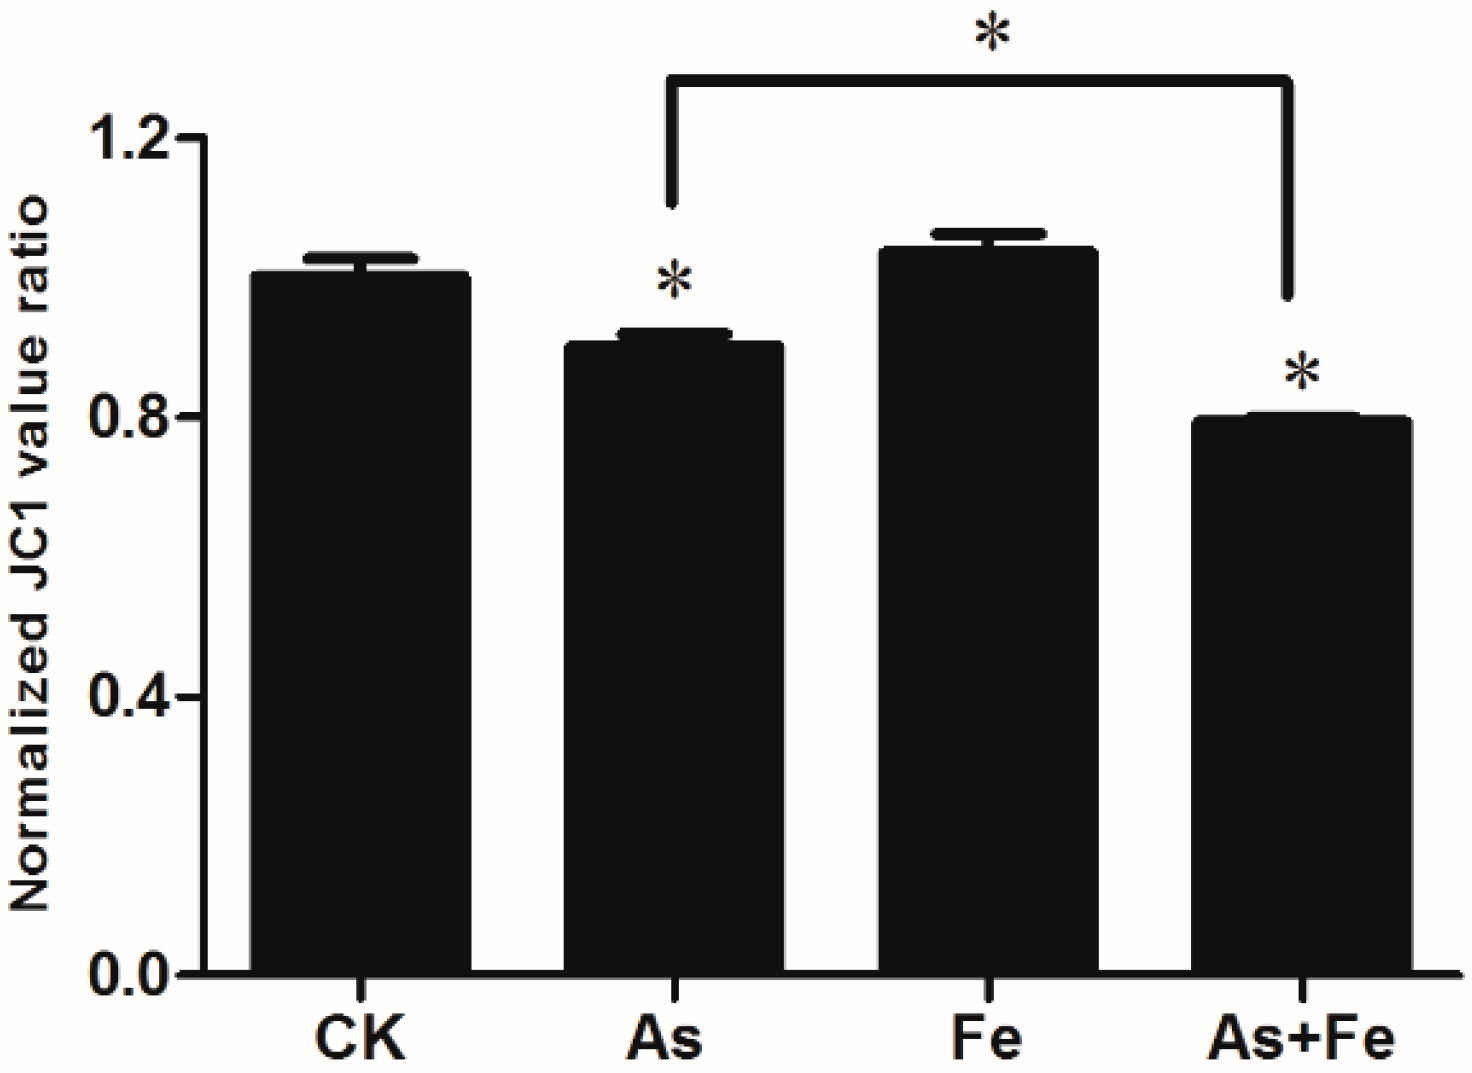
3.2. Changes in Mitochondrial Membrane Potential Induced by As and Fe in HepG2 Cell

Mitochondrial membrane potential in HepG2 exposed to As and/or Fe was determined by the red/green fluorescence intensity ratio of JC1. The exposure of 20 μM As alone caused a significant decrease in red/green ratios, indicating mitochondrial depolarization (Figure 2). This result is consistent with the reports from previous literature. For example, Kang et al [27] found that after exposure to As2O3, mitochondrial apoptotic cell death happened in human cervical cancer cells. Jiang et al [28] revealed that As2O3 inhibits cell growth and induces apoptotic process in gastric cancer cells, involving p53 over-expression and activation of caspase-3. The exposure of 100 μM Fe did not cause changes in mitochondrial membrane potential, but 100 μM Fe could significantly increase the As-induced mitochondrial depolarization, which suggests a synergetic toxic effect.

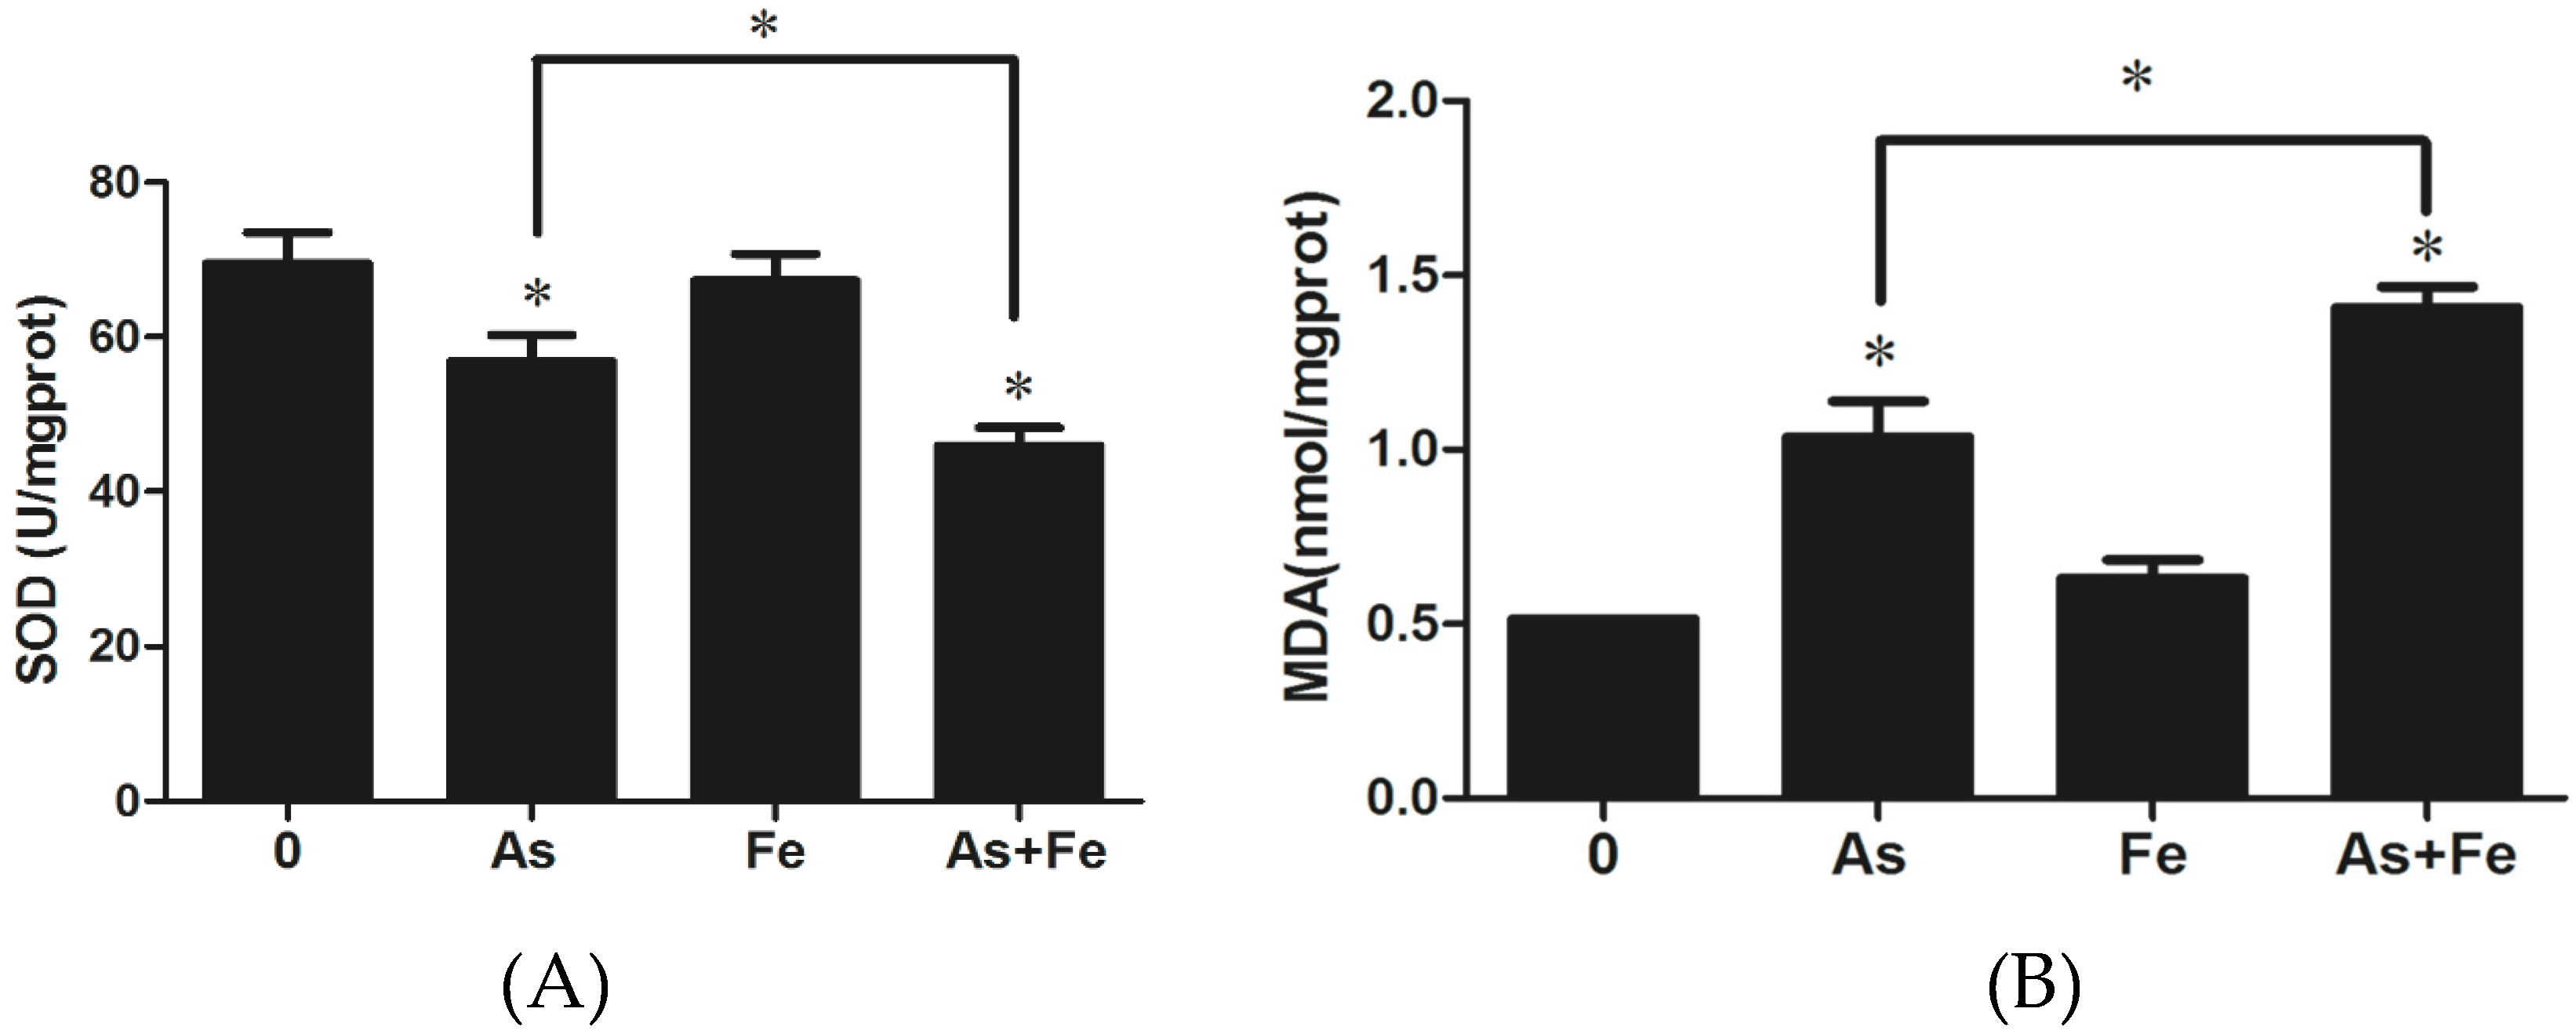
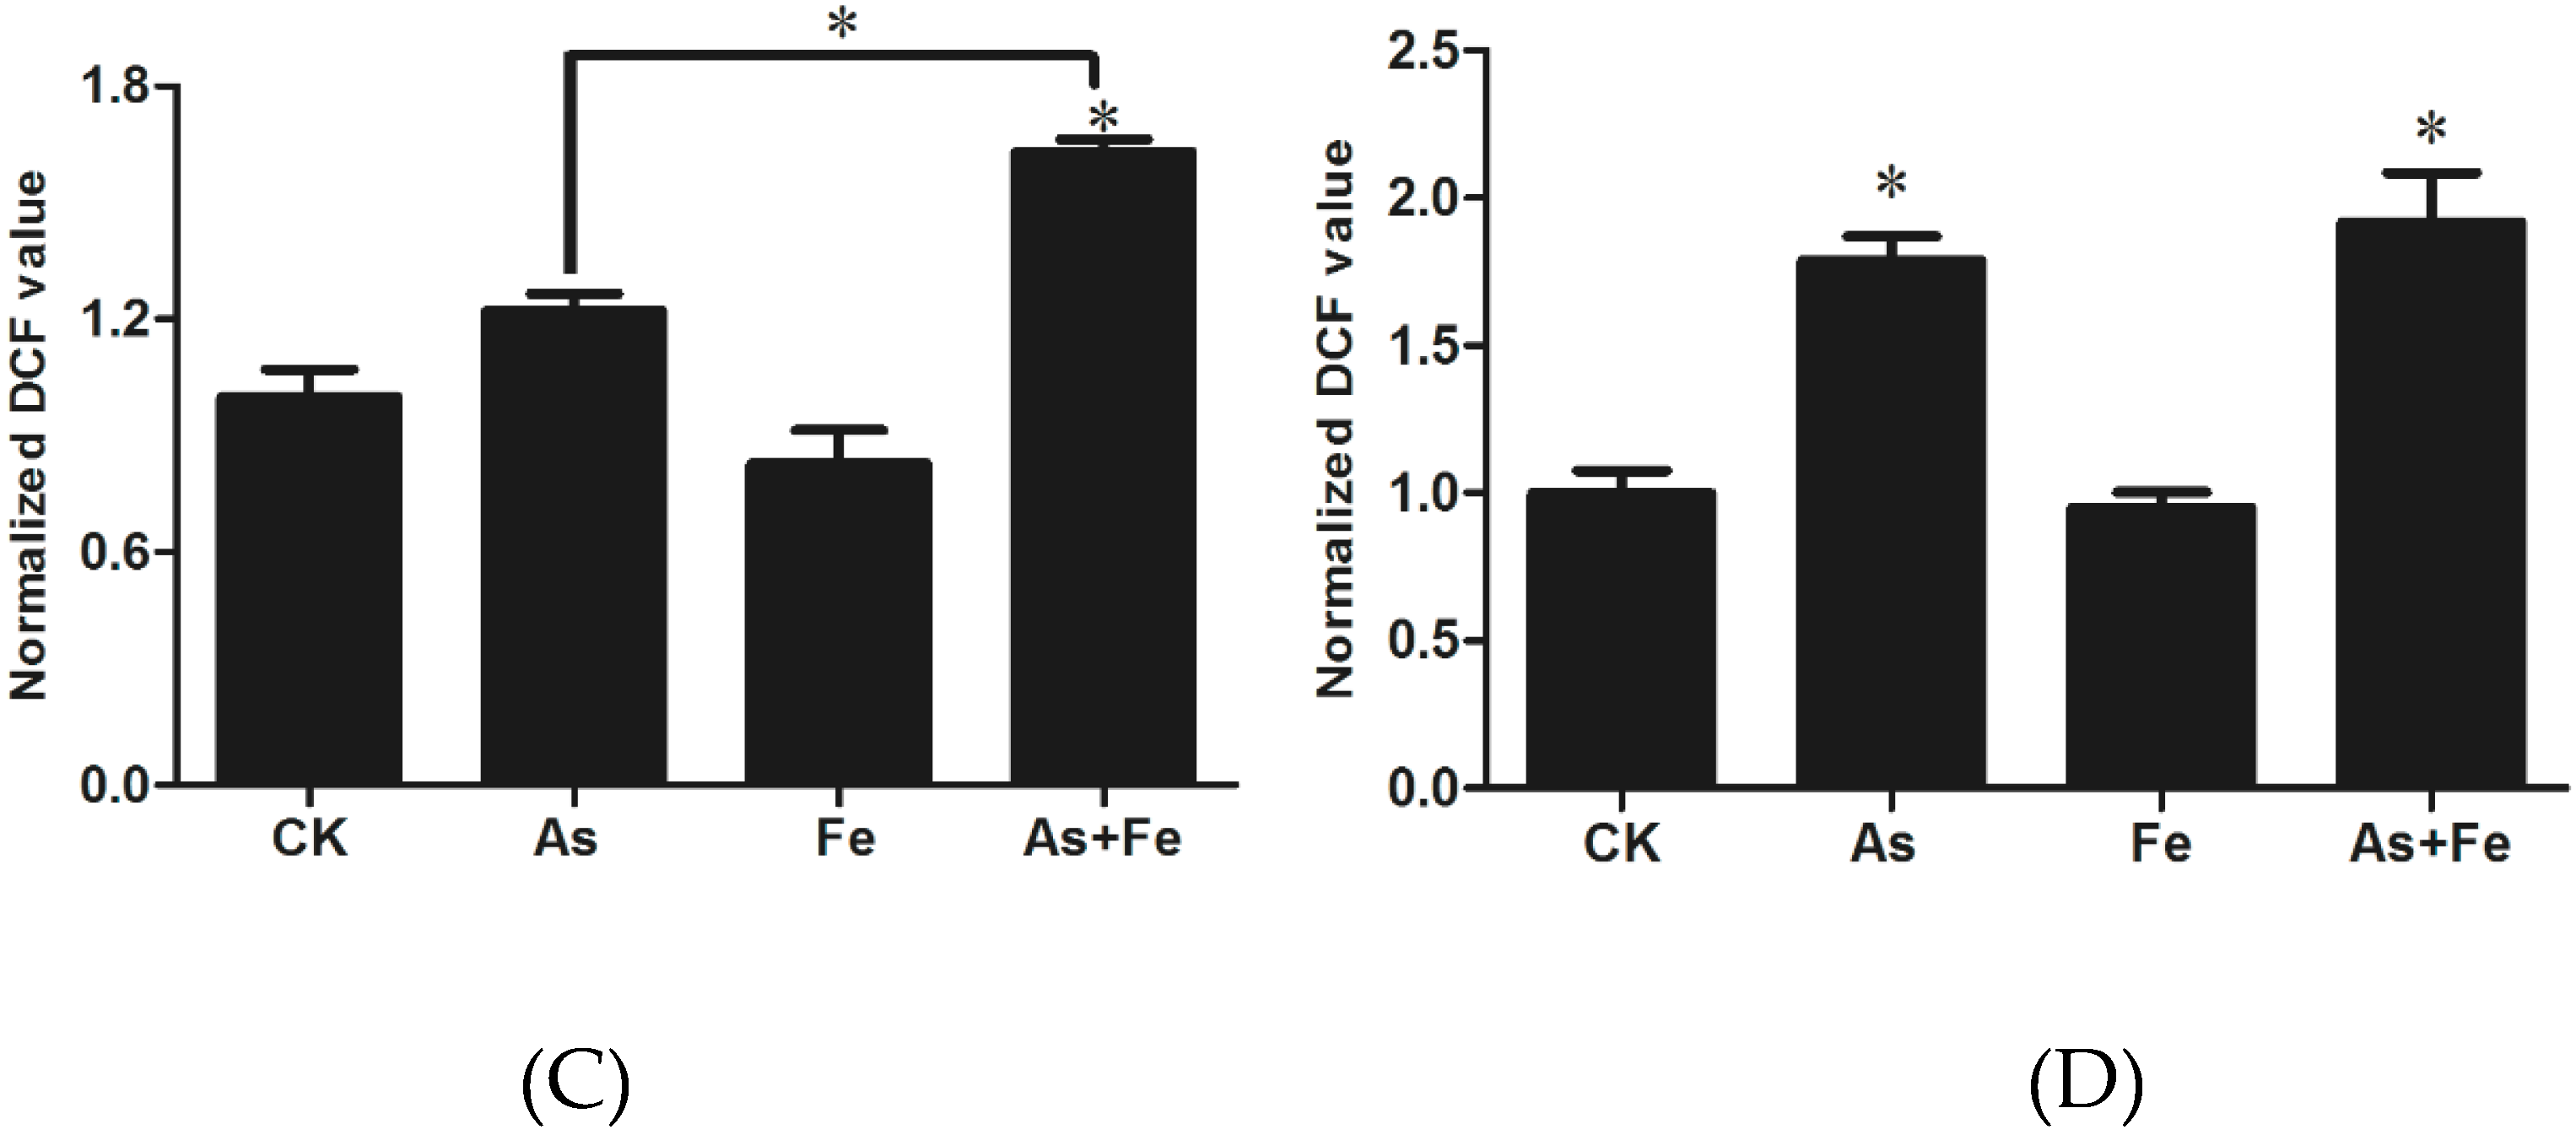
3.3. Determination of Oxidative Stress and Damage in HepG2

To determine the intracellular oxidative stress and damage, SOD activity and MDA level were measured (Figure 3). Interestingly, the 20 μM As treatment significantly increased MDA level, but a significant decrease in SOD activity was observed under the same treatment. Fe supplementation in the As group significantly increased the production of MDA by 35.8% compared to the As alone group, while SOD activity was further suppressed when 100 μM Fe was added, indicating that Fe might play an important role in the oxidative damage caused by As. Growing evidence has shown that ROS generation associated with As exposure plays a fundamental role in the induction of adverse health effects and disease [17,29,30]. After ROS generation, their effect can be balanced by the antioxidants. One of the most effective intracellular enzymatic antioxidants is SOD. If SOD cannot effectively eliminate the ROS, elevated ROS can result in an attack of cellular components involving polyunsaturated fatty acid residues of phospholipids, and the final product of the peroxidation process is MDA [31]. Our results provide direct evidence that Fe can reduce the activity of antioxidants and increase the oxidative damage caused by As exposure in HepG2 cells.
In order to validate the above results, we further measured intracellular ROS generation in HepG2 cells. After exposure to 20 μM As, intracellular ROS in HepG2 was significantly increased (Figure 3). When As (20 μM) and Fe (100 μM) were co-exposed to HepG2, compared with the exposure of As alone, no significant difference was found (p < 0.05). Since the 20 μM As significantly decreased cell viability, which can influence the measurement of intracellular ROS levels, low As and Fe exposure concentrations were also applied to better characterize their combined effects. When the exposure concentrations of As and Fe were 2 μM and 50 μM, respectively, Fe significantly increased the ROS level induced by As, indicating that the oxidative stress of As was increased by Fe.

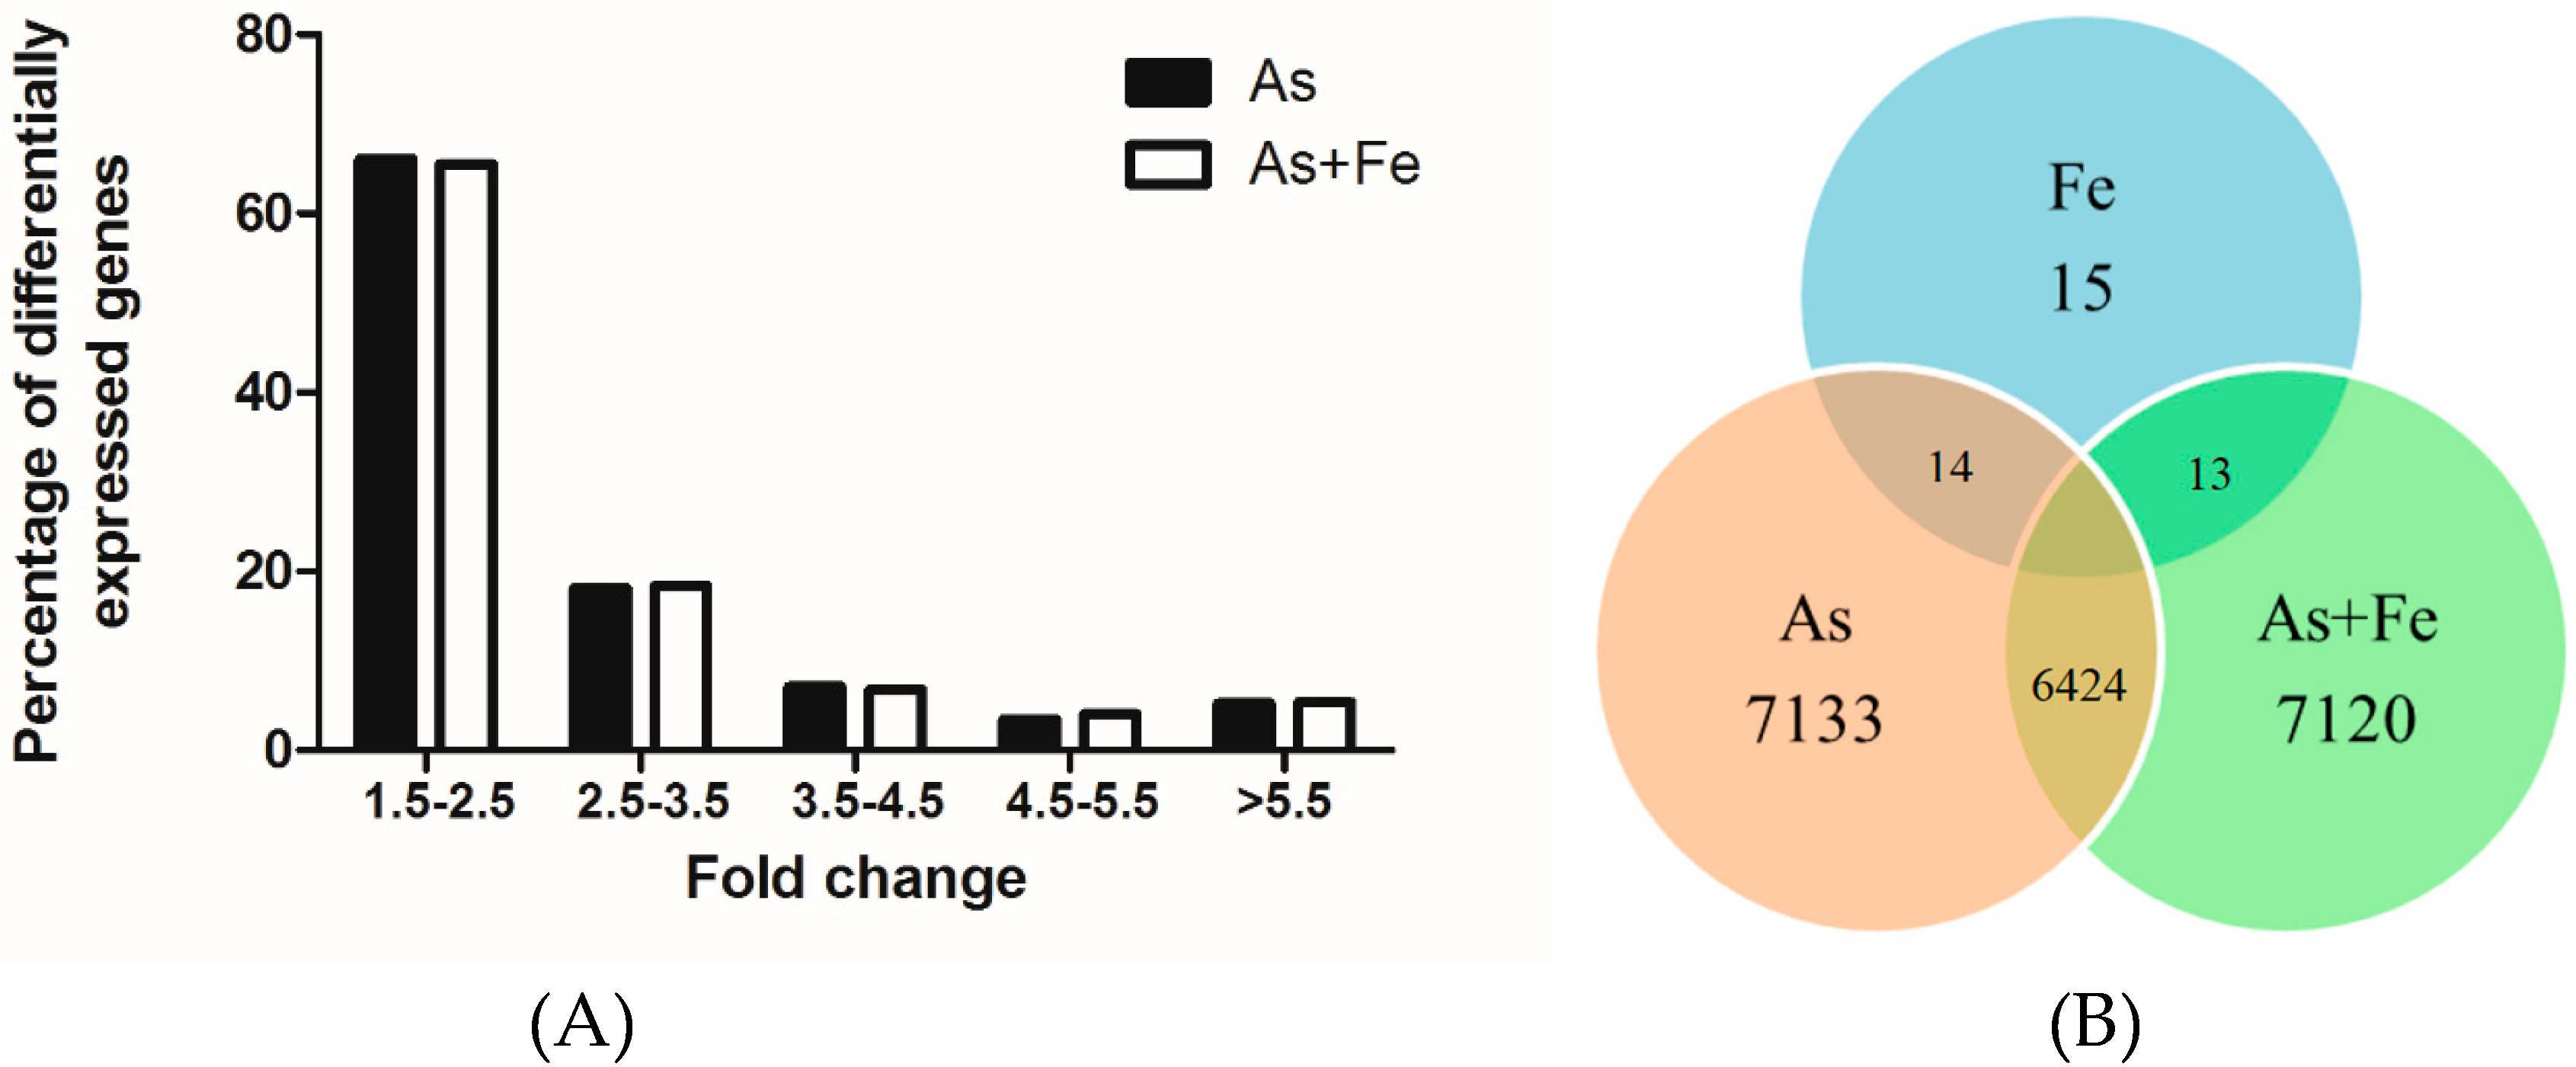
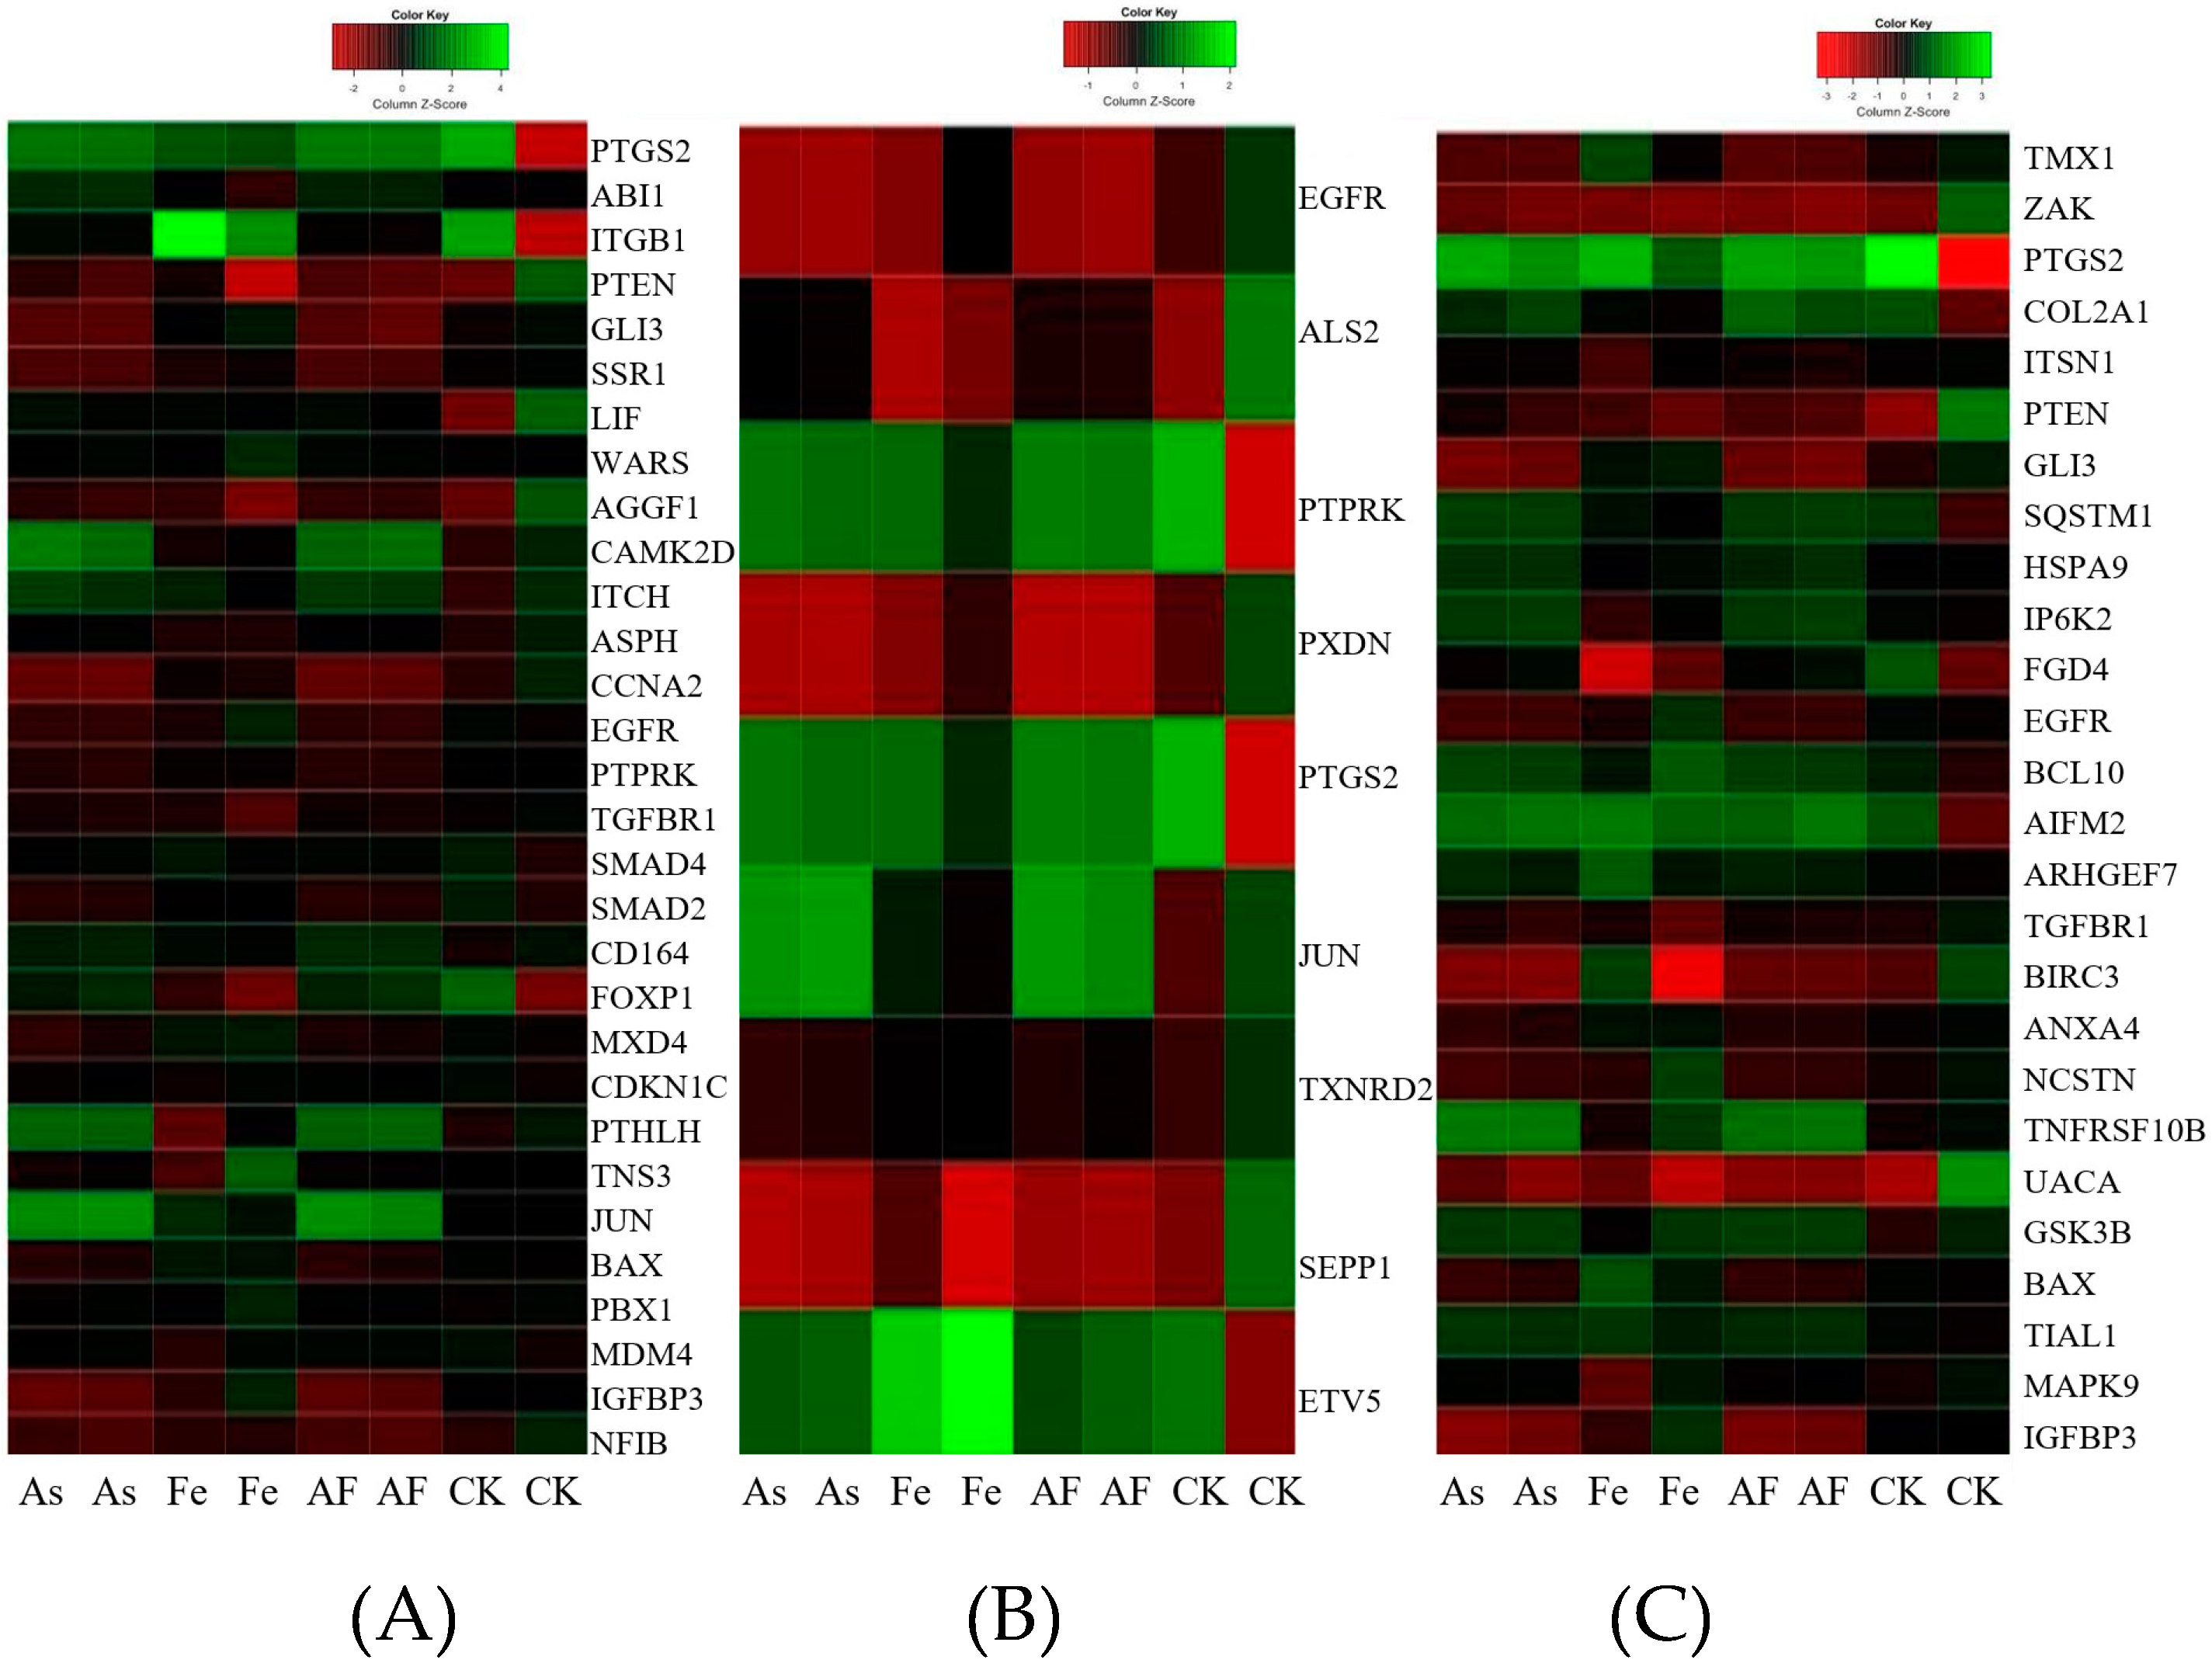
3.4. Gene Expression Profiles in HepG2 Exposed to As and Fe

Gene expression profiles in HepG2 cells exposed to 20 μM As and/or 100 μM Fe were analyzed using cDNA microarray. The criteria were that p-values less than 0.05 and fold change higher than ±1.5 were used to identify the DEGs. A total of 7133, 15, and 7120 DEGs were found in As, Fe, and As + Fe groups, respectively. Figure 4A shows the distribution of DEGs within different ranges of fold change. Most DEGs were located in the ranges of 1.5–2.5 fold and 2.5–3.5 fold. The commonality of DEGs among three groups is shown in Figure 4B, which indicates that the DEGs in As and As + Fe groups were very similar. Furthermore, qPCR was used to check the validity of microarray results. Three typical genes (Ptgs2, Tgfbr1, Sqstm1) related to oxidative stress, cell proliferation, and apoptotic signaling pathways were chosen. The results are shown in Table 2. Fe exposure significantly increased the fold change of these gene expressions compared with exposure to As alone, which was in accordance with the results of cDNA microarray.
In order to focus on the significantly altered biological processes, stricter criteria for DEGs of fold change > 3.0 and p-value < 0.001 were applied. Following these criteria, no genes were identified as DEG in the Fe group. A total of 2122 and 2121 DEGs were determined in the As and As + Fe groups, respectively. Based on the number of DEGs, exposure of As alone and combined As and Fe caused similar gene expression profiles. The biological significances of these DEGs were determined using DAVID 6.7 based on the KEGG database. Significantly changed KEGG pathways were identified on the basis of criteria that had three or more DEGs, together with a p-value less than 0.05. A total of 16 pathways and 20 biological processes were found in the As and As + Fe groups, respectively (Table 3), including signal transduction, nucleotide metabolism, and biosynthesis of steroids.

3.5. Comparative Analysis of Toxicity in HepG2 Exposed to As Alone and Combined As and Fe

To concentrate on the influence of Fe on As toxicity, the ratio of fold change was adopted (As + Fe group to As group). A total of 429 genes were identified as DEGs with ratio > 1.5 and p-value < 0.05. KEGG annotation showed that the 429 DEGs were classified into nine function categories, including the Wnt signaling pathway and p53 signaling pathway, which indicates that the addition of Fe can strengthen the abnormity caused by As in signaling pathway. The GO analysis showed that these DEGs mainly participate in the regulation of cellular response to stress (GO:0033554), response to oxidative stress (GO:0006979), cell proliferation (GO:0042127), and regulation of apoptosis (GO:0042981) (Figure 5).

3.6. Inhibition of cell Proliferation

Plenty of studies have demonstrated that As exposure possesses the potential to influence in vitro cell proliferation by modulating several pathways, such as the MAPK-Erk, Smad, and Forkhead pathways [32,33,34,35]. Compared to the As alone group, a total of 30 DEGs in the As + Fe group were found to be involved in this process (Figure 5A). Of these DEGs, Egfr is a tyrosine kinase transmembrane receptor that regulates important processes in carcinogenesis, including cell proliferation. It has been suggested that As could activate ERK in PC-12 cells by binding to the cysteine-rich domains of Egfr [36]. Simeonova [37] found that As could induce ligand-independent Egfr phosphorylation and activation in UROtsa cells. Moreover, the gene Smad2 was also found to be changed. Ten Dijke et al [38] found that the TGF-β/Smad pathway induced growth inhibitory and apoptotic responses. Sengupta [39] found that Smad2 might have an involvement as a transcription factor for TGF-β induced cell cycle progression. These 30 DEGs in the As + Fe group indicated that the addition of Fe further increased the changes in cell proliferation caused by As exposure at transcriptomic level. Cell viability analysis provided the phenotypic results that Fe increased As toxicity on cell proliferation (Figure 1). The 30 DEGs and relevant biological pathways in the As + Fe group might be one of the reasons that Fe decreased the cell viability induced by As.

3.7. Oxidative Stress and Damage

Compared to exposure to As alone, the addition of Fe further increased the alteration of biological processes related to oxidative stress. A total of nine DEGs (Als2, Ptprk, Pxdn, Ptgs2, Jun, Txnrd2, Sepp1, Egfr, and Etv5) were involved in this process in the As + Fe group (Figure 5B). Of these DEGs, some genes need to be paid more attention for their special interaction with ROS. For example, Lee et al [40] found that homocysteine enhanced Ptgs2 expression in murine macrophages by ROS. He et al [41] also found that chronic As exposure in human bronchial epithelial cells induced Ptgs2 expression through HIF-1 regulation. Txnrd2 is a mitochondrial enzyme which is critically involved in the removal of ROS and maintenance of intracellular redox balance, it is also linked to the mitochondrial respiratory chain [42]. Furthermore, at transcriptomic level, the changes to the Wnt signaling pathway and p53 signaling pathway caused by As exposure have been proven to be related to oxidative stress [43,44]. Thus, further alterations of these signal transduction pathways (As + Fe group versus As group) might be due to the increase in cellular ROS. Based on the above results, we can deduce that Fe could increase the oxidative stress and damage caused by As. The results are verified by the SOD, MDA, and DCF analysis (Figure 3). Moreover, during cDNA microarray analysis, it is very interesting that no difference was found between the As and As + Fe groups in the numbers of DEGs (Figure 4). Based on the results from the ROS assay, this might be due to the dose of As (20 μM) being so high that the influence of Fe on As toxicity could be partly covered at transcriptomic level.

3.8. Apoptotic singaling Pathway

Apoptosis is considered a vital component of various processes, including normal cell turnover, proper development and functioning of the immune system, hormone-dependent atrophy, embryonic development, and chemical-induced cell death [45]. A total of 26 DEGs (As + Fe group versus As group) were found to be involved in the process of regulation of the apoptotic signaling pathway (Figure 5C). Of the 26 DEGs, the gene Sqstm1 contributes to the capacity of physiological mitochondrial function and a cell to defend itself against chemical/oxidative stress [46,47]. Auberger [48] reported that As2O3 treatment affected the expression of Sqstm1 of CML cells, indicating the crucial role of autophagy in the effect of As2O3. In this study, we found the gene Sqstm1 was significantly up-regulated in the As group, and the addition of Fe further increased its fold change (Table 2), indicating that Fe increased the alteration of apoptotic signaling pathways caused by As at transcriptomic level. Results of the JC1 assay further verified the result (Figure 2). Growing evidence has shown that ROS contribute to changes in the apoptotic signaling pathway by triggering the death receptor, regulating nitricoxide (NO:) and affecting mitochondria function [49,50]. Therefore, we deduced that the adverse effects of Fe on the increased As-induced apoptotic signaling pathway might be due to the increase of intracellular ROS.

4. Conclusions

This study showed the influence of Fe on As toxicity by in vitro assay. Our data show that Fe could decrease cell viability caused by As exposure, and increase As-induced ROS and mitochondrial depolarization. The microarray analysis further verified that Fe increased the alteration of gene expression and biological processes related to oxidative stress, cell proliferation, and apoptotic signaling pathway caused by As exposure. The increase in ROS levels under the co-exposure of As and Fe might be the important pathway where Fe increases As toxicity. In a word, an increase in endogenous Fe in the human body (or tissue) could increase the As-induced toxicity, which should be considered during the risk assessment of As.

Author Contributions

Y.W. and B.W. designed the experiments. Y.L. and S.L. performed the experiments and analyzed the data. All authors wrote and revised the manuscript.

Funding

This research was funded by the Fundamental Research Funds for the Central Universities [grant number: 2018B57214]; State Key Laboratory of Pollution Control and Resource Reuse Foundation [grant number: PCRRF17028] and the Priority Academic Program Development of Jiangsu Higher Education Institutions.

Conflicts of Interest

The authors declare no conflict of interest.

References

  1. Naujokas, M.F.; Anderson, B.; Ahsan, H.; Aposhian, H.V.; Graziano, J.H.; Thompson, C.; Suk, W.A. The broad scope of health effects from chronic arsenic exposure: Update on a worldwide public health problem. Environ. Health Perspect. 2013, 121, 295–302. [Google Scholar] [CrossRef]
  2. Smith, A.H.; Steinmaus, C.M. Health effects of arsenic and chromium in drinking water: recent human findings. Annu. Rev. Public Health 2009, 30, 107–122. [Google Scholar] [CrossRef] [PubMed]
  3. Benbrahim-Tallaa, L.; Waalkes, M.P. Inorganic arsenic and human prostate cancer. Environ. Health Perspect. 2008, 116, 158–164. [Google Scholar] [CrossRef] [PubMed]
  4. Yoshida, T.; Yamauchi, H.; Sun, G.F. Chronic health effects in people exposed to arsenic via the drinking water: Dose-response relationships in review. Toxicol. Appl. Pharmacol. 2004, 198, 243–252. [Google Scholar] [CrossRef] [PubMed]
  5. Tsuji, J.S.; Perez, V.; Garry, M.R.; Alexander, D.D. Association of low-level arsenic exposure in drinking water with cardiovascular disease: A systematic review and risk assessment. Toxicology 2014, 323, 78–94. [Google Scholar] [CrossRef] [PubMed]
  6. Maull, E.A.; Ahsan, H.; Edwards, J.; Longnecker, M.P.; Navas-Acien, A.; Pi, J.; Silbergeld, E.K.; Styblo, M.; Tseng, C.-H.; Thayer, K.A.; et al. Evaluation of the association between arsenic and diabetes: A national toxicology program workshop review. Environ. Health Perspect. 2012, 120, 1658–1670. [Google Scholar] [CrossRef] [PubMed]
  7. Li, X.; Li, B.; Xi, S.; Zheng, Q.; Lv, X.; Sun, G. Prolonged environmental exposure of arsenic through drinking water on the risk of hypertension and type 2 diabetes. Environ. Sci. Pollut. Res. 2013, 20, 8151–8161. [Google Scholar] [CrossRef]
  8. Chen, Y.; Parvez, F.; Gamble, M.; Islam, T.; Ahmed, A.; Argos, M.; Graziano, J.H.; Ahsan, H. Arsenic exposure at low-to-moderate levels and skin lesions, arsenic metabolism, neurological functions, and biomarkers for respiratory and cardiovascular diseases: Review of recent findings from the Health Effects of Arsenic Longitudinal Study (HEALS) in Bangladesh. Toxicol. Appl. Pharmacol. 2009, 239, 184–192. [Google Scholar]
  9. Herrera, A.; Pineda, J.; Teresa Antonio, M. Toxic effects of perinatal arsenic exposure on the brain of developing rats and the beneficial role of natural antioxidants. Environ. Toxicol. Phar. 2013, 36, 73–79. [Google Scholar] [CrossRef]
  10. McCarty, K.M.; Houseman, E.A.; Quamruzzaman, Q.; Rahman, M.; Mahiuddin, G.; Smith, T.; Ryan, L.; Christiani, D.C. The impact of diet and betel nut use on skin lesions associated with drinking-water arsenic in Pabna, Bangladesh. Environ. Health Perspect. 2006, 114, 334–340. [Google Scholar] [CrossRef]
  11. Sinha, D.; Roy, M.; Siddiqi, M.; Bhattacharya, R.K. Arsenic-induced micronuclei formation in mammalian cells and its counteraction by tea. J. Environ. Pathol. Toxicol. Oncol. 2005, 24, 45–56. [Google Scholar] [CrossRef] [PubMed]
  12. Wang, Y.; Zhao, F. Effects of exogenous glutathione on arsenic distribution and no metabolism in brain of female mice exposed to sodium arsenite through drinking water. J. Environ. Health 2009, 26, 1046–1048. [Google Scholar]
  13. Li, L.; Qiu, P.; Chen, B.; Lu, Y.; Wu, K.; Thakur, C.; Chang, Q.; Sun, J.; Chen, F. Reactive oxygen species contribute to arsenic-induced EZH2 phosphorylation in human bronchial epithelial cells and lung cancer cells. Toxicol. Appl. Pharm. 2014, 276, 165–170. [Google Scholar] [CrossRef] [PubMed]
  14. Tortora, F.; Notariale, R.; Maresca, V.; Good, K.V.; Sorbo, S.; Basile, A.; Piscopo, M.; Manna, C. Phenol-rich Feijoa sellowiana (Pineapple guava) extracts protect human red blood cells from mercury-induced cellular toxicity. Antioxidants 2019, 8, 220. [Google Scholar] [CrossRef] [PubMed]
  15. Paul, P.C.; Misbahuddin, M.; Ahmed, A.N.N.; Dewan, Z.F.; Mannan, M.A. Accumulation of arsenic in tissues of iron-deficient rats. Toxicol. Lett. 2002, 135, 193–197. [Google Scholar] [CrossRef]
  16. Rahman, M.M.; Rahman, F.; Sansom, L.; Naidu, R.; Schmidt, O. Arsenic interactions with lipid particles containing iron. Environ. Geochem. Health 2009, 31, 201–206. [Google Scholar] [CrossRef]
  17. Jomova, K.; Jenisova, Z.; Feszterova, M.; Baros, S.; Liska, J.; Hudecova, D.; Rhodes, C.J.; Valko, M. Arsenic: Toxicity, oxidative stress and human disease. J. Appl. Toxicol. 2011, 31, 95–107. [Google Scholar] [CrossRef]
  18. Del Razo, L.M.; Quintanilla-Vega, B.; Brambila-Colombres, E.; Calderon-Aranda, E.S.; Manno, M.; Albores, A. Stress proteins induced by arsenic. Toxicol. Appl. Pharm. 2001, 177, 132–148. [Google Scholar] [CrossRef]
  19. Ahmad, S.; Kitchin, K.T.; Cullen, W.R. Arsenic species that cause release of iron from ferritin and generation of activated oxygen. Arch. Biochem. Biophys. 2000, 382, 195–202. [Google Scholar] [CrossRef]
  20. Poddar, S.; Mukherjee, P.; Talukder, G.; Sharma, A. Dietary protection by iron against clastogenic effects of short-term exposure to arsenic in mice in vivo. Food Chem. Toxicol. 2000, 38, 735–737. [Google Scholar] [CrossRef]
  21. Chandrasekaran, V.R.M.; Muthaiyan, I.; Huang, P.C.; Liu, M.Y. Using iron precipitants to remove arsenic from water: Is it safe? Water Res. 2010, 44, 5823–5827. [Google Scholar] [CrossRef] [PubMed]
  22. Liu, S.; Guo, X.; Zhang, X.; Cui, Y.; Zhang, Y.; Wu, B. Impact of iron precipitant on toxicity of arsenic in water: A combined in vivo and in vitro study. Environ. Sci. Technol. 2013, 47, 3432–3438. [Google Scholar] [CrossRef] [PubMed]
  23. Hall, M.N.; Niedzwiecki, M.; Liu, X.; Harper, K.N.; Alam, S.; Slavkovich, V.; Ilievski, V.; Levy, D.; Siddique, A.B.; Parvez, F.; et al. Chronic arsenic exposure and blood glutathione and glutathione disulfide concentrations in Bangladeshi adults. Environ. Health Perspect. 2013, 121, 1068–1074. [Google Scholar] [CrossRef] [PubMed]
  24. Wu, B.; Zhang, Y.; Zhao, D.; Zhang, X.; Kong, Z.; Cheng, S. Gene expression profiles in liver of mouse after chronic exposure to drinking water. J. Appl. Toxicol. 2009, 29, 569–577. [Google Scholar] [CrossRef] [PubMed]
  25. Liu, J.; Waalkes, M.P. Liver is a target of arsenic carcinogenesis. Toxicol. Sci. 2008, 105, 24–32. [Google Scholar] [CrossRef]
  26. Chen, C.; Jiang, X.; Ren, Y.; Zhang, Z. Arsenic trioxide co-exposure potentiates benzo(a)pyrene genotoxicity by enhancing the oxidative stress in human lung adenocarcinoma cell. Biol. Trace Elem. Res. 2013, 156, 338–349. [Google Scholar] [CrossRef]
  27. Kang, Y.H.; Lee, S.J. The role of p38 MAPK and JNK in arsenic trioxide-induced mitochondrial cell death in human cervical cancer cells. J. Cell. Physiol. 2008, 217, 23–33. [Google Scholar] [CrossRef]
  28. Jiang, X.H.; Wong, B.C.Y.; Yuen, S.T.; Jiang, S.H.; Cho, C.H.; Lai, K.C.; Lin, M.C.M.; Kung, H.F.; Lam, S.K. Arsenic trioxide induces apoptosis in human gastric cancer cells through up-regulation of p53 and activation of caspase-3. Int. J. Cancer 2001, 93, 916. [Google Scholar] [CrossRef]
  29. Shi, H.L.; Shi, X.L.; Liu, K.J. Oxidative mechanism of arsenic toxicity and carcinogenesis. Mol. Cell. Biochem. 2004, 255, 67–78. [Google Scholar] [CrossRef]
  30. De Vizcaya-Ruiz, A.; Barbier, O.; Ruiz-Ramos, R.; Cebrian, M.E. Biomarkers of oxidative stress and damage in human populations exposed to arsenic. Mutat. Res.-Genent. Toxicol. Environ. Mutagen. 2009, 674, 85–92. [Google Scholar] [CrossRef]
  31. Marnett, L.J. Lipid peroxidation—DNA damage by malondialdehyde. Mutat. Res./Fundam. Mol. Mech. Mutagen. 1999, 424, 83–95. [Google Scholar] [CrossRef]
  32. Luster, M.I.; Simeonova, P.P. Arsenic and urinary bladder cell proliferation. Toxicol. Appl. Pharm. 2004, 198, 419–423. [Google Scholar] [CrossRef] [PubMed]
  33. Lu, M.; Levin, J.; Sulpice, E.; Sequeira-Le Grand, A.; Alemany, M.; Caen, J.P.; Han, Z.C. Effect of arsenic trioxide on viability, proliferation, and apoptosis in human megakaryocytic leukemia cell lines. Exp. Hematol. 1999, 27, 845–852. [Google Scholar] [CrossRef]
  34. Chowdhury, R.; Chatterjee, R.; Giri, A.K.; Mandal, C.; Chaudhuri, K. Arsenic-induced cell proliferation is associated with enhanced ros generation, erk signaling and cyclina expression. Toxicol. Lett. 2010, 198, 263–271. [Google Scholar] [CrossRef] [PubMed]
  35. Seoane, J.; Le, H.V.; Shen, L.J.; Anderson, S.A.; Massague, J. Integration of Smad and Forkhead pathways in the control of neuroepithelial and glioblastoma cell proliferation. Cell 2004, 117, 211–223. [Google Scholar] [CrossRef] [Green Version]
  36. Chen, W.; Martindale, J.L.; Holbrook, N.J.; Liu, Y.S. Tumor promoter arsenite activates extracellular signal-regulated kinase through a signaling pathway mediated by epidermal growth factor receptor and Shc. Mol. Cell. Biol. 1998, 18, 5178–5188. [Google Scholar] [CrossRef] [Green Version]
  37. Simeonova, P.P.; Wang, S.Y.; Hulderman, T.; Luster, M.I. c-Src-dependent activation of the epidermal growth factor receptor and mitogen-activated protein kinase pathway by arsenic—Role in carcinogenesis. J. Biol. Chem. 2002, 277, 2945–2950. [Google Scholar] [CrossRef] [Green Version]
  38. Ten Dijke, P.T.; Goumans, M.J.; Itoh, F.; Itoh, S. Regulation of cell proliferation by Smad proteins. J. Cell. Physiol. 2002, 191, 1–16. [Google Scholar] [CrossRef]
  39. Sengupta, S.; Jana, S.; Bhattacharyya, A. TGF-beta-Smad2 dependent activation of CDC 25A plays an important role in cell proliferation through NFAT activation in metastatic breast cancer cells. Cell. Signal. 2014, 26, 240–252. [Google Scholar] [CrossRef]
  40. Lee, Y.S.; Lee, S.J.; Seo, K.W.; Bae, J.U.; Park, S.Y.; Kim, C.D. Homocysteine induces COX-2 expression in macrophages through ROS generated by NMDA receptor-calcium signaling pathways. Free Radic. Res. 2013, 47, 422–431. [Google Scholar] [CrossRef]
  41. He, J.; Wang, M.; Jiang, Y.; Chen, Q.; Xu, S.; Xu, Q.; Jiang, B.-H.; Liu, L.-Z. Chronic arsenic exposure and angiogenesis in human bronchial epithelial cells via the ROS/miR-199a-5p/HIF-1 alpha/COX-2 pathway. Environ. Health Perspect. 2014, 122, 255–261. [Google Scholar] [CrossRef] [PubMed]
  42. Edvardsen, H.; Landmark-Hoyvik, H.; Reinertsen, K.V.; Zhao, X.; Grenaker-Alnaes, G.I.; Nebdal, D.; Syvanen, A.-C.; Rodningen, O.; Alsner, J.; Overgaard, J.; et al. SNP in TXNRD2 associated with radiation-induced fibrosis: A study of genetic variation in reactive oxygen species metabolism and signaling. Int. J. Radiat. Oncol. 2013, 86, 791–799. [Google Scholar] [CrossRef] [PubMed] [Green Version]
  43. Velez, J.M.; Miriyala, S.; Nithipongvanitch, R.; Noel, T.; Plabplueng, C.D.; Oberley, T.; Jungsuwadee, P.; Van Remmen, H.; Vore, M.; Clair, D.K.S. p53 regulates oxidative stress-mediated retrograde signaling: A novel mechanism for chemotherapy-induced cardiac injury. PLoS ONE 2011, 6, e18005. [Google Scholar] [CrossRef] [PubMed] [Green Version]
  44. Sugden, P.H.; Clerk, A. Oxidative stress and growth-regulating intracellular signaling pathways in cardiac myocytes. Antioxid. Redox Signal. 2006, 8, 2111–2124. [Google Scholar] [CrossRef] [PubMed]
  45. Elmore, S. Apoptosis: A review of programmed cell death. Toxicol. Pathol. 2007, 35, 495–516. [Google Scholar] [CrossRef]
  46. Copple, I.M.; Lister, A.; Obeng, A.D.; Kitteringham, N.R.; Jenkins, R.E.; Layfield, R.; Foster, B.J.; Goldring, C.E.; Park, B.K. Physical and Functional Interaction of Sequestosome 1 with Keap1 Regulates the Keap1-Nrf2 Cell Defense Pathway. J. Biol. Chem. 2010, 285, 16782–16788. [Google Scholar] [CrossRef] [Green Version]
  47. Bartolome, F.; Esteras, N.; Martin-Requero, A.; Boutoleau-Bretonniere, C.; Vercelletto, M.; Gabelle, A.; Le Ber, I.; Honda, T.; Dinkova-Kostova, A.T.; Hardy, J.; et al. Pathogenic p62/SQSTM1 mutations impair energy metabolism through limitation of mitochondrial substrates. Sci. Rep. 2017, 7, 1666. [Google Scholar] [CrossRef] [Green Version]
  48. Auberger, P. BCR-ABL/p62/SQSTM1: A cannibal embrace. Blood 2012, 120, 3389–3390. [Google Scholar] [CrossRef] [Green Version]
  49. He, P.X.; Zhang, J.; Che, Y.S.; He, Q.J.; Chen, Y.; Ding, J. G226, a new epipolythiodioxopiperazine derivative, triggers DNA damage and apoptosis in human cancer cells in vitro via ROS generation. Acta Pharmacol. Sin. 2014, 35, 1546–1555. [Google Scholar] [CrossRef] [Green Version]
  50. Simon, H.U.; Haj-Yehia, A.; Levi-Schaffer, F. Role of reactive oxygen species (ROS) in apoptosis induction. Apoptosis 2000, 5, 415–418. [Google Scholar] [CrossRef]
Figure 1. Cell viability of HepG2 exposed to 20 μM As or/and 100 μM Fe. CK, As, Fe, and As + Fe mean the control, arsenic alone exposure, iron alone exposure, and co-exposure of arsenic and iron groups, respectively. The cytotoxicity assays were performed by three independent 96-well experiments. *: p-value < 0.05.
Ijerph 16 04484 g001
Figure 2. Mitochondrial membrane potential of a HepG2 cell exposed to 20 μM As or/and 100 μM Fe. CK, As, Fe, and As+Fe mean the control, arsenic alone exposure, iron alone exposure, and co-exposure of arsenic and iron groups, respectively. The cytotoxicity assays were performed by three independent 96-well experiments. *: p-value < 0.05.
Ijerph 16 04484 g002
Figure 3. Oxidative stress and damage in HepG2 cells induced by 20 μM As or/and 100 μM Fe. (A) and (B) show the superoxide dismutase (SOD) activity and malondialdehyde (MDA) levels, respectively. (C) shows the normalized dichlorofluorescein (DCF) fluorescence values after exposure to 20 μM As or/and 100 μM Fe, (D) shows the normalized DCF fluorescence values after exposure to 2 μM As or/and 50 μM Fe. CK, As, Fe, and As + Fe mean the control, arsenic alone exposure, iron alone exposure, and co-exposure of arsenic and iron groups, respectively. The cytotoxicity assays were performed by three independent 96-well experiments. *: p-value < 0.05.
Ijerph 16 04484 g003aIjerph 16 04484 g003b
Figure 4. Number of differentially expressed genes in As and As + Fe groups. (A) Distribution of differentially expressed genes in different ranges of fold change. (B) Venn diagram of differentially expressed genes in treated groups. CK, As, Fe, and As + Fe mean the control, arsenic alone exposure, iron alone exposure, and co-exposure of arsenic and iron groups, respectively.
Ijerph 16 04484 g004
Figure 5. Heat map of differentially expressed genes related to altered Gene Ontology biological process based on the criteria that the ratio of fold change (As + Fe group to As group) > 1.5 and p-value < 0.05. (A) Genes related to regulation of cell proliferation; (B) genes related to cellular response to oxidative stress; (C) genes related to regulation of the apoptotic signaling pathway. CK, As, Fe, and AF mean the control, arsenic alone exposure, iron alone exposure, and co-exposure of arsenic and iron groups, respectively.
Ijerph 16 04484 g005
Table 1. Sequences of qPCR primers.
GeneForward (5’ to 3’)Reverse (5’ to 3’)
β-actinCGTACCACTGGCATCGTGATGTGTTGGCGTACAGGTCTTTG
Ptgs2GCCCAGCACTTCACGCATCAGGACCAGGCACCAGACCAAAGACC
Tgfbr1ACATGATTCAGCCACAGATACCGCATAGATGTCAGCACGTTTG
Sqstm1AAATGGGTCCACCAGGAAACTGGATCAACTTCAATGCCCAGAGGGCTA
Table 2. Comparative analysis of expression of genes Ptgs2, Tgfbr1, and Sqstm1 in HepG2 cells exposed to As and/or Fe for 24 h, as identified by qPCR and microarray. The fold change was normalized by control group.
GeneMicroarrayqPCR
AsAs + FeAsAs + Fe
Ptgs24.018.576.269.65
Tgfbr10.470.240.610.47
Sqstm12.484.8210.8620.73
Table 3. Altered pathways identified in As and As + Fe groups, based on the KEGG (Kyoto Encyclopedia of Genes and Genomes) database. + indicates that the pathway is significantly changed (p-value < 0.05).
No.KEGG PathwayAsAs + Fe
1Pathways in cancer +
2MAPK (Ras–mitogen-activated protein kinase) signaling pathway++
3Cell cycle++
4Purine metabolism++
5Pyrimidine metabolism++
6p53 signaling pathway++
7Colorectal cancer++
8DNA replication++
9ECM (Extracellular matrix)-receptor interaction +
10Progesterone-mediated oocyte maturation +
11ErbB signaling pathway +
12Base excision repair++
13Epithelial cell signaling in Helicobacter pylori infection++
14Aminoacyl-tRNA biosynthesis++
15Lysine degradation++
16Pyruvate metabolism++
17Bladder cancer+
18Notch signaling pathway +
19Alanine, aspartate and glutamate metabolism++
20Porphyrin and chlorophyll metabolism+
21One carbon pool by folate +
22Steroid biosynthesis++

