Method for Distinguishing Humans and Animals in Vital Signs Monitoring Using IR-UWB Radar

 ,
,  , , ,
, , ,
Abstract
1. Introduction
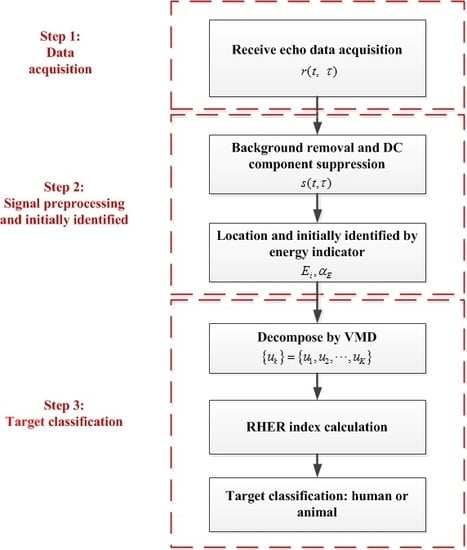
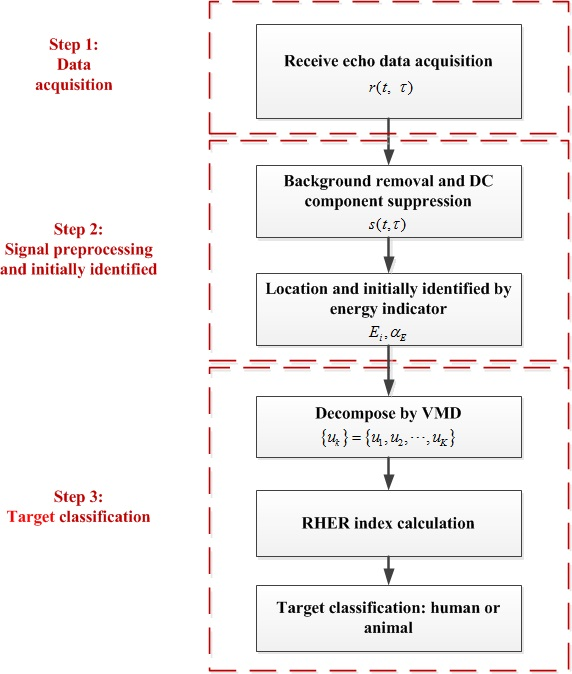
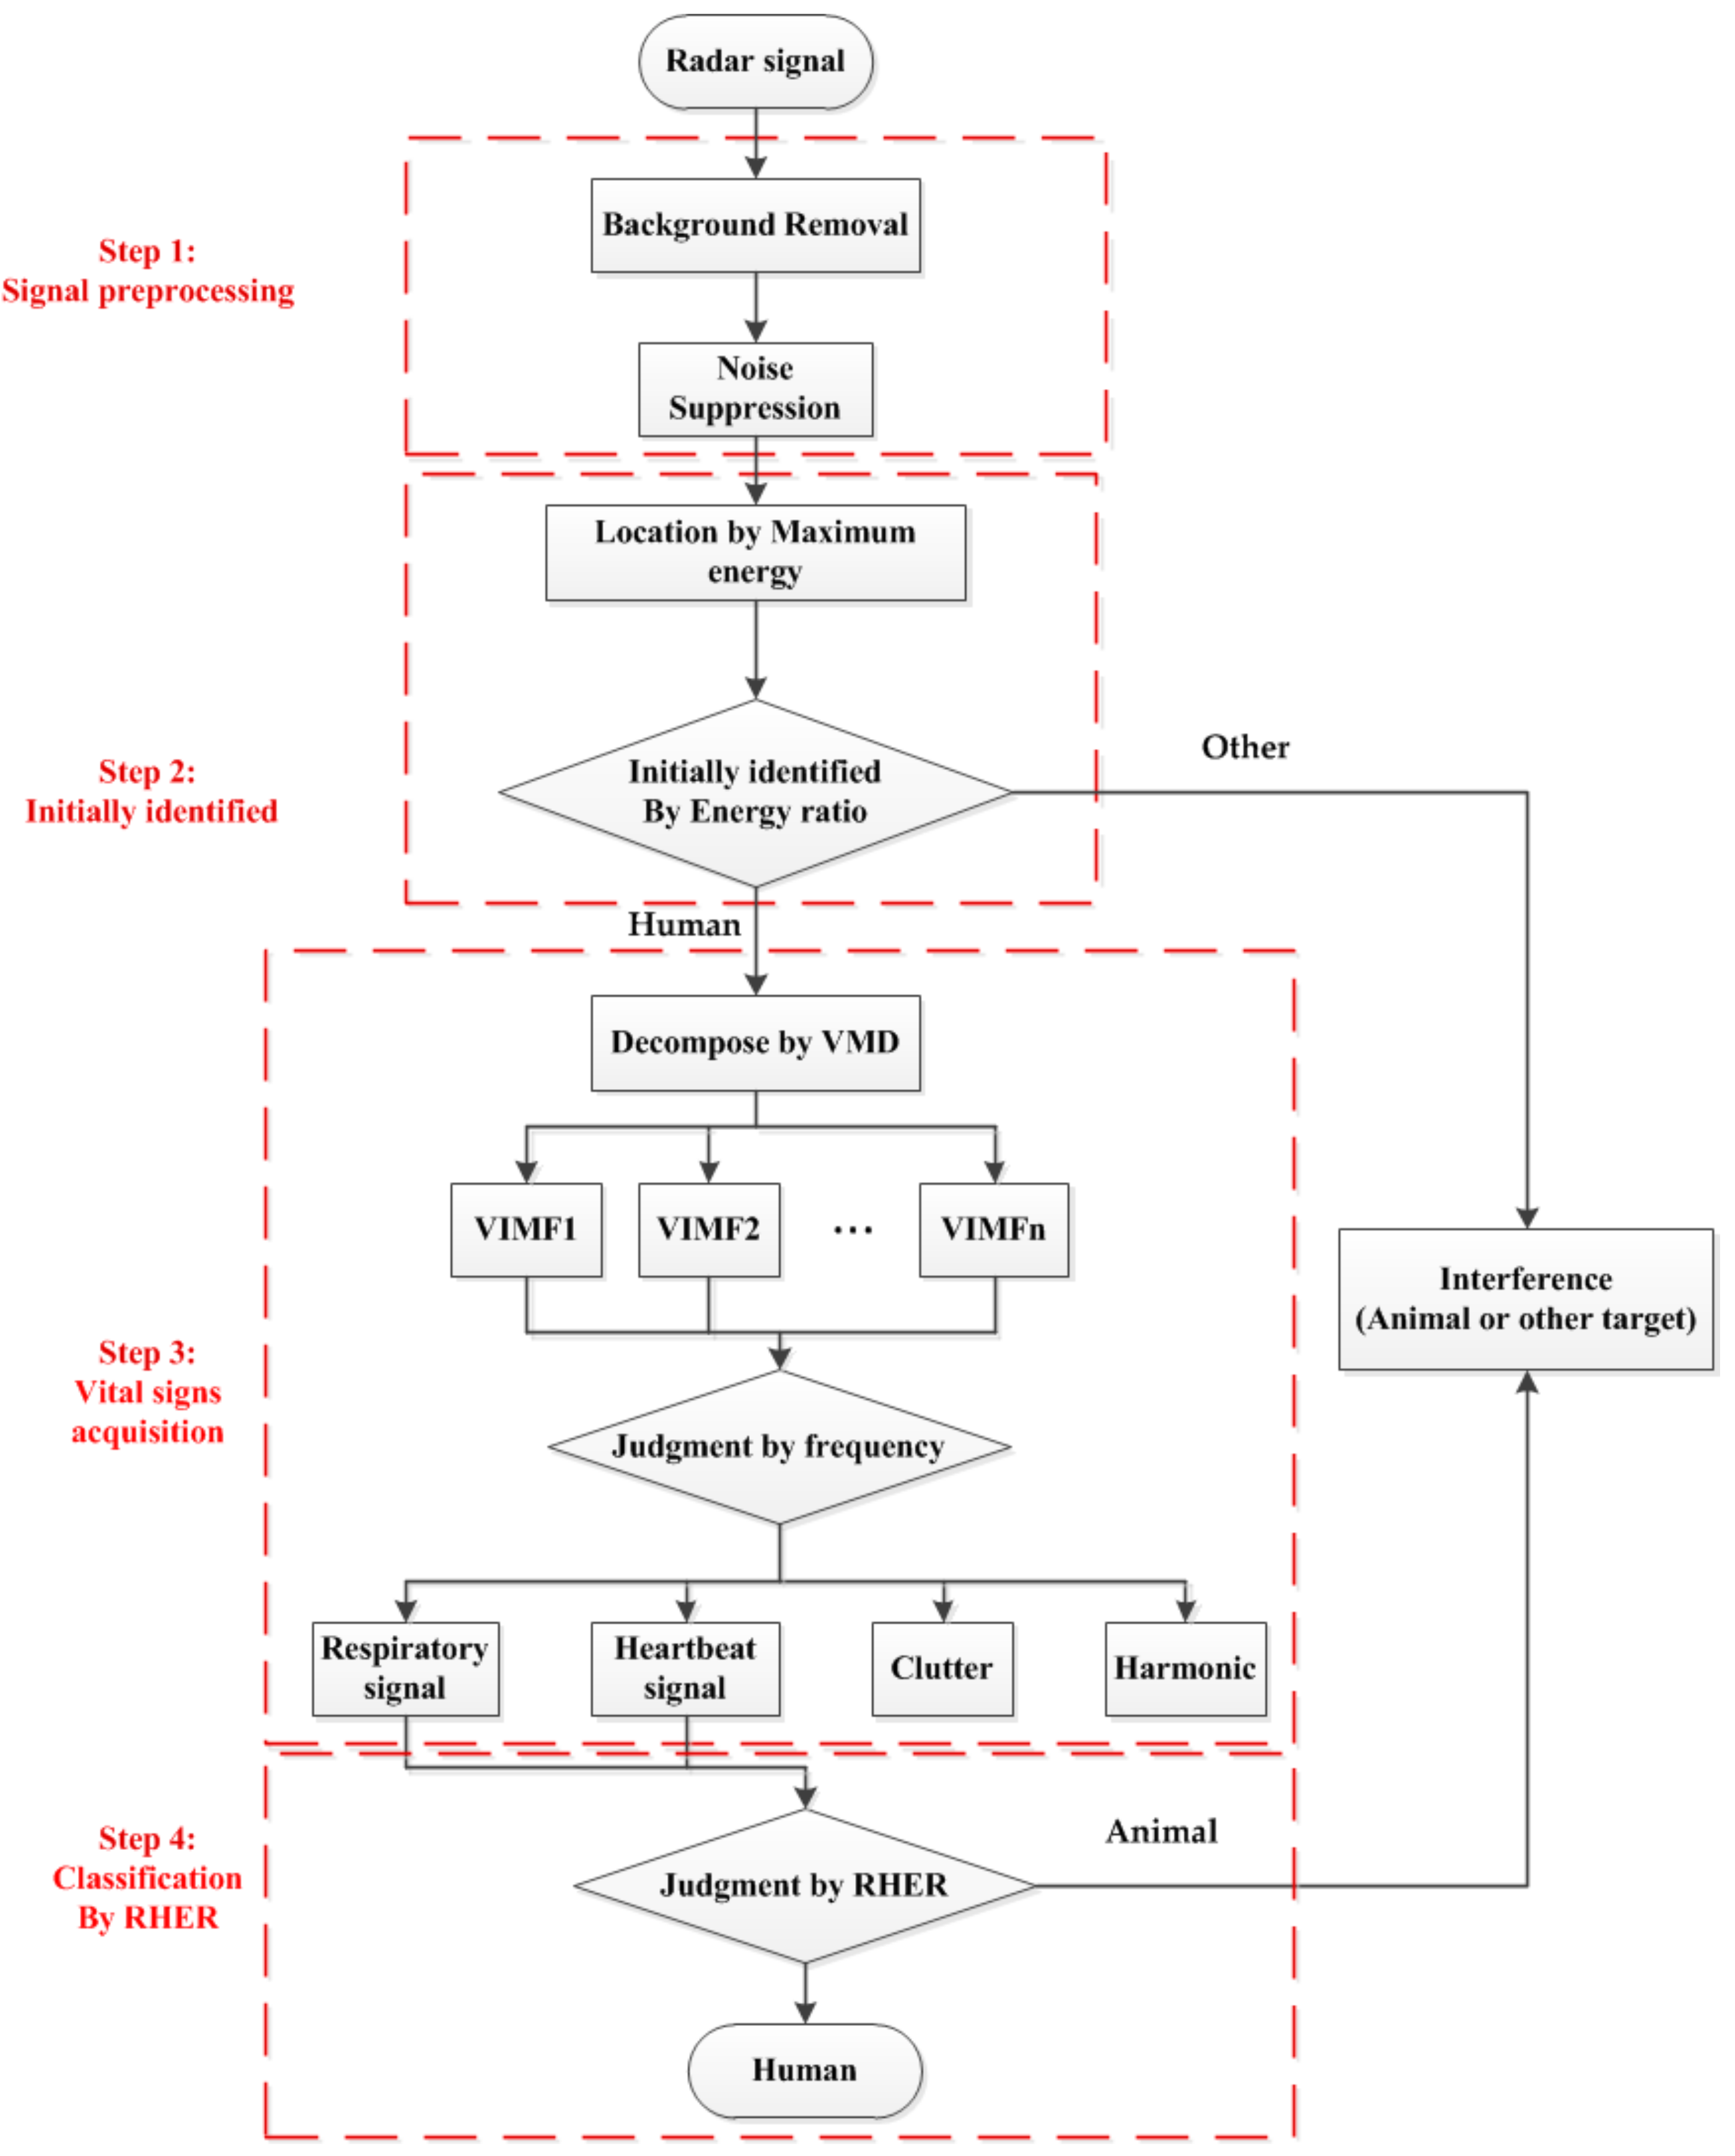
2. Methods
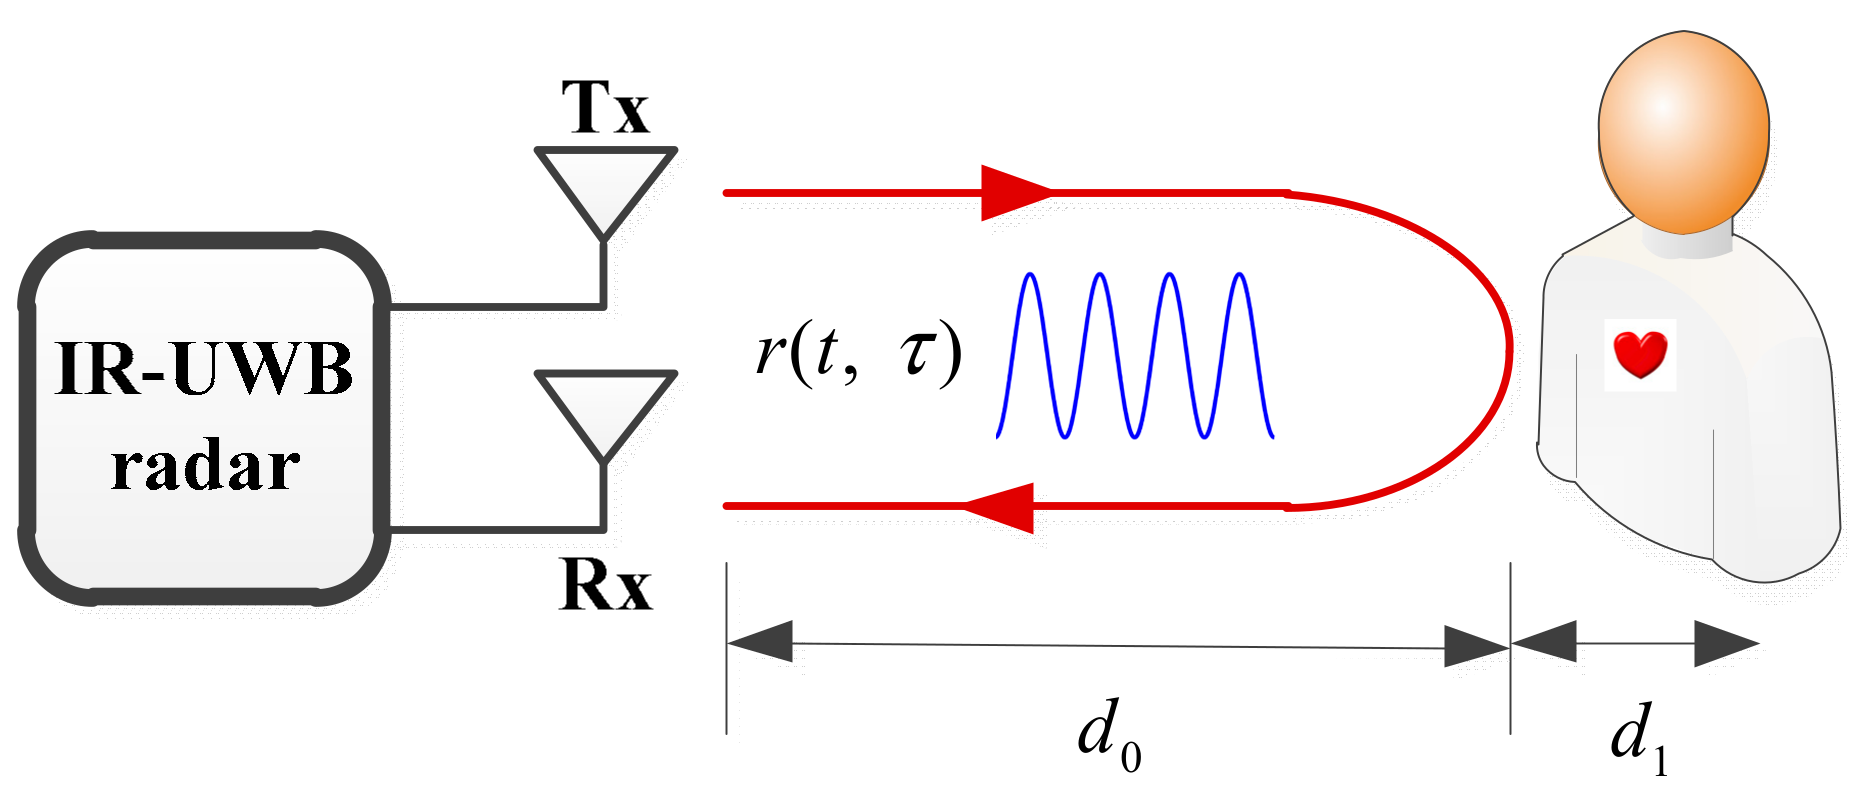
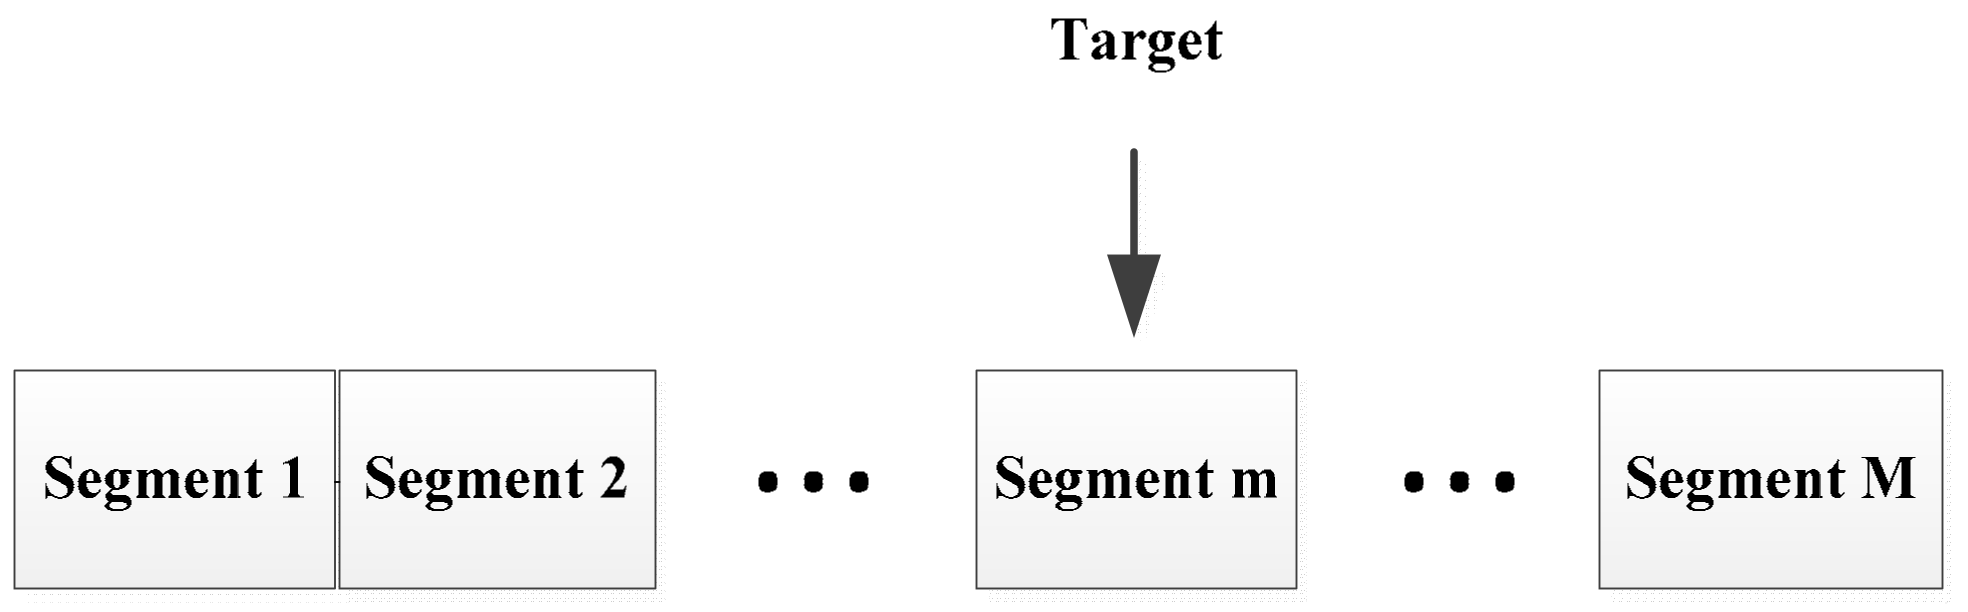
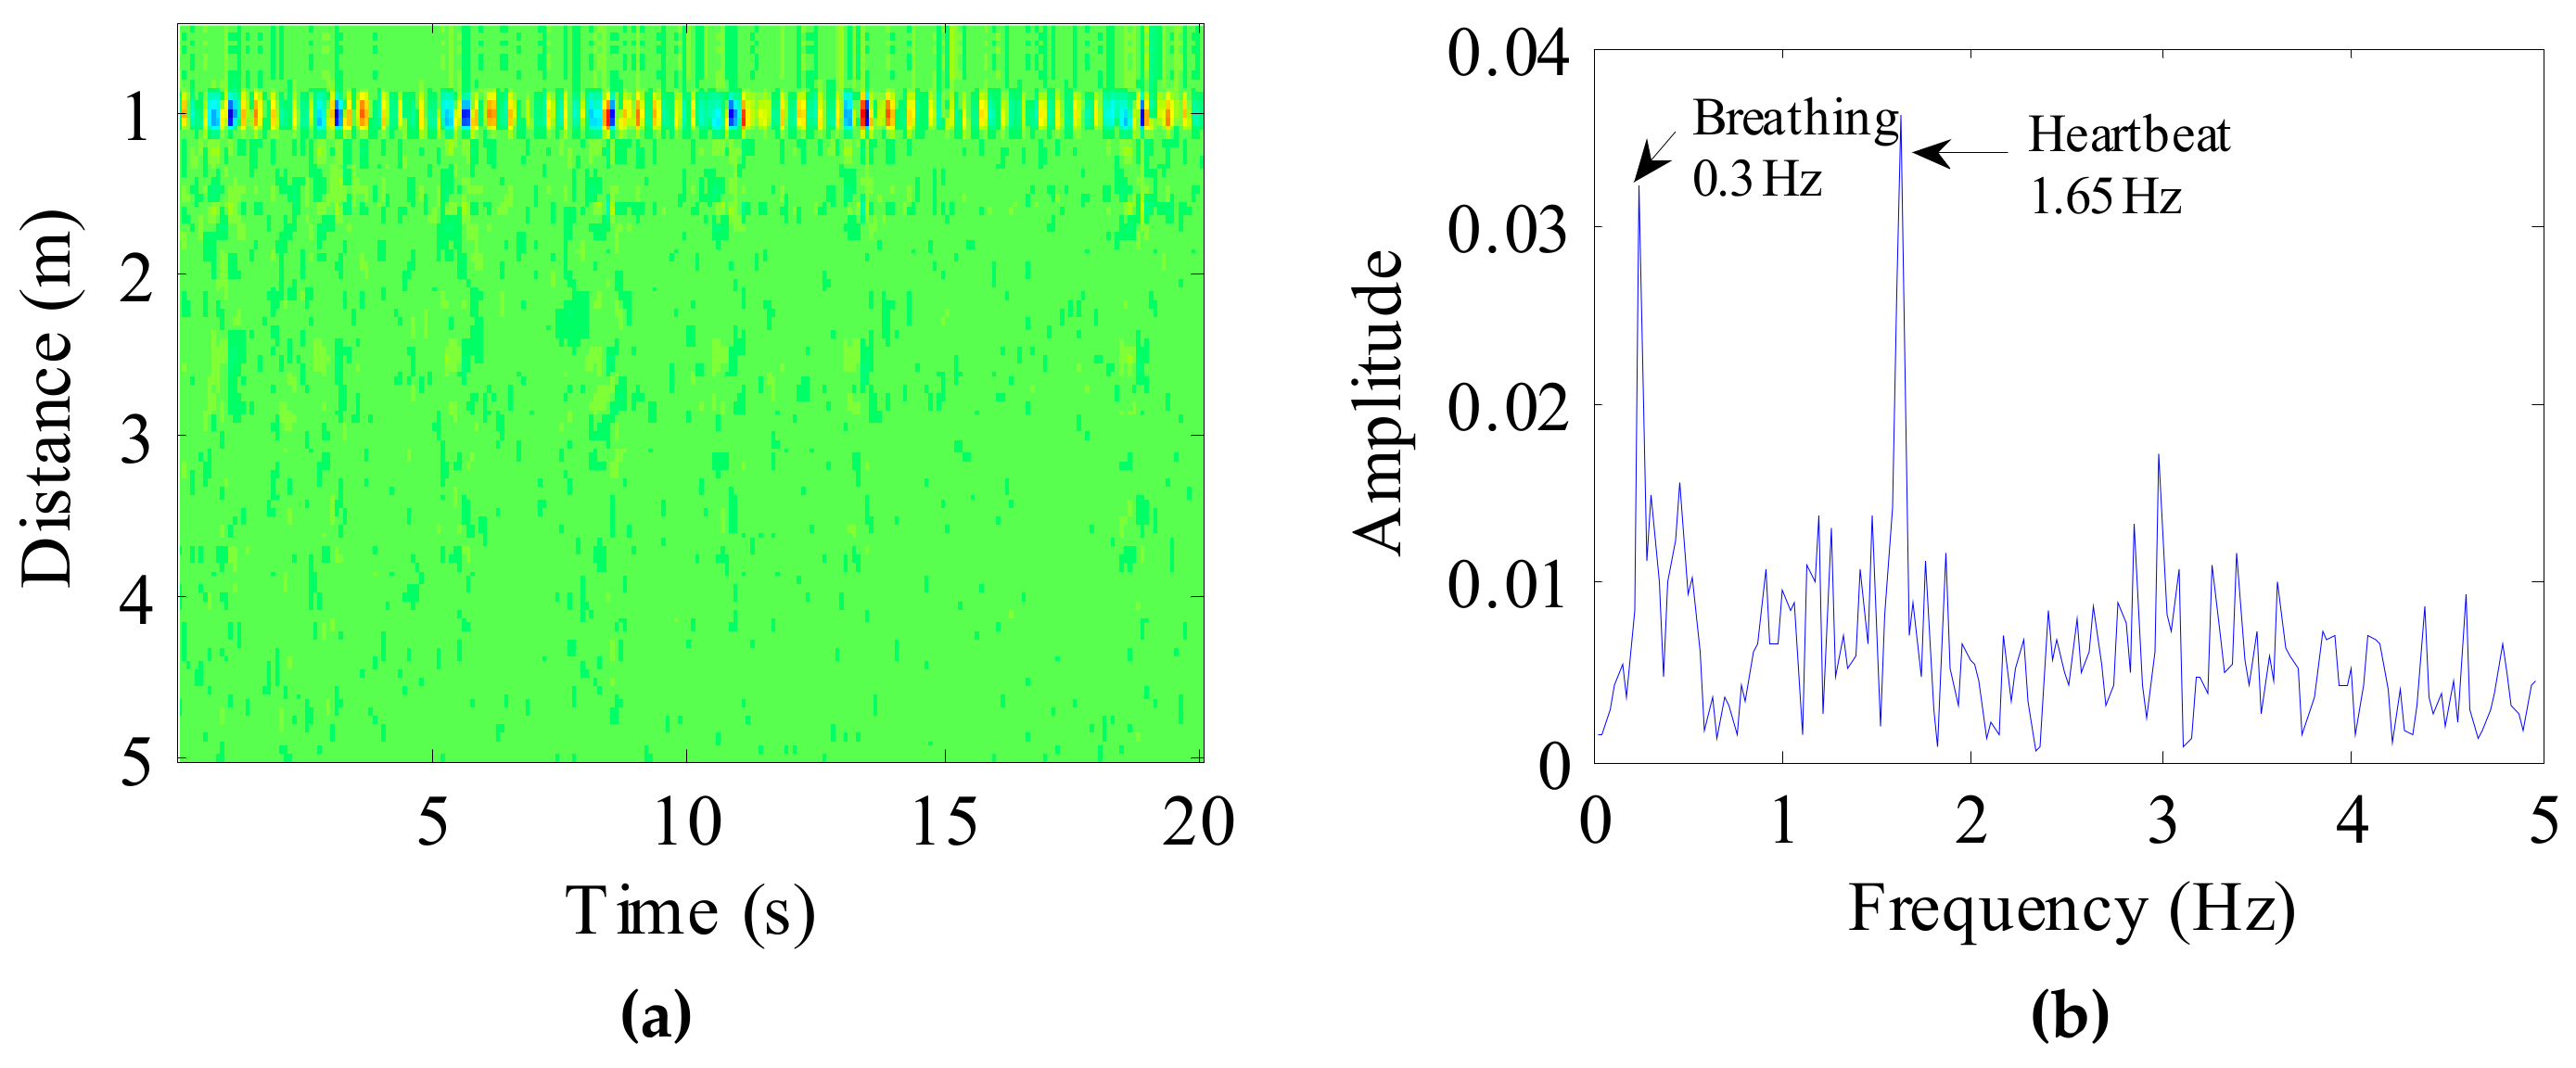
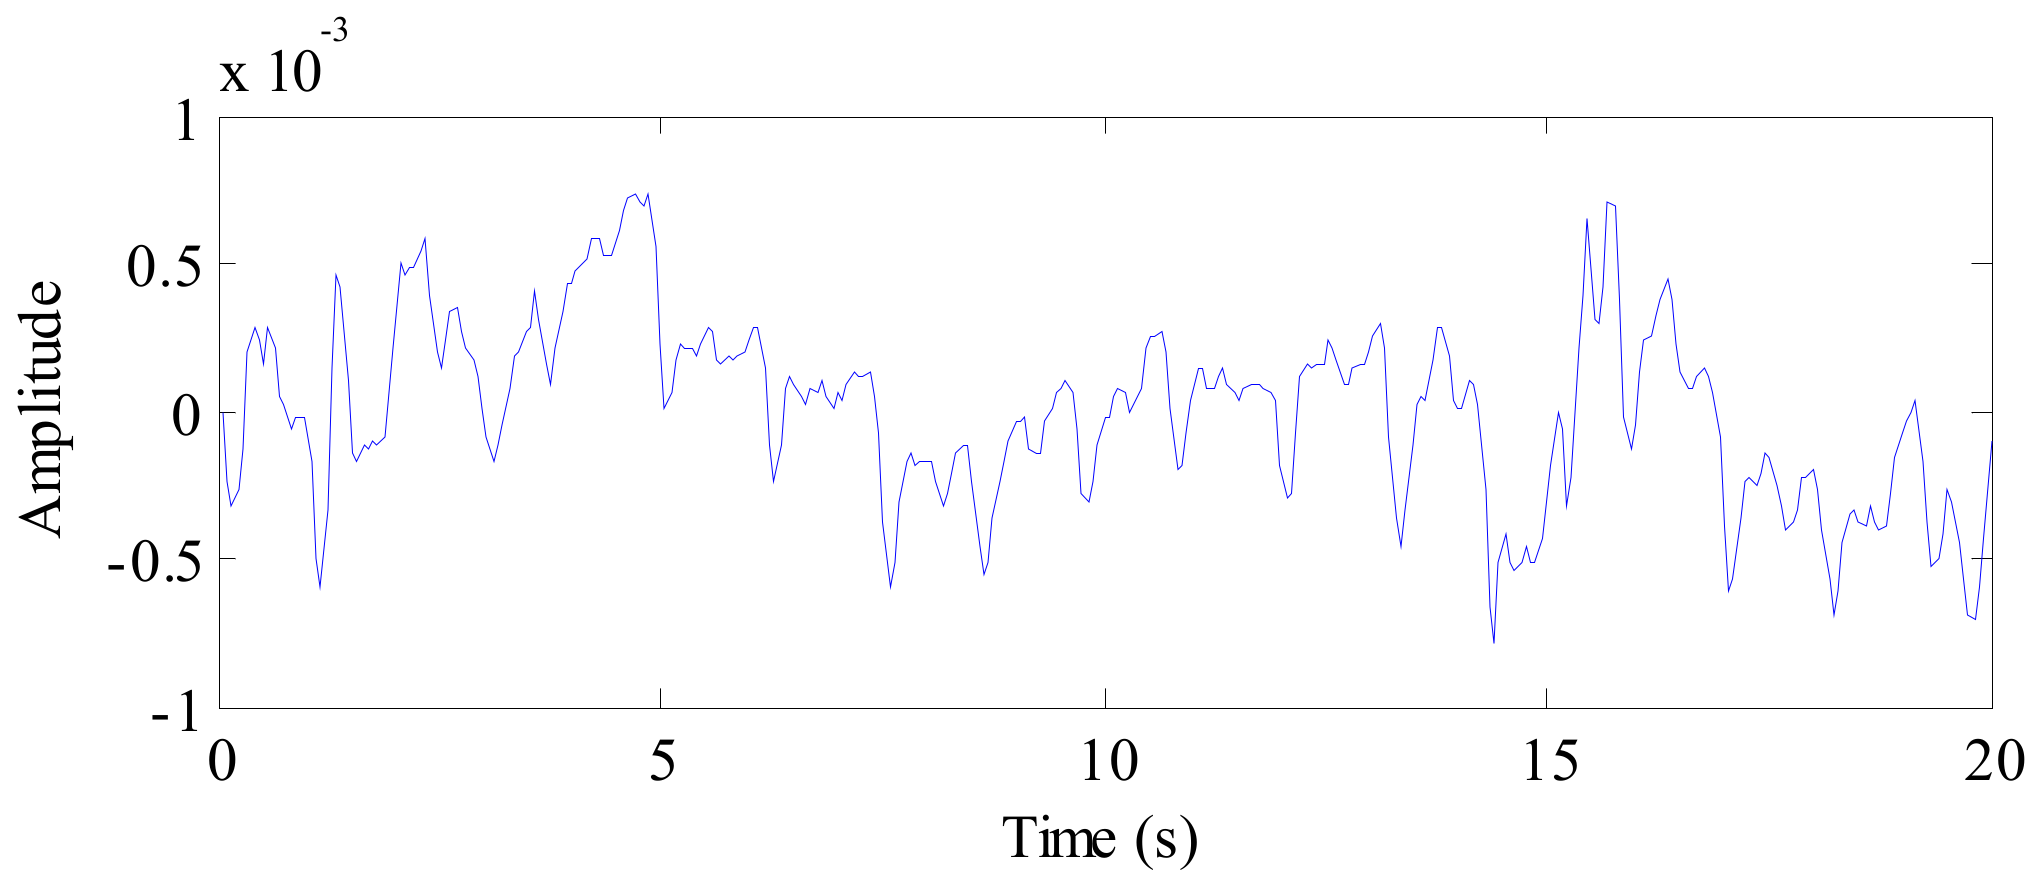
2.1. Data Acquisition and Signal Preprocessing
2.2. Energy Indicator
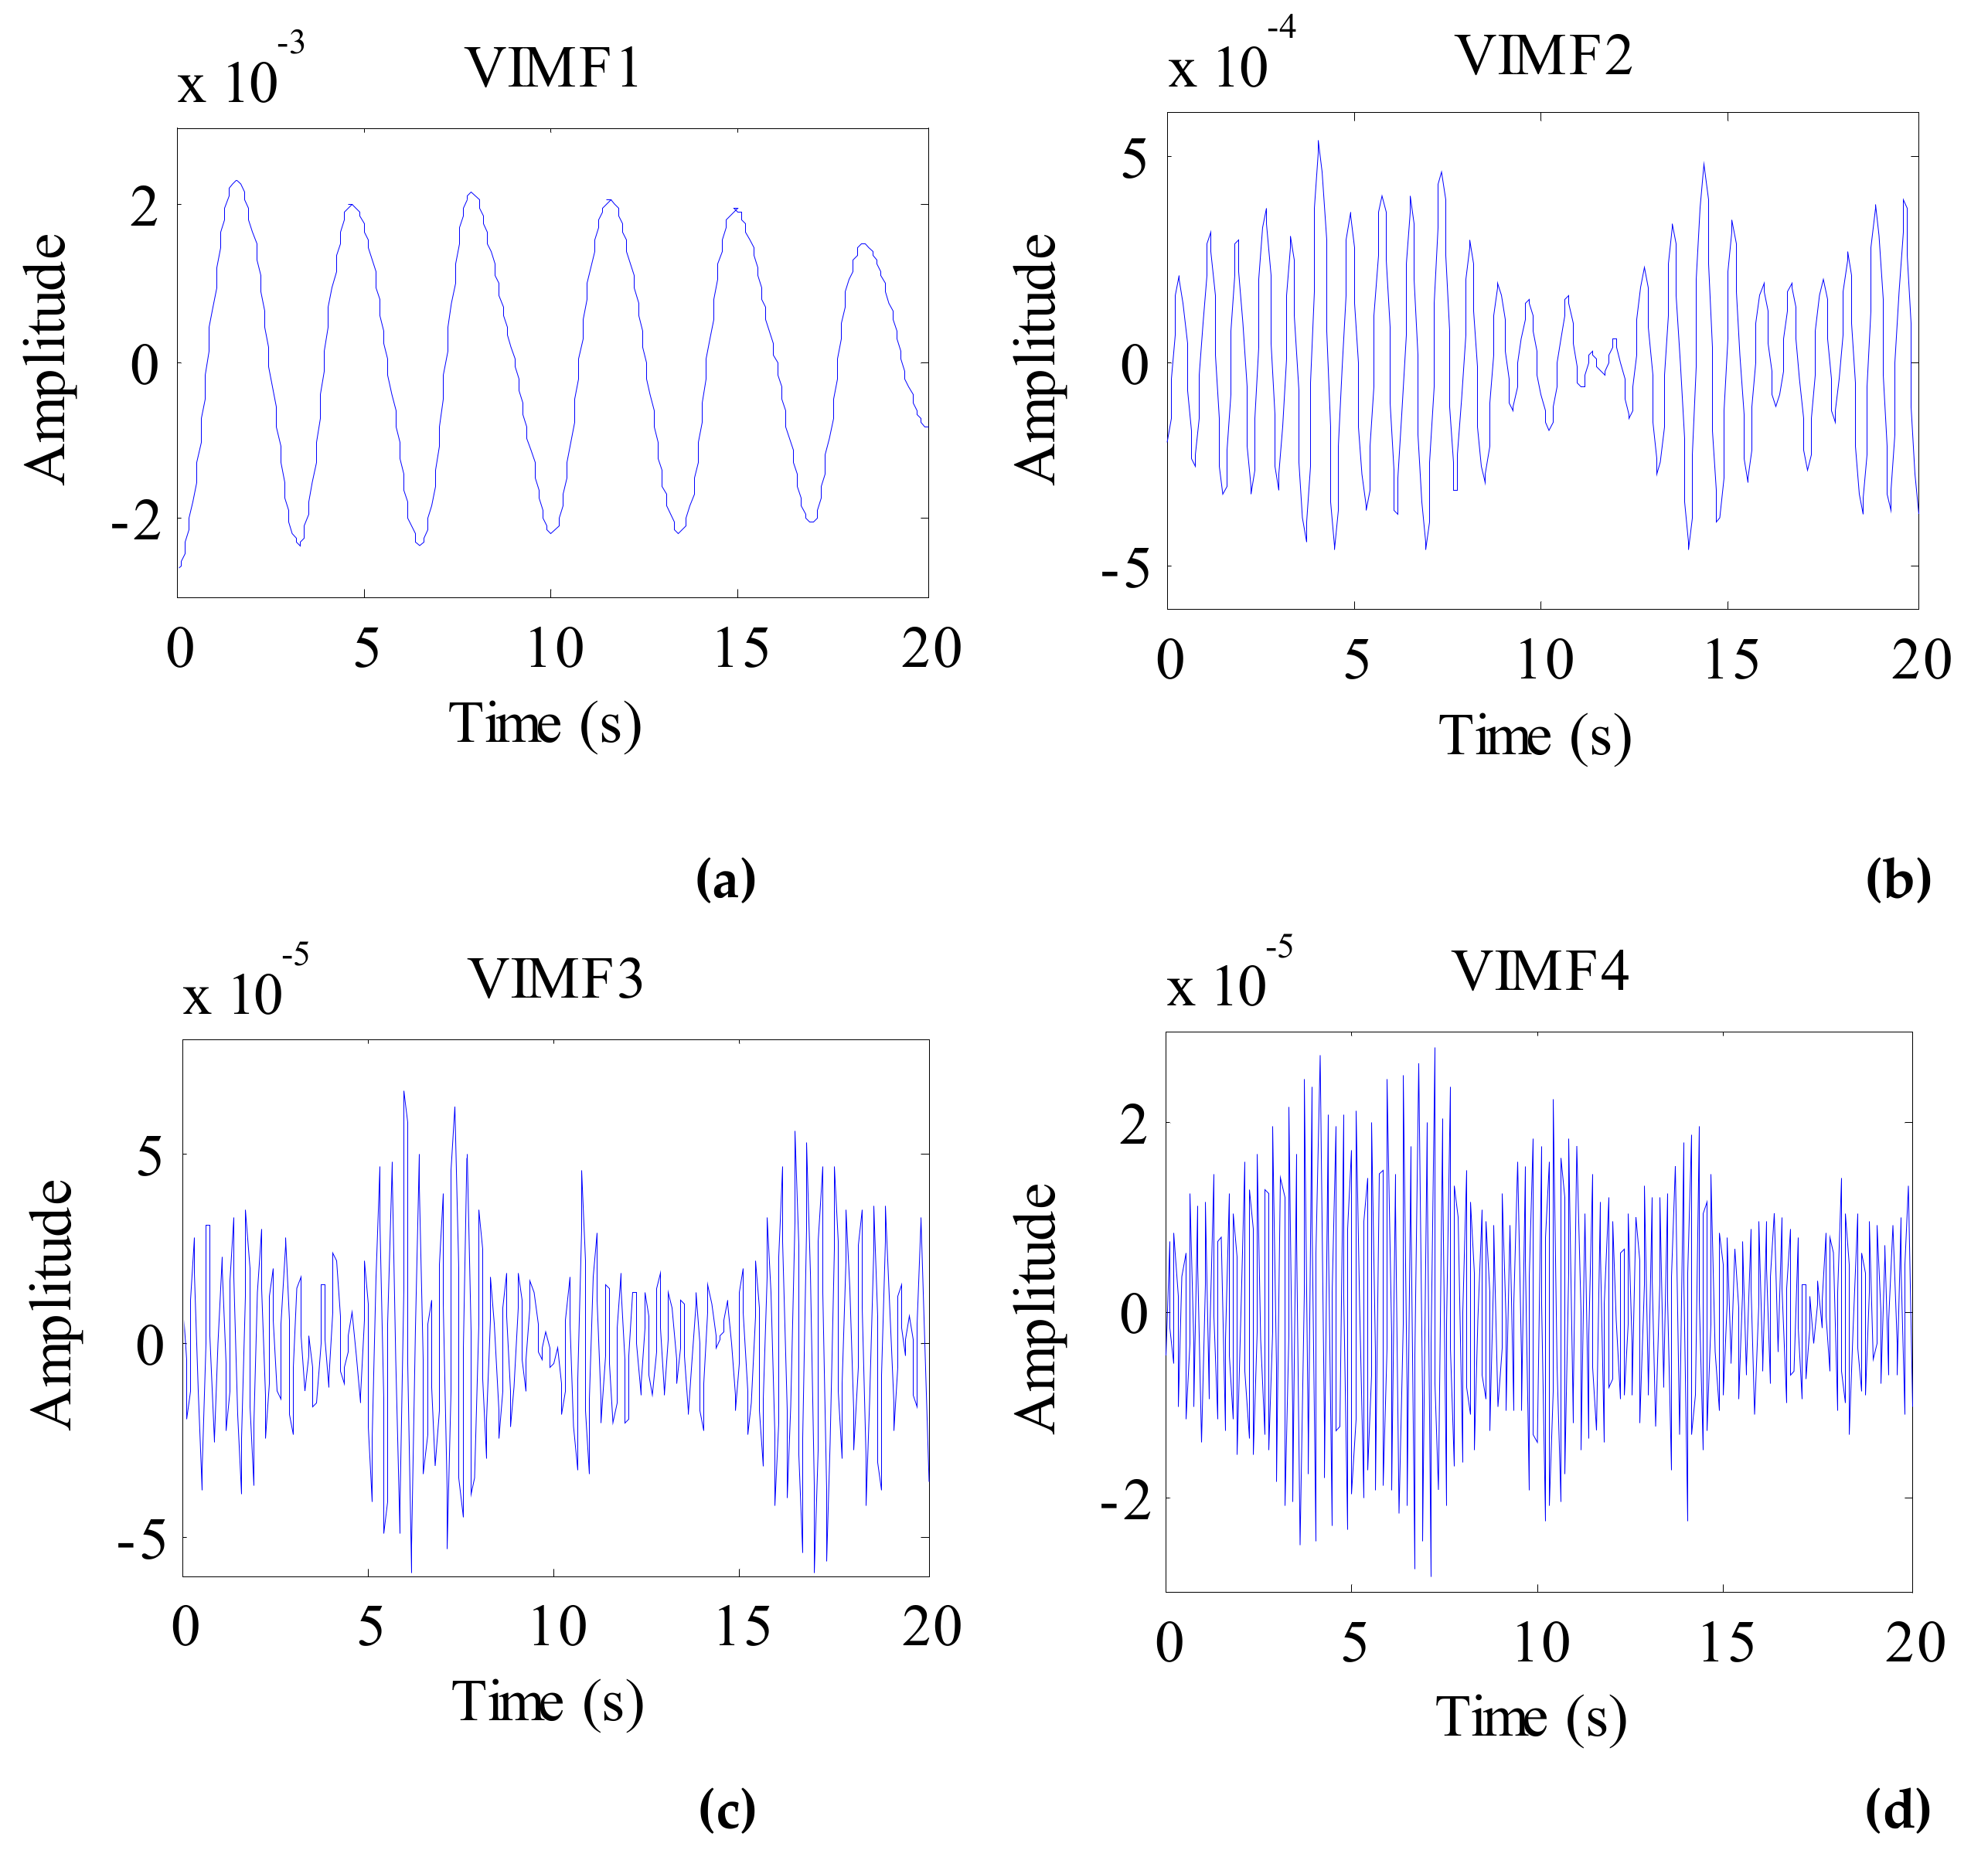
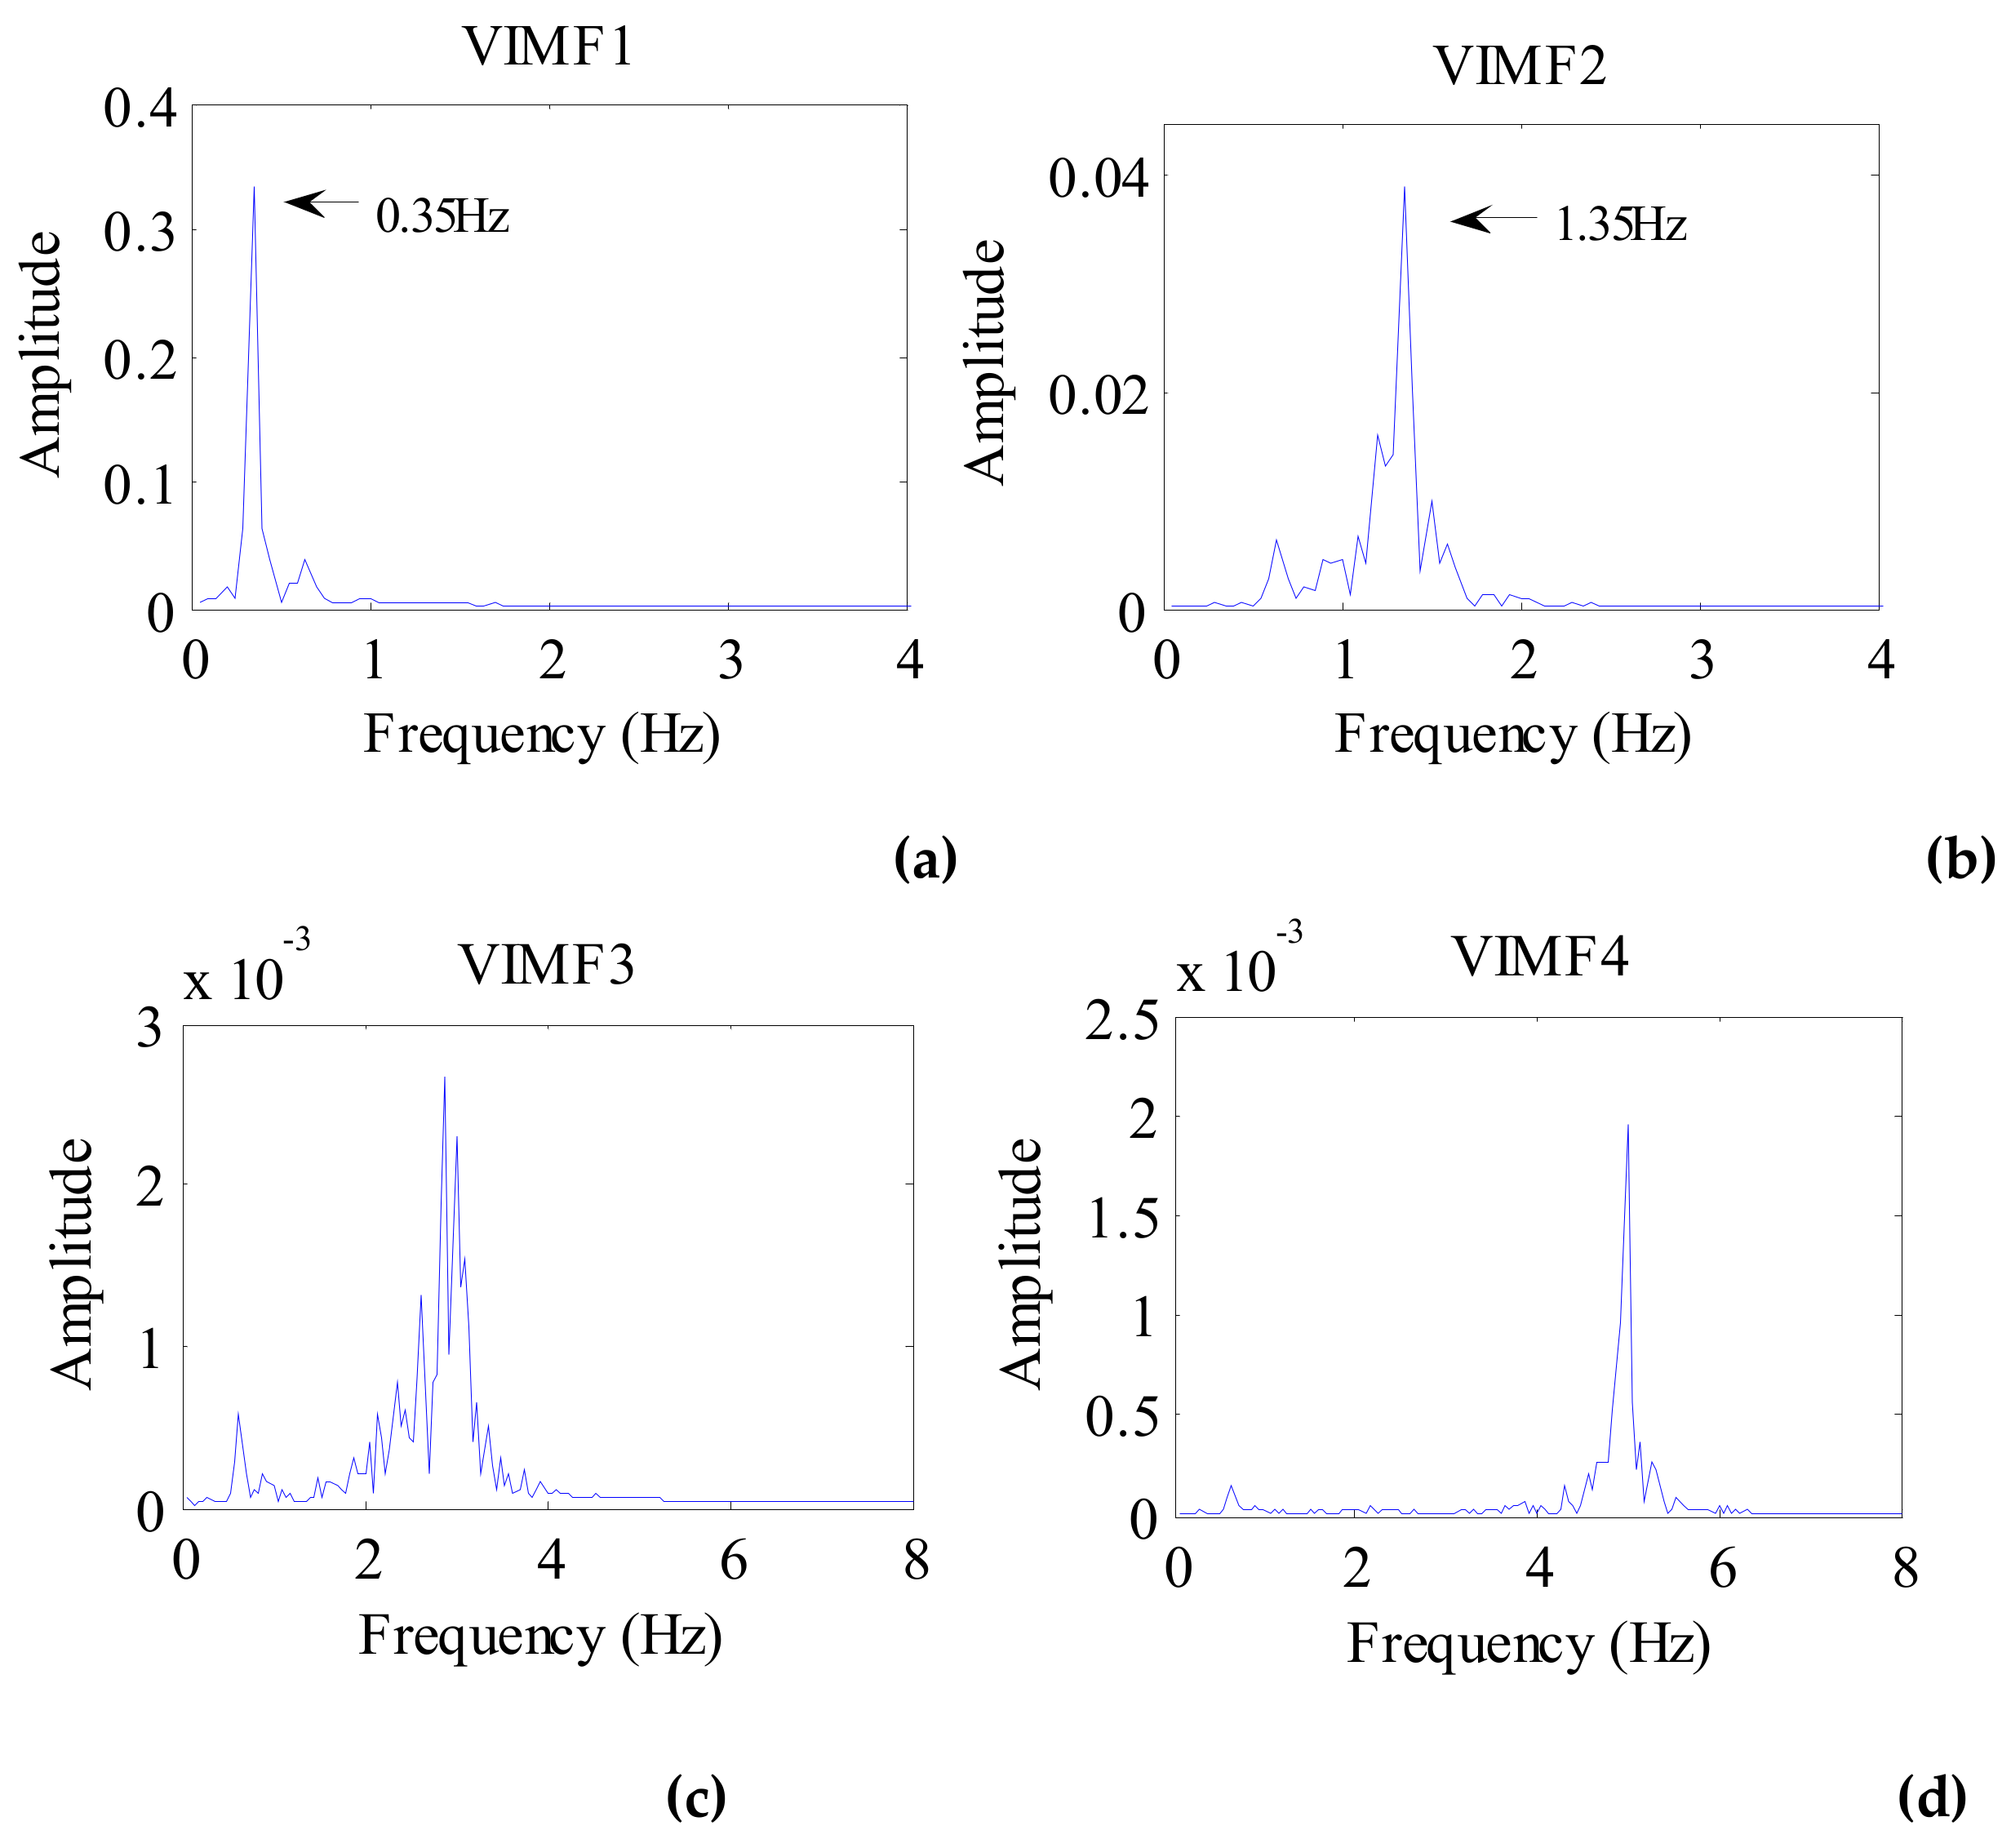
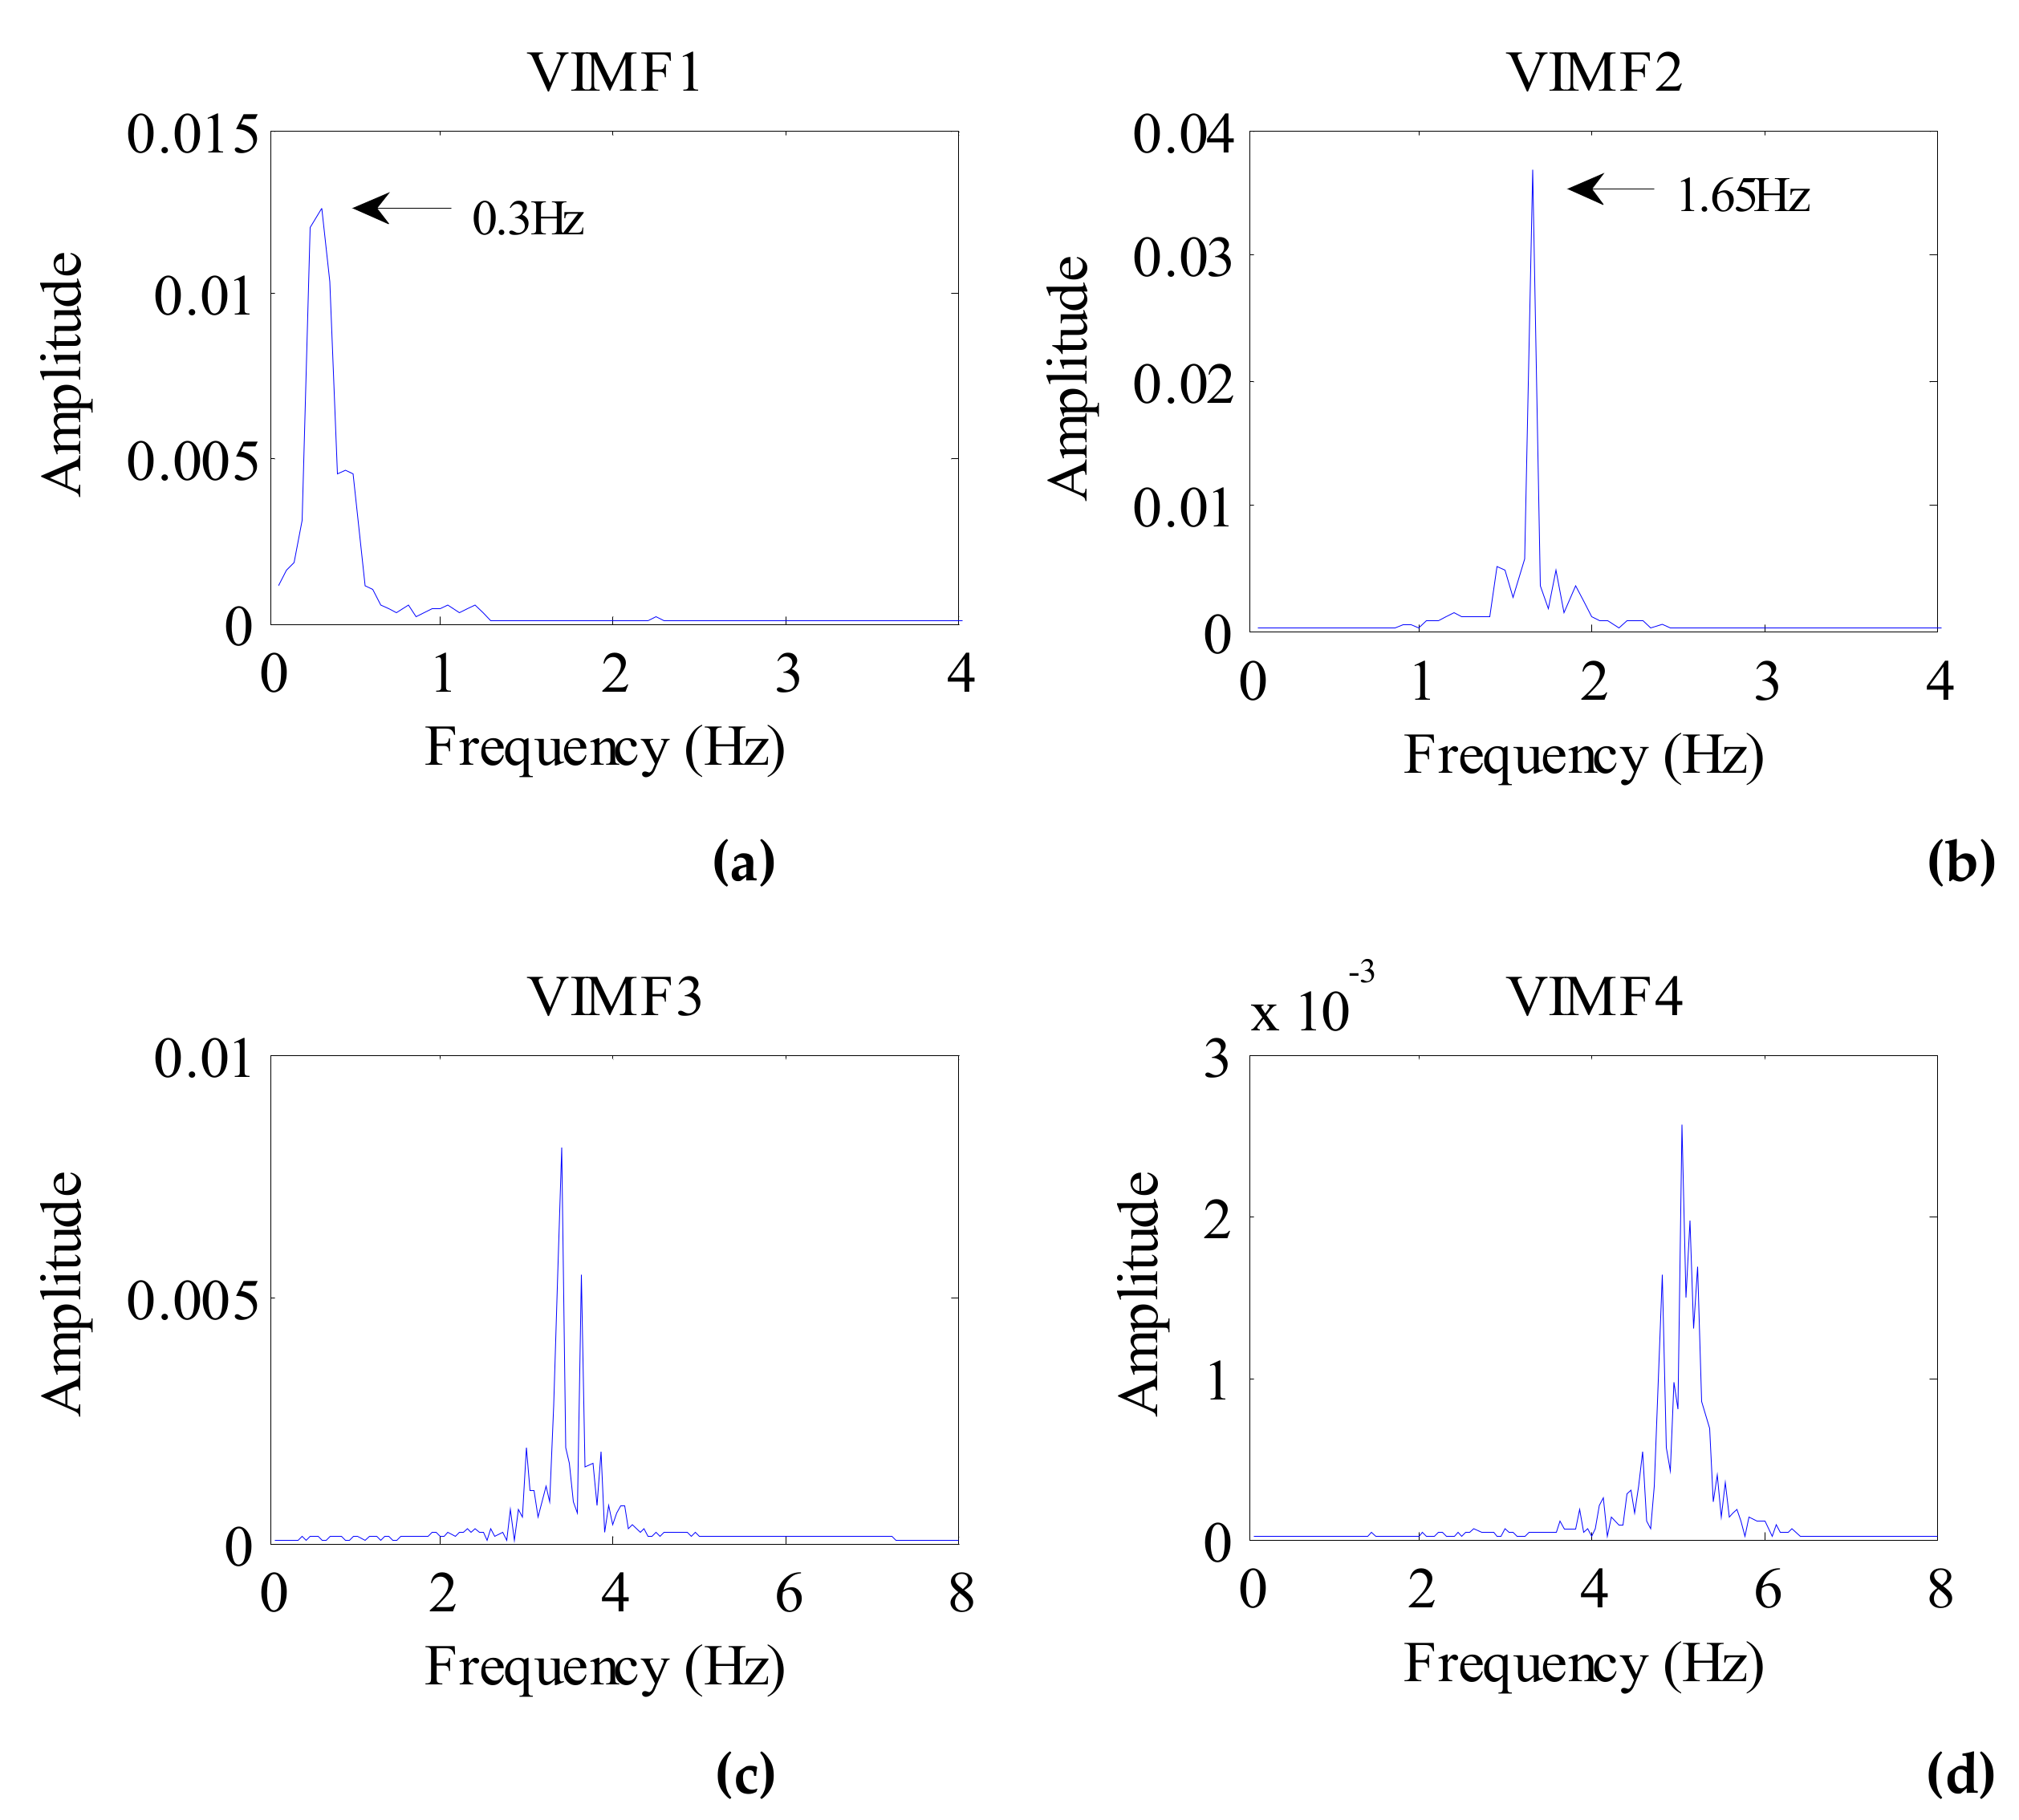
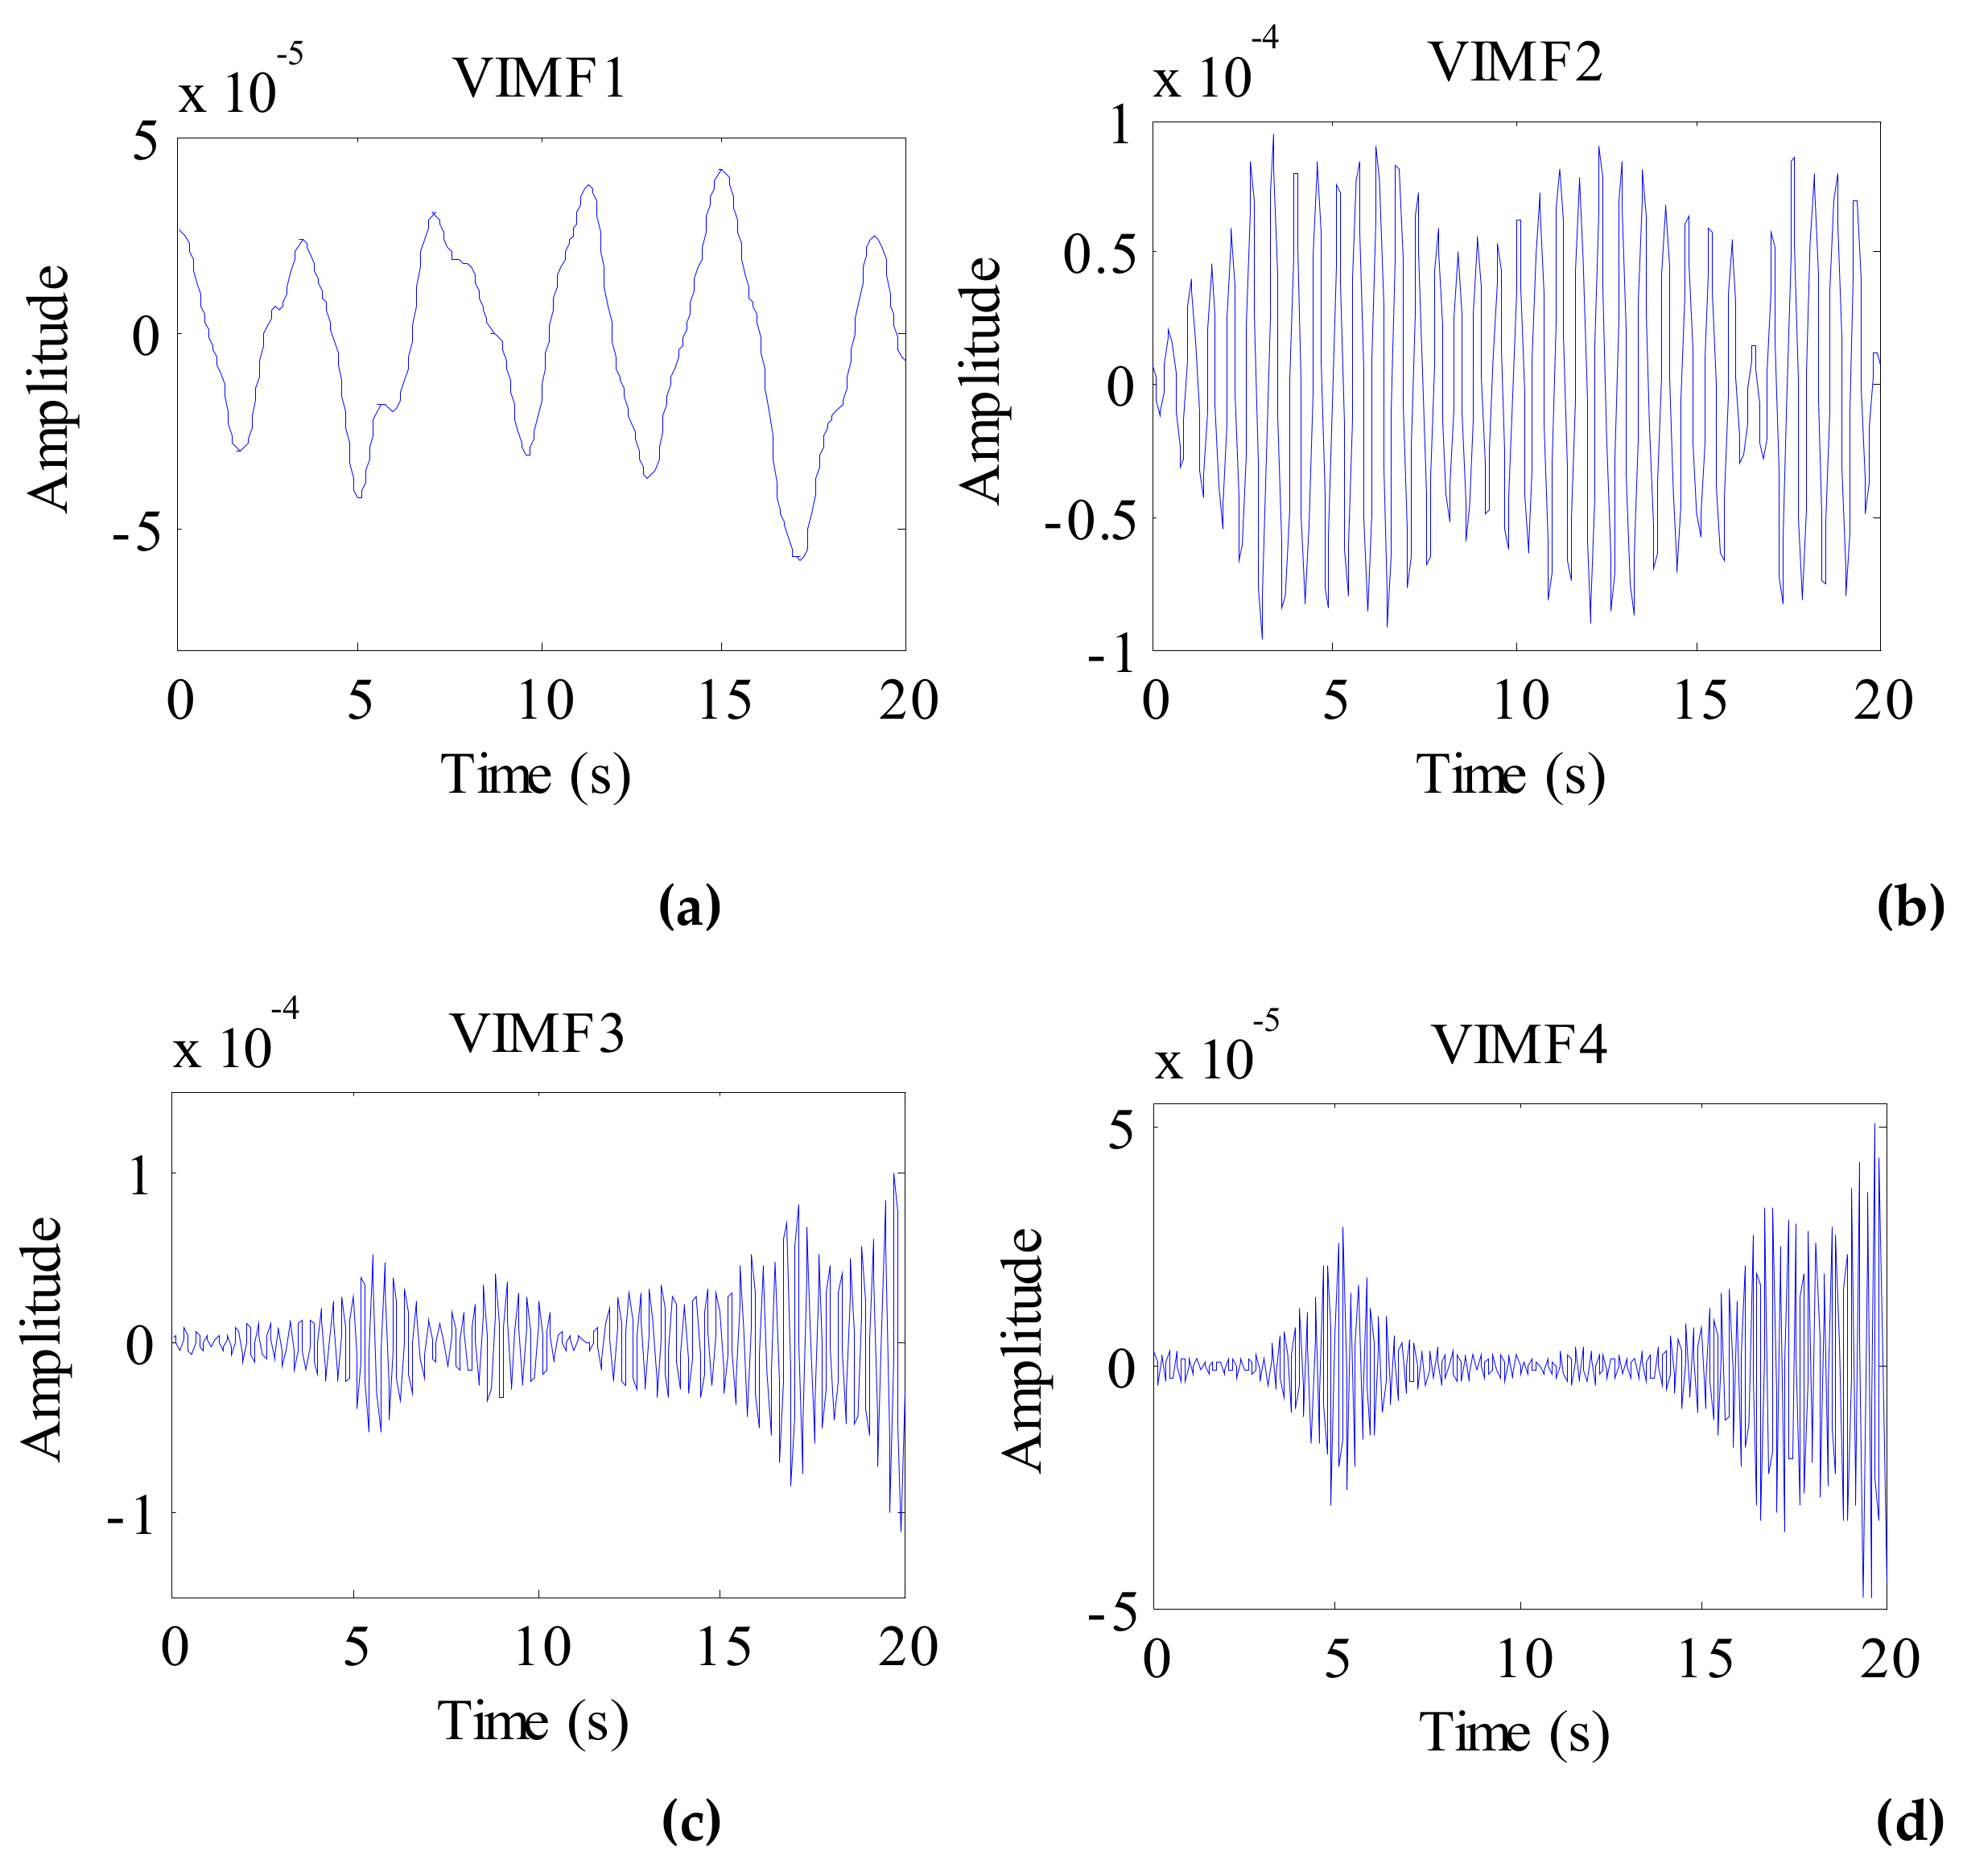
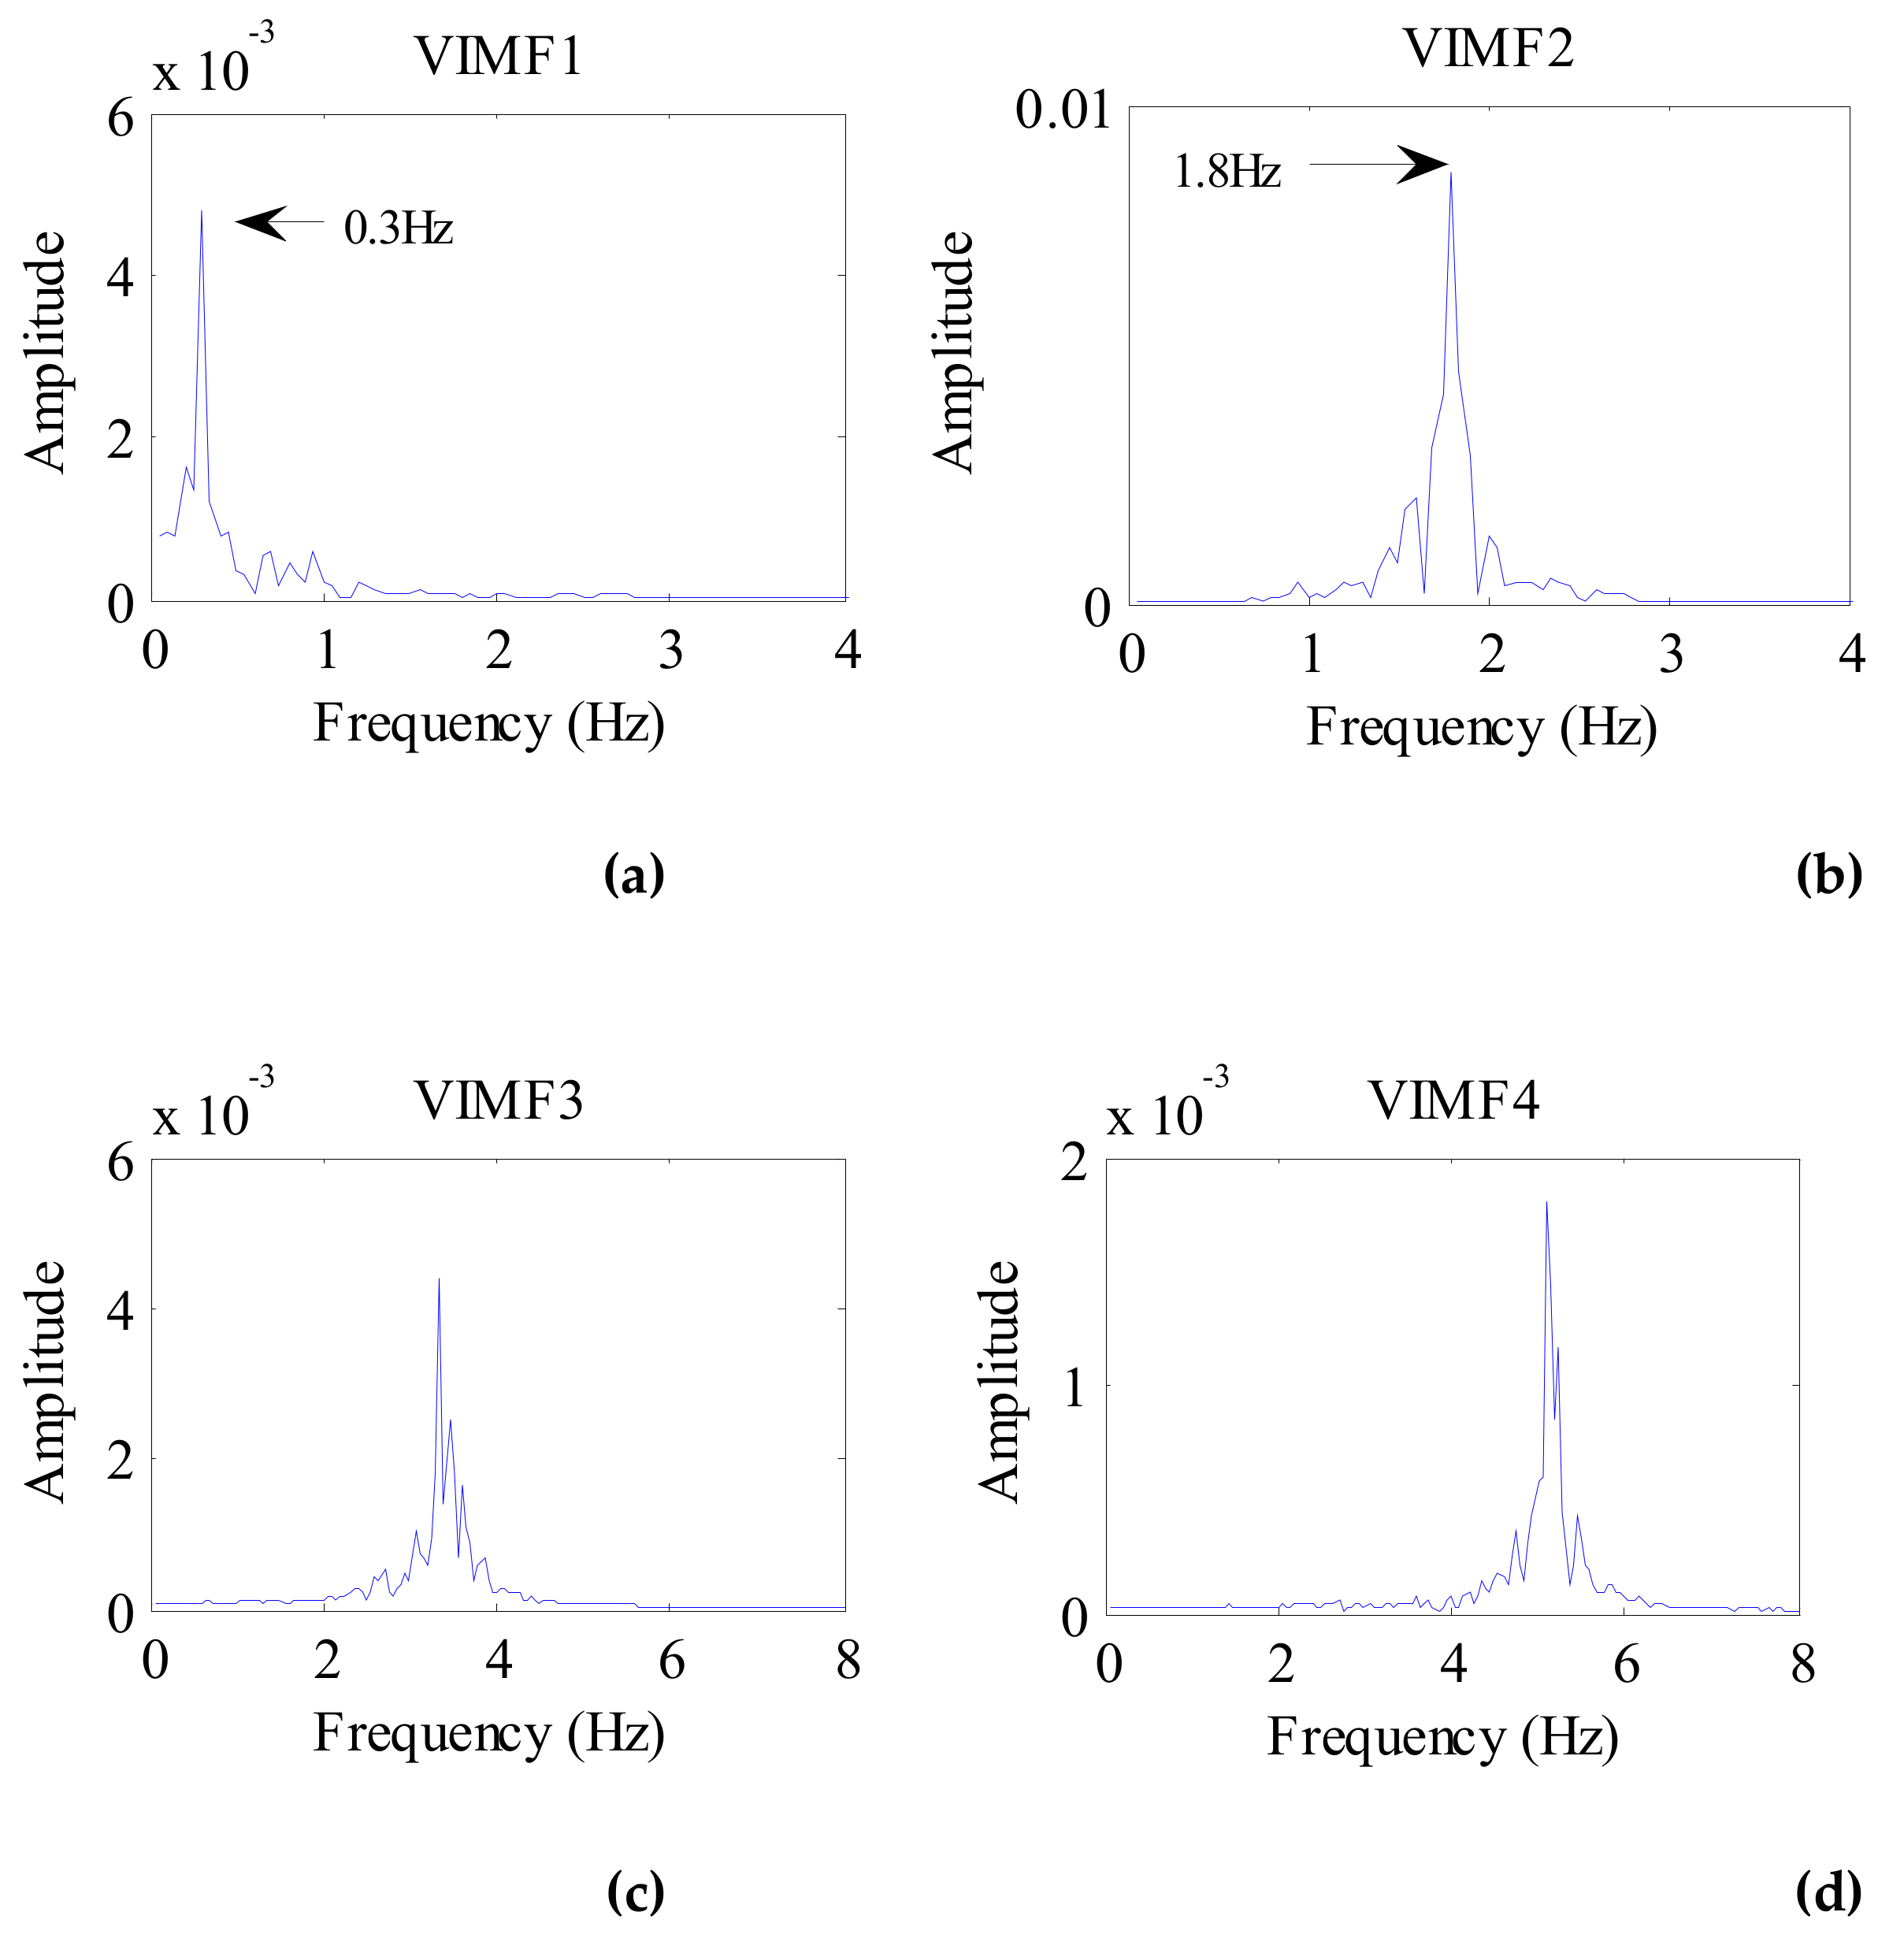
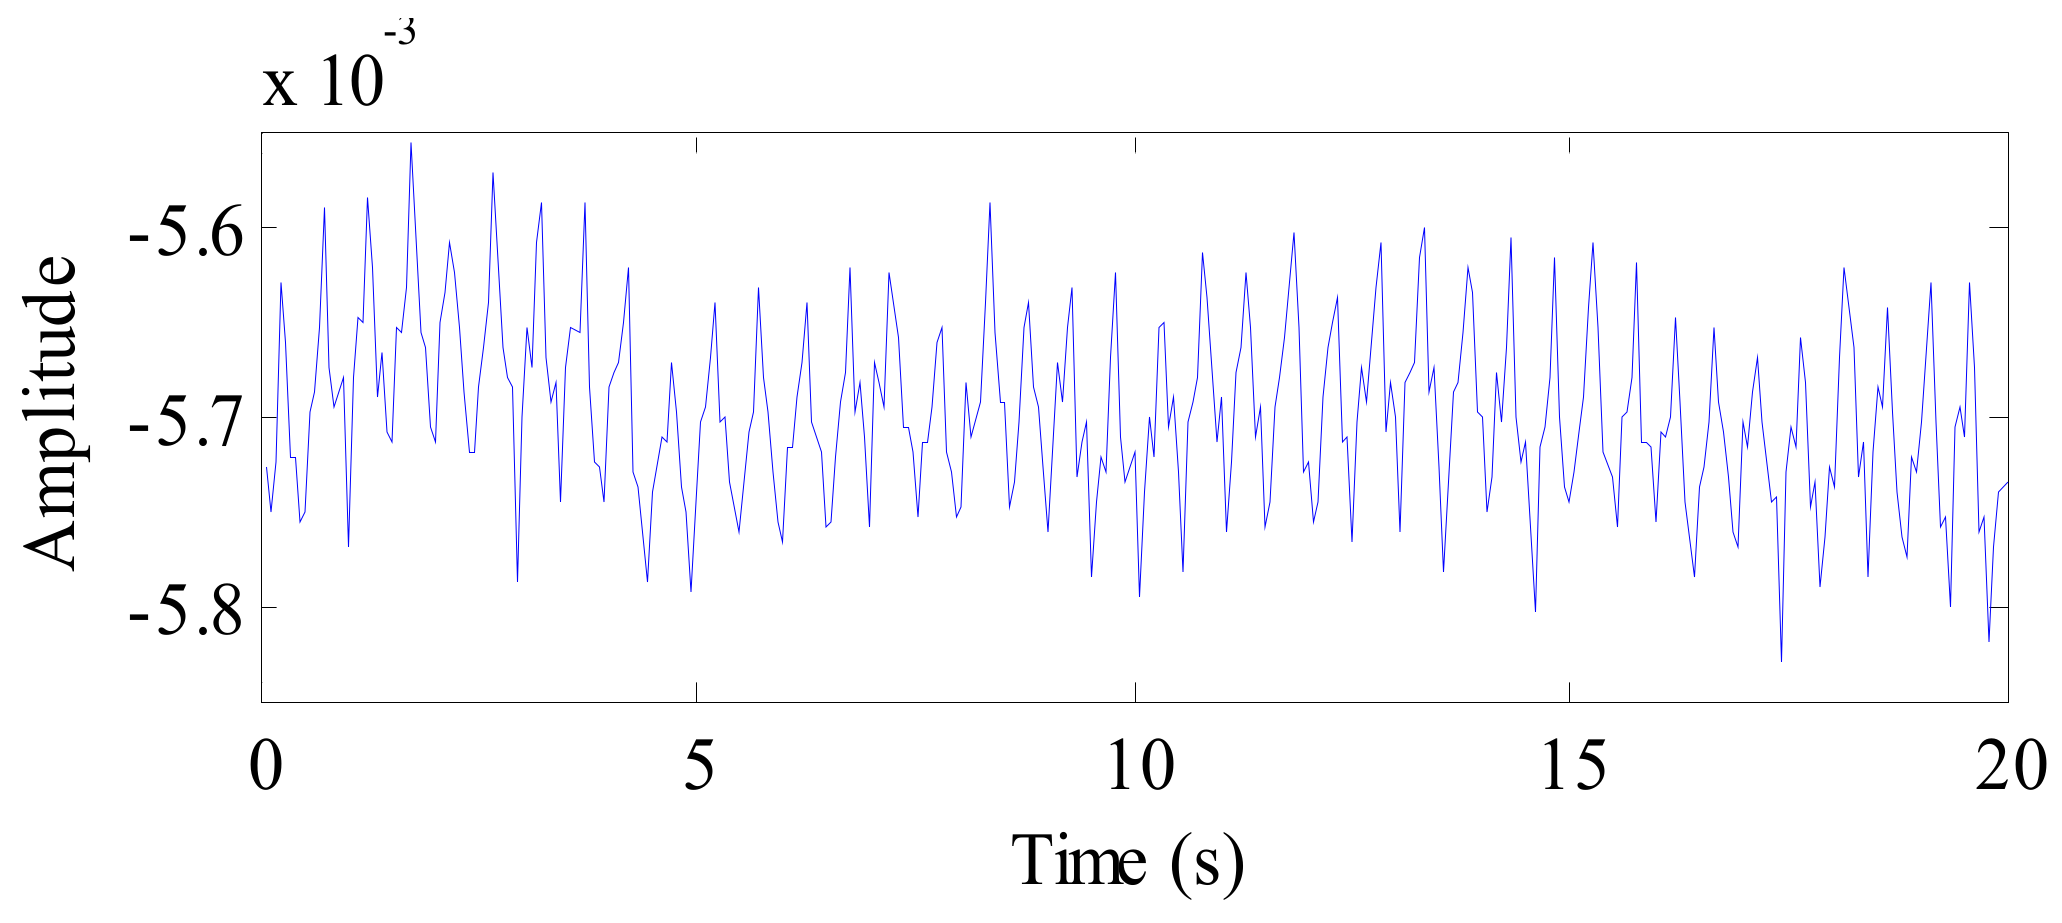
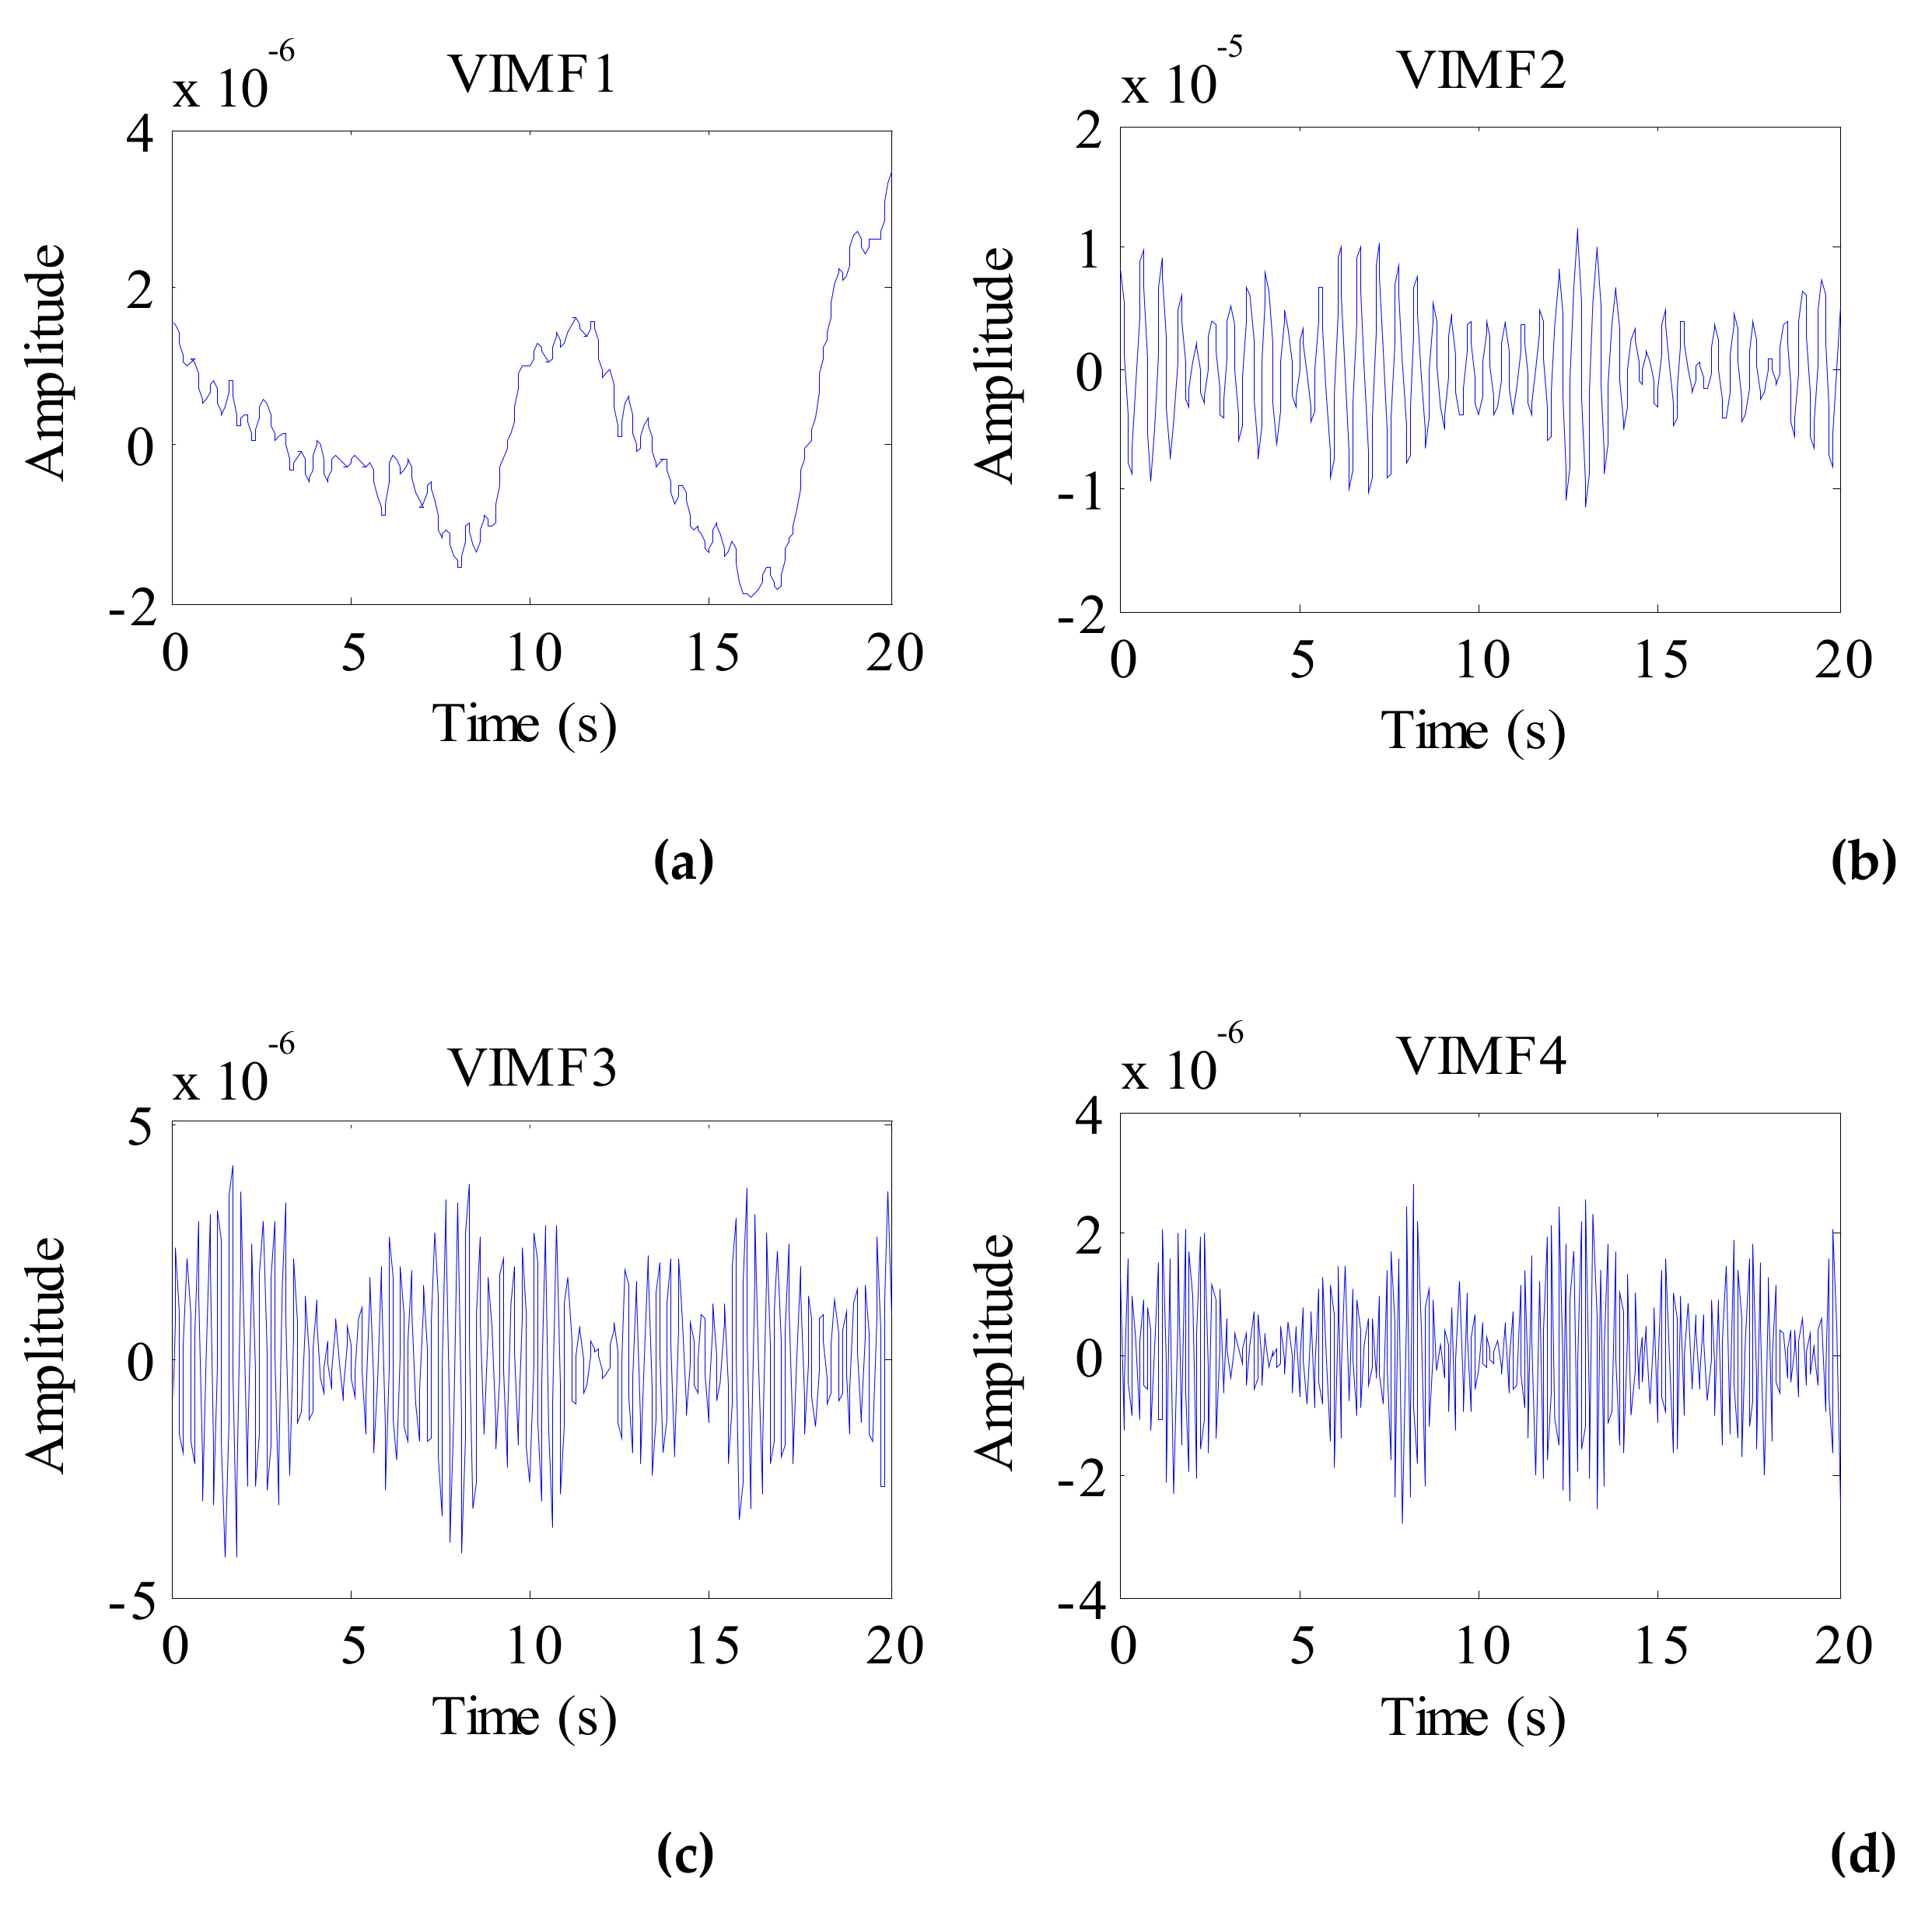
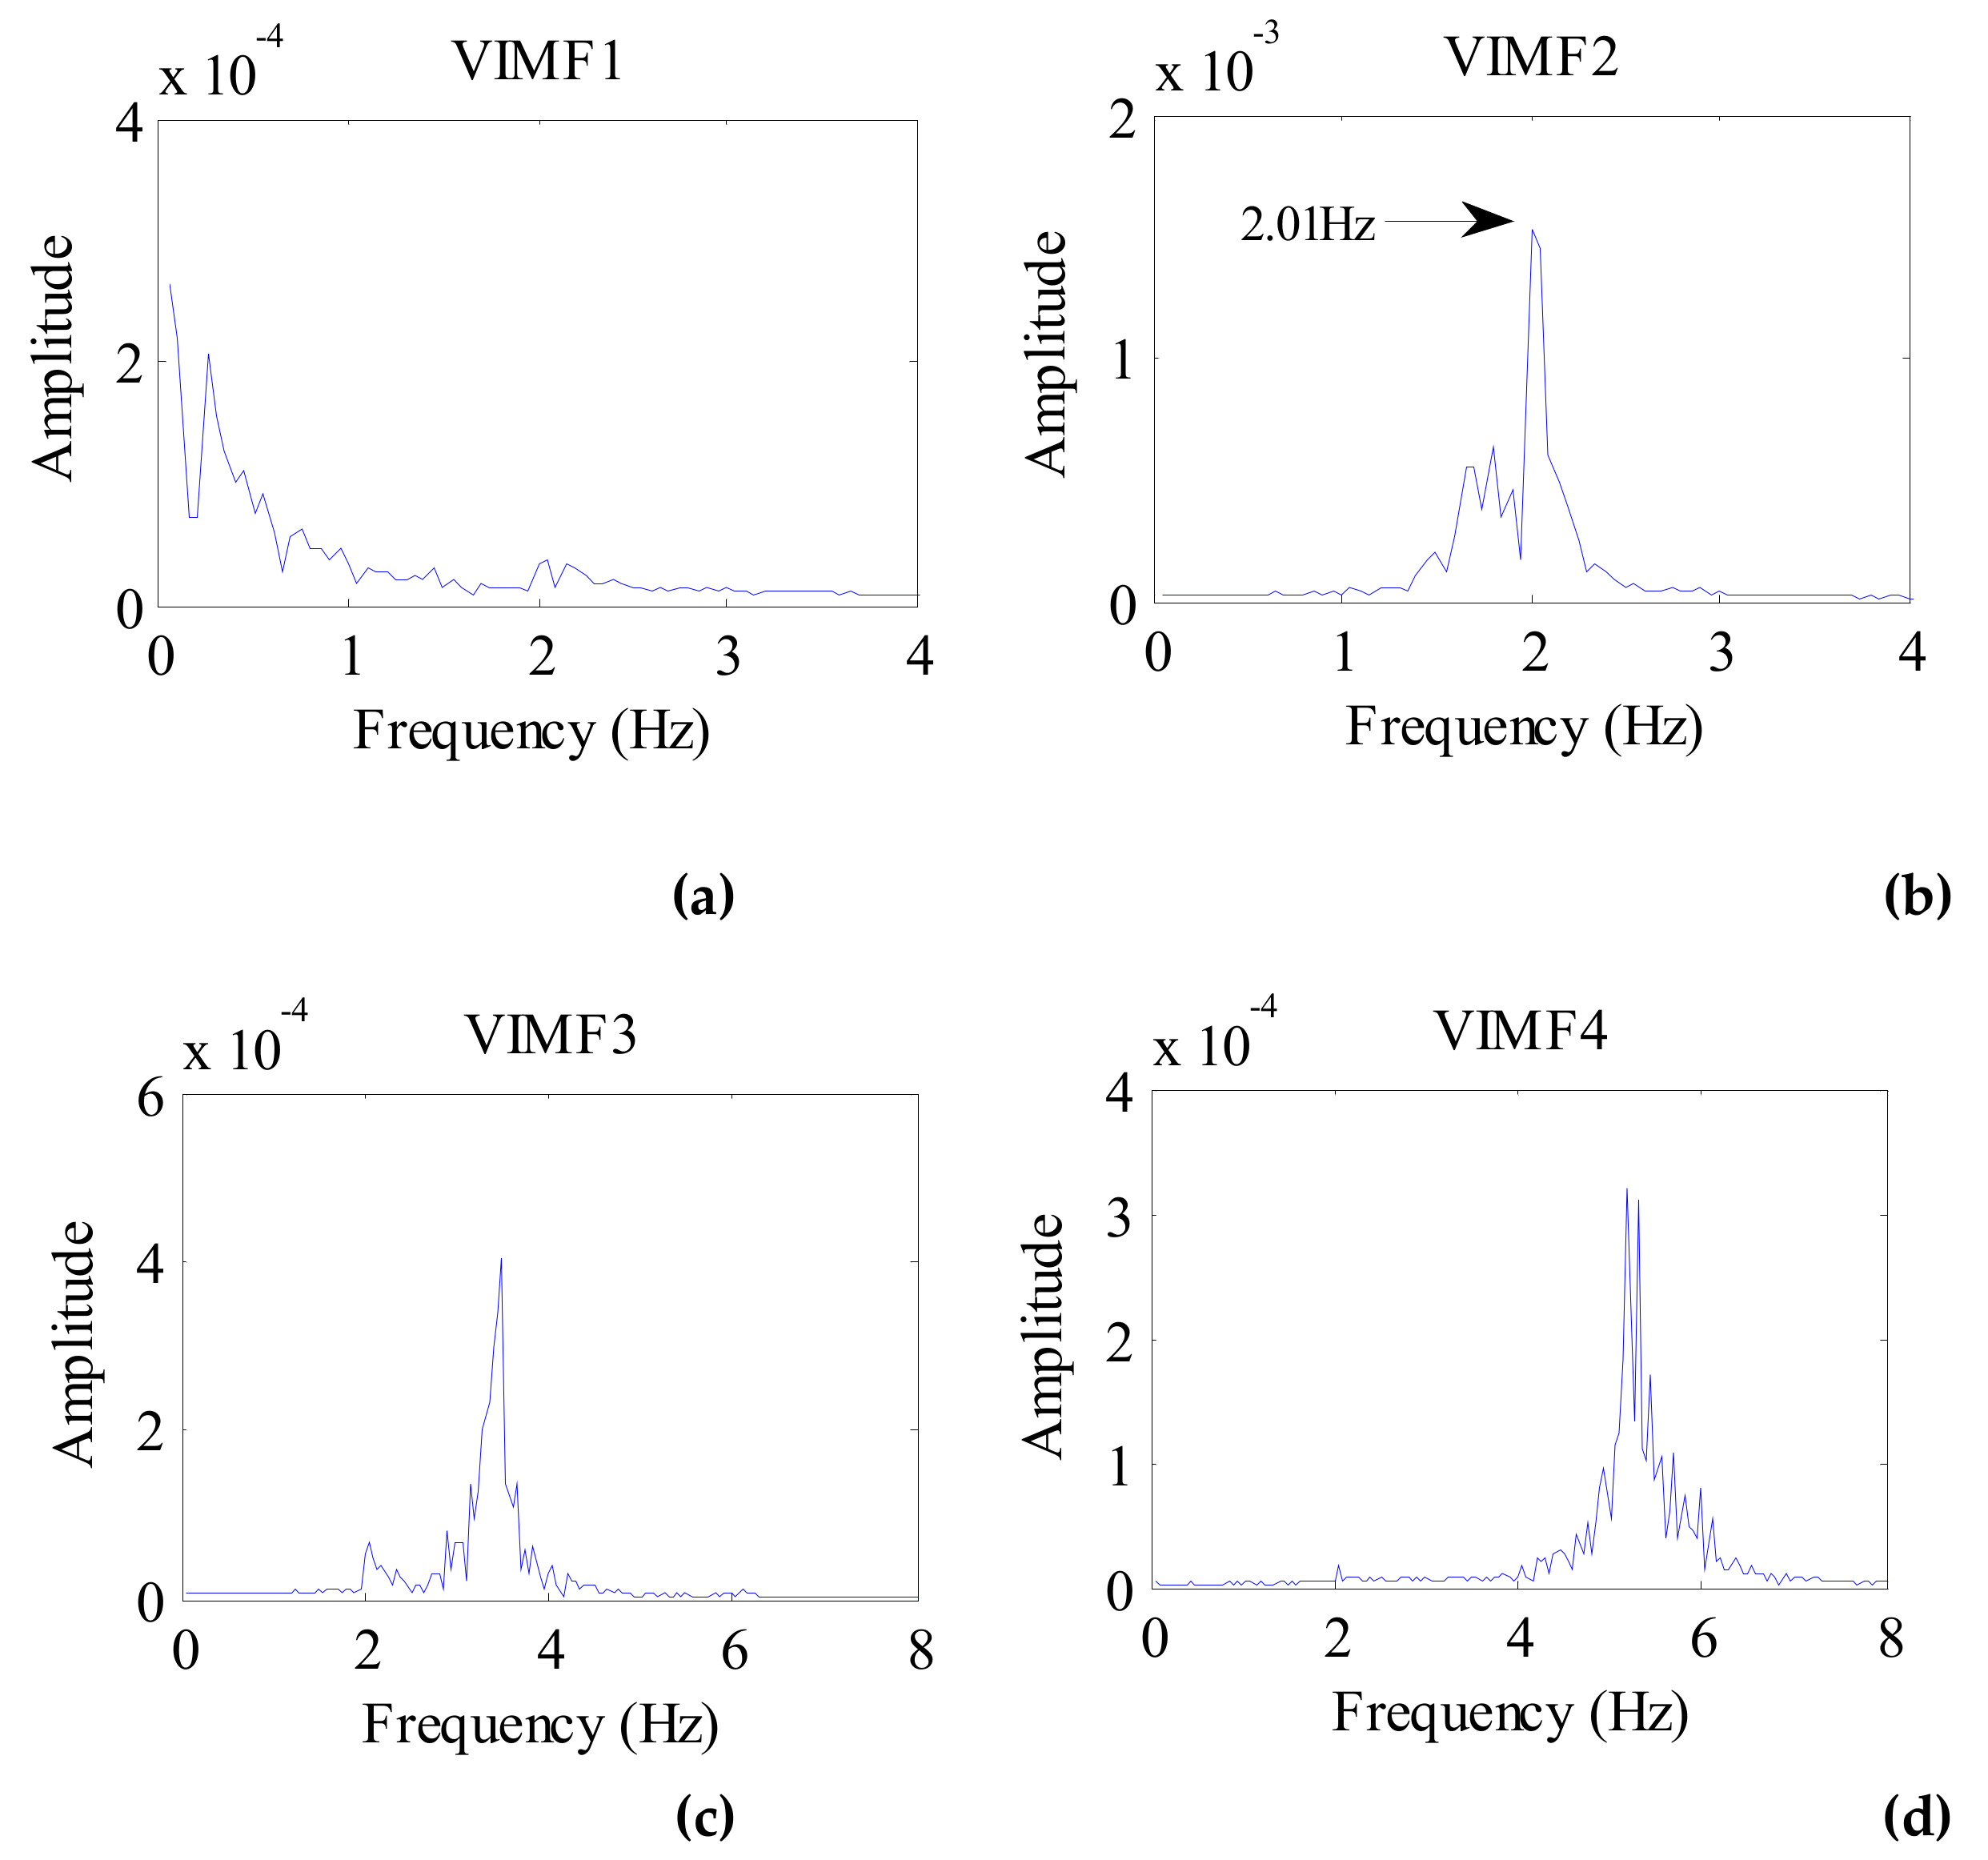
2.3. Variational Mode Decomposition
2.4. Respiratory and Heartbeat Energy Ratio
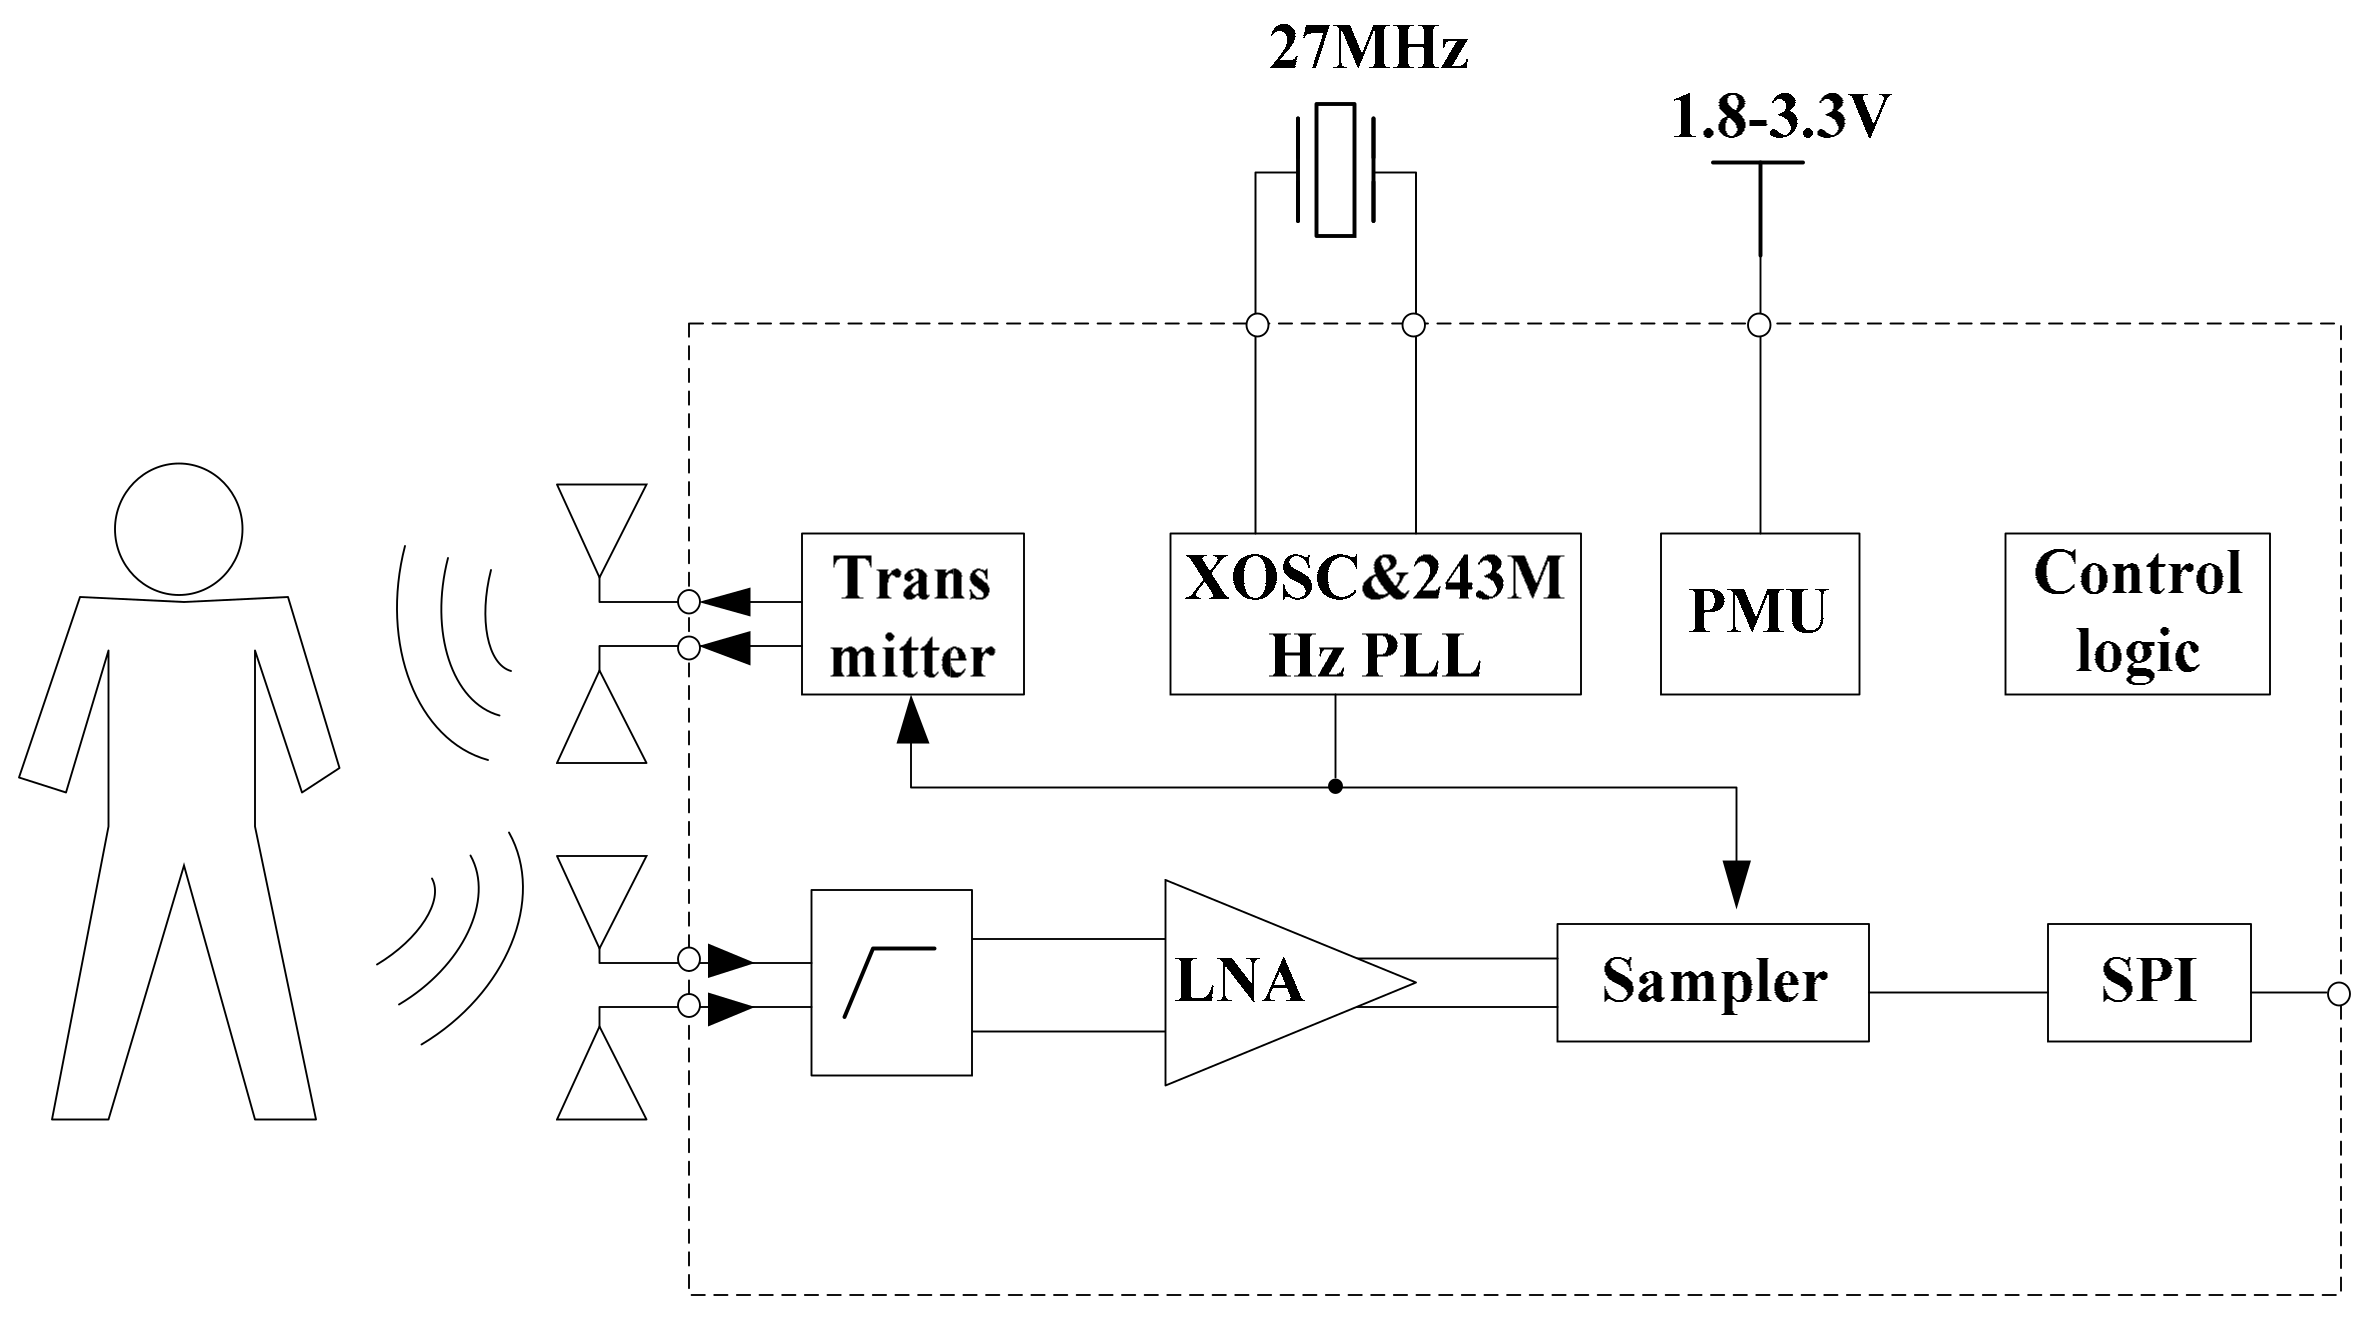
3. Architectures and Experiments
3.1. IR-UWB Radar System
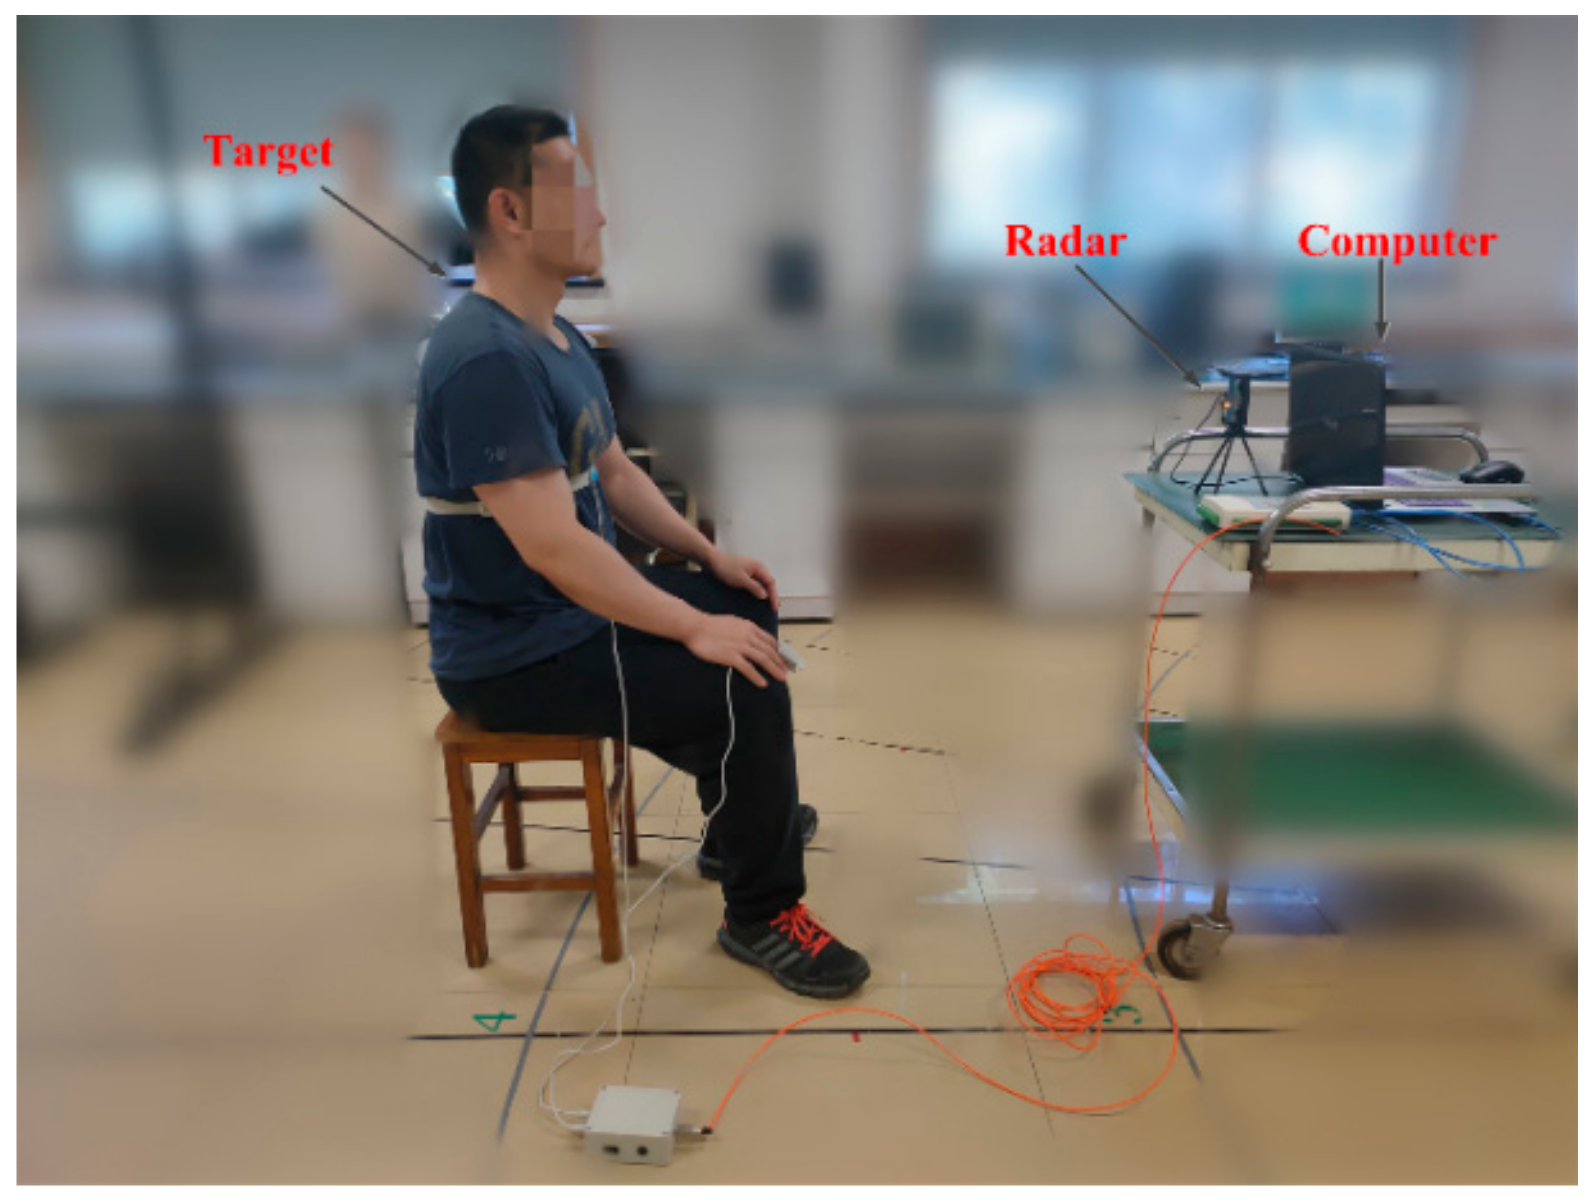
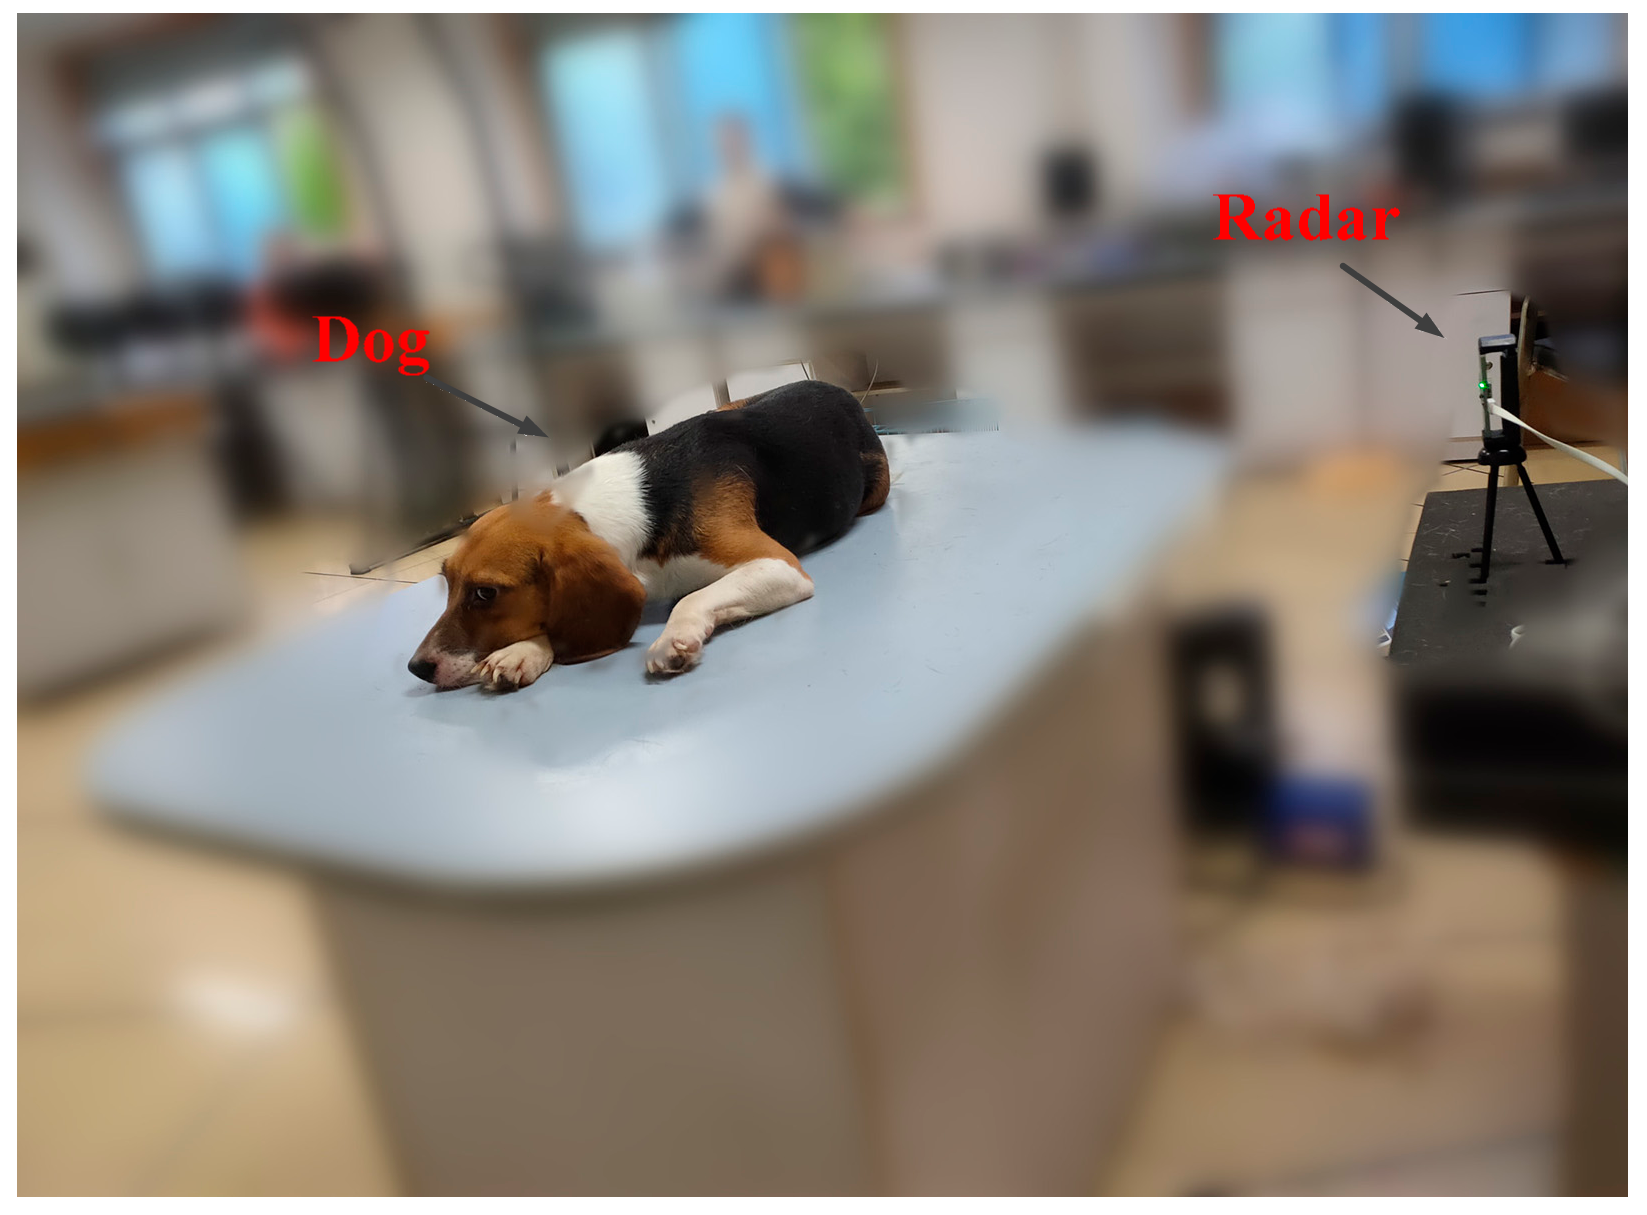
3.2. Experiments
3.2.1. Human Vital Signs Detection
3.2.2. Dog Vital Signs Detection
3.2.3. Cat and Rabbit Vital Signs Detection
4. Target Category Judgment
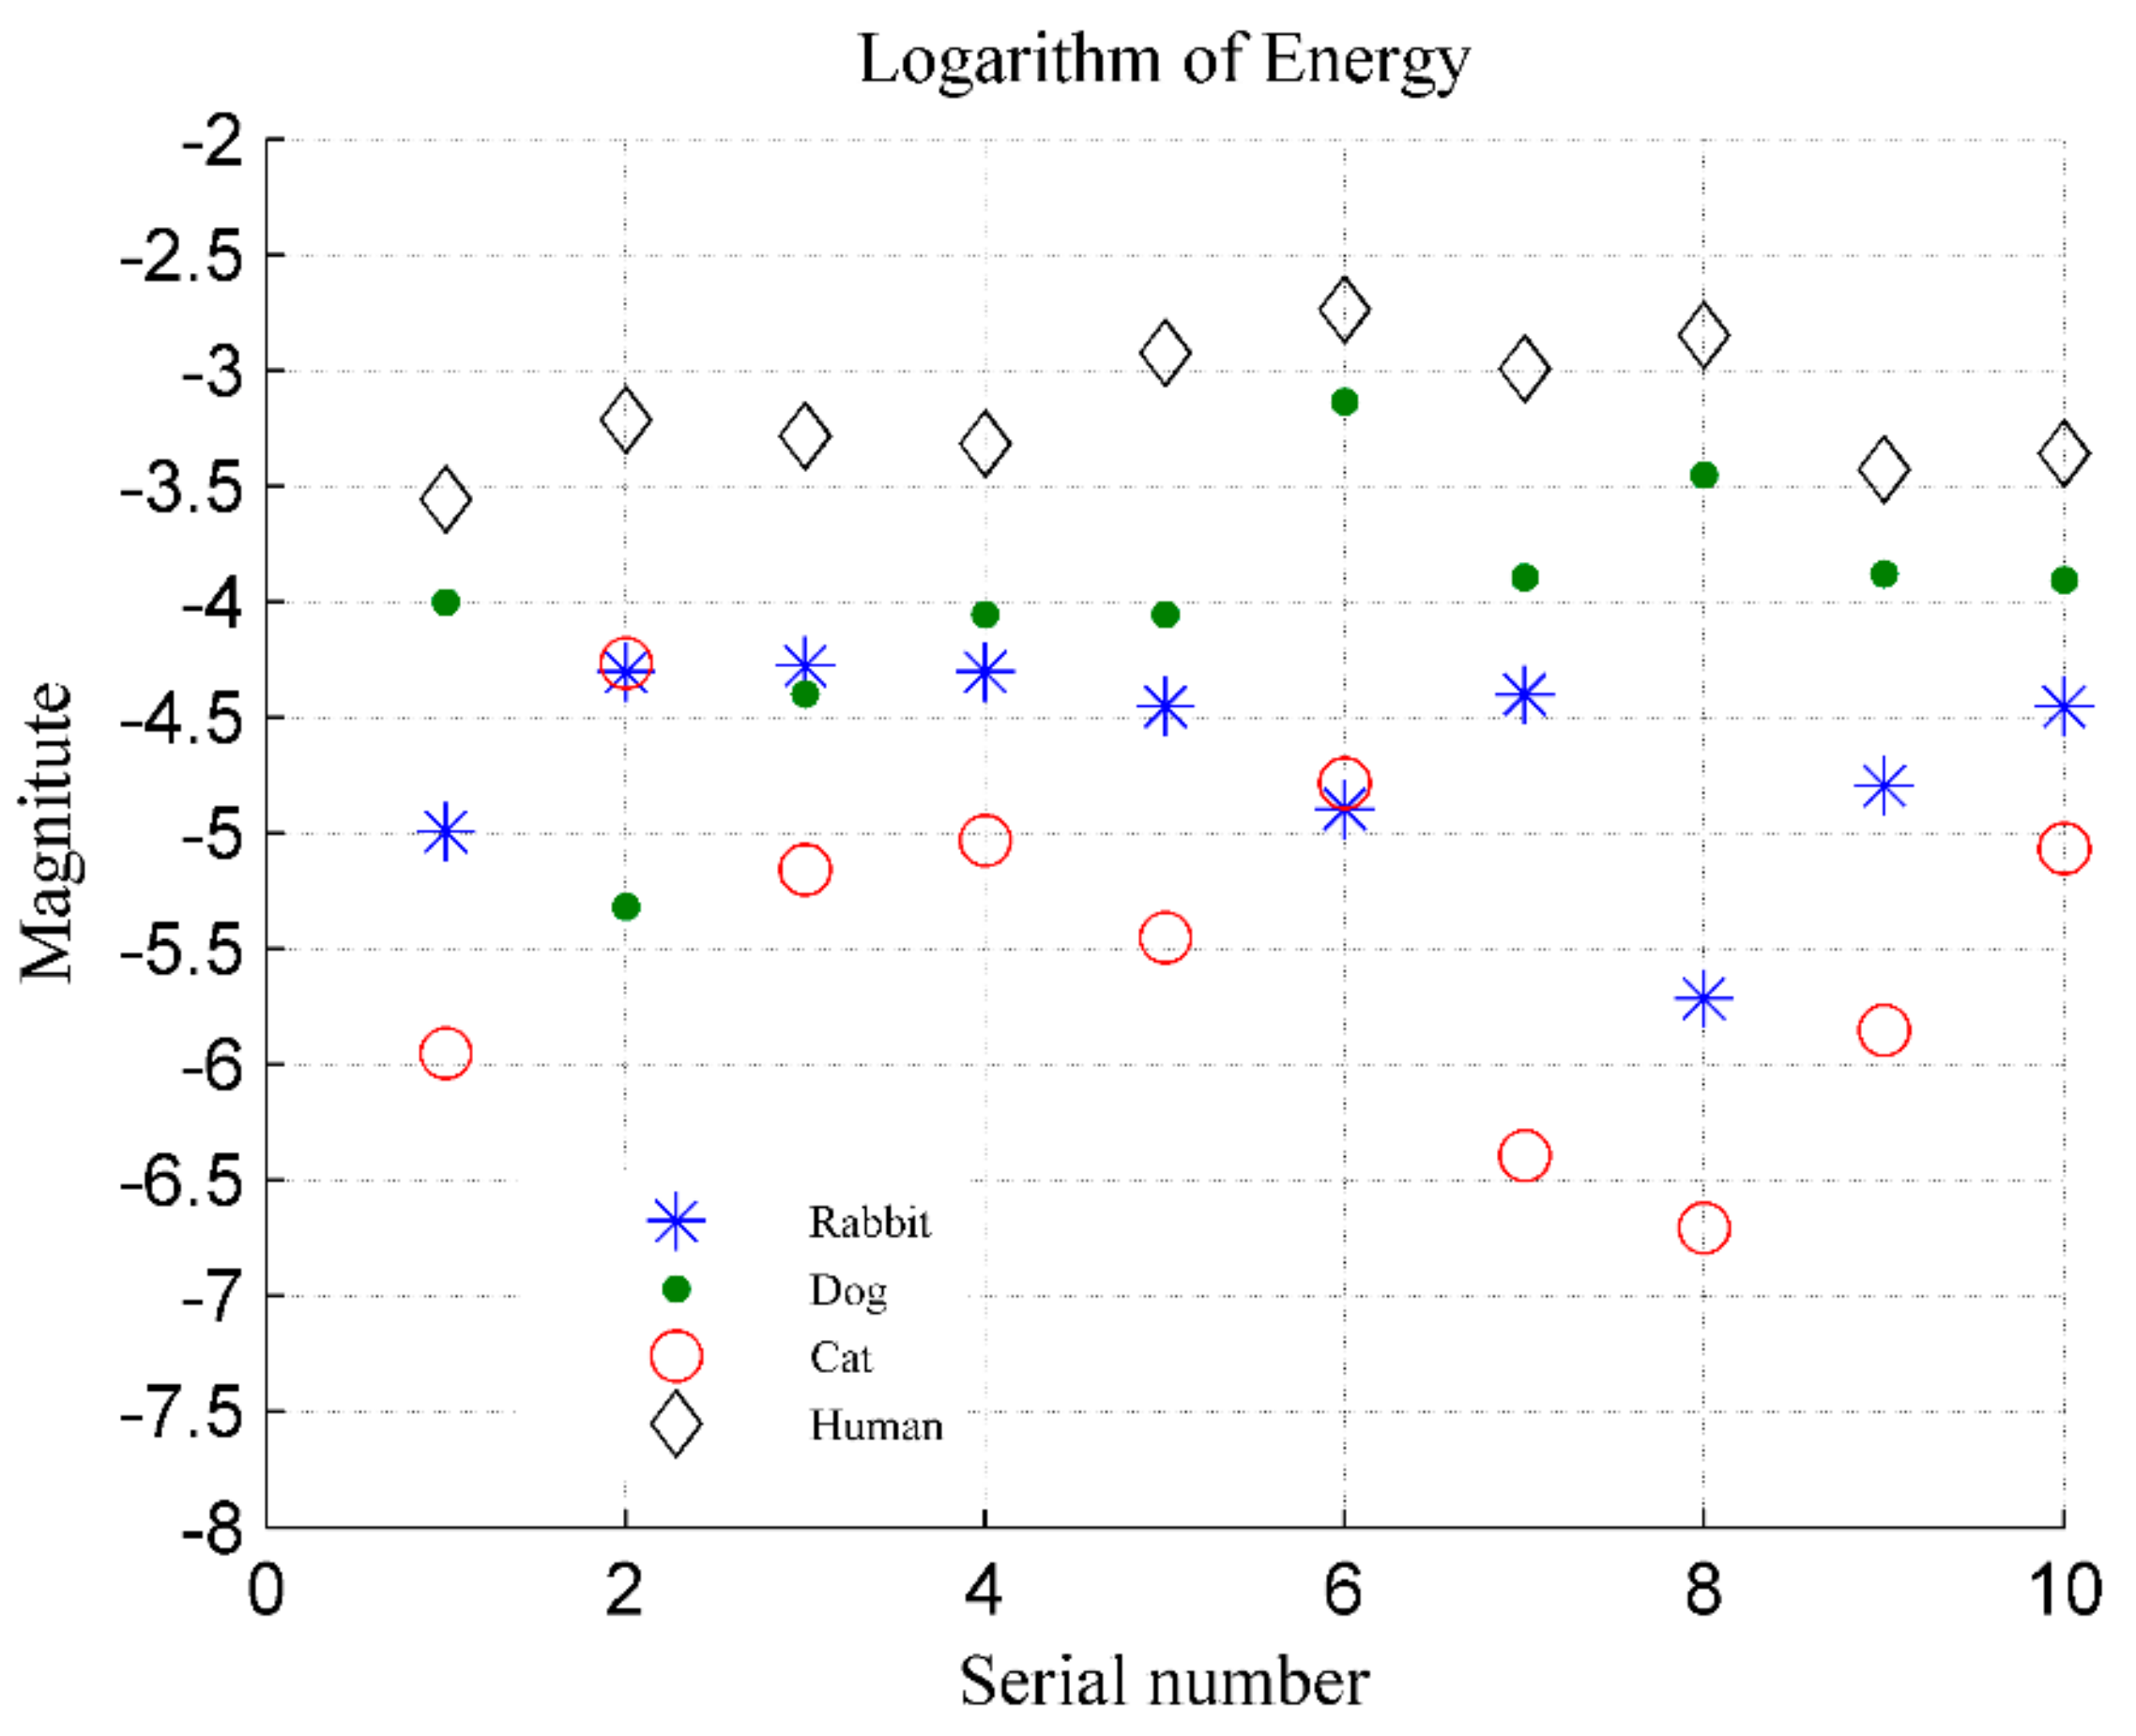
4.1. Distinguishing Based on Energy
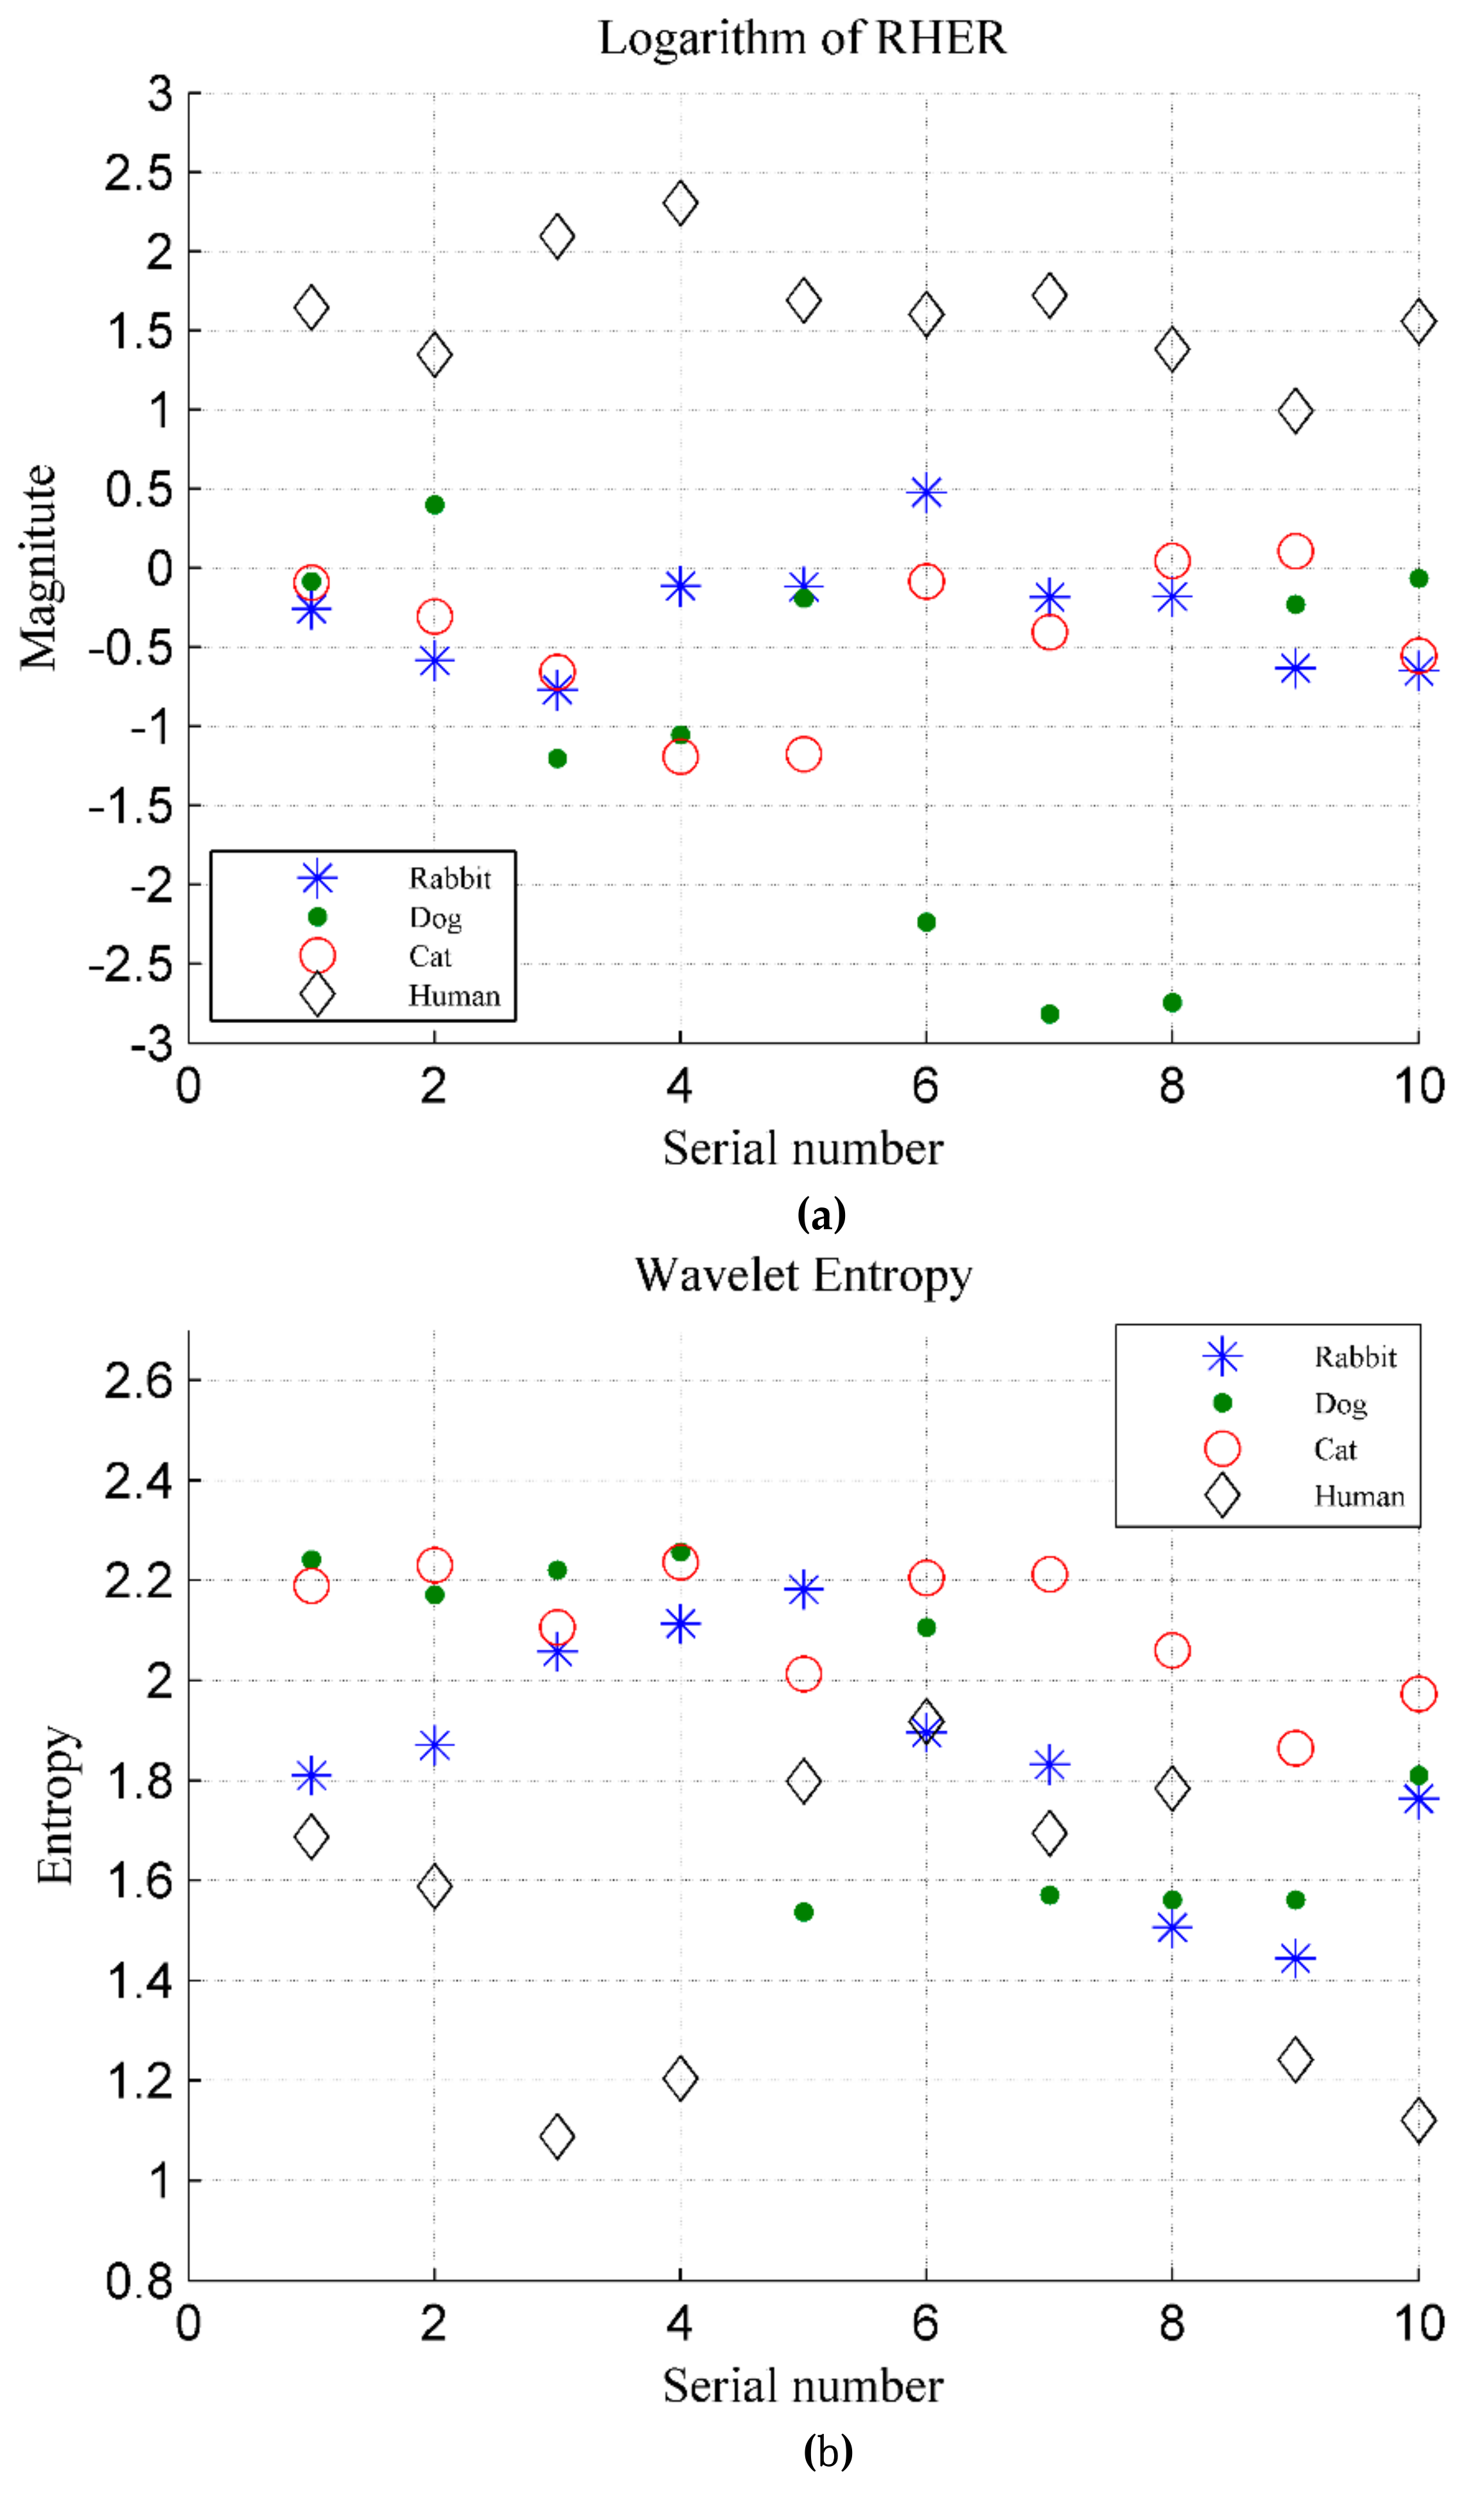
4.2. Distinguishing Based on RHER Index
5. Conclusions
Author Contributions
Funding
Acknowledgments
Conflicts of Interest
References
- Li, C.; Lubecke, V.M.; Boric-Lubecke, O.; Lin, J. A review on recent advances in Doppler radar sensors for noncontact healthcare monitoring. IEEE Trans. Microw. Theory Tech. 2013, 61, 2046–2060. [Google Scholar] [CrossRef]
- Li, C.; Peng, Z.; Huang, T.Y.; Fan, T.; Wang, F.-K.; Horng, T.-S.; Muñoz-Ferreras, J.-M.; Gómez-García, R.; Ran, L.; Lin, J.; et al. A review on recent progress of portable short-range noncontact microwave radar systems. IEEE Trans. Microw. Theory Tech. 2017, 65, 1692–1706. [Google Scholar] [CrossRef]
- Hong, H.; Zhang, L.; Zhao, H.; Chu, H.; Gu, C.; Brown, M.; Zhu, X.; Li, C. Microwave Sensing and Sleep: Noncontact Sleep-Monitoring Technology With Microwave Biomedical Radar. IEEE Microw. Mag. 2019, 20, 18–29. [Google Scholar] [CrossRef]
- Forster, H.; Ipsiroglu, O.; Kerbl, R.; Paditz, E. Sudden infant death and pediatric sleep disorders. Wiener Klin Wochenschr. 2003, 115, 847–849. [Google Scholar]
- Hafner, N.; Mostafanezhad, I.; Lubecke, V.M.; Boric-Lubecke, O.; Host-Madsen, A. Non-contact cardiopulmonary sensing with a baby monitor. In Proceedings of the 2007 29th Annual International Conference of the IEEE Engineering in Medicine and Biology Society, Lyon, France, 22–26 August 2007; pp. 2300–2302. [Google Scholar]
- Zhang, Y.; Qi, F.; Lv, H.; Liang, F.; Wang, J. Bioradar Technology: Recent Research and Advancements. IEEE Microw. Mag. 2019, 20, 58–73. [Google Scholar] [CrossRef]
- Duan, Z.; Liang, J. Non-contact detection of vital signs using a UWB radar sensor. IEEE Access 2018, 7, 36888–36895. [Google Scholar] [CrossRef]
- Baboli, M.; Singh, A.; Soll, B.; Boric-Lubecke, O.; Lubecke, V.M. Good night: Sleep monitoring using a physiological radar monitoring system integrated with a polysomnography system. IEEE Microw. Mag. 2015, 16, 34–41. [Google Scholar] [CrossRef]
- Alizadeh, M.; Shaker, G.; de Almeida, J.C.M.; Morita, P.P.; Safavi-Naeini, S. Remote monitoring of human vital signs using mmWave FMCW radar. IEEE Access 2019, 7, 54958–54968. [Google Scholar] [CrossRef]
- Lv, H.; Qi, F.; Zhang, Y.; Jiao, T.; Liang, F.; Li, Z.; Wang, J. Improved Detection of Human Respiration Using Data Fusion Based on a Multistatic UWB Radar. Remote Sens. 2016, 8, 773. [Google Scholar] [CrossRef]
- Kagawa, M.; Suzumura, K.; Matsui, T. Sleep stage classification by non-contact vital signs indices using Doppler radar sensors. In Proceedings of the 2016 38th Annual International Conference of the IEEE Engineering in Medicine and Biology Society (EMBC), Florida, FL, USA, 17–20 August 2016; pp. 4913–4916. [Google Scholar]
- Wang, P.; Qi, F.; Liu, M.; Liang, F.; Xue, H.; Zhang, Y.; Lv, H.; Wang, J. Noncontact Heart Rate Measurement Based on an Improved Convolutional Sparse Coding Method Using IR-UWB Radar. IEEE Access 2019, 7, 158492–158502. [Google Scholar] [CrossRef]
- Ye, C.; Toyoda, K.; Ohtsuki, T. Blind Source Separation on Non-contact Heartbeat Detection by Non-negative Matrix Factorization Algorithms. IEEE Trans. Biomed. Eng. 2019. [Google Scholar] [CrossRef] [PubMed]
- Zhao, H.; Hong, H.; Sun, L.; Li, Y.; Li, C.; Zhu, X. Noncontact physiological dynamics detection using low-power digital-IF Doppler radar. IEEE Trans. Instrum. Meas. 2017, 66, 1780–1788. [Google Scholar] [CrossRef]
- Khan, F.; Cho, S.H. A Detailed Algorithm for Vital Sign Monitoring of a Stationary/Non-Stationary Human through IR-UWB Radar. Sensors 2017, 17, 290. [Google Scholar] [CrossRef] [PubMed]
- Petrović, V.L.; Janković, M.M.; Lupšić, A.V.; Mihajlović, V.R.; Popović-Božović, J.S. High-Accuracy Real-Time Monitoring of Heart Rate Variability Using 24 GHz Continuous-Wave Doppler Radar. IEEE Access 2019, 7, 74721–74733. [Google Scholar] [CrossRef]
- The “2018 China Pet Industry White Paper” was First Released. Available online: https://www.sohu.com/a/249482032_311308 (accessed on 10 August 2019).
- Insurance Information Institute. Facts + Statistics: Pet Statistics|III. Available online: https://www.iii.org/fact-statistic/facts-statistics-pet-statistics (accessed on 20 August 2019).
- Schuurman, N.; Redmalm, D. Transgressing boundaries of grievability: Ambiguous emotions at pet cemeteries. Emot. Space Soc. 2019, 31, 32–40. [Google Scholar] [CrossRef]
- Kylkilahti, E.; Syrjälä, H.; Autio, J.; Kuismin, A.; Autio, M. Understanding co-consumption between consumers and their pets. Int. J. Consum. Stud. 2016, 40, 125–131. [Google Scholar] [CrossRef]
- Ram, S.S.; Ling, H. Microdoppler signature simulation of computer animated human and animal motions. In Proceedings of the 2008 IEEE Antennas and Propagation Society International Symposium, San Diego, CA, USA, 5–11 July 2008. [Google Scholar]
- Anderson, M.G.; Rogers, R.L. Micro-Doppler analysis of multiple frequency continuous wave radar signatures. In Radar Sensor Technology XI; International Society for Optics and Photonics: Orlando, FL, USA, 12–13 April 2007; Volume 6547. [Google Scholar]
- Villeval, S.; Bilik, I.; Gürbuz, S.Z. Application of a 24 GHz FMCW automotive radar for urban target classification. In Proceedings of the 2014 IEEE Radar Conference, Cincinnati, OH, USA, 19–23 May 2014. [Google Scholar]
- Kim, Y.; Ha, S.; Kwon, J. Human Detection Using Doppler Radar Based on Physical Characteristics of Targets. IEEE Geosci. Remote Sens. Lett. 2015, 12, 289–293. [Google Scholar]
- Wang, Y.; Yu, X.; Zhang, Y.; Lv, H.; Jiao, T.; Lu, G.; Li, W.Z.; Li, Z.; Jing, X.; Wang, J. Using wavelet entropy to distinguish between humans and dogs detected by uwb radar. Prog. Electromagn. Res. 2013, 139, 335–352. [Google Scholar] [CrossRef]
- Yu, X.; Jiao, T.J.; Lv, H.; Zhang, Y.; Li, Z.; Wang, J.Q. A new use of UWB radar to detecting victims and discriminating humans from animals. In Proceedings of the 2016 16th International Conference on Ground Penetrating Radar (GPR), Hong Kong, China, 13–16 June 2016. [Google Scholar]
- Adamsons, K., Jr. Breathing and the thermal environment in young rabbits. J. Physiol. 1959, 149, 144–153. [Google Scholar] [CrossRef]
- Orem, J.; Netick, A.; Dement, W.C. Breathing during sleep and wakefulness in the cat. Respir. Physiol. 1977, 30, 265–289. [Google Scholar] [CrossRef]
- Ainsworth, D.M.; Smith, C.A.; Henderson, K.S.; Dempsey, J.A. Breathing during exercise in dogs—Passive or active? J. Appl. Physiol. 1996, 81, 586–595. [Google Scholar] [CrossRef] [PubMed]
- Kamosińska, B.; Nowicki, D. Control of the heart rate by sympathetic nerves in cats. J. Auton. Nerv. Syst. 1989, 26, 241–249. [Google Scholar] [CrossRef]
- Maros, K.; Dóka, A.; Miklosi, A. Behavioural correlation of heart rate changes in family dogs. Appl. Anim. Behav. Sci. 2008, 109, 329–341. [Google Scholar] [CrossRef]
- Liu, L.; Liu, Z.; Barrowes, B.E. Through-wall bio-radiolocation with UWB impulse radar: Observation, simulation and signal extraction. IEEE J. Sel. Top. Appl. Earth Obs. Remote Sens. 2011, 4, 791–798. [Google Scholar] [CrossRef]
- Lazaro, A.; Girbau, D.; Villarino, R. Analysis of vital signs monitoring using an IR-UWB radar. Prog. Electromagn. Res. 2010, 100, 265–284. [Google Scholar] [CrossRef]
- Dragomiretskiy, K.; Zosso, D. Variational Mode Decomposition. IEEE Trans. Signal Process. 2014, 62, 531–544. [Google Scholar] [CrossRef]
- Wang, Y.; Markert, R.; Xiang, J.; Zheng, W. Research on variational mode decomposition and its application in detecting rub-impact fault of the rotor system. Mech. Syst. Signal Process. 2015, 60–61, 243–251. [Google Scholar] [CrossRef]
- Ming, Z.; Jiang, Z.; Feng, K. Research on variational mode decomposition in rolling bearings fault diagnosis of the multistage centrifugal pump. Mech. Syst. Signal Process. 2017, 93, 460–493. [Google Scholar]
- Lahmiri, S. Comparative study of ECG signal denoising by wavelet thresholding in empirical and variational mode decomposition domains. Healthc. Technol. Lett. 2014, 1, 104–109. [Google Scholar] [CrossRef]
- Shen, H.; Xu, C.; Yang, Y.; Sun, L.; Cai, Z.; Bai, L.; Clancy, E.; Huang, X. Respiration and Heartbeat Rates Measurement Based on Autocorrelation Using IR-UWB Radar. IEEE Trans. Circuits Systems II Express Briefs 2018, 65, 1470–1474. [Google Scholar] [CrossRef]
- Xue, Y.J.; Cao, J.X.; Wang, D.X.; Du, H.-K.; Yao, Y. Application of the Variational-Mode Decomposition for Seismic Time–frequency Analysis. IEEE J. Sel. Top. Appl. Earth Obs. Remote Sens. 2017, 9, 3821–3831. [Google Scholar] [CrossRef]
- Li, F.; Bo, Z.; Verma, S.; Marfurt, K.J. Seismic signal denoising using thresholded variational mode decomposition. Exploration Geophysics 2017, 49, 450–461. [Google Scholar] [CrossRef]
- Li, Z.; Li, W.; Lv, H.; Zhang, Y.; Jing, X.; Wang, J. A novel method for respiration-like clutter cancellation in life detection by dual-frequency IR-UWB radar. IEEE Trans. Microw. Theory Tech. 2013, 61, 2086–2092. [Google Scholar] [CrossRef]
- Wang, Y. Study on the Technology of Distinguishing Between Humans and Animals Via UWB Bio-Radar. Ph.D. Dissertation, The Fourth Military Medical University, Xi’an, China, 2014. [Google Scholar]
- Andersen, N.; Granhaug, K.; Michaelsen, J.A.; Bagga, S.; Hjortland, H.A.; Knutsen, M.R.; Lande, T.S.; Wisland, D.T. A 118-mW pulse-based radar soc in 55-nm CMOS for non-contact human vital signs detection. IEEE J. Solid-State Circuits 2017, 52, 3421–3433. [Google Scholar] [CrossRef]
- Hestenes, M.R. Multiplier and gradient methods. J. Optim. Theory Appl. 1969, 4, 303–320. [Google Scholar] [CrossRef]
- Fike, J.R.; Druy, E.M.; Zook, B.C.; Davis, D.O.; Thompson, J.E.; Chaney, E.; Bradley, E.W. Canine anatomy as assessed by computed tomography. Am. J. Vet. Res. 1980, 41, 1823–1832. [Google Scholar]
- Buchanan, J.W. Vertebral scale system to measure canine heart size in radiographs. J. Am. Vet. Med. Assoc. 1995, 206, 194. [Google Scholar]
- Litster, A.L.; Buchanan, J.W. Vertebral scale system to measure heart size in radiographs of cats. J. Am. Vet. Med. Assoc. 2000, 216, 210–214. [Google Scholar] [CrossRef]
- Wyndaele, J.J. Color atlas of human anatomy. Spinal Cord 1995, 47, 838. [Google Scholar] [CrossRef][Green Version]
- Stahl, W.R. Organ weights in primates and other mammals. Science 1965, 150, 1039–1042. [Google Scholar] [CrossRef]
- Young, J.F.; Luecke, R.H.; Pearce, B.A.; Lee, T.; Ahn, H.; Baek, S.; Moon, H.; Dye, D.W.; Davis, T.M.; Taylor, S.J. Human organ/tissue growth algorithms that include obese individuals and black/white population organ weight similarities from autopsy data. J. Toxicol. Environ. Health Part A 2009, 72, 527–540. [Google Scholar] [CrossRef] [PubMed]
- Choi, S.Y.; Hwang, J.S.; Kim, I.H.; Hwang, D.Y.; Kang, H.G. Basic data on the hematology, serum biochemistry, urology, and organ weights of beagle dogs. Lab. Anim. Res. 2011, 27, 283–291. [Google Scholar] [CrossRef]
- Cao, Y.H. Association of The skeletal muscle traits with expression, DNA methylation of the MyoG gene in different levels of environmental meat rabbits. Master’s Dissertation, Shandong Agricultural University, Tai’an, China, 2016. [Google Scholar]
- Davis, D.D. Allometric Relationships in Lions vs. Domestic Cats. Evolution 1962, 16, 505–514. [Google Scholar] [CrossRef]
- Gabriel, C. Compilation of the Dielectric Properties of Body Tissues at RF and Microwave Frequencies; King’s College London—Department of Physics: London, UK, 1996. [Google Scholar]
- Kaatze, U. Measuring the dielectric properties of materials. Ninety-year development from low-frequency techniques to broadband spectroscopy and high-frequency imaging. Meas. Sci. Technol. 2012, 24, 012005. [Google Scholar] [CrossRef]
- Peyman, A.; Gabriel, C. Cole–Cole parameters for the dielectric properties of porcine tissues as a function of age at microwave frequencies. Phys. Med. Biol. 2010, 55, N413. [Google Scholar] [CrossRef] [PubMed]
- Stoy, R.D.; Foster, K.R.; Schwan, H.P. Dielectric properties of mammalian tissues from 0.1 to 100 MHz; a summary of recent data. Phys. Med. Biol. 1982, 27, 501. [Google Scholar] [CrossRef] [PubMed]


| Target | Weight (kg) | Organ Weight (g) | LHWR | ||
|---|---|---|---|---|---|
| Lungs | Heart | ||||
| Human | M | 75 | 1136 | 380 | 2.99 |
| F | 50 | 797 | 243 | 3.28 | |
| Dog | M | 9.89 | 86.13 | 76.86 | 1.12 |
| F | 8.74 | 77.63 | 68.52 | 1.13 | |
| Cat | M&F | 1.542 | 15 | 10 | 1.50 |
| Rabbit | M&F | 2.587 | 13.72 | 9.23 | 1.49 |
© 2019 by the authors. Licensee MDPI, Basel, Switzerland. This article is an open access article distributed under the terms and conditions of the Creative Commons Attribution (CC BY) license (http://creativecommons.org/licenses/by/4.0/).
Share and Cite
Wang, P.; Zhang, Y.; Ma, Y.; Liang, F.; An, Q.; Xue, H.; Yu, X.; Lv, H.; Wang, J. Method for Distinguishing Humans and Animals in Vital Signs Monitoring Using IR-UWB Radar. Int. J. Environ. Res. Public Health 2019, 16, 4462. https://doi.org/10.3390/ijerph16224462
Wang P, Zhang Y, Ma Y, Liang F, An Q, Xue H, Yu X, Lv H, Wang J. Method for Distinguishing Humans and Animals in Vital Signs Monitoring Using IR-UWB Radar. International Journal of Environmental Research and Public Health. 2019; 16(22):4462. https://doi.org/10.3390/ijerph16224462
Chicago/Turabian StyleWang, Pengfei, Yang Zhang, Yangyang Ma, Fulai Liang, Qiang An, Huijun Xue, Xiao Yu, Hao Lv, and Jianqi Wang. 2019. "Method for Distinguishing Humans and Animals in Vital Signs Monitoring Using IR-UWB Radar" International Journal of Environmental Research and Public Health 16, no. 22: 4462. https://doi.org/10.3390/ijerph16224462
APA StyleWang, P., Zhang, Y., Ma, Y., Liang, F., An, Q., Xue, H., Yu, X., Lv, H., & Wang, J. (2019). Method for Distinguishing Humans and Animals in Vital Signs Monitoring Using IR-UWB Radar. International Journal of Environmental Research and Public Health, 16(22), 4462. https://doi.org/10.3390/ijerph16224462