A Spatial Analysis of the Prevalence of Female Genital Mutilation/Cutting among 0–14-Year-Old Girls in Kenya

 ,
, 
Abstract
1. Introduction
The Theory behind Normative Influences on FGM/C Prevalence
2. Methods
2.1. Data
2.2. Outcome Variable
2.3. Exposure Variables
2.4. Statistical Analysis
2.4.1. Bivariate Data Analysis
2.4.2. Bayesian Hierarchical Spatial and Space-Time Modelling
3. Results
3.1. Descriptive Analysis
3.2. Regional Evolution of FGM/C Prevalence among 0–14 Years Old Girls in Kenya
3.3. Bayesian Hierarchical Geo-Additive Logistic Regression
3.4. 2014 KDHS
3.5. Pooled 2003 to 2014 Data
4. Discussion
Limitation
5. Conclusions
Author Contributions
Funding
Acknowledgments
Conflicts of Interest
Appendix A

| Variable | 1998 KDHS | 2003 KDHS | 2008 KDHS | 2014 KDHS | ||||
|---|---|---|---|---|---|---|---|---|
| N = 4069, FGM = 9.9 | N = 4048, FGM = 9.4% | N = 7195, FGM = 7.6% | N = 12,434, FGM = 3% | |||||
| n (%) | p-value | n (%) | p-value | n (%) | p-value | n (%) | p-value | |
| Age group (girls) | <0.001 | <0.001 | <0.001 | <0.001 | ||||
| 0–4 | 2125 (5.3) | 2287 (7.0) | 2644 (3.8) | 4453 (0.3) | ||||
| 5–9 | 1221 (13.8) | 1118 (11.4) | 2478 (7.2) | 4479 (2.4) | ||||
| 10–14 | 723 (17.1) | 643 (14.8) | 2074 (12.8) | 3506 (7.3) | ||||
| Age group (mother) | <0.001 | <0.001 | <0.001 | <0.001 | ||||
| 15–19 | 144 (0.0) | 175 (1.0) | 137 (0.0) | 218 (0.0) | ||||
| 20–24 | 678 (0.7) | 694 (2.0) | 1009 (0.7) | 1354 (0.5) | ||||
| 25–29 | 972 (5.2) | 922 (4.1) | 1561 (5.0) | 3088 (1.7) | ||||
| 30–34 | 798 (7.1) | 863 (7.9) | 1864 (5.1) | 3143 (3.5) | ||||
| 35–39 | 795 (17.9) | 656 (12.7) | 1304 (11.3) | 2475 (4.5) | ||||
| 40–44 | 419 (21.5) | 491 (24.6) | 822 (13.3) | 1396 (3.8) | ||||
| 45–49 | 262 (22.9) | 248 (22.8) | 499 (21.9) | 762 (5.1) | ||||
| Residence | <0.001 | 0.001 | <0.001 | <0.001 | ||||
| urban | 773 (4.4) | 841 (5.8) | 1245 (2.6) | 4093 (1.9) | ||||
| rural | 3296 (11.2) | 3207 (10.4) | 5950 (8.6) | 8345 (3.5) | ||||
| Region/Province | <0.001 | <0.001 | <0.001 | <0.001 | ||||
| nairobi | 280 (2.7) | 301 (4.9) | 360 (0.3) | 1070 (0.0) | ||||
| central | 441 (4.8) | 542 (2.9) | 632 (0.8) | 1311 (0.2) | ||||
| coast | 308 (4.2) | 336 (7.3) | 598 (3.8) | 1109 (2.0) | ||||
| eastern | 701 (9.6) | 656 (7.5) | 1230 (6.7) | 1760 (1.6) | ||||
| nyanza | 885 (23.0) | 613(15.4) | 1155 (15.7) | 1800 (6.4) | ||||
| rift valley | 971 (9.2) | 1022 (11.3) | 2212 (5.8) | 3508 (0.9) | ||||
| western | 484 (0.2) | 473 (0.7) | 817 (0.0) | 1474 (0.2) | ||||
| northeastern | - | 105 (61.0) | 191 (65.5) | 407 (42.0) | ||||
| Mother’s Education | <0.001 | <0.001 | <0.001 | <0.001 | ||||
| no education | 601 (22.1) | 664 (26.7) | 999 (23.2) | 1433 (15.1) | ||||
| primary | 2383 (9.0) | 2411 (7.1) | 4480 (5.4) | 7427 (1.5) | ||||
| secondary | 997 (5.5) | 782 (4.1) | 1401 (4.9) | 2822 (1.5) | ||||
| higher | 87 (2.3) | 191 (1.1) | 316 (1.7) | 755 (0.8) | ||||
| Father’s Education | <0.001 | <0.001 | <0.001 | <0.001 | ||||
| no education | 335 (24.5) | 473 (30.3) | 722 (27.9) | 1111 (15.8) | ||||
| primary | 1855 (10.9) | 1837 (8.3) | 3526 (5.9) | 5979 (2.0) | ||||
| secondary | 1393 (7.3) | 1095 (5.9) | 2030 (5.7) | 3470 (1.6) | ||||
| higher | 158 (8.8) | 323 (4.2) | 551 (1.7) | 1163 (1.2) | ||||
| Religion | 0.019 | <0.001 | <0.001 | <0.001 | ||||
| muslim | 214 (4.7) | 328 (29.2) | 594 (29.8) | 978 (21.0) | ||||
| roman catholic | 1132 (12.5) | 1013 (9.1) | 1470 (6.6) | 2428 (2.2) | ||||
| protestant/other chris | 26 15(9.1) | 2592 (7.2) | 4879 (5.5) | 8868 (1.3) | ||||
| no religion | 86 (13.2) | 101 (8.2) | 253 (2.5) | 164 (0.3) | ||||
| Ethnicity | <0.001 | <0.001 | <0.001 | |||||
| luo | 579 (0.6) | 476 (1.2) | 910 (0.0) | 1308 (0.0) | <0.001 | |||
| kalenjin | 574 (8.5) | 468 (7.3) | 1174 (5.6) | 1743 (0.5) | ||||
| kamba | 486 (7.2) | 476 (5.3) | 826 (3.9) | 1388 (0.4) | ||||
| kisii | 422 (49.6) | 224 (43.2) | 441 (43.1) | 760 (15.6) | ||||
| kikuya | 695 (4.5) | 812 (3.5) | 1142 (1.0) | 2151 (0.0) | ||||
| luhya | 599 (0.0) | 641 (0.6) | 1119 (0.0) | 1953 (0.3) | ||||
| maasai | 73 (29.5) | 134 (36.6) | 110 (24.4) | 383 (3.1) | ||||
| embu | 295 (13.1) | 38 (13.8) | 72 (8.4) | 80 (1.3) | ||||
| meru | 202 (5.5) | 356 (3.6) | 609 (0.7) | |||||
| mijikenda/swahili | 208 (1.1) | 220 (1.9) | 427 (0.4) | 612 (0.0) | ||||
| somali | 7 (7.9) | 169 (54.8) | 255 (57.2) | 475 (37.2) | ||||
| taita/taveta | 35 (22.1) | 43 (28.2) | 68 (11.8) | 109 (1.3) | ||||
| turkana | - | 81 (8.0) | - | 218 (0.0) | ||||
| samburu | - | - | - | 82 (4.0) | ||||
| other | 93 (5.0) | 63 (11.8) | 292 (14.9) | 561 (6.2) | ||||
| Wealth Quintile | <0.001 | <0.001 | <0.001 | |||||
| lowest | - | 835 (13.9) | 1644 (14.9) | 2708 (7.2) | ||||
| second | - | 831 (12.0) | 1426 (9.4) | 2591 (2.5) | ||||
| middle | - | 762 (10.2) | 1422 (5.9) | 2532 (2.6) | ||||
| higher | - | 770 (6.7) | 1414 (4.1) | 2384 (1.5) | ||||
| highest | - | 850 (4.3) | 1288 (2.0) | 2223 (0.7) | ||||
| Marital Status | <0.001 | <0.001 | 0.105 | <0.001 | ||||
| never in union | 271 (1.0) | 247 (1.7) | 364 (3.3) | 570 (0.4) | ||||
| currently married | 3384 (10.2) | 3315 (9.6) | 5920 (8.2) | 10,352 (3.3) | ||||
| formerly married | 414 (13.6) | 486 (12.1) | 912 (5.4) | 1516 (2.1) | ||||
| Mother from mixed ethnicity household | 0.383 | 0.302 | 0.343 | 0.053 | ||||
| no | 937 (10.8) | 907 (7.4) | 1553 (7.3) | 5597 (3.0) | ||||
| yes | 80 (6.9) | 71 (11.8) | 162 (4.0) | 667 (1.4) | ||||
| Age at circum (mother) | <0.001 | <0.001 | ||||||
| daughter fgm negative | - | 1777 (12.3 ± 4) | 4152 (11.8 ± 4) | |||||
| daughter fgm positive | - | 816 (9.0 ± 3) | 704 (8.4 ± 3) | |||||
| Age at circum (girl) | ||||||||
| daughter fgm positive | - | 782 (7.5 ± 2.2) | - | |||||
| Mother currently working | 0.002 | 0.071 | 0.038 | <0.001 | ||||
| no | 1548 (7.5) | 1351 (10.8) | 2489 (9.3) | 3536 (5.5) | ||||
| yes | 2517 (11.4) | 2695 (8.7) | 4678 (6.6) | 8885 (2.0) | ||||
| Occupation (moth) | <0.001 | 0.008 | 0.020 | <0.001 | ||||
| formal | 290 (5.8) | 207 (4.0) | 1460 (4.8) | 1084 (1.5) | ||||
| informal | 2316 (12.1) | 2625 (9.0) | 1848 (7.1) | 8325 (2.0) | ||||
| not working | 1457 (7.2) | 1212 (11.3) | 2412 (10.1) | 2968 (6.3) | ||||
| Occupation (fath) | 0.004 | 0.035 | 0.433 | 0.424 | ||||
| formal | 642 (7.0) | 443 (7.2) | 2023 (6.1) | 1896 (2.6) | ||||
| informal | 2599 (11.8) | 2835 (10.8) | 3304 (7.3) | 9756 (3.2) | ||||
| not working | 111 (13.6) | - | 15 (8.3) | 156 (2.5) | ||||
| Mother worked for cash in the last 12 months | 0.002 | 0.033 | 0.006 | <0.001 | ||||
| no | 1455 (7.3) | 1211 (11.3) | 2331 (10.1) | 2971 (6.3) | ||||
| yes | 2612 (11.4) | 2835 (8.6) | 4863 (6.4) | 9234 (2.0) | ||||
| Type of earning (moth) | 0.146 | <0.001 | <0.001 | |||||
| other | - | 713 (10.3) | 1248 (13.5) | 2032 (3.4) | ||||
| cash | - | 2007 (8.1) | 3287 (3.7) | 6665 (1.5) | ||||
| Expenditure of wife’s earning decided by wife or jointly | 0.189 | 0.068 | 0.003 | 0.220 | ||||
| father | 12 (0.0) | 195 (12.6) | 265 (10.8) | 455 (1.4) | ||||
| mother alone | 981 (7.9) | 1264 (7.4) | 1143 (3.9) | 2602 (2.0) | ||||
| father and mother | 362 (11.5) | 549 (8.1) | 1296 (2.6) | 1996 (1.2) | ||||
| Expenditure of father’s earning decided by wife or jointly | 0.041 | 0.250 | ||||||
| father | - | - | 2410 (8.5) | 4508 (3.6) | ||||
| mother alone | - | - | 360 (13.5) | 847 (2.8) | ||||
| father and mother | - | - | 2912 (6.7) | 4782 (2.9) | ||||
| Mother makes more money than father | 0.221 | 0.152 | ||||||
| no | - | - | 1731 (3.1) | 3599 (1.4) | ||||
| yes | - | - | 790 (4.7) | 1261 (2.2) | ||||
| Mother’s employment all year or seasonal | 0.007 | 0.858 | 0.224 | 0.140 | ||||
| all year | 1858 (12.7) | 1734 (8.7) | 2767 (7.0) | 5551 (2.2) | ||||
| Seasonal/occasional | 616 (7.5) | 984 (8.5) | 1765 (5.4) | 3138 (1.5) | ||||
| Mother’s health care decision | 0.192 | <0.001 | <0.001 | |||||
| father | - | 1430 (11.2) | 1677 (12.5) | 2342 (4.7) | ||||
| mother | - | 1837 (8.9) | 1699 (7.9) | 3942 (2.4) | ||||
| father and mother | - | 489 (8.8) | 2659 (5.7) | 4135 (3.3) | ||||
| Final say on making large household purchase | 0.012 | 0.003 | 0.047 | |||||
| father | - | 2052 (9.2) | 2136 (10.8) | 3060 (4.1) | ||||
| mother | - | 779 (13.2) | 849 (9.5) | 0 (0.0) | ||||
| father and mother | - | 811 (9.6) | 3029 (5.8) | 2162 (2.8) | ||||
| Final say on making household purchases for daily needs | 0.431 | <0.001 | ||||||
| father | - | 1262 (9.5) | 2858 (36.6) | |||||
| mother | - | 1743 (11.0) | 1806 (32.5) | |||||
| father and mother | - | 655 (9.7) | 1082 (50.2) | |||||
| Father beat mother | 0.277 | 0.163 | ||||||
| no | - | - | 3099 (6.6) | 2889 (3.7) | ||||
| yes | - | - | 2092 (8.1) | 123 (2.4) | ||||
| Polygnous union | 0.375 | 0.376 | 0.384 | 0.0785 | ||||
| no | 3503 (10.7) | 3517 (9.8) | 6434 (7.9) | 11,035 (3.0) | ||||
| yes | 262 (8.8) | 284 (11.8) | 433 (6.2) | 887 (4.3) | ||||
| Marriage arranged | <0.001 | <0.001 | <0.001 | |||||
| no | - | 3133 (7.2) | 5887 (5.7) | 10,244 (2.3) | ||||
| yes | - | 654 (23.4) | 984 (20.7) | 1578 (8.7) | ||||
| Mother experienced any emotional violence | 0.090 | 0.898 | <0.001 | |||||
| no | - | 2172 (8.6) | 3822 (8.0) | 3368 (4.2) | ||||
| yes | - | 758 (11.0) | 1685 (7.9) | 1787 (1.6) | ||||
| Mother experienced any less severe violence | <0.001 | 0.994 | 0.002 | |||||
| no | - | 1700 (7.2) | 3377 (8.0) | 3142 (4.1) | ||||
| yes | - | 1229 (11.9) | 2127 (8.0) | 2010 (2.1) | ||||
| Mother experienced any severe violence | 0.002 | 0.575 | 0.015 | |||||
| no | - | 2672 (8.6) | 4517 (7.8) | 4167 (3.6) | ||||
| yes | - | 255 (15.1) | 987 (8.7) | 974 (1.9) | ||||
| Mother experienced any sexual violence | 0.910 | 0.289 | 0.015 | |||||
| no | - | 2438 (9.2) | 4639 (8.3) | 4492 (3.5) | ||||
| yes | - | 490 (9.0) | 867 (6.4) | 661 (1.7) | ||||
| Beating justified if mother goes out without telling father | <0.001 | 0.007 | 0.342 | |||||
| no | - | 2276 (7.5) | 4520 (6.0) | 9066 (2.9) | ||||
| yes | - | 1706 (12.2) | 2543 (9.3) | 3264 (3.3) | ||||
| Beating justified if mother neglects the children | <0.001 | 0.002 | 0.017 | |||||
| no | - | 1637 (7.3) | 3767 (5.5) | 7576 (2.6) | ||||
| yes | - | 2364 (11.1) | 3302 (9.1) | 4770 (3.6) | ||||
| Beating justified if mother argues with father | <0.001 | 0.002 | 0.301 | |||||
| no | - | 1988 (6.4) | 4520 (5.9) | 9184 (2.9) | ||||
| yes | - | 1989 (12.6) | 2503 (9.6) | 3120 (3.4) | ||||
| Beating justified if mother refuses sex with father | <0.001 | <0.001 | <0.001 | |||||
| no | - | 2551 (6.8) | 5052 (5.3) | 9858 (2.6) | ||||
| yes | - | 1361 (14.2) | 1943 (12.4) | 2402 (4.7) | ||||
| Beating justified if mother burns food | 0.035 | 0.568 | 0.338 | |||||
| no | - | 3247 (8.8) | 5996 (7.1) | 11,232 (3.1) | ||||
| yes | - | 717 (11.5) | 1059 (7.9) | 1052 (2.5) | ||||
| FGM prevalence (mother) | <0.001 | <0.001 | <0.001 | <0.001 | ||||
| no | 2267 (0.3) | 2471 (0.4) | 4370 (0.1) | 8812 (0.2) | ||||
| yes | 1802 (22.0) | 1577 (23.5) | 2471 (21.5) | 3622 (9.9) | ||||
| Person who performed circumcision (mother) | 0.205 | 0.003 | ||||||
| medical personnel | - | - | 377 (10.0) | 432 (4.4) | ||||
| traditional attendant | - | - | 2264 (90.0) | 4374 (95.6) | ||||
| Person who performed circumcision (daughter) | ||||||||
| medical personnel | - | - | 299 (34.7) | - | ||||
| traditional attendant | - | - | 565 (65.3) | - | ||||
| FGM required by religion | <0.001 | <0.001 | ||||||
| no | - | - | 6107 (4.5) | 11,663 (1.4) | ||||
| yes | - | - | 551 (46.7) | 771 (27.8) | ||||
| Mother support continuation of fgm | <0.001 | <0.001 | <0.001 | |||||
| no | 2959 (5.1) | - | 5733 (4.0) | 11,184 (1.1) | ||||
| yes | 836 (29.2) | - | 700 (41.8) | 1027 (23.1) | ||||
| Mother believes FGM is required by community | <0.001 | <0.001 | <0.001 | |||||
| no | 2236 (1.1) | 2565 (1.3) * | - | 11,171 (1.0) | ||||
| yes | 1833 (20.7) | 1483 (23.6) * | - | 1243 (21.1) | ||||
| Mother owns house alone or jointly | 0.006 | |||||||
| no | - | - | - | 4775 (2.2) | ||||
| yes | - | - | - | 7653 (3.5) | ||||
| Mother owns land alone or jointly | 0.820 | |||||||
| no | - | - | - | 5507 (3.1) | ||||
| yes | - | - | - | 6905 (3.0) | ||||
| Mother lived in city, town, countryside or outside of Kenya | <0.001 | |||||||
| Nairobi/Mombasa/Kisumu | - | - | - | 659 (0.0) | ||||
| other town | - | - | - | 1112 (5.4) | ||||
| countryside | - | - | - | 10,564 (2.9) | ||||
| outside Kenya | - | - | - | 91 (1.2) | ||||
| Mother lived in city, town or countryside before moved here | 0.011 | |||||||
| Nairobi/Mombasa/Kisumu | - | - | - | 882 (0.7) | ||||
| other town | - | - | - | 1374 (2.0) | ||||
| countryside | - | - | - | 6384 (2.6) | ||||
| outside Kenya | - | - | - | 64 (1.6) | ||||
| Years lived continuously in location (yrs) | <0.001 | |||||||
| 0 | - | - | - | 647 (1.8) | ||||
| 1–10 | - | - | - | 5138 (1.9) | ||||
| 11–20 | - | - | - | 3045 (2.9) | ||||
| 21 or more | - | - | - | 3439 (5.0) | ||||
| Number of trips in the last 12 months | <0.001 | |||||||
| 0 | - | - | - | 6825 (4.1) | ||||
| 1–25 | - | - | - | 5501 (1.6) | ||||
| 26–50 | - | - | - | 60 (2.1) | ||||
| 51 or more | - | - | - | 46 (2.7) | ||||
| Frequency of reading newspaper or magazine | <0.001 | <0.001 | <0.001 | |||||
| not at all | - | 2679 (12.5) | 4793 (10.0) | 8959 (3.9) | ||||
| less than once a week | - | 712 (3.7) | 1226 (2.6) | 2098 (0.5) | ||||
| at least once a week | - | 652 (3.2) | 1166 (3.0) | 1372 (0.8) | ||||
| Reads newspaper once a week | <0.001 | <0.001 | <0.001 | <0.001 | ||||
| no | 2789 (12.8) | 2679 (12.5) | 4793 (10.0) | 8959 (3.9) | ||||
| yes | 1271 (3.6) | 1364 (3.4) | 2393 (2.8) | 3472 (0.6) | ||||
| Frequency of listening to radio | <0.001 | <0.001 | <0.001 | |||||
| not at all | - | 760 (20.5) | 1264 (17.0) | 2570 (7.6) | ||||
| less than once a week | - | 373 (11.2) | 689 (10.3) | 1665 (3.9) | ||||
| at least once a week | - | 2914 (6.3) | 5238 (5.0) | 8199 (1.4) | ||||
| Listens to radio everyday | <0.001 | <0.001 | <0.001 | <0.001 | ||||
| no | 1661 (13.1) | 760 (20.5) | 1264 (17.0) | 2570 (7.6) | ||||
| yes | 2388 (7.8) | 3287 (6.9) | 5927 (5.6) | 9864 (1.8) | ||||
| Frequency of watching television | <0.001 | 0.002 | <0.001 | |||||
| not at all | - | 2806 (11.0) | 4571 (9.3) | 7222 (4.4) | ||||
| less than once a week | - | 339 (7.8) | 821 (6.1) | 1617 (1.8) | ||||
| at least once a week | - | 900 (5.2) | 1800 (3.8) | 3589 (0.6) | ||||
| Watches TV every week | <0.001 | <0.001 | <0.001 | <0.001 | ||||
| no | 3145 (11.1) | 2806 (11.0) | 4571 (9.3) | 7222 (4.4) | ||||
| yes | 880 (5.7) | 1239 (5.9) | 2622 (4.5) | 5207 (1.0) | ||||
| Total | 4069 (9.9%) | 4048 (9.4%) | 7195 (7.6%) | 12,434 (3.0%) | ||||
| Predictor | Level | Model A OR (95% CI) | Model B OR (95% CI) | Model C OR (95% CI) |
|---|---|---|---|---|
| DEMOGRAPHIC | ||||
| Place of Residence | Rural (ref) | 1.00 | ||
| Urban | 1.31 (0.87, 1.99) | |||
| Religion | ||||
| Christian (ref) | 1.00 | |||
| Muslim | 5.50 (2.65, 10.60) | |||
| No religion | 1.10 (0.25, 3.71) | |||
| Wealth Index | ||||
| Middle (ref) | 1.00 | |||
| lower | 1.21 (0.76, 1.99) | |||
| lowest | 0.94 (0.58, 1.59) | |||
| Higher | 0.86 (0.43, 1.66) | |||
| Highest | 0.45 (0.18, 1.00) | |||
| Ethnicity | ||||
| Embu(ref) | 1.00 | |||
| Kalenjin | -- | |||
| Kamba | 0.42 (0.1, 1.69) | |||
| Kikuya | -- | |||
| Kisii | 11.73 (3.69,37.38) | |||
| Luhya | 1.39 (0.28, 6.86) | |||
| Luo | -- | |||
| Maasai | 0.77 (0.25, 3.04) | |||
| Meru | -- | |||
| Mijikenda/Swahili | -- | |||
| Other | 0.74 (0.26, 2.45) | |||
| Samburu | -- | |||
| Somali | 1.63 (0.46, 6.66) | |||
| Taita-taveta | 0.23 (0.01, 2.53) | |||
| SOCIAL NORMS | Turkana | |||
| Mother Cut | ||||
| No (ref) | 1.00 | 1.00 | 1.00 | |
| Yes | 3.94 (2.05, 7.63) | 4.30 (2.12, 7.99) | 1.97 (0.69, 6.01) | |
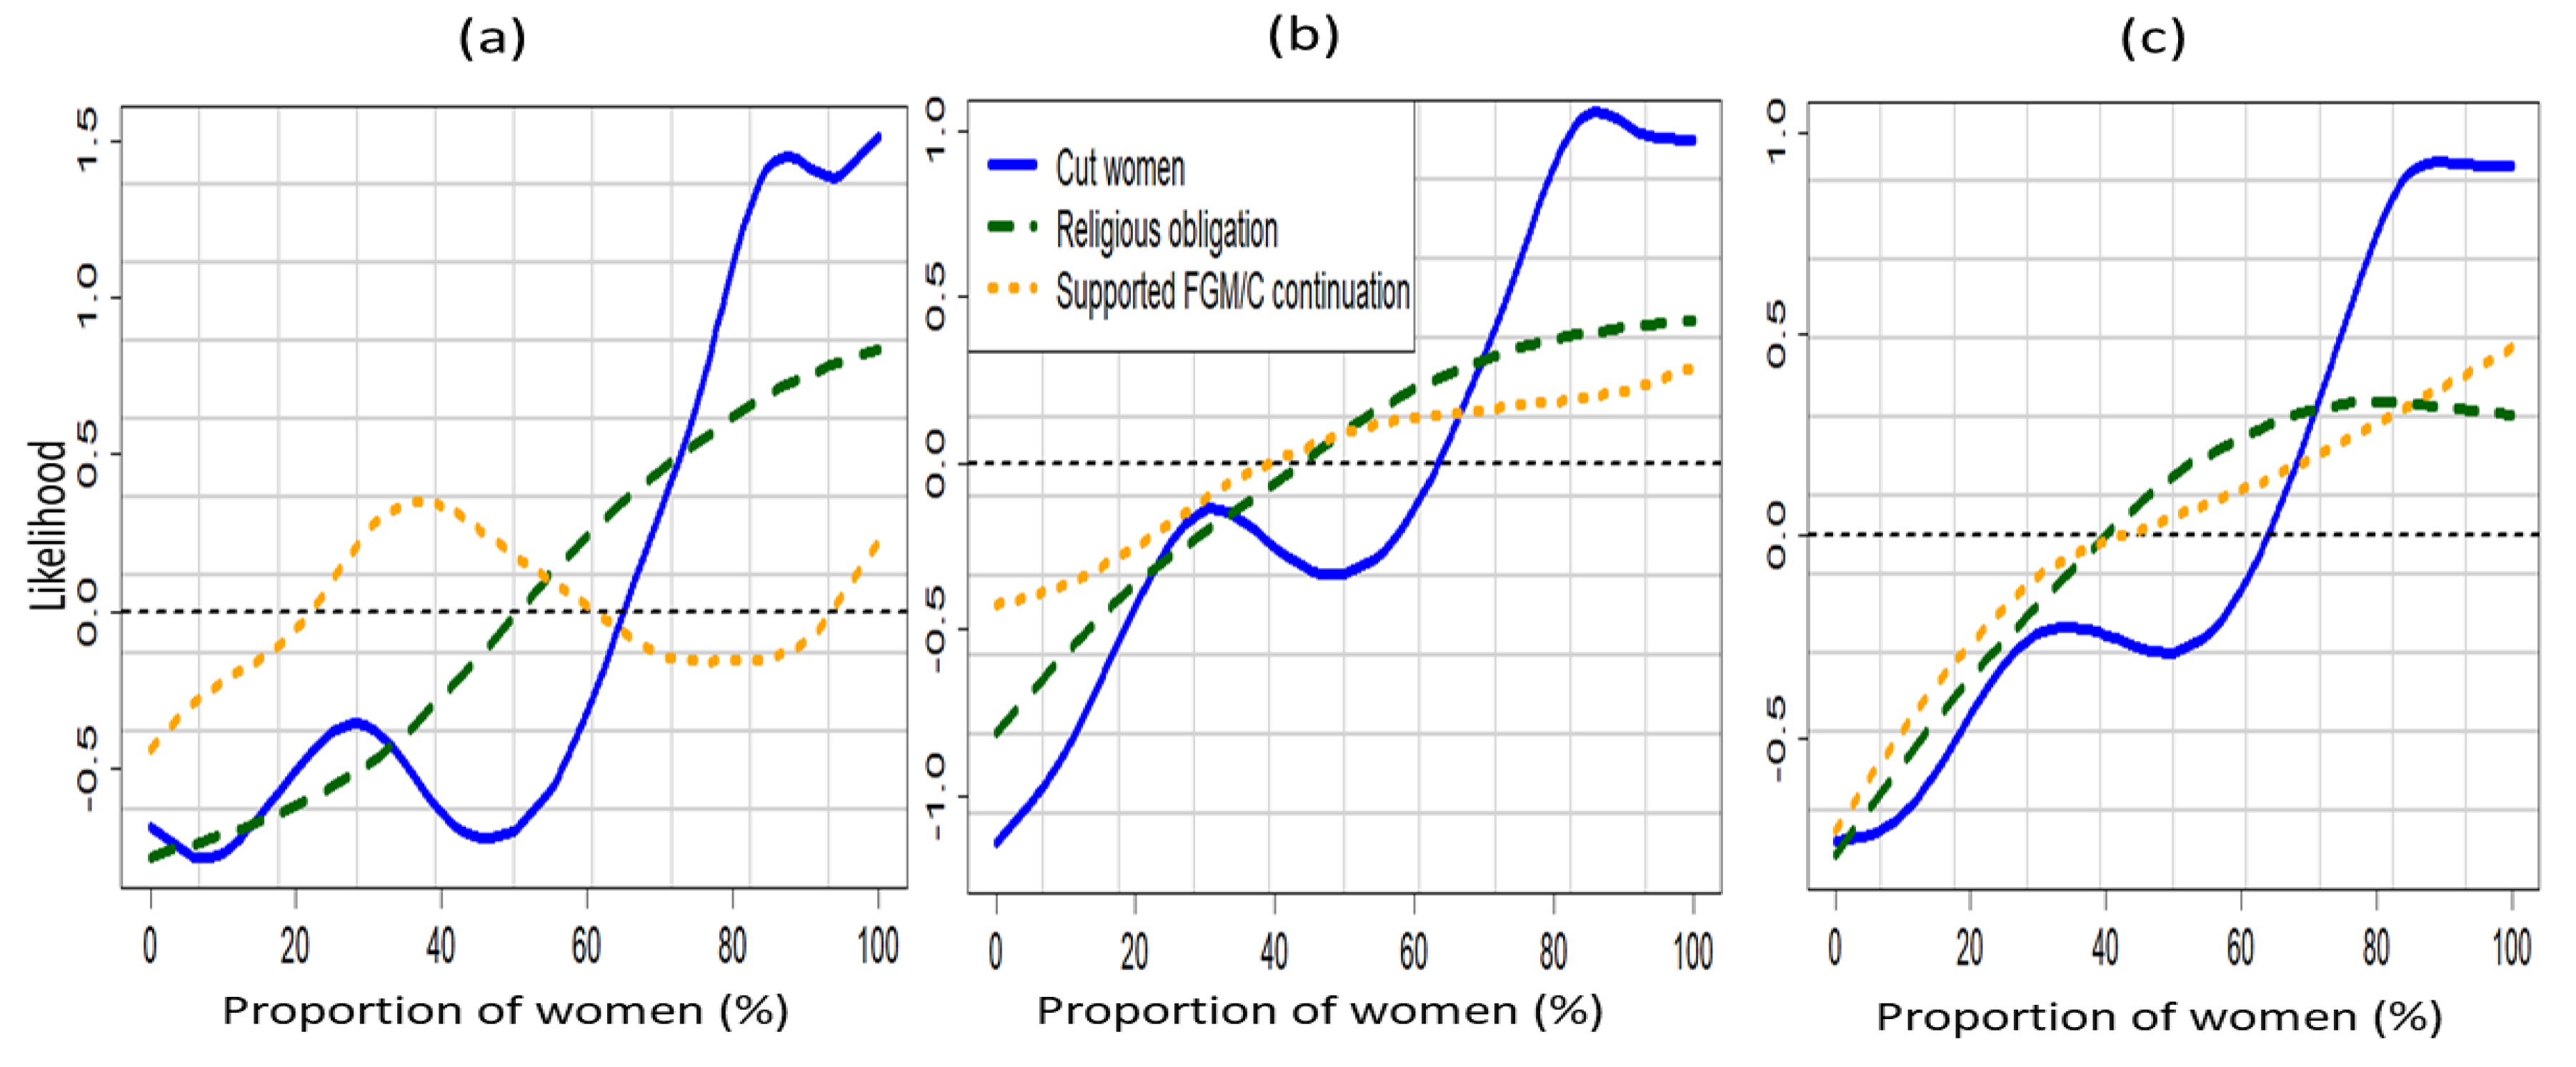
| Proportion of Cut Women | See Graph | See Graph | ||
| Support Continuation | ||||
| Be stopped (ref) | 1.00 | |||
| Continued | 3.08 (1.76, 5.55) | |||
| Depends | 1.37 (0.49, 3.26) | |||
| Proportion of Women Who Support Continuation | See Graph | See Graph | ||
| BELIEFS | ||||
| FGM/C is Required by Religion | ||||
| No (ref) | 1.00 | |||
| Yes | 1.5 (0.93, 2.45) | |||
| Proportion of Women Who Believed FGM/C is Required by Religion | See Graph | See Graph | ||
| WOMEN’S AGENCY | ||||
| Mother’s Education | ||||
| Higher (ref) | 1.00 | |||
| No education | 1.25 (0.35, 3.87) | |||
| Primary | 0.71 (0.19, 2.27) | |||
| Secondary | 0.76 (0.23, 2.46) | |||
| WOMEN’S OPPORTUNITIES | ||||
| Father Beats Mother | ||||
| No (ref) | 1.00 | |||
| Yes | 1.21 (0.77, 1.82) | |||
| Missing (Not available) | 1.01 (0.72, 1.44) | |||
| Mother’s Occupation | ||||
| Formal (ref) | 1.00 | |||
| Informal | 1.08 (0.61, 1.9) | |||
| Not working | 0.62 (0.3, 1.28) | |||
| Mother is in A Polygamous Union | ||||
| No (ref) | 1.00 | |||
| Yes | 1.23 (0.86, 1.69) | |||
| Marriage by Arrangement | No (ref) | 1.00 | ||
| Yes | 0.89 (0.65, 1.2) | |||
| Woman Owns House | No (ref) | 1.00 | ||
| Yes | 1.75 (1.14, 2.86) | |||
| Woman Owns Land | No (ref) | 1.00 | ||
| Yes | 0.75 (0.48, 1.16) | |||
| Who Decides? Wife’s Expenditure | ||||
| Alone (ref) | 1.00 | |||
| Husband/partner | 0.52 (0.2, 1.32) | |||
| With hus/partner | 0.68 (0.39, 1.18) | |||
| Missing (Not Available) | 0.9 (0.53, 1.48) | |||
| GENDER NORMS | ||||
| Female Positive Attitude to Wife Beating: | ||||
| Wife Beating for Going Out | ||||
| No (ref) | 1.00 | |||
| Yes | 1 (0.68, 1.45) | |||
| Wife Beating for Neglecting the Children | ||||
| No (ref) | 1.00 | |||
| Yes | 1.51 (1.06, 2.2) | |||
| Wife Beating for Arguing with the Husband | ||||
| No (ref) | 1.00 | |||
| Yes | 1.03 (0.67, 1.56) | |||
| Wife Beating for Denying Husband Sex | ||||
| No (ref) | 1.00 | |||
| Yes | 0.79 (0.53, 1.19) | |||
| Wife Beating for Denying Husband Food | ||||
| No (ref) | 1.00 | |||
| Yes | 0.82 (0.48, 1.36) | |||
| Who Makes Large Household Purchases | Alone (ref) | 1.00 | ||
| Husband/partner | 1.4 (0.85, 2.13) | |||
| With husband/par | 0.91 (0.57, 1.41) | |||
| Who Makes Decision on Mother’s Health | Alone(ref) | 1.00 | ||
| Husband/partner | 1.17 (0.77, 1.86) | |||
| With husband/par | 0.92 (0.62, 1.41) | |||
| Age Difference | ||||
| Wife is older (ref) | 1.00 | |||
| 10 years younger | 0.82 (0.44, 1.77) | |||
| 1–4 yrs younger | 0.79 (0.37, 1.63) | |||
| 5–9 yrs younger | 0.47 (0.23, 1.00) | |||
| Same age | 0.34 (0.12, 1.00) | |||
| MEDIA INFORMATION | ||||
| Read Newspaper | ||||
| No (ref) | 1.00 | |||
| Yes | 0.7 (0.38, 1.3) | |||
| Listen to Radio | ||||
| No (ref) | 1.00 | |||
| Yes | 1.66 (1.15, 2.37) | |||
| Watch Television | ||||
| No (ref) | 1.00 | |||
| Yes | 0.69 (0.42, 1.14) |
| Predictor | Level | Model I OR (95% CI) | Model II OR (95% CI) | Model III OR (95% CI) |
|---|---|---|---|---|
| DEMOGRAPHIC | ||||
| Place of Residence | ||||
| Rural (ref) | 1.00 | |||
| Urban | 1.17 (0.92, 1.51) | |||
| Religion | ||||
| Christian (ref) | 1.00 | |||
| Muslim | 2.48 (1.77, 3.35) | |||
| Others | 0.53 (0.29, 0.87) | |||
| Wealth Index | ||||
| Middle (ref) | 1.00 | |||
| lower | 0.93 (0.76, 1.06) | |||
| lowest | 1.03 (0.82, 1.21) | |||
| Higher | 0.86 (0.66, 1.07) | |||
| Highest | 0.55 (0.42, 0.72) | |||
| Married | ||||
| Currently (ref) | 1.00 | |||
| Formerly | 0.92 (0.79, 1.16) | |||
| Never | 0.94 (0.59, 1.59) | |||
| Ethnicity | ||||
| Embu(ref) | 1.00 | |||
| Kalenjin | 1.09 (0.55, 2.48) | |||
| Kamba | 0.71 (0.35, 1.52) | |||
| Kikuya | 0.64 (0.25, 1.6) | |||
| Kisii | 12.07 (5.79, 27.4) | |||
| Luhya | 1.59 (0.49, 5.03) | |||
| Luo | 0.89 (0.28, 2.87) | |||
| Maasai | 4.17 (1.83, 9.45) | |||
| Meru | 0.27 (0.12, 0.61) | |||
| Mijikenda/Swahili | -- | |||
| Other | 2.17 (1.07, 4.76) | |||
| Samburu | -- | |||
| Somali | 4.39 (2.12, 9.79) | |||
| Taita-taveta | 3.59 (1.72, 8.91) | |||
| Turkana | ||||
| SOCIAL NORMS | ||||
| Mother Cut | ||||
| No (ref) | 1.00 | 1.00 | 1.00 | |
| Yes | 24.22 (16.62, 37.35) | 25.40 (17.00, 33.57) | 27.29 (24.62, 30.38) | |
| WOMEN’S AGENCY | ||||
| Mother’s Education | ||||
| Higher (ref) | 1.00 | |||
| No education | 5.78 (3.27, 10.71) | |||
| Primary | 3.3 (1.85, 5.83) | |||
| Secondary | 2.06 (1.08, 3.85) | |||
| Mother’s Occupation | ||||
| Formal (ref) | 1.00 | |||
| Informal | 1.00 (0.84, 1.17) | |||
| Not working | 1.03 (0.88, 1.28) |
References
- UNICEF. Female Genital Mutilation/Cutting: A Global Concern; UNICEF: New York, NY, USA, 2016. [Google Scholar]
- WHO. Eliminating Female Genital Mutilatio. In An Interagency Statement. (WHO, UNFPA, UNICEF, UNIFEM, UNHCHR, UNHCR, UNECA, UNESCO, UNDP, UNAIDS); World Health Organization: Geneva, Switzerland, 2008. [Google Scholar]
- Muteshi, J.K.; Miller, S.; Belizan, J.M. The ongoing violence against women: Female Genital Mutilation/Cutting. Reprod. Health 2016, 13, 44. [Google Scholar] [CrossRef] [PubMed]
- Rymer, J. Female genital mutilation. Curr Obs. Gynecol. 2003, 13, 185–190. [Google Scholar] [CrossRef]
- Toubia, N. Female circumcision as a public health issue. N. Engl. J. Med. 1994, 331, 712–716. [Google Scholar] [CrossRef] [PubMed]
- Dirie, M.; Lindmark, G. The risk of medical complications after female circumcision. East Afr. Med. J. 1992, 69, 479–482. [Google Scholar]
- Abd El-Naser, T.; Farouk, A.; El-Nashar, A.E.-R.; Mostafa, T. Sexual side effects of female genital mutilation/cutting May Be type dependent: A hospital based study. J. Obs. Gynecol. 2011, 1, 65–74. [Google Scholar]
- Alsibiani, S.A.; Rouzi, A.A. Sexual function in women with female genital mutilation. Fertil. Steril. 2010, 93, 722–724. [Google Scholar] [CrossRef]
- Banks, E.; Meirik, O.; Farley, T.; Akande, O.; Bathija, H.; Ali, M. Female genital mutilation and obstetric outcome: WHO collaborative prospective study in six African countries. Lancet 2006, 367, 1835–1841. [Google Scholar]
- Shetty, P. Slow progress in ending female genital mutilation. Bull. World Health Organ. 2014, 92, 6–7. [Google Scholar] [CrossRef]
- Abdulcadir, J.; Rodriguez, M.I.; Say, L. Research gaps in the care of women with female genital mutilation: An analysis. BJOG 2015, 122, 294–303. [Google Scholar] [CrossRef]
- Arora, K.S.; Jacobs, A. Female genital alteration: A compromise solution. J. Med. Ethics 2016, 42, 148–154. [Google Scholar] [CrossRef]
- Shell-Duncan, B.; Gathara, D.; Moore, Z. Female Genital Mutilation/Cutting in Kenya: Is Change Taking Place? Descriptive Statistics from Four Waves of Demographic and Health Surveys; Population Council: New York, NY, USA, 2017. [Google Scholar]
- Achia, T.N.O. Spatially modelling and mapping of female genital mutilation in Kenya. BMC Public Health 2014, 14, 276. [Google Scholar] [CrossRef] [PubMed]
- Kandala, N.-B.; Komba, K.; Nnanatu, C.; Atilola, C.; Mavatikua, L.; Moore, Z.; Matanda, D. Modelling and Mapping of Risk Factors of FGM/C Prevalence among Girls Aged 0–14 in Nigeria; Population Council Inc.: New York, NY, USA, 2019. [Google Scholar]
- Mackie, G.; LeJeune, J. Social Dynamics of Abandonment of Harmful Practices: A New Look at the Theory; Innocenti Working Paper No. 2009-06; UNICEF Innocenti Research Centre: Florence, Italy, 2009. [Google Scholar]
- Mackie, G. Ending footbinding and infibulation: A convention account. Am. Sociol. Rev. 1996, 61, 999–1017. [Google Scholar] [CrossRef]
- Shell-Duncan, B.; Wander, K.; Hernlund, Y.; Moreau, A. Dynamics of change in the practice of female genital cutting in Senegambia: Testing predictions of social convention theory. Soc. Sci. Med. 2011, 73, 1275–1283. [Google Scholar] [CrossRef] [PubMed]
- Cislaghi, B.; Heise, L. Using social norms theory for health promotion in low-income countries. Health Promot. Int. 2018. [Google Scholar] [CrossRef]
- Utazi, C.E.; Afuecheta, A.O.; Nnanatu, C.C. Bayesian latent process spatiotemporal regression model for areal count data. Spat. Spatio-Temporal Epidemiol. 2018, 25, 25–37. [Google Scholar] [CrossRef]
- Lee, D.; Rushworth, A.; Shahu, S.K. A Bayesian localized conditional auroregressive model for estimating the health effects of air pollution. Biometrics 2014, 70, 419–429. [Google Scholar] [CrossRef]
- Kandala, N.-B.; Nwakeze, N.; Ngianga, S.; Kandala, I.I. Spatial distribution of female genital mutilation in Nigeria. Am. J. Trop. Med. Hyg. 2009, 81, 784–792. [Google Scholar] [CrossRef]
- Nnanatu, C.C.; Atilola, G.; Komba, P.; Mavatikua, L.; Moore, Z.; Matanda, D.; Obianwu, O.; Kandala, N.-B. Spatial and spatio-temporal trends in female genital mutilation/cutting among 0-14-year-old girls in Nigeria: The roles of normative influences. BMC Glob. Health Res. Policy 2019. under review. [Google Scholar]
- Kandala, N.-B.; Shell-Duncan, B. Trends in female genital mutilation/cutting in Senegal: What can we learn from successive household surveys in sub-Saharan African countries? Int. J. Equity Health 2019, 18, 25. [Google Scholar] [CrossRef]
- Kohler, H.P.; Behrman, J.R.; Watkins, S.C. The density of social networks and fertility decisions: Evidence from South Nyanza District, Kenya. Demography 2001, 38, 43–58. [Google Scholar] [CrossRef]
- Posner, D.N. Measuring Ethnic Fractionalization in Africa. Am. J. Political Sci. 2004, 48, 849–863. [Google Scholar] [CrossRef]
- Vogt, S.; Zaid, N.A.M.; Ahmed, H.E.F.; Fehr, E.; Efferson, C. Changing cultural attitudes towards female genital cutting. Nature 2016, 538, 506–509. [Google Scholar] [CrossRef] [PubMed]
- Nyamu-Musembi, C. Are local norms and practices fences or pathways? The example of women’s property rights. In Cultural Transformation and Human Rights in Africa; An-Na’im, A.A., Ed.; Zed Books Ltd.: New York, NY, USA, 2002; pp. 126–150. [Google Scholar]
- Cloward, K. When Norms Collide: Local Responses to Activism against Female Genital Mutilation and Early Marriage; Oxford University Press: New York, NY, USA, 2016. [Google Scholar]
- Boyle, E.H. Female Genital Cutting: Cultural Conflict in the Global Community; Johns Hopkins University Press: Baltimore, MD, USA, 2002. [Google Scholar]
- Suzuki, C.; Meekers, D. Determinants of support for female genital cutting among evere-married women in Egypt. Glob. Public Health 2008, 3, 383–398. [Google Scholar] [CrossRef]
- Modrek, S.; Liu, J.X. Exploration of pathways related to the decline in female circumcision in Egypt. BMC Public Health 2013, 13, 921. [Google Scholar] [CrossRef]
- Stata Statiscal Software; StataCorp: College Station, TX, USA.
- Brezger, A. Lang Generalized Structured Additive Regression Based on Bayesian P-Splines. Comput. Stat. Data Anal. 2006, 50, 947–991. [Google Scholar] [CrossRef]
- Kneib, T.; Fahrmeir, L. Structured Additive Regression for Multicategorical Space-Time Data: A Mixed Model Approach. Biometrics 2006, 62, 109–118. [Google Scholar] [CrossRef]
- Kamman, E.E.; Wand, M.P. Geoadditive Models. J. R. Stat. Soc. C 2003, 52, 1–18. [Google Scholar] [CrossRef]
- Besag, J.; York, J.; Mollie, A. Bayesian Image Restoration with two applications in spatial statistics. Ann. Inst. Stat. Math. 1991, 43, 1–20. [Google Scholar] [CrossRef]
- Lang, S.; Brezger, A. Bayesian P-Splines. J. Comput. Graph. Stat. 2004, 13, 183–212. [Google Scholar] [CrossRef]
- Eilers, P.; Marx, B. Flexible Smoothing using B-splines and Penalized Likelihood (with comments and rejoinder). Stat. Math. 1996, 53, 11–30. [Google Scholar]
- Umlauf, N.; Adler, D.; Kneib, T. Structured Additive Regression Models: An R Interface to BayesX. J. Stat. Softw. 2015, 63. [Google Scholar] [CrossRef]
- Gilks, W.R.; Wild, P. Adaptive Rejection Sampling for Gibbs Sampling. J. R. Stat. Soc. Ser. C (Appl. Stat.) 1992, 41, 337–348. [Google Scholar] [CrossRef]
- Spiegelhalter, D.J.; Best, N.G.; Carlin, B.P.; Van Der Linde, A. Bayesian measures of model complexity and fit. J. R. Stat. Soc. Ser. B (Stat. Methodol.) 2002, 64, 583–639. [Google Scholar] [CrossRef]
- Hongfei, L.I.; Calder, C.A.; Cressie, N. Beyond Moran’s I: Testing for Spatial Dependence Based on the Spatial Autoregressive Model. Geogr. Anal. 2007, 39, 357–375. [Google Scholar]
- Mackie, G. Unprogrammed abandonment of female genital mutilation/cutting. World Dev. 2019, in press. [Google Scholar]
- Shell-Duncan, B.; Moreau, A.; Wander, K.; Smith, S. The role of older women in contesting norms associated with female genital mutilation/cutting: A factorial focus group analysis. PLoS ONE 2018, 13, e0199217. [Google Scholar] [CrossRef] [PubMed]
- An-Na’im, A.A.; Hammond, J. Cultural transformation and human rights in African societies. In Cultural Transformation and Human Rights in Africa; An-Na’im, A.A., Ed.; Zed Books Ltd.: New York, NY, USA, 2002; Volume 2, pp. 13–37. [Google Scholar]
- Cowan, J.K.; Dembour, M.-B.; Wilson, R. Culture and Rights: Anthropological Perspectives; Cambridge University Press: Cambridge, UK, 2001. [Google Scholar]
- Abdelshahid, A.; Campbell, C. Should I circumcise my daughter?’ Exploring diversity and ambivalence in Egyptian parents’ social representations of female circumcision. J. Community Appl. Soc. Psychol. 2015, 25, 49–65. [Google Scholar] [CrossRef]
- Merry, S.E. Human Rights and Gender Violence; The University of Chicago Press: Chicago, IL, USA, 2006. [Google Scholar]
- Shell-Duncan, B. Considerations on the use and interpretation of survey data on FGM/C. In Researching Female Genital Mutilation/Cutting, Proceedings of the 2nd International Academic Seminar of MAP-FGM Project, Brussels, June 8-9, 2017; Leye, E., Coene, G., Eds.; Vubpress Brussels University Press: Brussels, Belgium, 2017; pp. 99–106. [Google Scholar]
- Merry, S.E. Changing rights, changing culture. In Culture and Rights: Anthropological Perspectives; Cowan, J.K., Dembour, M.B., Wilson, R.A., Eds.; Cambridge University Press: Cambridge, UK, 2001; pp. 31–55. [Google Scholar]


| Factor | Level | 1998 KDHS (n = 4069, FGM/C = 9.9%) | 2003 KDHS (n = 4048, FGM/C = 9.4%) | 2008 KDHS (n = 7195, FGM/C = 7.6%) | 2014 KDHS (n = 12,434, FGM/C = 3.0%) |
|---|---|---|---|---|---|
| Mother’s FGM/C status | Cut | 22.0 | 23.5 | 21.5 | 9.9 |
| Uncut | 0.3 | 0.4 | 0.1 | 0.2 | |
| Mother’s support for FGM/C continuation | Continued | 29.2 | -- | 41.8 | 23.1 |
| Undecided | 5.1 | -- | 4.0 | 1.1 | |
| Mother’s belief that FGM/C is required by religion | Required | -- | -- | 46.7 | 27.8 |
| Not required | -- | -- | 4.5 | 1.4 |
| Data | Model | Description | DIC | Effective Size (PD) |
|---|---|---|---|---|
| 2014 KDHS | Model A | Normative influence variables only | 3551.4 | 19.7 |
| Model B | Normative influence variables and total space | 1805.3 | 62.6 | |
| Model C | Normative influence variables, space and other individual-level covariates | 1718.6 | 117.1 | |
| 2003 to 2014 Pooled Data | Model I | Normative influence variables only. | 8104.9 | 8.0 |
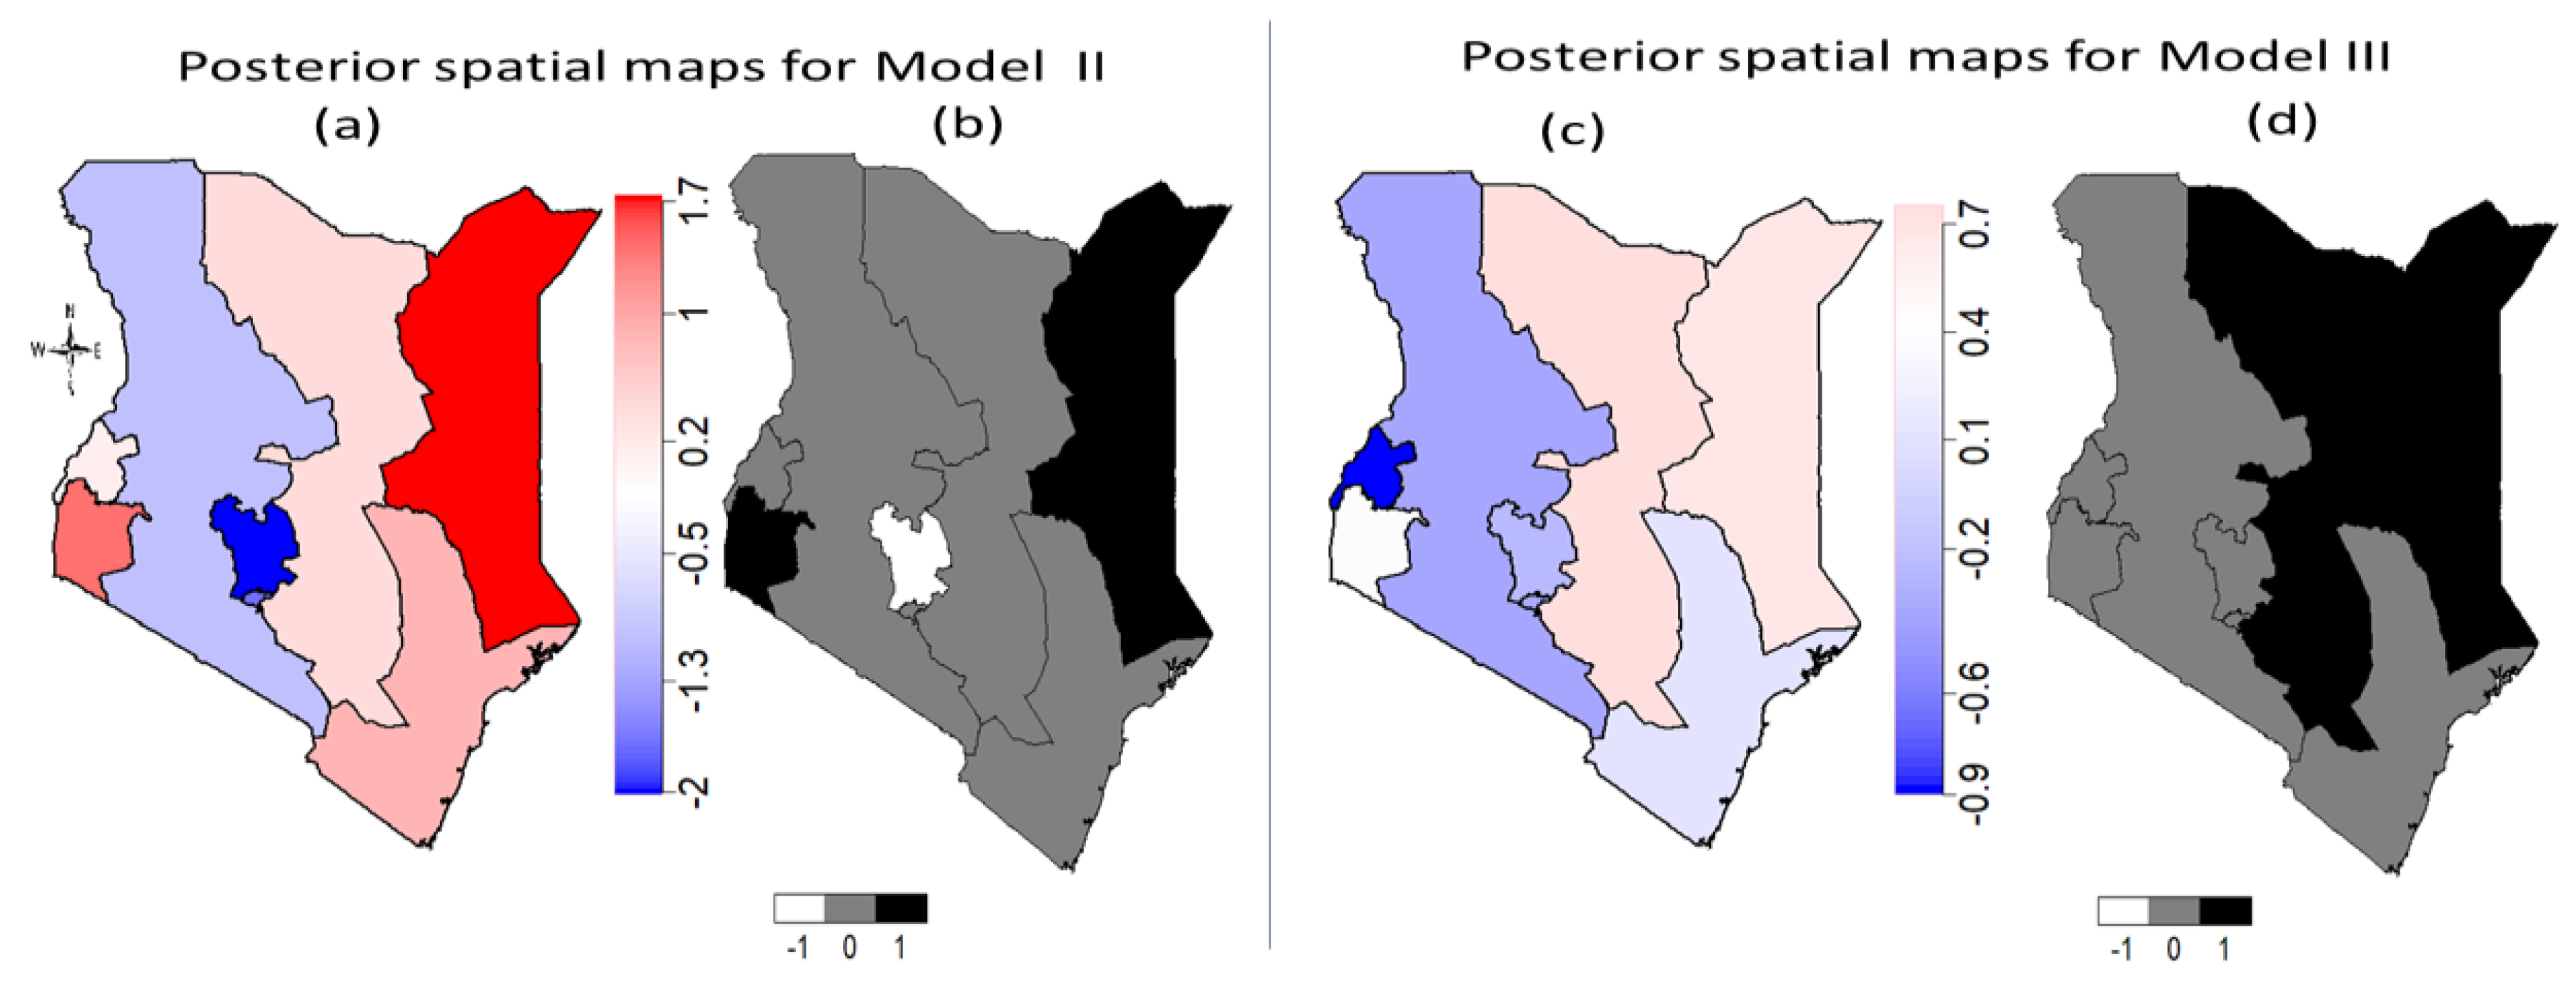
| Model II | Normative influence variables, space without time and space-time interaction. | 8108.1 | 9.7 | |
| Model III | Normative influence variables, space and time, space-time interaction and other individual-level covariates | 6501.4 | 44.42 |
© 2019 by the authors. Licensee MDPI, Basel, Switzerland. This article is an open access article distributed under the terms and conditions of the Creative Commons Attribution (CC BY) license (http://creativecommons.org/licenses/by/4.0/).
Share and Cite
Kandala, N.-B.; Nnanatu, C.C.; Atilola, G.; Komba, P.; Mavatikua, L.; Moore, Z.; Mackie, G.; Shell-Duncan, B. A Spatial Analysis of the Prevalence of Female Genital Mutilation/Cutting among 0–14-Year-Old Girls in Kenya. Int. J. Environ. Res. Public Health 2019, 16, 4155. https://doi.org/10.3390/ijerph16214155
Kandala N-B, Nnanatu CC, Atilola G, Komba P, Mavatikua L, Moore Z, Mackie G, Shell-Duncan B. A Spatial Analysis of the Prevalence of Female Genital Mutilation/Cutting among 0–14-Year-Old Girls in Kenya. International Journal of Environmental Research and Public Health. 2019; 16(21):4155. https://doi.org/10.3390/ijerph16214155
Chicago/Turabian StyleKandala, Ngianga-Bakwin, Chibuzor Christopher Nnanatu, Glory Atilola, Paul Komba, Lubanzadio Mavatikua, Zhuzhi Moore, Gerry Mackie, and Bettina Shell-Duncan. 2019. "A Spatial Analysis of the Prevalence of Female Genital Mutilation/Cutting among 0–14-Year-Old Girls in Kenya" International Journal of Environmental Research and Public Health 16, no. 21: 4155. https://doi.org/10.3390/ijerph16214155
APA StyleKandala, N.-B., Nnanatu, C. C., Atilola, G., Komba, P., Mavatikua, L., Moore, Z., Mackie, G., & Shell-Duncan, B. (2019). A Spatial Analysis of the Prevalence of Female Genital Mutilation/Cutting among 0–14-Year-Old Girls in Kenya. International Journal of Environmental Research and Public Health, 16(21), 4155. https://doi.org/10.3390/ijerph16214155