Adverse Birth Outcomes as Indicators of Poor Fetal Growth Conditions in a French Newborn Population—A Stratified Analysis by Neighborhood Deprivation Level

Abstract
1. Introduction
2. Material and Methods
2.1. Study Area
2.2. Individual Data Source
2.3. Parental Characteristics
2.4. Newborn Characteristics
2.5. Neighborhood Characteristics
2.6. Statistical Analysis
- (i)
- whether Model 2 and/or Model 3 fit better than Model 1 in each sub-group, separately, and
- (ii)
- whether the signs, the magnitude and the p-value of the regression coefficients related to FFGC varied between each sub-group (from the most deprived census blocks to the most advantaged).
3. Results
3.1. Population Description
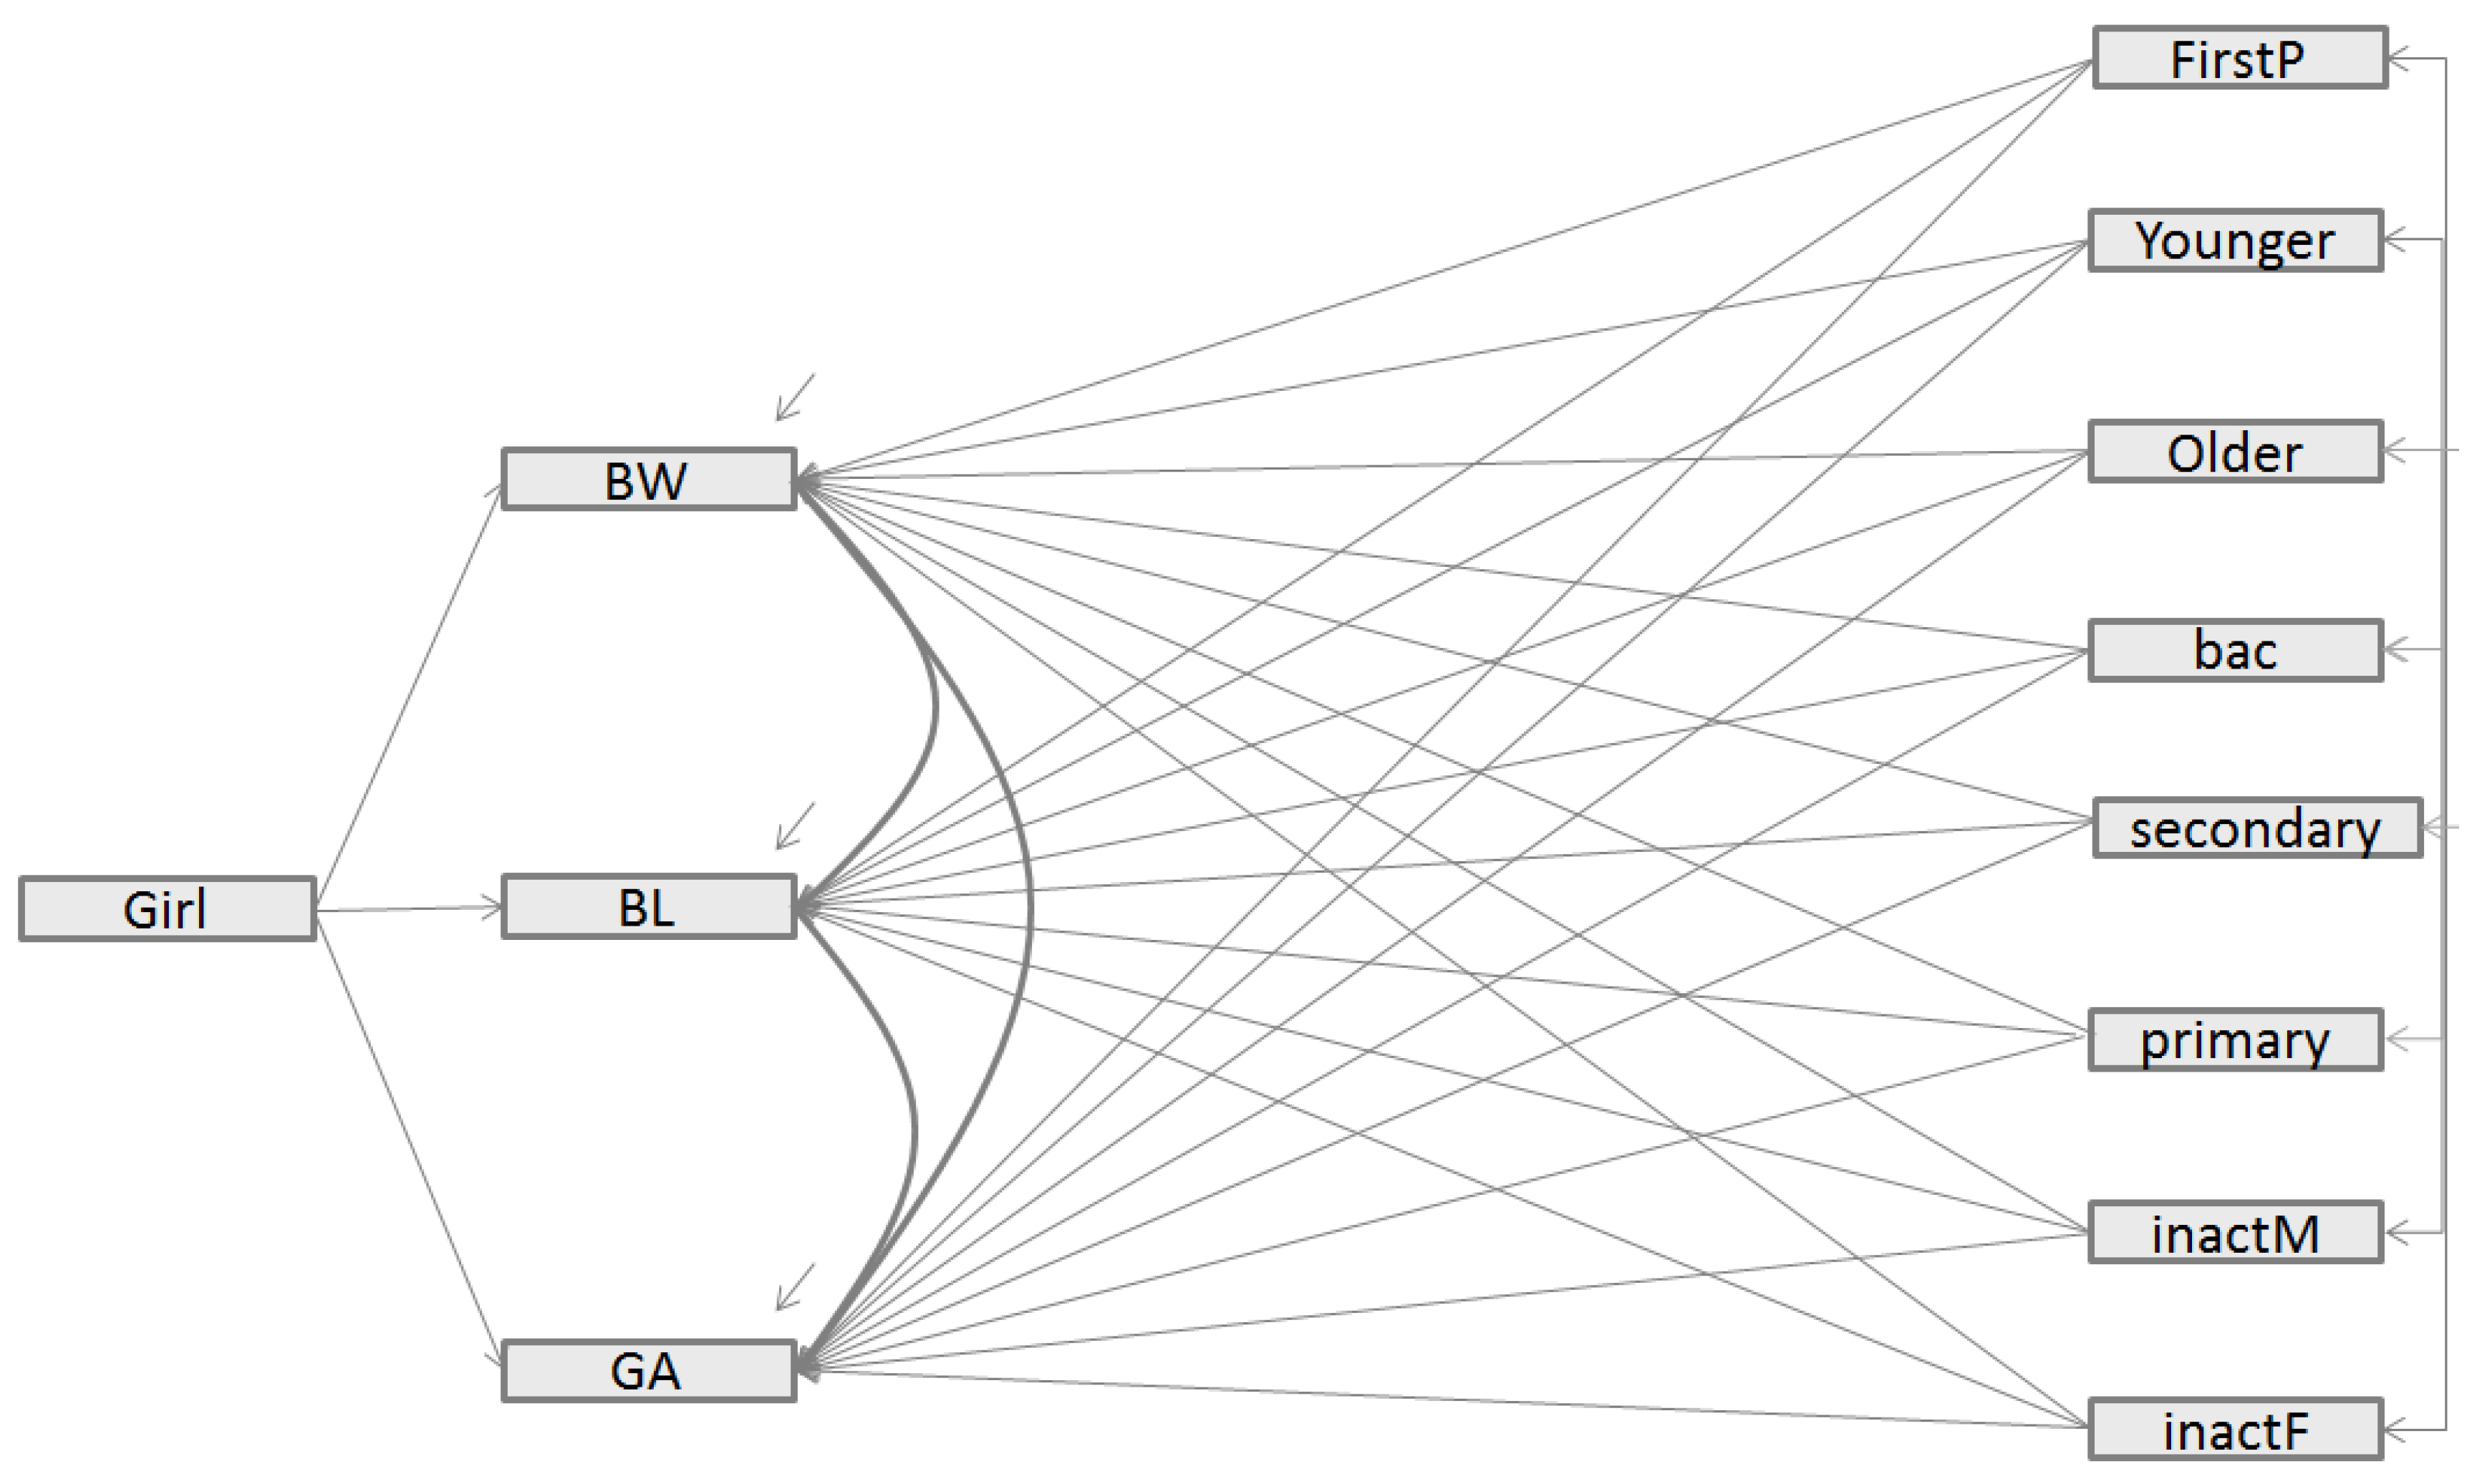
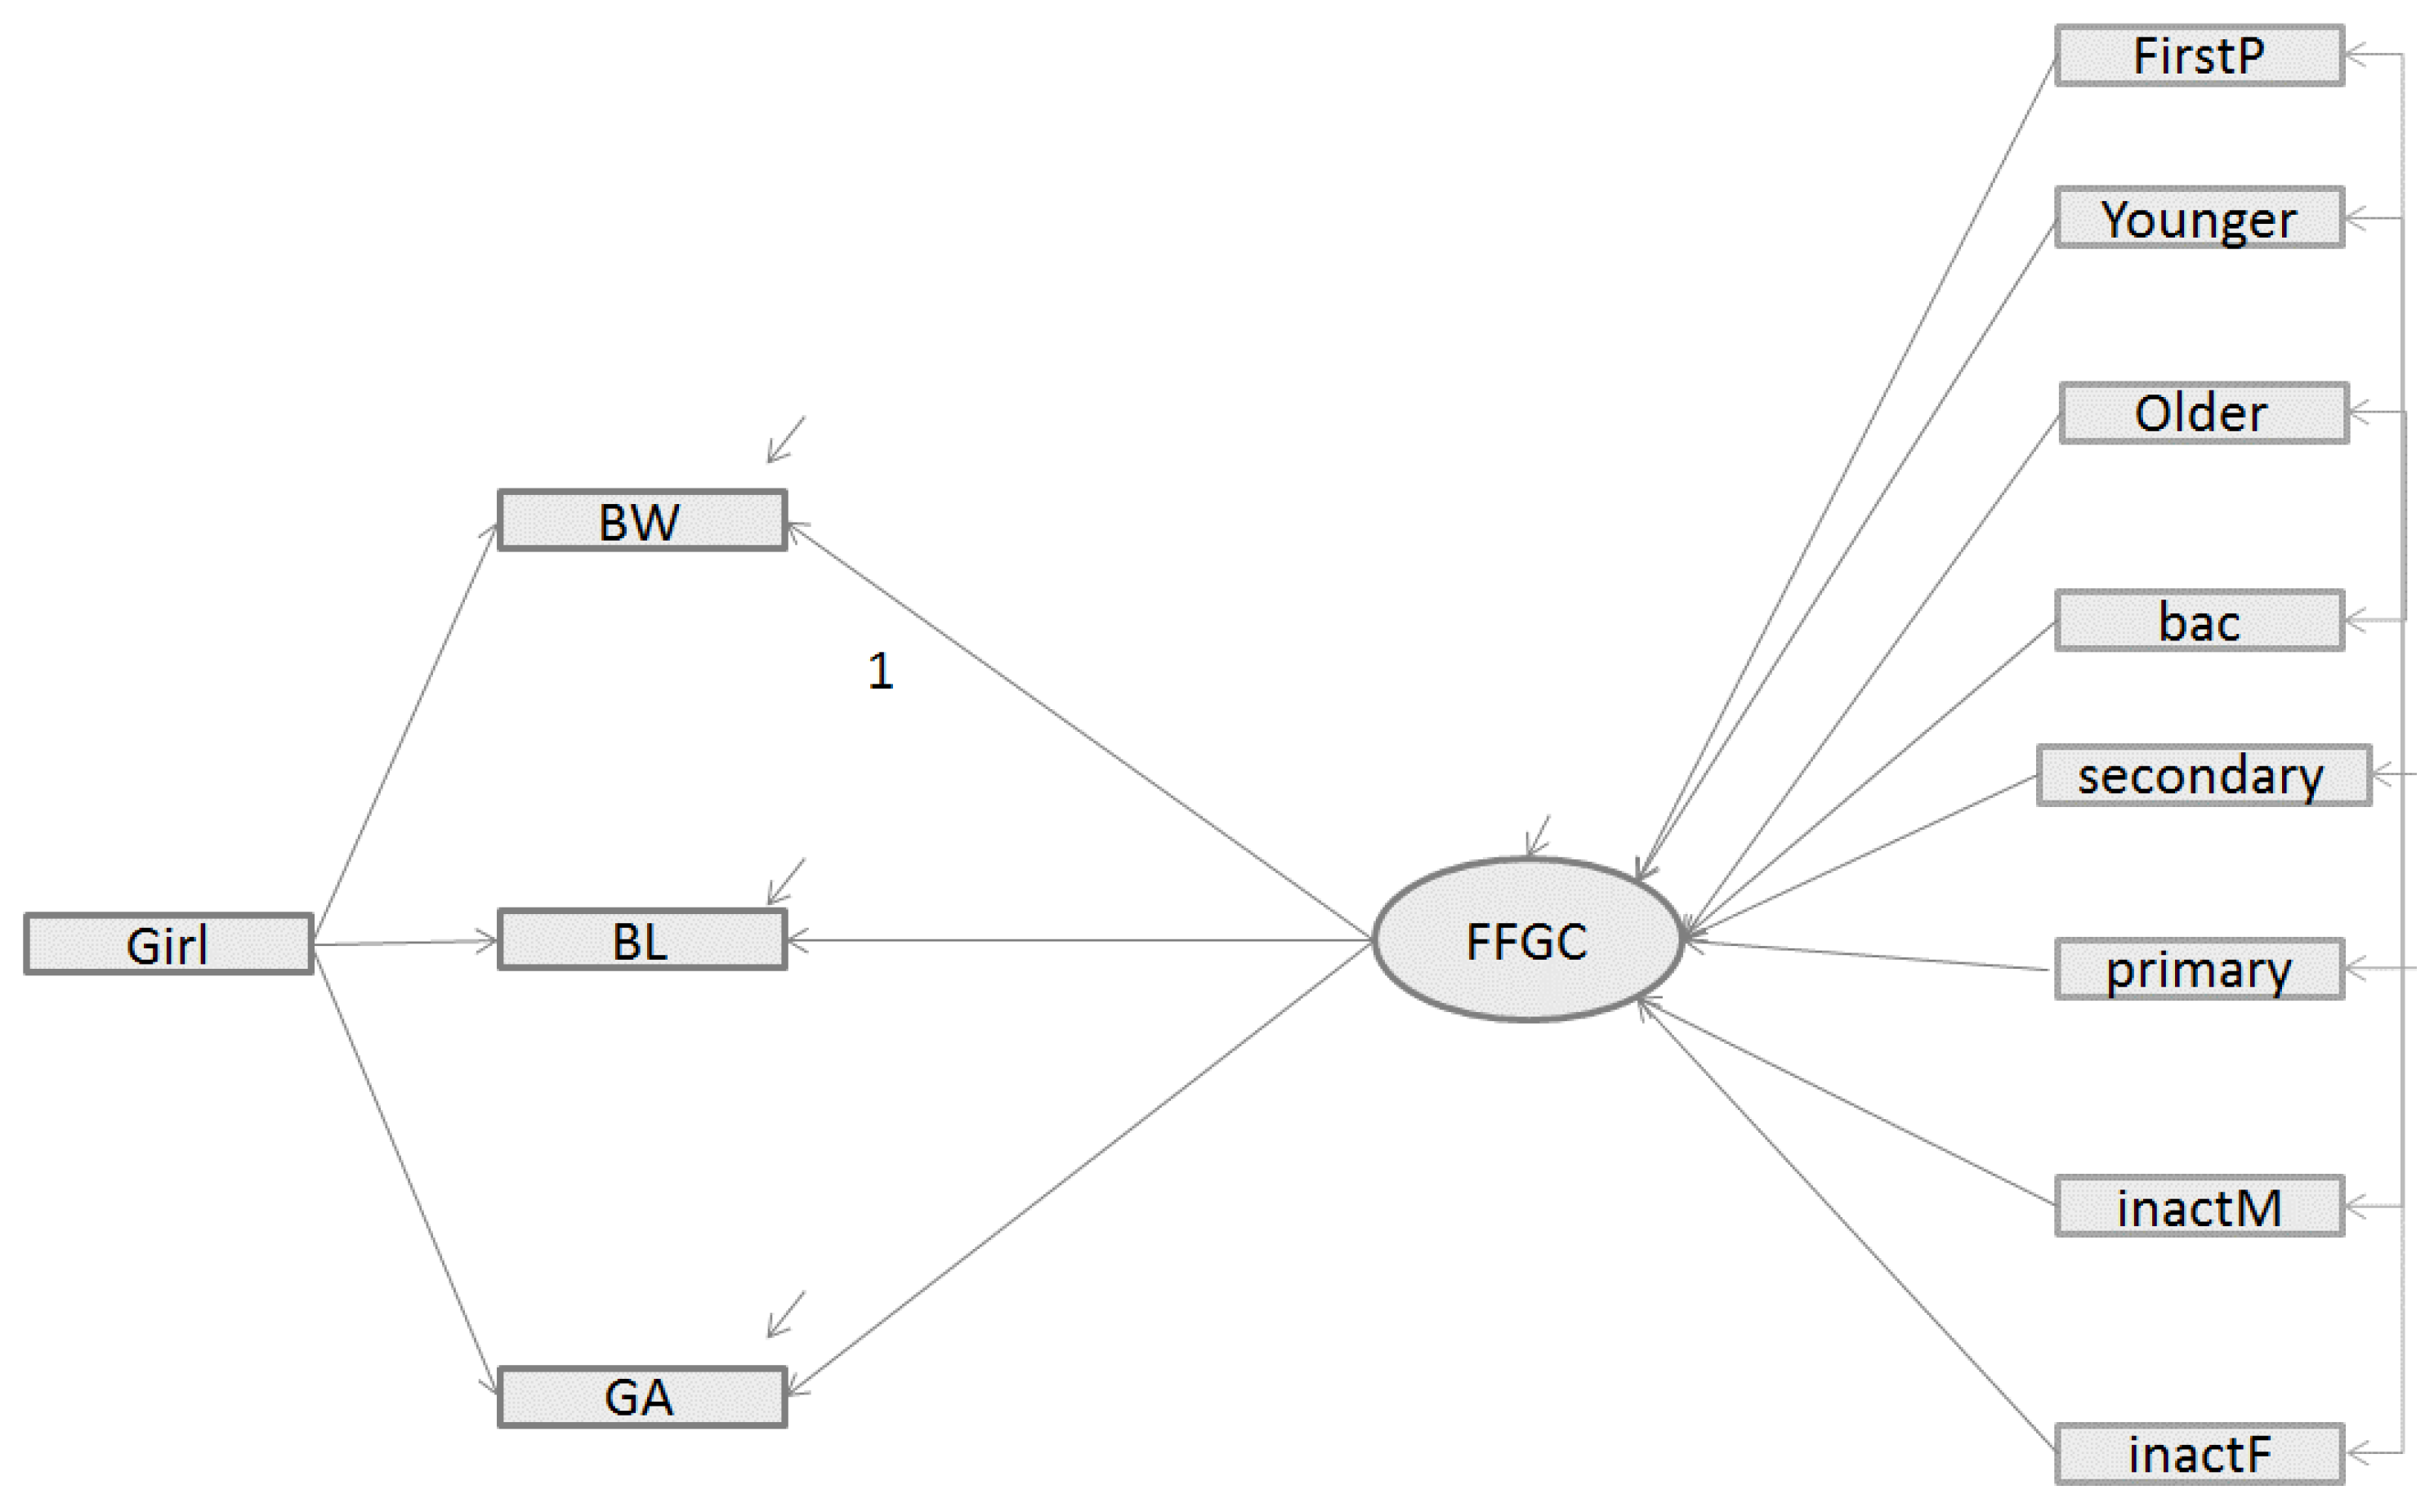
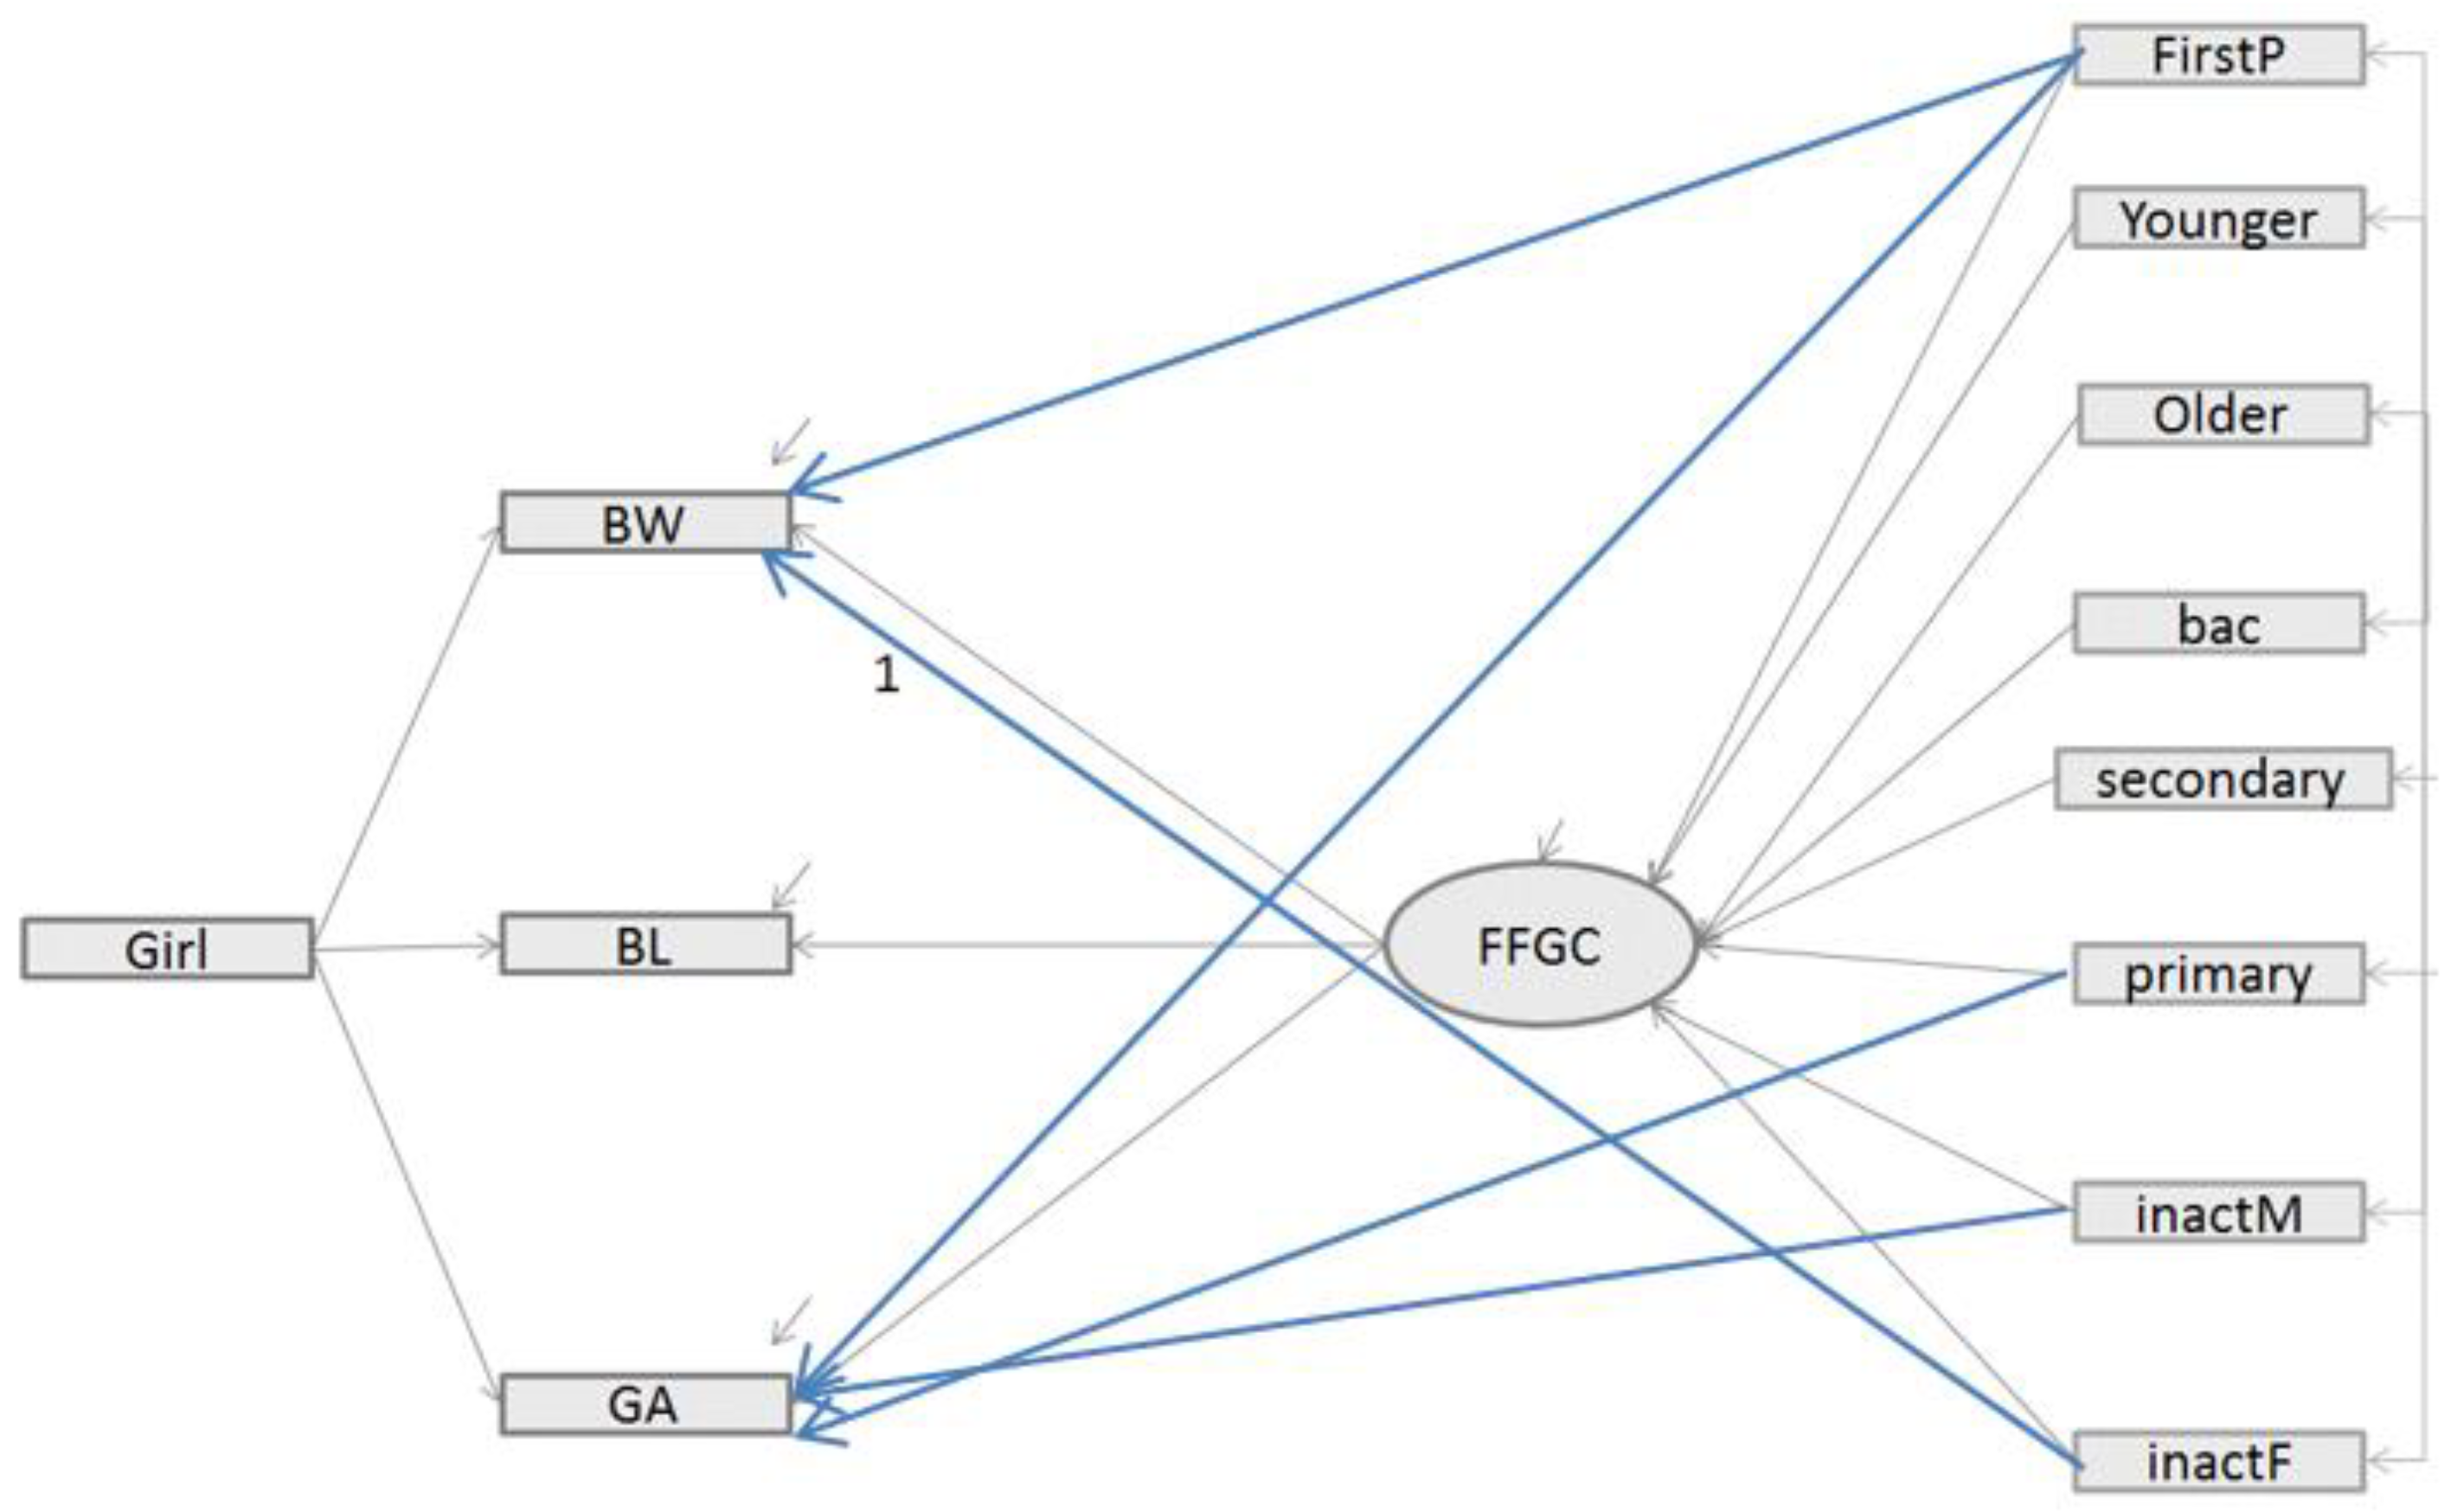
3.2. Main Findings of the Structural Equation Models
- -
- In Model 2, both CFI and [1-RMSEA] values were close to but below the ideal fit of 1, indicating that Model 2 provided a good fit for the data). However, Model 2 had a higher BIC value than the direct model (Model 1) (981.3 vs. 818.8). According to literature recommendations [19], Model 2 did not provide a better fit to the data because the BIC value of Model 2 was higher that the BIC value of the direct model, even if CFI and [1-RMSEA] were close 1).
- -
- Inversely, in Model 3, the addition of direct paths between exogenous variables and birth outcomes improved the model fit. The fit statistics indicate an excellent fit for the data: as with model 2, the CFI and [1-RMSEA] were close to 1. However, a more substantial gap is visible for BIC which, in Model 3, is lower than for Model 1 (780.7 vs. 818.8) and the difference is greater than 10. Model 3, which includes the FFGC latent variable as a mediator variable between the parents characteristics and the birth outcomes (BW, BL, and GA) and includes additional direct paths, appears to be the best model.
3.3. Sensitivity Analysis
- -
- For newborns living in the census blocks categorized in SES8, the measure of parity (FirstP) was not significant; in addition, young mothers and those with a primary level of education were negatively related to FFGC.
- -
- For newborns living in the census blocks categorized in SES7, only the measures of parity (FirstP), maternal age (Older) negatively predicted FFGC (see Supplementary Table S1).
4. Discussion
5. Conclusions
Supplementary Materials
Author Contributions
Acknowledgments
Conflicts of Interest
References
- Lawn, J.E.; Blencowe, H.; Oza, S.; You, D.; Lee, A.C.C.; Waiswa, P.; Lalli, M.; Bhutta, Z.; Barros, A.J.D.; Christian, P.; et al. Every Newborn: Progress, priorities, and potential beyond survival. Lancet 2014, 384, 189–205. [Google Scholar] [CrossRef]
- Preterm Birth, WHO Report. Available online: https://www.who.int/news-room/fact-sheets/detail/preterm-birth (accessed on 9 July 2019).
- Ray, J.G.; Park, A.L.; Fell, D.B. Mortality in infants affected by preterm birth and severe small-for-gestational age birth weight. Pediatrics 2017, 140, e20171881. [Google Scholar] [CrossRef] [PubMed]
- Katz, J.; Lee, A.C.; Kozuki, N.; Lawn, J.E.; Cousens, S.; Blencowe, H.; Ezzati, M.; Bhutta, Z.A.; Marchant, T.; Willey, B.A.; et al. Mortality risk in preterm and small-for-gestational-age infants in low-income and middle-income countries: A pooled country analysis. Lancet 2013, 382, 417–425. [Google Scholar] [CrossRef]
- Ludvigsson, J.F.; Lu, D.; Hammarström, L.; Cnattingius, S.; Fang, F. Small for gestational age and risk of childhood mortality: A Swedish population study. PLoS Med. 2018, 15, e1002717. [Google Scholar] [CrossRef]
- Leon, D.A.; Lithell, H.O.; Vâgerö, D.; Koupilová, I.; Mohsen, R.; Berglund, L.; Lithell, U.B.; McKeigue, P.M. Reduced fetal growth rate and increased risk of death from ischaemic heart disease: Cohort study of 15,000 Swedish men and women born 1915–1929. BMJ 1998, 317, 241–245. [Google Scholar] [CrossRef]
- Silva, L.M.; Jansen, P.W.; Steegers, E.A.P.; Jaddoe, V.W.V.; Arends, L.R.; Tiemeier, H.; Verhulst, F.C.; Moll, H.A.; Hofman, A.; Mackenbach, J.P.; et al. Mother’s educational level and fetal growth: The genesis of health inequalities. Int. J. Epidemiol. 2010, 39, 1250–1261. [Google Scholar] [CrossRef]
- Hoy, W.E.; Nicol, J.L. The Barker hypothesis confirmed: Association of low birth weight with all-cause natural deaths in young adult life in a remote Australian Aboriginal community. J. Dev. Orig. Health Dis. 2019, 10, 55–62. [Google Scholar] [CrossRef]
- Crispi, F.; Miranda, J.; Gratacós, E. Long-term cardiovascular consequences of fetal growth restriction: Biology, clinical implications, and opportunities for prevention of adult disease. Am. J. Obstet. Gynecol. 2018, 218, S869–S879. [Google Scholar] [CrossRef]
- Barker, D.J. Fetal origins of coronary heart disease. BMJ 1995, 311, 171–174. [Google Scholar] [CrossRef]
- Osmond, C.; Barker, D.J.; Winter, P.D.; Fall, C.H.; Simmonds, S.J. Early growth and death from cardiovascular disease in women. BMJ 1993, 307, 1519–1524. [Google Scholar] [CrossRef]
- Bollen, K.A.; Noble, M.D.; Adair, L.S. Are gestational age, birth weight, and birth length indicators of favorable fetal growth conditions? A structural equation analysis of Filipino infants. Stat. Med. 2013, 32, 2950–2961. [Google Scholar] [CrossRef] [PubMed]
- Camerota, M.; Bollen, K.A. Birth weight, birth length, and gestational age as indicators of favorable fetal growth conditions in a US sample. PLoS ONE 2016, 11, e0153800. [Google Scholar] [CrossRef] [PubMed]
- Deguen, S.; Ahlers, N.; Gilles, M.; Danzon, A.; Carayol, M.; Zmirou-Navier, D.; Kihal-Talantikite, W. Using a clustering approach to investigate socio-environmental inequality in preterm birth—A study conducted at fine spatial scale in Paris (France). Int. J. Environ. Res. Public. Health 2018, 15, 1895. [Google Scholar] [CrossRef] [PubMed]
- Lovinsky-Desir, S.; Acosta, L.M.; Rundle, A.G.; Miller, R.L.; Goldstein, I.F.; Jacobson, J.S.; Chillrud, S.N.; Perzanowski, M.S. Air pollution, urgent asthma medical visits and the modifying effect of neighborhood asthma prevalence. Pediatr. Res. 2019, 85, 36–42. [Google Scholar] [CrossRef] [PubMed]
- Lalloué, B.; Monnez, J.-M.; Padilla, C.; Kihal, W.; Meur, N.L.; Zmirou-Navier, D.; Deguen, S. A statistical procedure to create a neighborhood socioeconomic index for health inequalities analysis. Int. J. Equity Health 2013, 12, 21. [Google Scholar] [CrossRef] [PubMed]
- Bollen, K.A. Total, direct, and indirect effects in structural equation models. Sociol. Methodol. 1987, 17, 37–69. [Google Scholar] [CrossRef]
- O’Rourke, N.; Hatcher, L. A Step-By-Step Approach to Using SAS for Factor Analysis and Structural Equation Modeling, 2nd ed.; SAS Institute Inc.: Cary, NC, USA, 2013. [Google Scholar]
- Raftery, A. Bayesian model selection in social research (with discussion by Andrew Gelman & Donald B. Rubin, and Robert M. Hauser, and a rejoinder). Sociol. Methodol. 1995, 25, 111–164. [Google Scholar]
- Guo, L.-Q.; Chen, Y.; Mi, B.-B.; Dang, S.-N.; Zhao, D.-D.; Liu, R.; Wang, H.-L.; Yan, H. Ambient air pollution and adverse birth outcomes: A systematic review and meta-analysis. J. Zhejiang Univ. Sci. B 2019, 20, 238–252. [Google Scholar] [CrossRef]
- Kinare, A. Fetal environment. Indian J. Radiol. Imaging 2008, 18, 326–344. [Google Scholar] [CrossRef]
- Demelash, H.; Motbainor, A.; Nigatu, D.; Gashaw, K.; Melese, A. Risk factors for low birth weight in Bale zone hospitals, South-East Ethiopia: A case-control study. BMC Pregnancy Childbirth 2015, 15, 264. [Google Scholar] [CrossRef]
- WHO Regional Office for Europe. Review of Social Determinants and the Health Divide in the WHO European Region: Final Report; WHO Regional Office for Europe: København, Denmark, 2013. [Google Scholar]
- Births to Mothers Living in Unsafe or Hazardous Housing. Available online: http://origin.who.int/ceh/indicators/Birthsunsafehousing.pdf (accessed on 9 July 2019).
- The United Nations Children’s Fund (UNICEF). UNICEF Low Birthweight: Country, Regional and Global Estimates; UNICEF: New York, NY, USA, 2004; Volume 27. [Google Scholar]
- Rao, S.; Yajnik, C.S.; Kanade, A.; Fall, C.H.; Margetts, B.M.; Jackson, A.A.; Shier, R.; Joshi, S.; Rege, S.; Lubree, H.; et al. Intake of micronutrient-rich foods in rural Indian mothers is associated with the size of their babies at birth: Pune Maternal Nutrition Study. J. Nutr. 2001, 131, 1217–1224. [Google Scholar] [CrossRef] [PubMed]
- Villar, J.; Merialdi, M.; Gülmezoglu, A.M.; Abalos, E.; Carroli, G.; Kulier, R.; de Onis, M. Nutritional interventions during pregnancy for the prevention or treatment of maternal morbidity and preterm delivery: An overview of randomized controlled trials. J. Nutr. 2003, 133, 1606S–1625S. [Google Scholar] [CrossRef] [PubMed]
- Gluckman, P.D.; Hanson, M.A.; Cooper, C.; Thornburg, K.L. Effect of in utero and early-life conditions on adult health and disease. N. Engl. J. Med. 2008, 359, 61–73. [Google Scholar] [CrossRef] [PubMed]
- Franzini, L.; Elliott, M.N.; Cuccaro, P.; Schuster, M.; Gilliland, M.J.; Grunbaum, J.A.; Franklin, F.; Tortolero, S.R. Influences of physical and social neighborhood environments on children’s physical activity and obesity. Am. J. Public Health 2009, 99, 271–278. [Google Scholar] [CrossRef]
- Wang, W.; Wang, Y.; Xiao, C.; Yao, X.; Yang, Y.; Yan, H.; Li, S. Psychological pathway to suicidal ideation among people living with HIV/AIDS in China: A structural equation model. Psychiatry Res. 2018, 260, 255–261. [Google Scholar] [CrossRef] [PubMed]
- Batista-Foguet, J.M.; Coenders, G.; Ferragud, M.A. Using structural equation models to evaluate the magnitude of measurement error in blood pressure. Stat. Med. 2001, 20, 2351–2368. [Google Scholar] [CrossRef]


| N | Point Estimate | Standard Deviation | Minimum | Maximum | |
|---|---|---|---|---|---|
| Newborns’ characteristics | |||||
| Birth weight (grs) | 105,346 | 3314 | 499 | 540 | 5800 |
| Birth length (cms) | 102,589 | 49.7 | 2.3 | 25 | 60 |
| gestational age (weeks) | 105,346 | 39.1 | 1.6 | 23 | 45 |
| gender-girl (%) | 105,346 | 49.3 | |||
| Parents’ characteristics | |||||
| Parity (%) | 104,461 | 39.2 | |||
| Unemployed mother (%) | 105,346 | 45.2 | |||
| Unemployed father (%) | 105,346 | 37.1 | |||
| Age | 105,346 | ||||
| younger (<20 years) (%) | 632 | 0.6% | |||
| Middle (20–35 years) (%) | 73,637 | 69.9% | |||
| Older (≥35 years) (%) | 31,077 | 29.5% | |||
| Level of education | 105,346 | ||||
| Higher (%) | 49,584 | 47.1% | |||
| bac (%) | 6005 | 5.7% | |||
| Secondary (%) | 3867 | 3.7% | |||
| Primary (%) | 45,890 | 43.6% | |||
| Model | Chi2 | df | p-Value | SRMR | RMSEA | [1-RMSEA] | BIC | CFI |
|---|---|---|---|---|---|---|---|---|
| Model 1 | 11.6423 | 8 | <0.0001 | 0.0012 | 0.0021 | 0.9979 | 818.8 | 1 |
| Model 2 | 335.5241 | 22 | <0.0001 | 0.0058 | 0.0118 | 0.9882 | 981.2 | 0.9988 |
| Model 3 | 88.8684 | 18 | <0.0001 | 0.0022 | 0.0062 | 0.9938 | 780.7 | 0.9997 |
| Parents’ Characteristics | β | SE | p-Value |
|---|---|---|---|
| FirstP | −0.03771 | 0.00360 | <0.0001 |
| unemployedF | −0.02396 | 0.00682 | 0.0004 |
| unemployedM | 0.00959 | 0.00473 | 0.0425 |
| Age | |||
| Younger | −0.01913 | 0.00335 | <0.0001 |
| Middle | ref | --- | --- |
| Older | −0.01871 | 0.00338 | <0.0001 |
| Level of education | |||
| Higher | ref | --- | --- |
| bac | −0.02233 | 0.00344 | <0.0001 |
| Secondary | −0.02971 | 0.00344 | <0.0001 |
| Primary | −0.05511 | 0.00427 | <0.0001 |
| The Least Deprived Census Blocks | The Most Deprived Census Blocks | |||||||||||
|---|---|---|---|---|---|---|---|---|---|---|---|---|
| Parents’ Charactéristics | SES1 (10,567) | SES2 (10,449) | SES9 (10,523) | SES10 (10,513) | ||||||||
| β | SE | p-Value | β | SE | p-Value | β | SE | p-Value | β | SE | p-Value | |
| Firstp | −0.05445 | 0.01134 | <0.0001 | −0.05202 | 0.01144 | <0.0001 | −0.04178 | 0.01129 | 0.0002 | −0.03433 | 0.01120 | 0.0022 |
| Unemployedf | 0.00630 | 0.02126 | 0.7670 | −0.01342 | 0.02176 | 0.5373 | −0.05573 | 0.02030 | 0.0061 | −0.03872 | 0.01843 | 0.0357 |
| Unemployedm | 0.02707 | 0.01392 | 0.0519 | 0.02548 | 0.01418 | 0.0724 | 0.00415 | 0.01430 | 0.7716 | −0.01126 | 0.01363 | 0.4087 |
| Age of the Mother | ||||||||||||
| Younger | 0.0008263 | 0.01059 | 0.9378 | −0.00335 | 0.01066 | 0.7534 | −0.02141 | 0.01057 | 0.0429 | −0.01962 | 0.01061 | 0.0644 |
| Middle | ref | -- | -- | ref | -- | -- | ref | -- | -- | ref | -- | -- |
| Older | −0.03073 | 0.01075 | 0.0042 | −0.02165 | 0.01084 | 0.0458 | −0.02846 | 0.01064 | 0.0075 | −0.01248 | 0.01061 | 0.2396 |
| Level of Mother Education | ||||||||||||
| Superior | ref | -- | -- | ref | -- | -- | ref | -- | -- | ref | -- | -- |
| bac | −0.03120 | 0.01063 | 0.0033 | −0.01657 | 0.01075 | 0.1230 | −0.03449 | 0.01136 | 0.0024 | −0.03278 | 0.01207 | 0.0066 |
| Secondary | −0.02233 | 0.01065 | 0.0359 | −0.01907 | 0.01077 | 0.0766 | −0.03335 | 0.01130 | 0.0032 | −0.04767 | 0.01196 | <0.0001 |
| Primary | −0.05553 | 0.01261 | <0.0001 | −0.07422 | 0.01286 | <0.0001 | −0.05797 | 0.01384 | <0.0001 | −0.04571 | 0.01468 | 0.0019 |
© 2019 by the authors. Licensee MDPI, Basel, Switzerland. This article is an open access article distributed under the terms and conditions of the Creative Commons Attribution (CC BY) license (http://creativecommons.org/licenses/by/4.0/).
Share and Cite
Kihal-Talantikite, W.; Le Nouveau, P.; Legendre, P.; Zmirou Navier, D.; Danzon, A.; Carayol, M.; Deguen, S. Adverse Birth Outcomes as Indicators of Poor Fetal Growth Conditions in a French Newborn Population—A Stratified Analysis by Neighborhood Deprivation Level. Int. J. Environ. Res. Public Health 2019, 16, 4069. https://doi.org/10.3390/ijerph16214069
Kihal-Talantikite W, Le Nouveau P, Legendre P, Zmirou Navier D, Danzon A, Carayol M, Deguen S. Adverse Birth Outcomes as Indicators of Poor Fetal Growth Conditions in a French Newborn Population—A Stratified Analysis by Neighborhood Deprivation Level. International Journal of Environmental Research and Public Health. 2019; 16(21):4069. https://doi.org/10.3390/ijerph16214069
Chicago/Turabian StyleKihal-Talantikite, Wahida, Pauline Le Nouveau, Pierre Legendre, Denis Zmirou Navier, Arlette Danzon, Marion Carayol, and Séverine Deguen. 2019. "Adverse Birth Outcomes as Indicators of Poor Fetal Growth Conditions in a French Newborn Population—A Stratified Analysis by Neighborhood Deprivation Level" International Journal of Environmental Research and Public Health 16, no. 21: 4069. https://doi.org/10.3390/ijerph16214069
APA StyleKihal-Talantikite, W., Le Nouveau, P., Legendre, P., Zmirou Navier, D., Danzon, A., Carayol, M., & Deguen, S. (2019). Adverse Birth Outcomes as Indicators of Poor Fetal Growth Conditions in a French Newborn Population—A Stratified Analysis by Neighborhood Deprivation Level. International Journal of Environmental Research and Public Health, 16(21), 4069. https://doi.org/10.3390/ijerph16214069