Quality of the Indoor Environment in Elderly Care Centers in Two Cities in Central Portugal: Viseu and Covilhã


Abstract
:1. Introduction
2. Physical Characterization of the Studied Buildings and Compartments
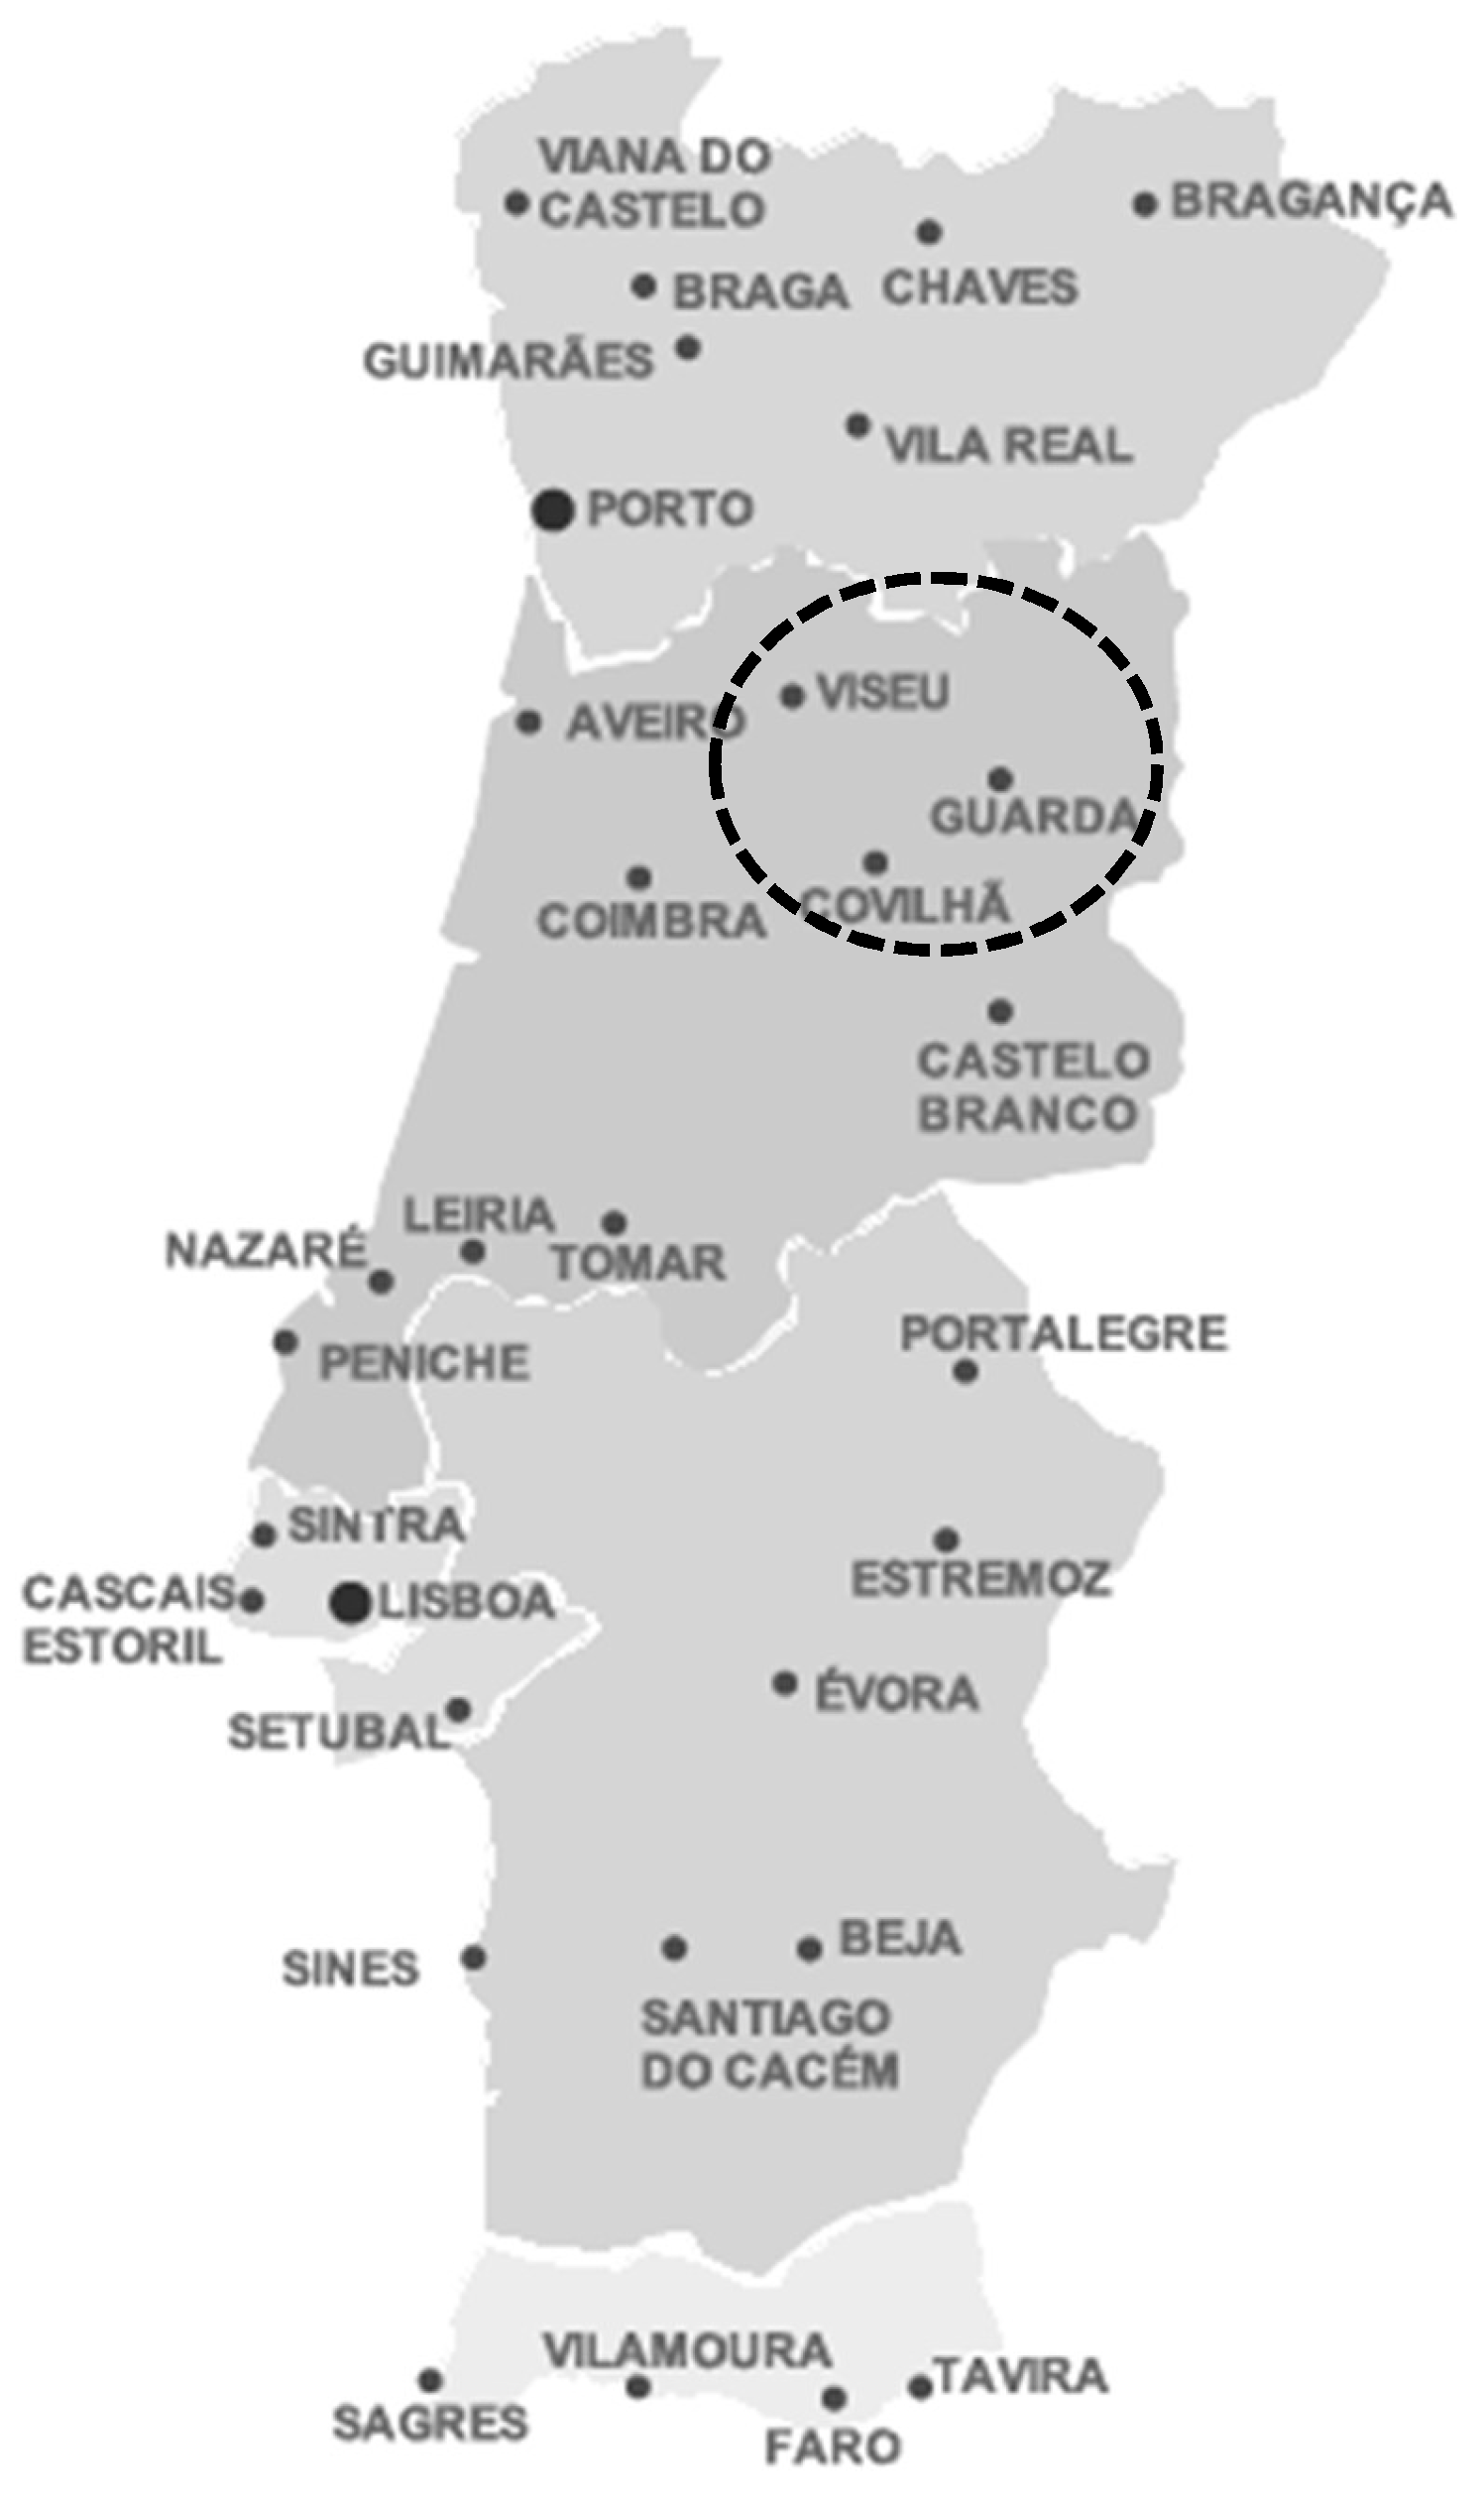
2.1. City of Viseu
2.2. City of Covilhã
3. Regulatory Requirements, Standards, and Experimental Conditions
4. Materials and Methods
4.1. Experimental Conditions in the City of Viseu
4.2. Experimental Conditions in the City of Covilhã
5. Presentation and Critical Analysis of Results
5.1. Viseu
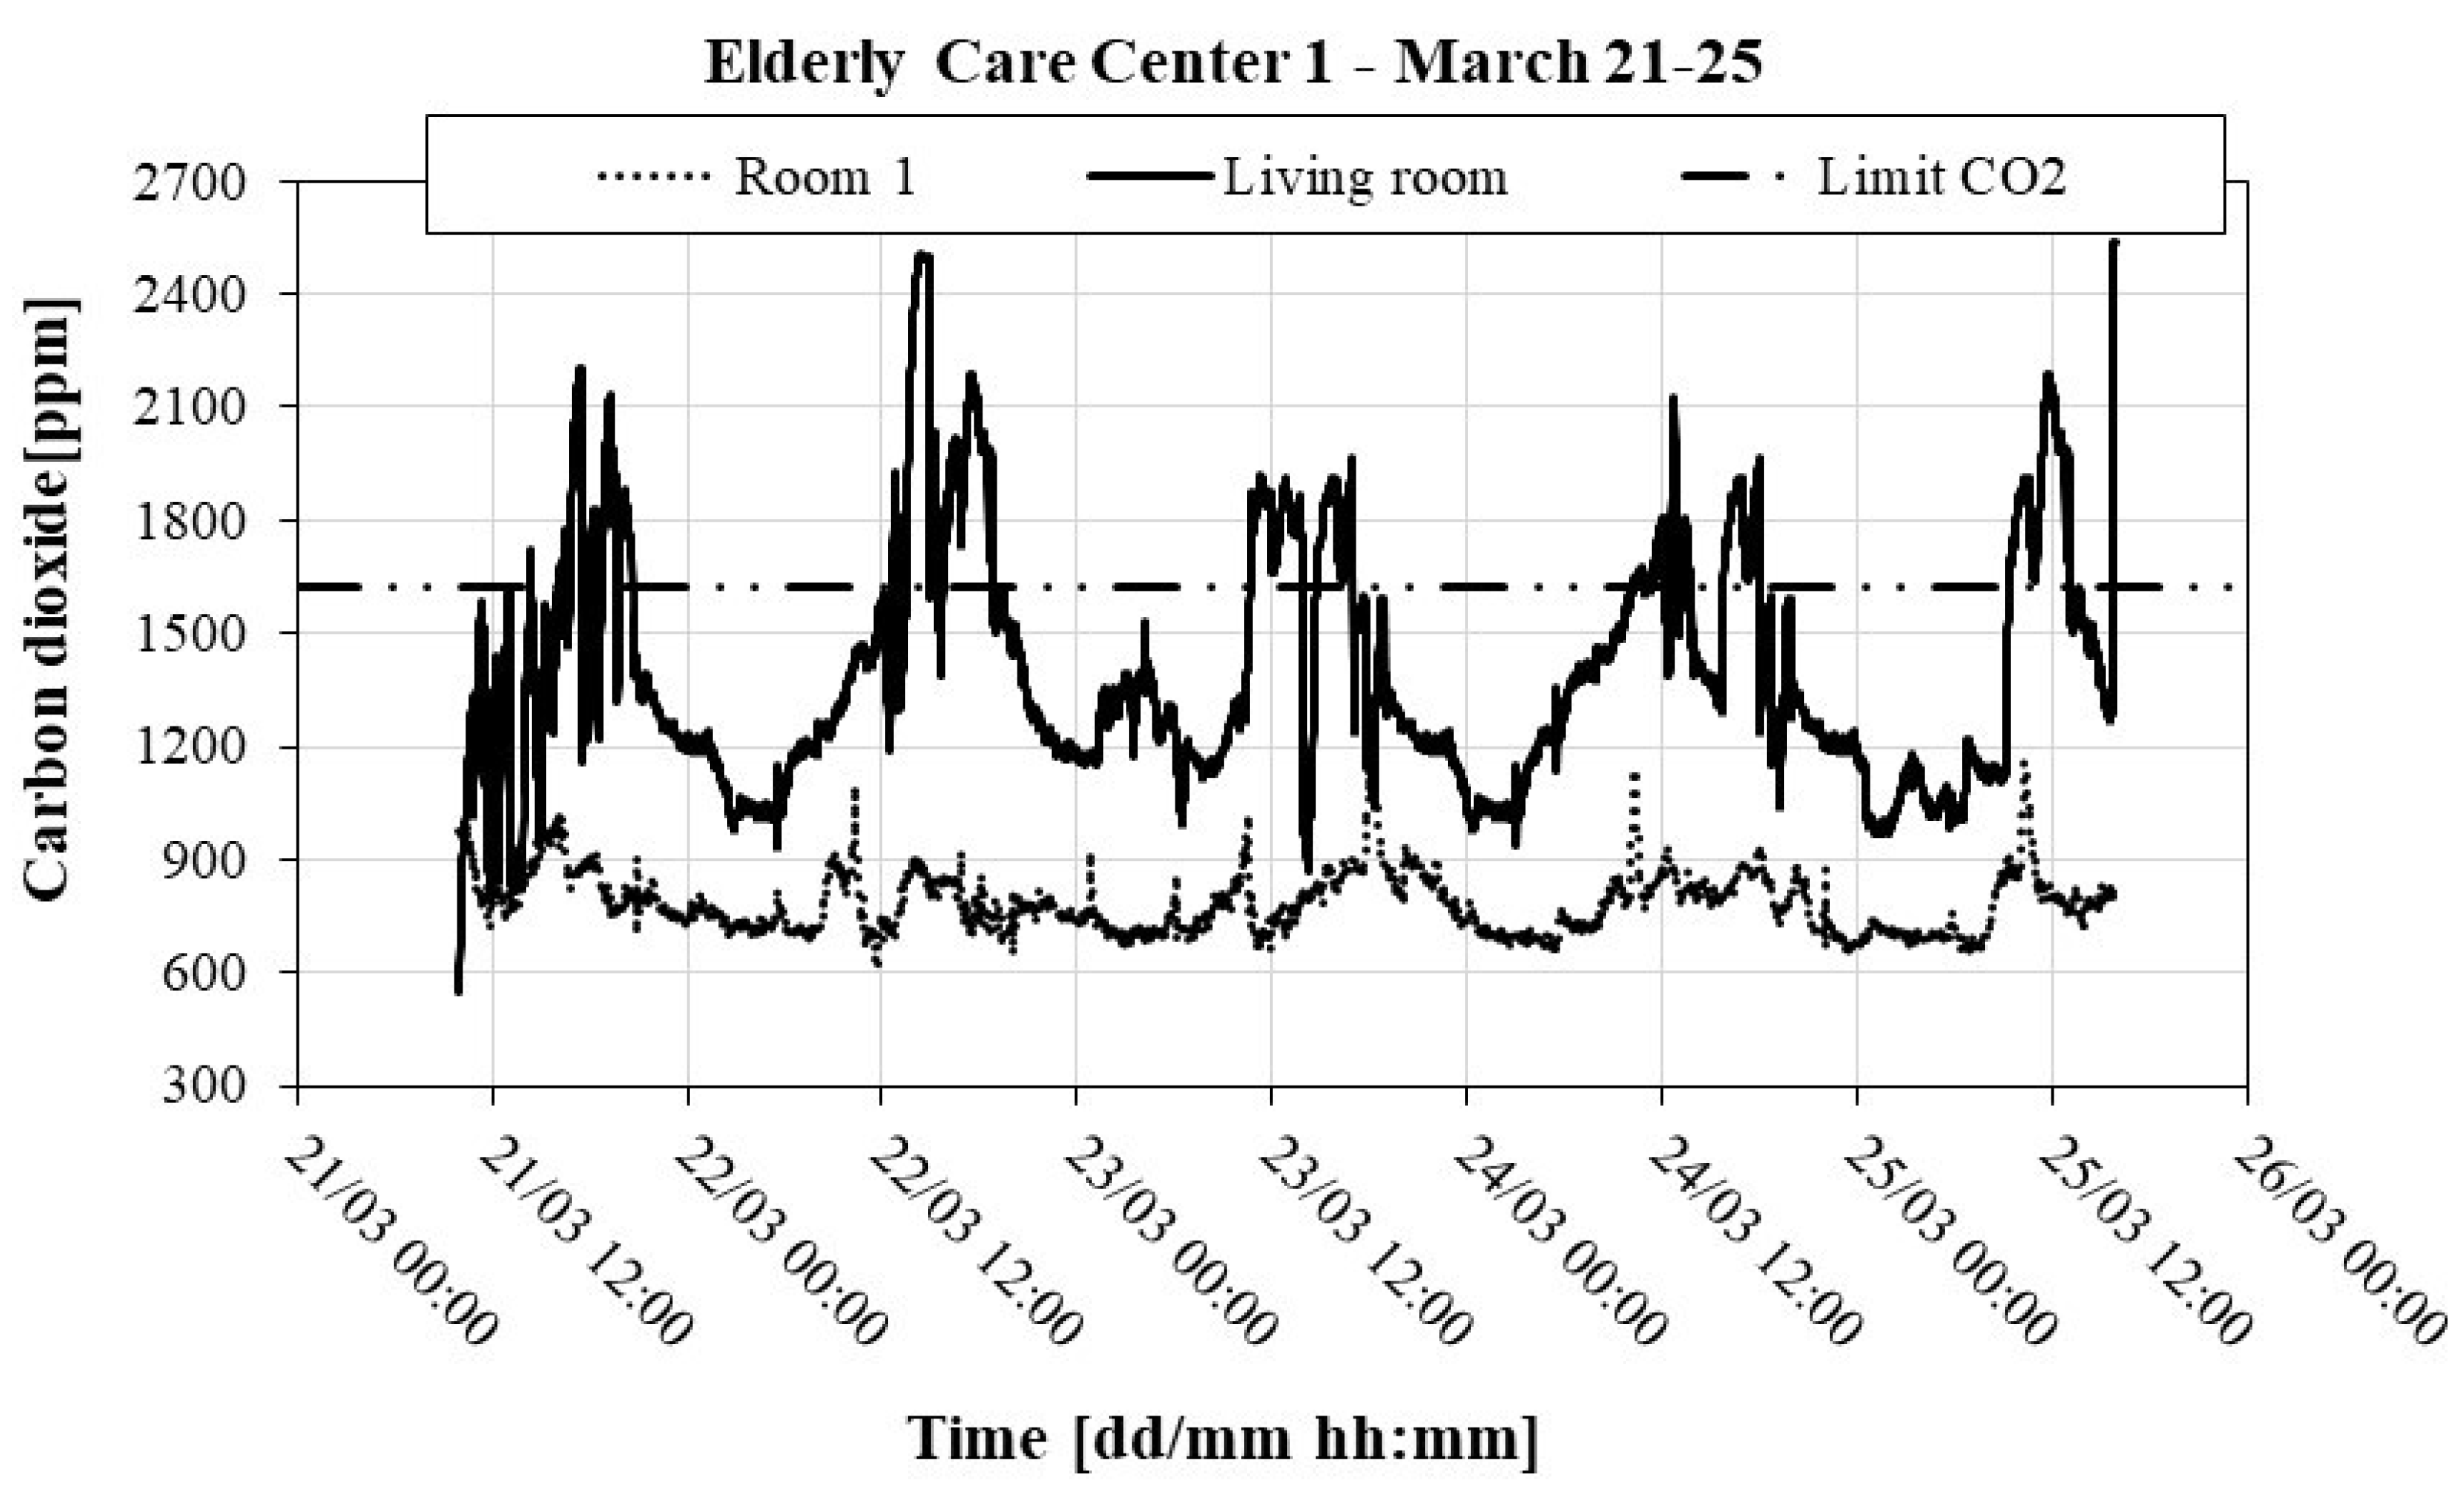
5.1.1. ECC 1
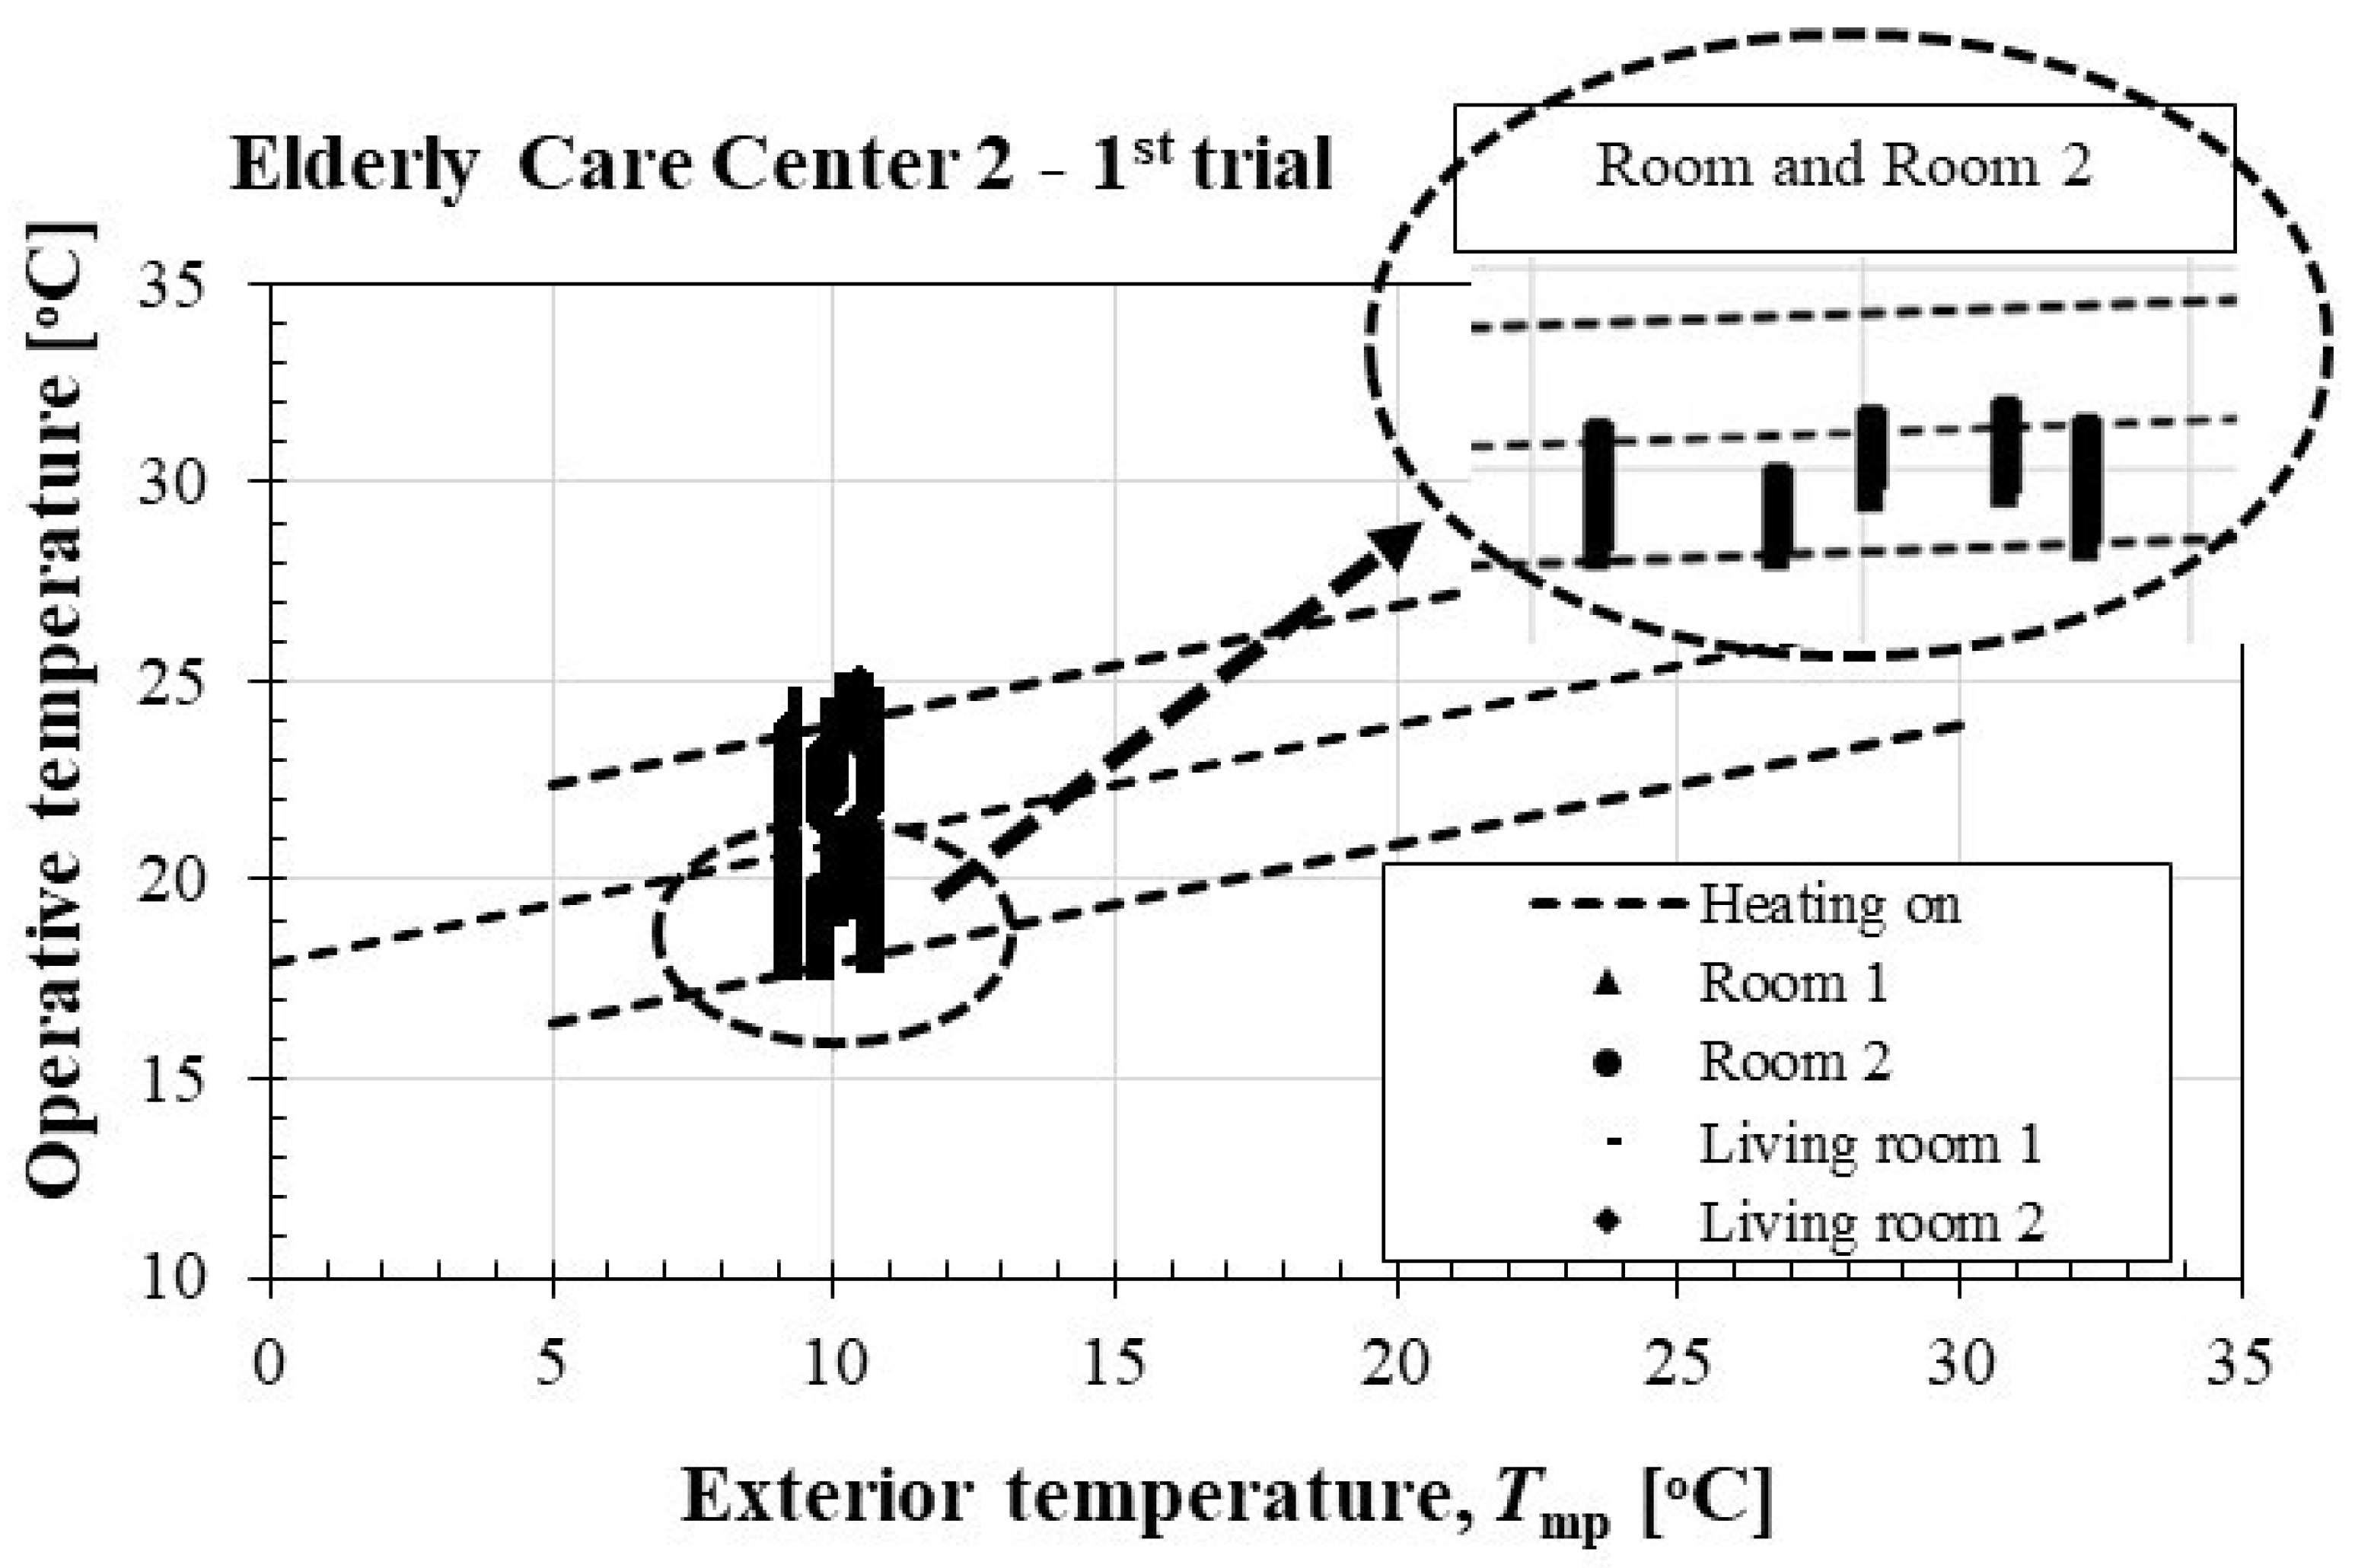
5.1.2. ECC 2—1st Trial
5.2. Covilhã
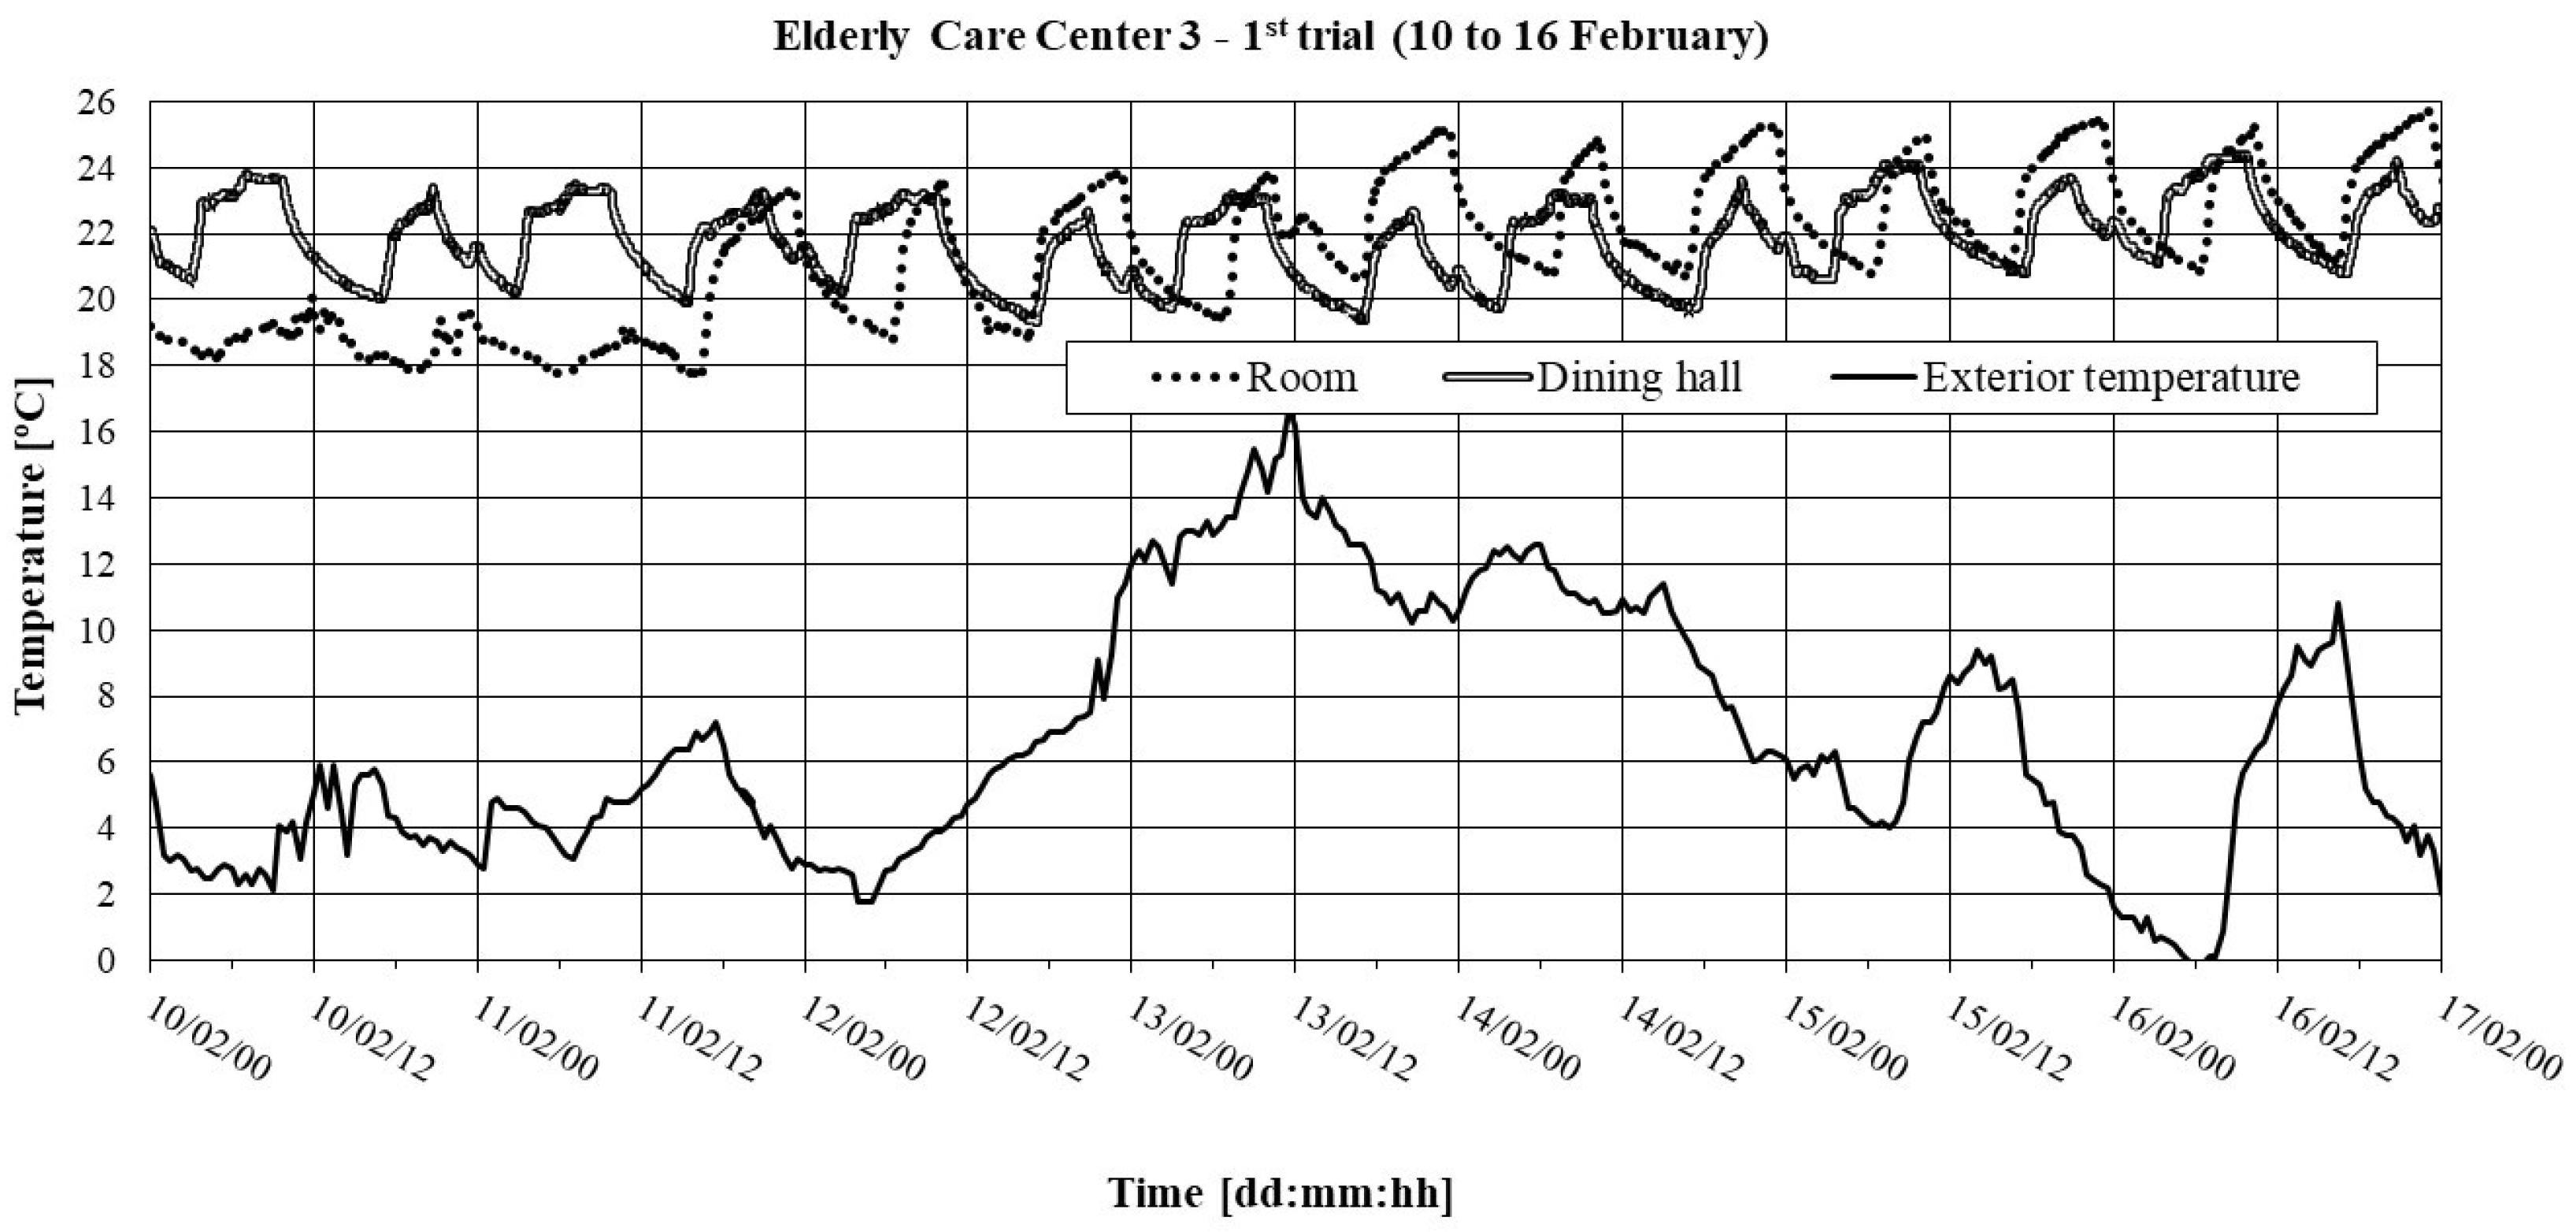
5.2.1. 1st Trial
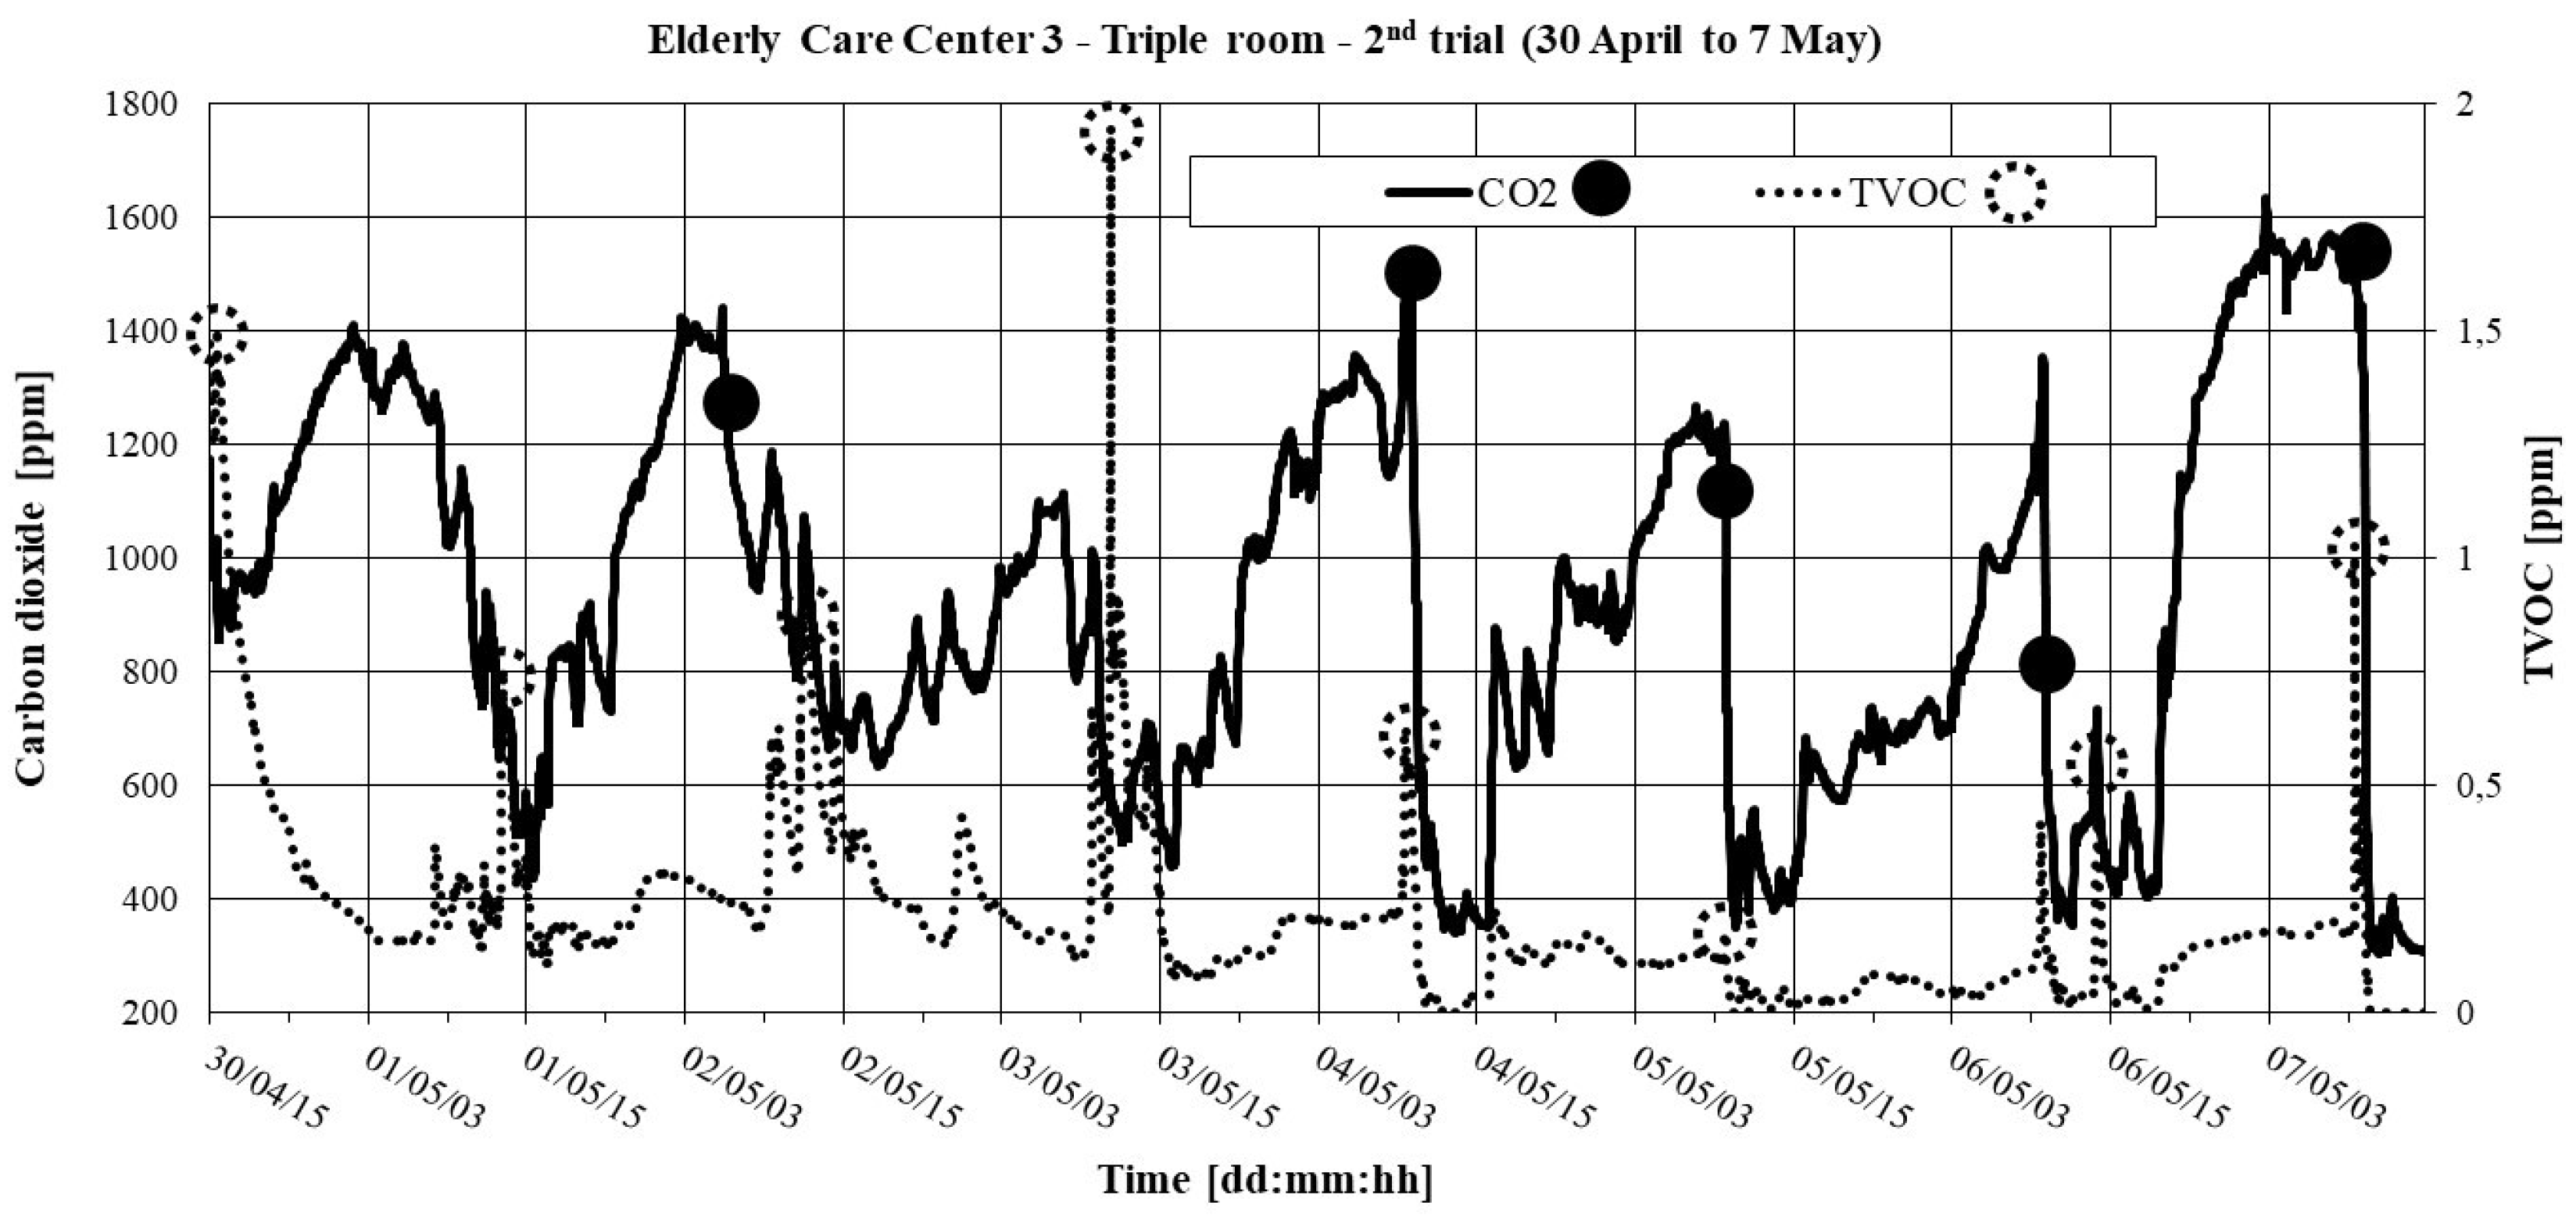
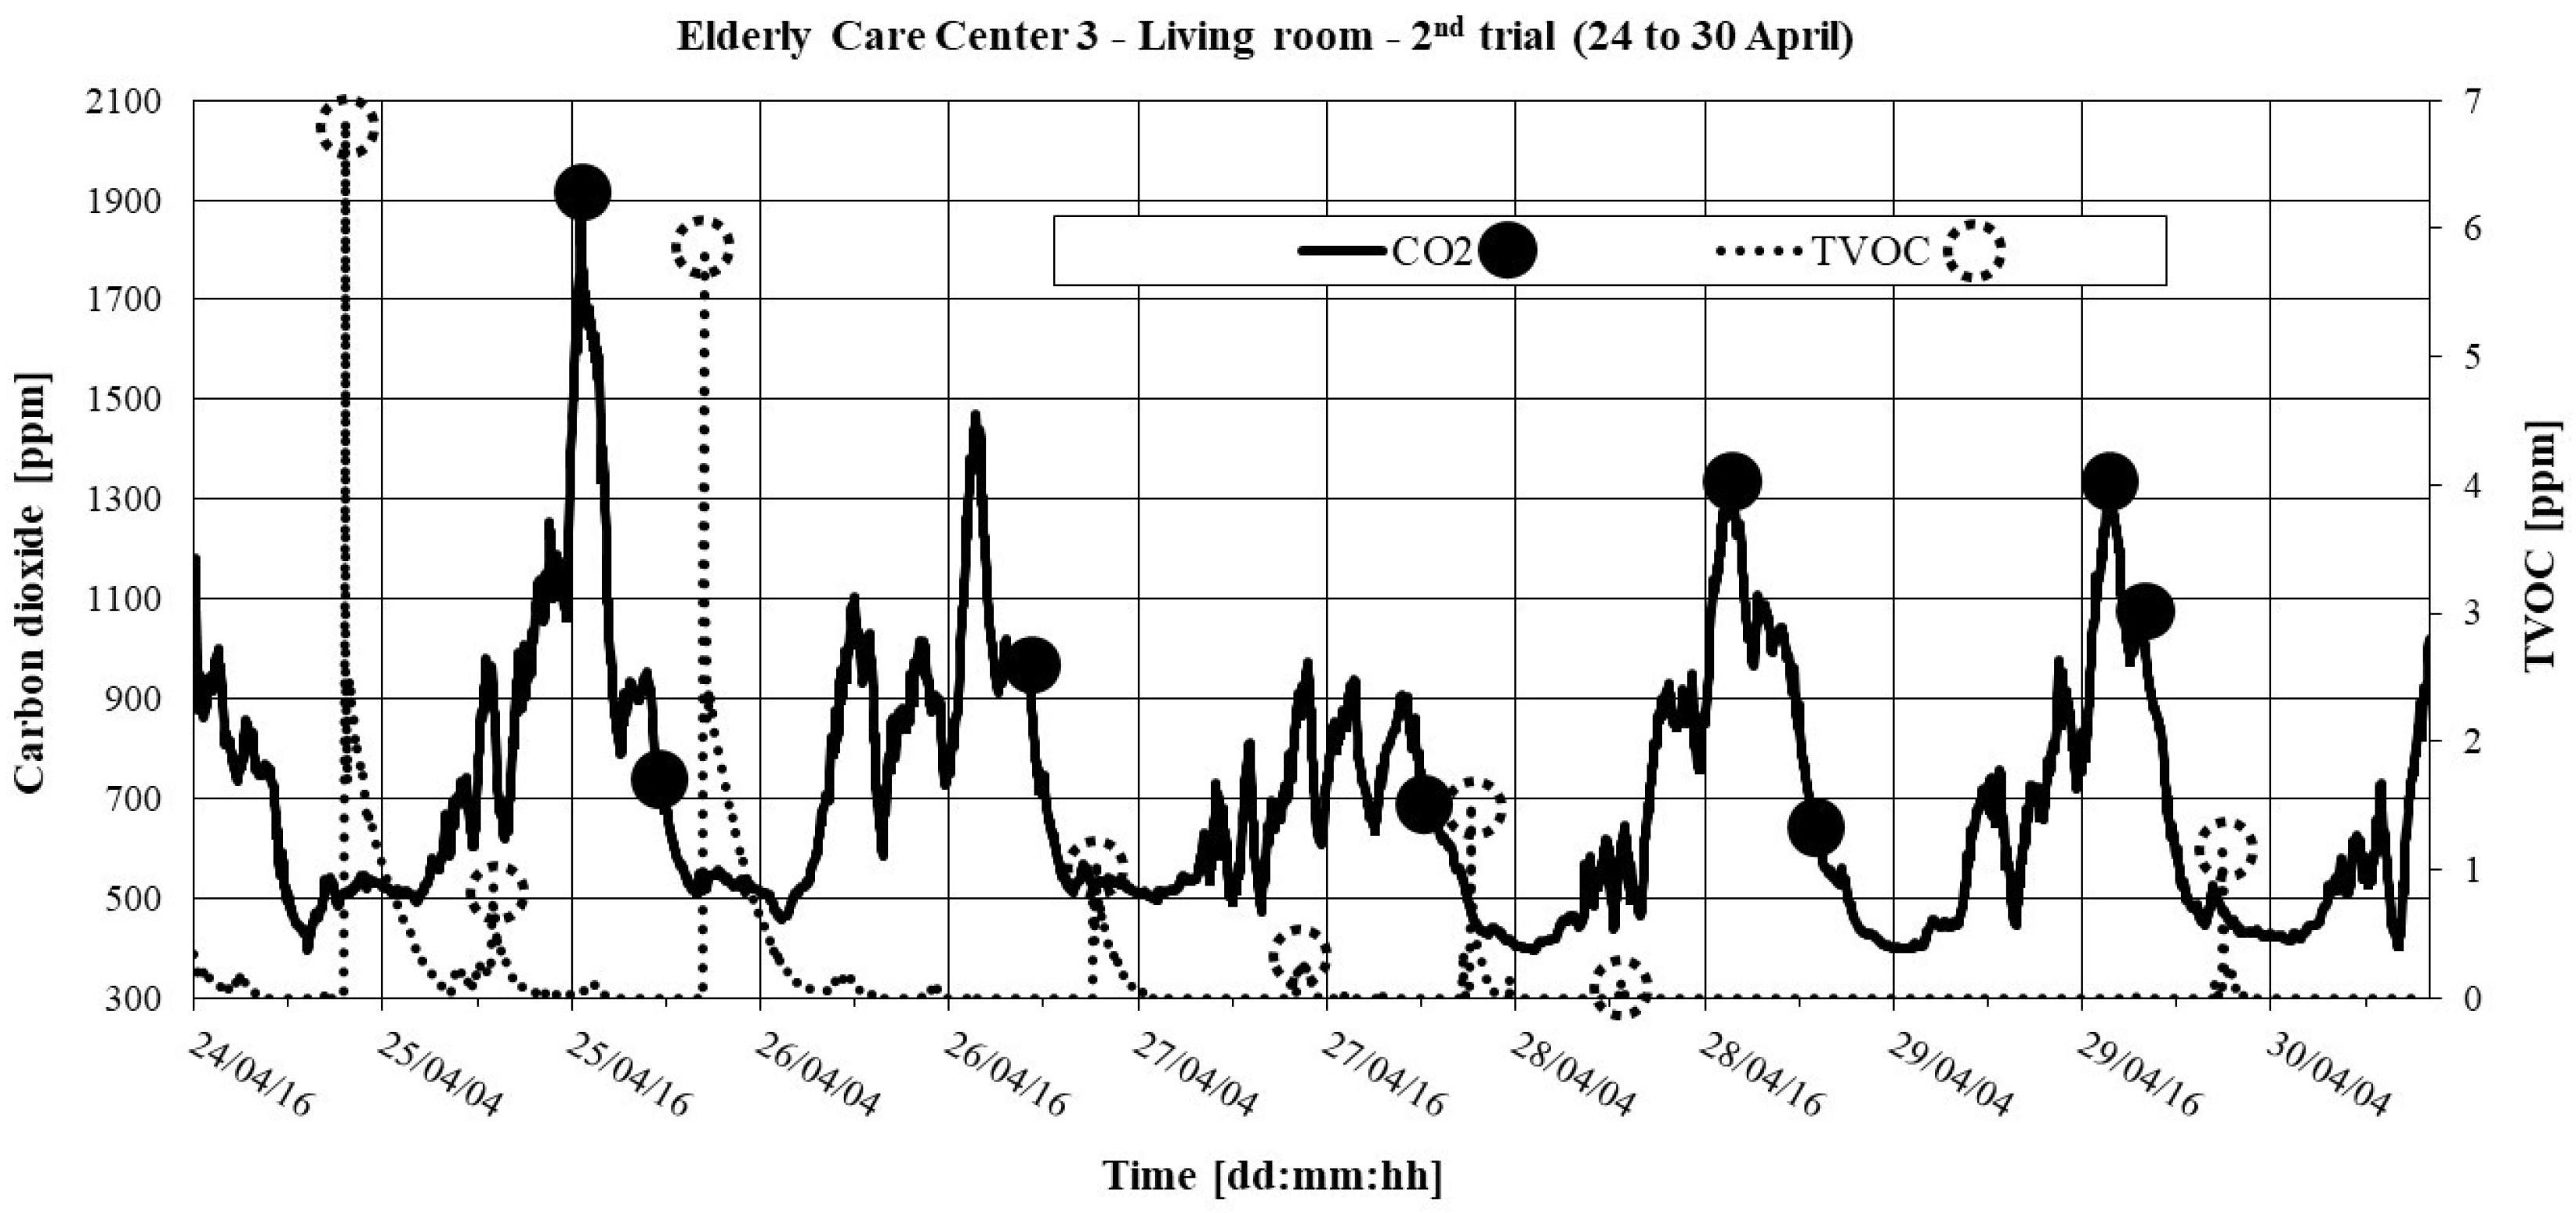
5.2.2. 2nd Trial
6. Conclusions and Recommendations
Author Contributions
Funding
Acknowledgments
Conflicts of Interest
Nomenclature
| A | Area of a zone, [m2] |
| ACH | Air change rate, [h−1] |
| CH2O | Formaldehyde |
| CO2 | Carbon dioxide |
| E, NE, NW, SE, SW, W | Cardinal points: E—East; NE—Northeast; NW—Northwest; SE—Southeast; SW—south-west; W—West |
| ECC | Elderly Care Centers |
| HVAC | Heating, Ventilation, and Air Conditioning |
| IAQ | Indoor Air Quality |
| IEQ | Indoor Environment Quality |
| I/O | Indoor/Outdoor ratio |
| LNEC | National Laboratory for Civil Engineering |
| Max | Maximum |
| Min | Minimum |
| MT | Margin of Tolerance |
| MV | Mechanical Ventilation |
| N | Number of measurement points |
| n | Number of values measured to average 8 h |
| NV | Natural Ventilation |
| Perc | Percentage of time that exceeds a certain value |
| q | Air flow rate, [m3/h] |
| RH | Relative Humidity, [–] |
| RR | Restroom |
| T | Temperature, [°C] |
| Tmp | Running mean outdoor temperature, [°C] |
| TVOC | Total Volatile Organic Compounds |
| VOC | Volatile Organic Compound |
| Greek symbols | |
| Δ | Difference |
| μ | Mean |
| σ | Standard deviation |
| Subscripts | |
| av | Average (arithmetic mean) |
| ext | Referring to the exterior |
| i | Referring to a zone |
| int | Referring to the interior |
| Max | Maximum |
| RECS | Referring to Ordinance 353-A/2013 |
References
- Frontczak, M.; Wargocki, P. Literature survey on how different factors influence human comfort in indoor environments. Build. Environ. 2011, 46, 922–937. [Google Scholar] [CrossRef]
- Mendes, A.; Papoila, A.L.; Carreiro-Martins, P.; Bonassi, S.; Caires, I.; Palmeiro, T.; Aguiar, L.; Pereira, C.; Neves, P.; Mendes, D.; et al. The impact of indoor air quality and contaminants on respiratory health of older people living in long-term care residences in Porto. Age Ageing 2016, 45, 136–142. [Google Scholar] [CrossRef] [PubMed]
- Decree-Law No. 118/2013, Energy Performance Regulation for Commercial and Services Buildings (in Portuguese); Ministry of Economy and Employment: Lisbon, Portugal, August 2013. (In Portuguese)
- INE (Instituto Nacional de Estatística—National Institute of Statistics). Census 2011. In Definitive Results—Portugal; Instituto Nacional de Estatística—National Institute of Statistics: Lisbon, Portugal, 2012. (In Portuguese) [Google Scholar]
- Bradshaw, S.A.; Playford, E.D.; Riazi, A. Living well in care homes: A systematic review of qualitative studies. Age Ageing 2012, 41, 429–440. [Google Scholar] [CrossRef] [PubMed]
- Mishra, A.K.; Ramgopal, M. Field studies on human thermal comfort—An overview. Build. Environ. 2013, 64, 94–106. [Google Scholar] [CrossRef]
- Rupp, R.F.; Vásquez, N.G.; Lamberts, R. A review of human thermal comfort in the built environment. Energy Build. 2015, 105, 178–205. [Google Scholar] [CrossRef]
- Mendes, A.; Papoila, A.L.; Carreiro-Martins, P.; Aguiar, L.; Bonassi, S.; Caires, I.; Palmeiro, T.; Ribeiro, Á.S.; Neves, P.; Pereira, C.; et al. The Influence of Thermal Comfort on the Quality of Life of Nursing Home Residents. J. Toxicol. Environ. Health Part A 2017, 80, 729–739. [Google Scholar] [CrossRef]
- Van Hoof, J.; Schellen, L.; Soebarto, V.; Wong, J.K.W.; Kazak, J.K. Ten questions concerning thermal comfort and ageing. Build. Environ. 2017, 120, 123–133. [Google Scholar] [CrossRef]
- Wang, Z.; De Dear, R.; Luo, M.; Lin, B.; He, Y.; Ghahramani, A.; Zhu, Y. Individual difference in thermal comfort: A literature review. Build. Environ. 2018, 138, 181–193. [Google Scholar] [CrossRef]
- Huang, Y.C.; Chu, C.L.; Lee, S.N.C.; Lan, S.J.; Hsieh, C.H.; Hsieh, Y.P. Building users’ perceptions of importance of indoor environmental quality in long-term care facilities. Build. Environ. 2013, 67, 224–230. [Google Scholar] [CrossRef]
- Walgraeve, C.; Demeestere, K.; Dewulf, J.; Van Huffel, K.; Van Langenhove, H. Diffusive sampling of 25 volatile organic compounds in indoor air: Uptake rate determination and application in Flemish homes for the elderly. Atmos. Environ. 2011, 45, 5828–5836. [Google Scholar] [CrossRef]
- Almeida-Silva, M.; Wolterbeek, H.; Almeida, S.M. Elderly exposure to indoor air pollutants. Atmos. Environ. 2014, 85, 54–63. [Google Scholar] [CrossRef]
- Shao, D.; Du, Y.; Liu, S.; Brunekreef, B.; Meliefste, K.; Zhao, Q.; Chen, J.; Song, X.; Wang, M.; Wang, J.; et al. Cardiorespiratory responses of air filtration: A randomized crossover intervention trial in seniors living in Beijing: Beijing Indoor Air Purifier StudY, BIAPSY. Sci. Total Environ. 2017, 603, 541–549. [Google Scholar] [CrossRef] [PubMed]
- Lanzinha, J.; Freire, T.; Alves, A.; Pinto, M. Quality of the Indoor Environment in Elderly Care Centers and Kindergartens in the City of Covilhã—Exploratory Study. In Proceedings of the ICEUBI—International Conference on Engineering 2015, Covilhã, Portugal, 2–4 December 2015. (In Portuguese). [Google Scholar]
- Pinto, M.; Viegas, J.; Freitas, V.; Infante, C. Quality of the Indoor Environment in Elderly Care Cenetrs and Kindergartens in the City of Viseu—Portugal. In Proceedings of the Euro-American Congress REHABEND, Cáceres, Spain, 15–18 May 2018. (In Portuguese). [Google Scholar]
- Order 15793-F/2013, Climate Zoning of Portugal; Ministry of Economy and Employment: Lisbon, Portugal, December 2013. (In Portuguese)
- Ordinance 67/2012, Conditions of Organization, Operation and Installation to Which Residential Structures for Elderly People must Comply; Ministries of Solidarity and Social Security: Lisbon, Portugal, March 2012. (In Portuguese)
- Ordinance 353-A/2013, Energy Performance Regulation of Commercial and Services Buildings (RECS)—Ventilation and Indoor Air Quality Requirements; Ministries of the Environment, Ordination, Territory and Energy, Health and Solidarity, Employment and Safety Social: Lisbon, Portugal, December 2013. (In Portuguese)
- Ordinance 349-D/2013, Energy Performance Regulation for Commercial and Services Buildings (RECS)—Design Requirements for New Buildings and Interventions; Ministries of the Environment, Ordination, Territory and Energy and Solidarity, Employment and Social Security: Lisbon, Portugal, December 2013. (In Portuguese)
- CEN. Indoor Environmental Input Parameters for Design and Assessment of Energy Performance of Buildings. In Addressing Indoor Air Quality, Thermal Environment, Lighting and Acoustic; EN 15251; European Committee for Standardization: Brussels, Belgium, 2007. [Google Scholar]
- Social Security Institute. Technical Recommendations for Social Facilities—Elderly Care Centers; Social Security Institute: Lisbon, Portugal, 2007. (In Portuguese) [Google Scholar]
- CEN. Ventilation for Buildings. In Design and Dimensioning of Residential Ventilation Systems; CEN/TR 14788; European Committee for Standardization: Brussels, Belgium, 2006. [Google Scholar]
- ADENE. Methodology for Periodic IEQ Audits in Existing Services Buildings under the RSECE; Technical Note NT-SCE-02; ADENE—Portuguese Energy Agency: Lisbon, Portugal, 2009. (In Portuguese) [Google Scholar]
- Weather Underground. Available online: https://www.wunderground.com (accessed on 9 October 2019).
- ASTM. Standard Test Method for Determining Air Change in a Single Zone by Means of a Tracer Gas Dilution; ASTM E 741; American Society for Testing and Materials: West Conshohocken, PA, USA, 2011. [Google Scholar]
- ASTM. Standard Guide for Using Indoor Carbon Dioxide Concentrations to Evaluate Indoor Air Quality and Ventilation; ASTM D 6245-12; American Society for Testing and Materials: West Conshohocken, PA, USA, 2012. [Google Scholar]
- Matias, L. Development of an Adaptive Model to Define Thermal Comfort Conditions in Portugal. Ph.D. Thesis, IST—Instituto Superior Técnico, Lisbon, Portugal, 2010. (In Portuguese). [Google Scholar]
- ASHRAE. Thermal Environmental Conditions for Human Occupancy; Ansi/Ashrae Standard 55; American Society of Heating, Refrigeration and Air-Conditioning Engineers: Atlanta, GA, USA, 2004. [Google Scholar]
- CEN. Ergonomics of the Thermal Environment—Analytical Determination and Interpretation of Thermal Comfort Using Calculation of the PMV and PPD Indices and Local Thermal Comfort criteria (ISO 7730:2005); EN ISO 7730; European Committee for Standardization: Brussels, Belgium, 2005. [Google Scholar]

| Buildings | Rooms | ||||||
|---|---|---|---|---|---|---|---|
| Year of Construction | Climate Control/Heating System | Ventilation System | Designation | Predominant Orientation | Area [m2] | Usual Maximum Occupancy/No. of Residents | |
| ECC 1 a | 1994 | Intermittent heating with water radiators | NV | Room 1 | NW | 20.58 | 1 |
| Room 2 | SE | 20.58 | 2 | ||||
| Room 3 | NW | 20.58 | 2 | ||||
| Living room | SE and SW | 257.32 | 25 | ||||
| ECC 2 b | 1869 | Intermittent heating with water radiators | NV | Room 1 | E and NE | 24.61 | 3 |
| Room 2 | W | 22.79 | 3 | ||||
| Living room 1 | W | 39.76 | 25 | ||||
| Living room 2 c | W | 39.76 | 25 | ||||
| Buildings | Compartments | Flooring | Walls | Ceiling | Solar Protection | Windows | |
|---|---|---|---|---|---|---|---|
| Interior | Exterior | ||||||
| ECC 1 | Room 1 | Wooden parquet | Plastered | Plastered | Blackout curtains | Blinds | Aluminum without thermal brake; side hung windows; double glazing |
| Room 2 | |||||||
| Room 3 | |||||||
| Living room | Ceramic tile | Vertical blinds with fabric slats | None | Aluminum without thermal brake; sliding windows; double glazing | |||
| ECC 2 | Room 1 | Vinyl | Plastered | Plastered | Blackout curtains + semi-opaque curtains | None | Aluminum without thermal brake; side hung windows; double glazing |
| Room 2 | |||||||
| Living room 1 | |||||||
| Living room 2 | Blackout fabric roller blinds | ||||||
| Building | Compartments | ||||||
|---|---|---|---|---|---|---|---|
| Year of Construction | Climate Control/Heating System | Ventilation System | Designation | Predominant Orientation | Area [m2] | Usual Maximum Occupancy/No. of Residents | |
| ECC 3 | 2002 | Intermittent heating with water radiators; HVAC in living room and dining hall | RR in the living room and dining hall: MV-intermittent extraction | Living room | E | 134.00 | 25 |
| Dining hall | E | 134.00 | 50 | ||||
| RR of the rooms: NV-opening of windows | Triple room | SE | 33.92 | 3 | |||
| Solar Protection | |||||||
|---|---|---|---|---|---|---|---|
| Building | Compartments | Flooring | Walls | Ceiling | Interior | Exterior | Windows |
| ECC 3 | Room | Vinyl and ceramic tile | Ceramic tile | Plasterboard | Slightly transparent curtains | Blinds | Aluminum without thermal brake; sliding windows; double glazing |
| Living room/dining hall | Vinyl | Semi-opaque fabric roller blinds | None | ||||
| Parameters | Protection Threshold in New Buildings | Margin of Tolerance b (MT c) | Protection Threshold b | |||
|---|---|---|---|---|---|---|
| [mg/m3] | [ppmv] | [%] | [mg/m3] | [ppmv] | ||
| Physico-chemical pollutants | TVOC [19] | 0.6 | 0.26 a | 100 | 1.2 | 0.52 a |
| CH2O [19] | 0.1 | 0.08 | ||||
| CO2 [19] | 2250 | 1250 | 30 | 2925 | 1625 | |
| Recommended/regulated level | ||||||
| Hygrothermal comfort | T [20,21,22] | 20–25 °C | ||||
| RH [22,23] | 30–70% | |||||
| Parameters | Instrument | Accuracy | Measurement Range | Duration of Measurement | Maximum Measurement Period a |
|---|---|---|---|---|---|
| T RH CO2 | Telaire 7001 with data logger U12-013 coupled to record data | ±0.35 °C (0 to 50 °C); ±2.5% (10 to 90%); ±50 ppm | −20 to70 °C; 5 to 95%; 0 to 10,000 ppm on the display; 0 to 4000 ppm on the external connection | 1 min | 4 days |
| T RH | Data logger U12-012 | ±0.35 °C (0 to 50 °C); ±2.5% (10 to 90%) | −20 to 70 °C; 5 to 95% | 1 min | 4 days |
| T RH CO2 | Fluke 975 AirMeter | ±0.9 °C (40 to 60 °C); ±0.5 °C (5 to 40 °C); ±1.1°C (−20 to 5 °C); ±2% (10 to 90%); 2.75% + 75 ppm | −20 to 60 °C; 10 to 90%; 0 to 5000 ppm | 1 min | 4 days |
| TVOC | PhoCheck Tiger (PID) | ±5% of the display reading ± one digit | 1 ppb to 20,000 ppm | 30 s | 10 h |
| Building | Compartment | Area [m2] | Volume [m3] | Minimum Number of Measuring Points | Number of Measured Points |
|---|---|---|---|---|---|
| ECC 3 | Living room | 134.00 | 375.2 | 2 | 3 |
| Canteen | 134.00 | 375.2 | 2 | 3 | |
| Triple room | 33.92 | 95.0 | 1 | 1 |
| Parameters | Instruments | Accuracy | Measuring Range | Measuring Interval a | Measuring Period b |
|---|---|---|---|---|---|
| CH2O | Formaldemeter htV-M | ±10% | 0–10 ppm | Punctual a | 3 measurements spaced every 5 min |
| CO2 | TSI Velocicalc 9565-P (986 probe) | ±3% or 50 ppm, whichever is greater | 0–5000 ppm | 15 s | 3 measurements 5 min each |
| TVOC | TSI Velocicalc 9565-P (986 probe; PID) | ±20% (according to the representative’s information) | 0.01–20 ppm, isobutylene | 15 s | 3 measurements 5 min each |
| T RH | Extech RH520 | ±1.0 °C; ±3.0% | –28–60 °C; 10–95% | 1 min | 15 to 30 days |
| CO2 [ppm] | TVOC [ppm] | |||||
|---|---|---|---|---|---|---|
| Compartment | Max | μ ± σ | Maximum of 8 h Means | Max | μ ± σ | Maximum of 8 h Means (n = 480) |
| Room 1 | 1272 | 78 ± 83 | 888 | 0.86 | 0.05 ± 0.06 | 0.05 |
| Room 2 | 1343 | 710 ± 101 | 840 | 2.60 | 0.20 ± 0.25 | 0.24 |
| Room 3 | 1324 | 705 ± 245 | 850 | 0.32 | 0.07 ± 0.06 | 0.08 |
| Living room | 2538 | 1562 ± 335 | 1861 | 0.08 | 0.04 ± 0.02 | 0.04 |
| Tint [°C] | RHint [%] | Text [°C] | ΔT [°C] | |||||
|---|---|---|---|---|---|---|---|---|
| Compartment | μ ± σ | Perc ≤ 20 °C | Perc ≥ 25 °C | μ ± σ | Perc ≤ 30% | Perc ≥ 70% | ||
| Room 1 | 19.6 ± 0.9 | 64 | 0 | 73 ± 1 | 0 | 99 | 9.9 ± 2.6 | 9.7 |
| Room 2 | 19.9 ± 0.8 | 55 | 0 | 70 ± 2 | 0 | 51 | 10.0 | |
| Room 3 | 20.4 ± 0.8 | 31 | 0 | 68 ± 2 | 0 | 21 | 10.5 | |
| Room 4 | 19.5 ± 0.8 | 74 | 0 | 69 ± 3 | 0 | 49 | 9.6 | |
| Room 5 | 19.7 ± 0.7 | 63 | 0 | 69 ± 3 | 0 | 46 | 9.8 | |
| Living room 1 | 24.4 ± 0.3 | 0 | 3 | 52 ± 4 | 0 | 0 | 10.1 ± 2.5 | 14.3 |
| Living room 2 | 23.1 ± 0.8 | 0 | 0 | 59 ± 2 | 0 | 0 | 13.0 | |
| Living room 3 | 22.4 ± 0.5 | 0 | 0 | 57 ± 5 | 0 | 0 | 12.3 | |
| Compartment | ACHav [h−1] a | qRECS [m3/(h-person)] b | Volume [m3] | Maximum Usual Occupancy—Number of Residents | ACHRECS [h−1] c |
|---|---|---|---|---|---|
| Living room 1 | 0.48 | 24 | 117.69 | 25 | 5.10 |
| Living room 2 | 0.39 | 24 | 71.97 | 20 | 6.67 |
| Compartment | CO2 [ppm]Max b | TVOC [ppm]Max b | CH2O [ppm]Max b | |
|---|---|---|---|---|
| ECC 3 | Living room | 889 | 0.25 | 0.07 |
| Dining hall | 694 a | 0.19 | 0.06 | |
| Triple room | 684 a | 0.33 | 0.13 |
| Tint [°C] | RHint [%] | Text [°C] | ΔT [°C] | ||||||
|---|---|---|---|---|---|---|---|---|---|
| Compartment | μ ± σ | Perc ≤ 20 °C | Perc ≥ 25 °C | μ ± σ | Perc ≤ 30% | Perc ≥ 70% | μ ± σ | ||
| ECC 3 | Living room | 23.8 ± 1.2 | 7 | 16 | 44 ± 5 | 0 | 0 | 10.4 ± 4.9 | 13.4 |
| Dining hall | 22.7 ± 1.3 | 2 | 1 | 46 ± 5 | 0 | 0 | 7.4 ± 3.3 | 15.3 | |
| Triple room | 22.0 ± 2.3 | 26 | 11 | 47 ± 7 | 1 | 0 | 7.4 ± 3.3 | 14.6 | |
| CO2 [ppm] | ACHav [h−1] | ACHRECS [h−1] | TVOC [ppm] | CH2O [ppm]Max | ||||
|---|---|---|---|---|---|---|---|---|
| Compartment | μ ± σ | Perc ≥ 1625 | μ ± σ | Perc ≥ 0.52 | ||||
| ECC 3 | Living room | 723 ± 253 | 0.8 | 0.22 | 1.6 | 0.04 ± 0.09 | 6.7 | 0.09 |
| Triple room | 890 ± 335 | 0.0 | 0.81 | 0.5 | 0.17 ± 0.15 | 7.3 | 0.04 | |
© 2019 by the authors. Licensee MDPI, Basel, Switzerland. This article is an open access article distributed under the terms and conditions of the Creative Commons Attribution (CC BY) license (http://creativecommons.org/licenses/by/4.0/).
Share and Cite
Pinto, M.; Lanzinha, J.; Viegas, J.; Infante, C.; Freire, T. Quality of the Indoor Environment in Elderly Care Centers in Two Cities in Central Portugal: Viseu and Covilhã. Int. J. Environ. Res. Public Health 2019, 16, 3801. https://doi.org/10.3390/ijerph16203801
Pinto M, Lanzinha J, Viegas J, Infante C, Freire T. Quality of the Indoor Environment in Elderly Care Centers in Two Cities in Central Portugal: Viseu and Covilhã. International Journal of Environmental Research and Public Health. 2019; 16(20):3801. https://doi.org/10.3390/ijerph16203801
Chicago/Turabian StylePinto, Manuel, João Lanzinha, João Viegas, Catarina Infante, and Tiago Freire. 2019. "Quality of the Indoor Environment in Elderly Care Centers in Two Cities in Central Portugal: Viseu and Covilhã" International Journal of Environmental Research and Public Health 16, no. 20: 3801. https://doi.org/10.3390/ijerph16203801
APA StylePinto, M., Lanzinha, J., Viegas, J., Infante, C., & Freire, T. (2019). Quality of the Indoor Environment in Elderly Care Centers in Two Cities in Central Portugal: Viseu and Covilhã. International Journal of Environmental Research and Public Health, 16(20), 3801. https://doi.org/10.3390/ijerph16203801